full cycle profitable growth - s3. · pdf filenon-gaap measures: this presentation may contain...
TRANSCRIPT
TSX: BXE NYSE: BXE
Full Cycle Profitable Growth ANALYST UPDATE PRESENTATION SEPTEMBER 14, 2016
Advisories
FORWARD LOOKING STATEMENTS: In the interest of providing Bellatrix’s shareholders and potential investors with information regarding Bellatrix, including management’s assessment of Bellatrix’s future plans and operations, certain statements made by the presenter and contained in these presentation materials (collectively, this “presentation”) are forward looking statements or information within the meaning of applicable securities legislation, collectively referred to herein as “forward looking statements”. The forward-looking statements contained in this presentation speak only as of the date of this presentation and are expressly qualified by this cautionary statement. Forward looking statements in this presentation include, but are not limited to: management's assessment of future plans, operations and strategy, including the Company’s Spirit River play as a low cost natural gas supply source; the Company’s results delivering superior economic returns and industry leading capital efficiencies; ownership and control of strategic infrastructure assets and the sufficiency of the Company’s firm transportation capacity and ability to grow production to 60,000 boe/d; the Company’s cost profile and capital efficiencies supported by material infrastructure assets driving full cycle sustainable profitability; the Company’s ability to create value and upside to commodity price recovery and ability to manage debt and liquidity and further deleverage the Company’s balance sheet; management’s intentions to establish a new long-term revolving credit facility prior to the next scheduled review; the Company’s second half 2016 capital budget, production and operating cost guidance; management’s expectations regarding repayment of remaining balance of the term facility by November 11, 2016; management’s expectations that low cost Spirit River production volumes will continue to comprise a growing portion of total corporate production, management’s expectations that processing facilities and firm transportation capacity will help facilitate growth; management’s expectations regarding drill, complete, equip and tie-in costs for its Spirit River wells; future cost reductions associated with the Alder Flats Plant; management’s expectations regarding the Mannville/Spirit River and Cardium areas; management’s estimates of payouts, the internal rate of return (“IRR”), capital efficiencies, finding and development (“F&D”) costs and expected ultimate recovery of its wells; management’s expectations that the Spirit River is competitive with top tier Marcellus operator F&D costs and efficiencies; the Company’s strategic land position; management’s expectations regarding full cycle F&D costs, cash costs, operating costs, transportation costs, general and administrative expenses and interest and financing costs; management’s expectations regarding its ability to be an industry leader in development of the Spirit River play; management’s expectation that owned and operated infrastructure provides the Company with a strategic advantage and results in improved reliability of operations and sales, reduces operating costs, reduces royalty rates, and provides barriers to competition; management’s expectations regarding utilization of the Alder Flats Plant and the expectation that it will continue to operate at current efficiencies; drilling plans and the timing thereof; commodity price risk management strategies; the Company’s liquidity and compliance with the senior debt / EBITDA financial covenant; the timing of the Company’s next semi-annual borrowing base redetermination; the Company’s unfettered growth potential with its firm processing capacity; the economics of the Company’s resources are highly competitive with those of the Marcellus; management’s expectations that the Company has a large inventory of low risk development opportunities; management’s expectations that well performance will continue to rank among the best in the Spirit River and that the Company will remain a low cost operator and finder; management’s expectation that the Company possesses material leverage to a commodity price recovery; management’s expectation that the Company has unfettered growth potential with frim processing capacity; that the Company’s wells consistently rank among the best in the basin; estimates of commodity prices and exchange rates; drilling inventory and costs and time to develop; management’s expectation that the Company’s differentiated JV strategy provides significant benefits; and management’s expectation that the Cardium will remain a key long-term focus of the Company. Certain statements may constitute financial outlooks under applicable securities laws and were approved by management on September 13, 2016. Forward-looking statements necessarily involve risks, including, without limitation, risks associated with oil and gas exploration, development, exploitation, production, marketing and transportation, loss of markets, volatility of commodity prices, currency fluctuations, imprecision of reserve estimates, environmental risks, competition from other producers, inability to retain drilling rigs and other services, incorrect assessment of the value of acquisitions, failure to realize the anticipated benefits of acquisitions, actual results from wells to be drilled may not be similar to the results from previous wells drilled or the expected type curves, and delays resulting from or inability to obtain required regulatory approvals and ability to access sufficient capital from internal and external sources. Events or circumstances may cause actual results to differ materially from those predicted, as a result of the risk factors set out and other known and unknown risks, uncertainties, and other factors, many of which are beyond the control of Bellatrix. In addition, forward-looking statements or information are based on a number of factors and assumptions which have been used to develop such statements and information but which may prove to be incorrect and which have been used to develop such statements and information in order to provide shareholders with a more complete perspective on Bellatrix's future operations. Such information may prove to be incorrect and readers are cautioned that the information may not be appropriate for other purposes. Although Bellatrix believes that the expectations reflected in such forward-looking statements or information are reasonable, undue reliance should not be placed on forward looking statements because Bellatrix can give no assurance that such expectations will prove to be correct. In addition to other factors and assumptions which may be identified herein, assumptions have been made regarding, among other things: the impact of increasing competition; the general stability of the economic and political environment in which Bellatrix operates; the timely receipt of any required regulatory approvals; the ability of Bellatrix to obtain qualified staff, equipment and services in a timely and cost efficient manner; drilling results; the ability of the operator of the projects which Bellatrix has an interest in to operate the field in a safe, efficient and effective manner; the ability of Bellatrix to obtain financing on acceptable terms; field production rates and decline rates; the ability to replace and expand oil and natural gas reserves through acquisition, development of exploration; the timing and costs of pipeline, storage and facility construction and expansion and the ability of Bellatrix to secure adequate product transportation; future commodity prices; currency, exchange and interest rates; the regulatory framework regarding royalties, taxes and environmental matters in the jurisdictions in which Bellatrix operates; and the ability of Bellatrix to successfully market its oil and natural gas products. Readers are cautioned that the foregoing list is not exhaustive of all factors and assumptions which have been used. As a consequence, actual results may differ materially from those anticipated in the forward-looking statements. Additional information on these and other factors that could affect Bellatrix's operations and financial results are included in reports on file with Canadian securities regulatory authorities and the U.S. Securities Exchange Commission ("SEC") and may be accessed through the SEDAR website (www.sedar.com), through the SEC website (www.sec.gov), and at Bellatrix's website (www.bellatrixexploration.com). Furthermore, the forward-looking statements contained herein are made as at the date hereof and Bellatrix does not undertake any obligation to update publicly or to revise any of the included forward-looking statements, whether as a result of new information, future events or otherwise, except as may be required by applicable securities laws. NON-GAAP MEASURES: This presentation may contain certain non-GAAP measures, including the term “cash flow” which is a non-GAAP measure defined as cash from operating activities excluding net change in other assets and liabilities, net change in non-cash working capital and cash tax on sale of assets. This and any other non-GAAP measures used in this presentation are intended to provide shareholders and potential investors with additional information regarding Bellatrix’s liquidity and its ability to generate funds to finance its operations. FD&A COSTS: This presentation includes calculations of FD&A costs for the year ended December 31, 2015. The calculations of FD&A in this presentation include the reserves additions associated with acquisitions and the costs of acquisitions as Bellatrix believes that including the effect of acquisitions provides useful information to investors. BOE PRESENTATION: The term barrels of oil equivalent (“boe”) may be misleading, particularly if used in isolation. A boe conversion ratio of six thousand cubic feet of natural gas to one barrel of oil equivalent (6 mcf/ 1 bbl) is based on an energy equivalency conversion method primarily applicable at the burner tip and does not represent a value equivalency at the wellhead. Given that the value ratio based on the current price of crude oil as compared to natural gas is significantly different from the energy equivalency of 6:1, utilizing a conversion on a 6:1 basis may be misleading as an indication of value. All boe conversions in this presentation are derived from converting gas to oil in the ratio of six thousand cubic feet of gas to one barrel of oil. INITIAL PRODUCTION RATES: Initial production rates disclosed herein may not be indicative of long-term performance or ultimate recovery. Such rates are not determinative of the future production rates of such wells and do not reflect how the production from such wells will decline thereafter. While encouraging, readers are cautioned not to place reliance on such rates in calculating the aggregate production for Bellatrix. A pressure transient analysis or well test interpretation has not been carried out in respect of all wells. Accordingly, Bellatrix cautions that the test results should be considered to be preliminary. ESTIMATED ULTIMATE RECOVERY (EUR): In this presentation, estimated ultimate recovery represents the estimated ultimate recovery associated with the type curves presented which are based on the assumptions used by Sproule Associates Limited to estimate Bellatrix's proved plus probable reserves per well as evaluated effective December 31, 2015 based on forecast prices and costs. There is no certainty that such Bellatrix will ultimately recover such volumes from the wells it drills. ANALOGOUS INFORMATION: Certain information in this presentation may constitute "analogous information" as defined in National Instrument 51-101 – Standards of Disclosure for Oil and Gas Activities (“NI 51-101”), including, but not limited to, the reservoir data, production rates of industry wells, cumulative production information, and economics information relating to the areas in which Bellatrix has an interest. Such information has been obtained from government sources, regulatory agencies or other industry participants. Management of Bellatrix believes the information is relevant as it helps to define the reservoir characteristics and the reserves and production potential in which Bellatrix holds an interest. Such information has not been prepared in accordance with NI 51-101. Bellatrix is also unable to confirm that the analogous information was prepared by a qualified reserves evaluator or auditor. Such information is not an estimate of the resources attributable to lands held or to be held by Bellatrix and there is no certainty that the reservoir data, resource estimates, production and decline rates and economics information for the lands held by Bellatrix will be similar to the information presented herein. The reader is cautioned that the data relied upon by Bellatrix may be in error and/or may prove not be analogous to the lands be held by Bellatrix. CURRENCY: All dollar amounts in this presentation are Canadian dollars unless otherwise identified. DRILLING LOCATIONS: This presentation discloses drilling locations in three categories: (i) proved locations; (ii) probable locations; and (iii) unbooked locations. Proved locations and probable locations are sometimes collectively referred to as “booked locations”, are derived from Bellatrix’s most recent independent reserves evaluation and account for drilling locations that have associated proved + probable reserves or probable-only reserves, as applicable. Unbooked locations as disclosed herein have been identified by management as an estimation of the Company's multi-year drilling activities using information including evaluation of applicable geologic, seismic, engineering, production, pricing assumptions and reserves information. There is no certainty that Bellatrix will drill all unbooked drilling locations and if drilled there is no certainty that such locations will result in additional oil and gas reserves, resources or production. The drilling locations on which Bellatrix actually drill wells will ultimately depend upon the availability of capital, regulatory approvals, seasonal restrictions, oil and natural gas prices, costs, actual drilling results, additional reservoir information that is obtained and other factors. While the majority of Bellatrix's unbooked locations are extensions or infills of the drilling patterns already recognized by the Company's independent qualified reserves evaluator, other unbooked drilling locations are farther away from existing wells where management may have less information about the characteristics of the reservoir and therefore there may be more uncertainty whether wells will be drilled in such locations and if drilled there may be more uncertainty that such wells will result in additional oil and gas reserves, resources or production. RESERVES INFORMATION: Unless indicated otherwise, reserve estimates and related future net revenue and other reserves information is derived from Bellatrix’s independent reserve report prepared by Sproule Associates Limited as at December 31, 2015 using forecast prices and costs. Land acreage information is as available at December 31, 2015. TYPE CURVE AND CAPITAL EFFICIENCY: In this presentation information relating to the type curve, half cycle economics and capital efficiency for Bellatrix's Spirit River wells have been presented. The type curve set forth herein is based on all Bellatrix operated, Notikewin and Falher B wells drilled between October 2012 and September 2015, and represents the mean (P50) performance curve. Half cycle economics are based on Bellatrix's current expectations of drill, complete, equip and tie-in costs per well (and excluding land, seismic and related costs). Capital efficiency is a measure of expected capital expenditures per well based on half cycle economics divided by average first year production results (IP365) based on the type curve presented. The type curve and capital efficiency numbers have been presented to provide readers with information on the assumptions used for management's budgeting process and future planning. The half cycle economics and capital efficiencies may not be achieved on future wells as a result of a number of factors including the risks identified above under "Forward Looking Statements" and as such are not reliable indicators of future performance. In addition, there is no certainty that future wells will generate results to match historic type curves presented herein. Half cycle economics and capital efficiencies are not terms that have standardized meanings and therefore such calculations may not be comparable with the calculation of similar measures for other entities. FINANCIAL INFORMATION: Unless otherwise stated, financial information is based upon Bellatrix’s 2015 audited consolidated financial statements for the years ended December 31, 2015 and 2014.
2
Agenda
3
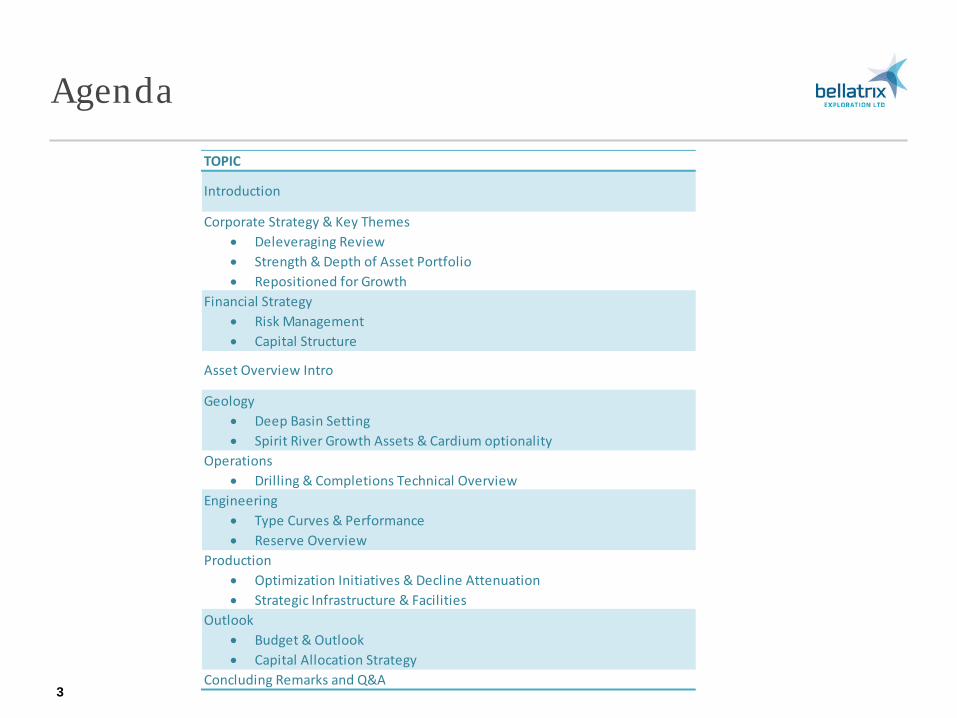
TOPIC
Corporate Strategy & Key Themes• Deleveraging Review• Strength & Depth of Asset Portfolio• Repositioned for Growth
Financial Strategy• Risk Management• Capital Structure
Geology• Deep Basin Setting• Spirit River Growth Assets & Cardium optionality
Operations• Drilling & Completions Technical Overview
Engineering• Type Curves & Performance• Reserve Overview
Production• Optimization Initiatives & Decline Attenuation• Strategic Infrastructure & Facilities
Outlook• Budget & Outlook• Capital Allocation Strategy
Concluding Remarks and Q&A
Introduction
Asset Overview Intro
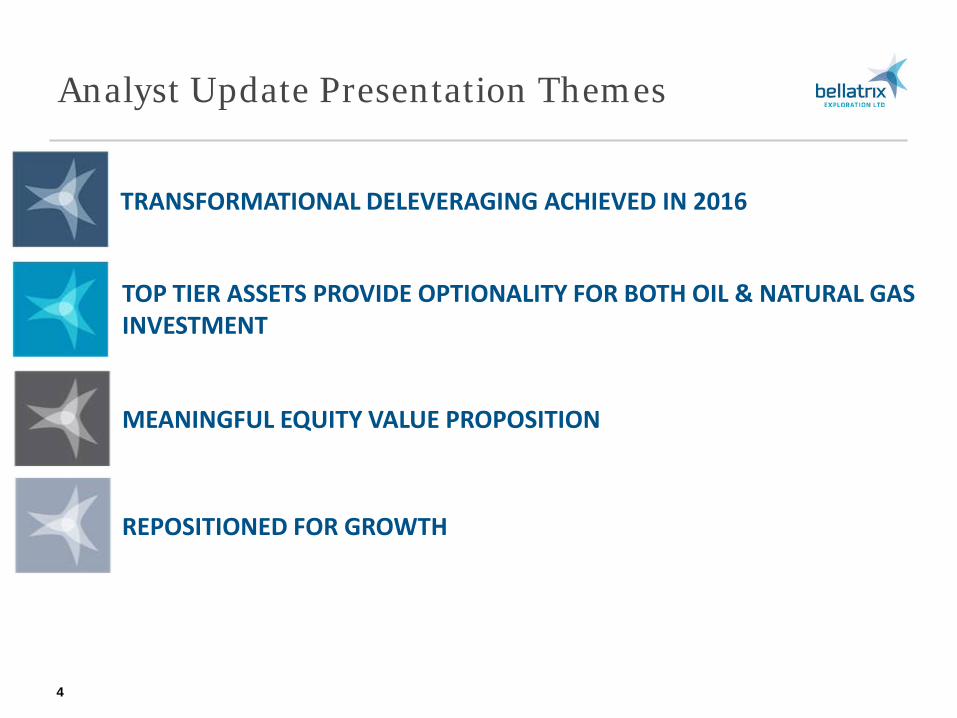
Analyst Update Presentation Themes
4 Long term shareholder value creation
TRANSFORMATIONAL DELEVERAGING ACHIEVED IN 2016
REPOSITIONED FOR GROWTH
TOP TIER ASSETS PROVIDE OPTIONALITY FOR BOTH OIL & NATURAL GAS INVESTMENT
MEANINGFUL EQUITY VALUE PROPOSITION
Experienced & Committed Management Team
5
Mark StephenVP Operations
Steve TothVP Investor Relations
Garrett UlmerVP Engineering
Charles KrausVP General CounselCorporate Secretary
David LaingVP Production
Russell OicleVP Exploration
Tim BlairVP Land
Chris CurryVP Controller
Leanne Gress-BlueVP Finance
Ray SmithPresident & CEO
Ed BrownExecutive VP Finance
& CFO
Brent EshlemanExecutive VP & COO
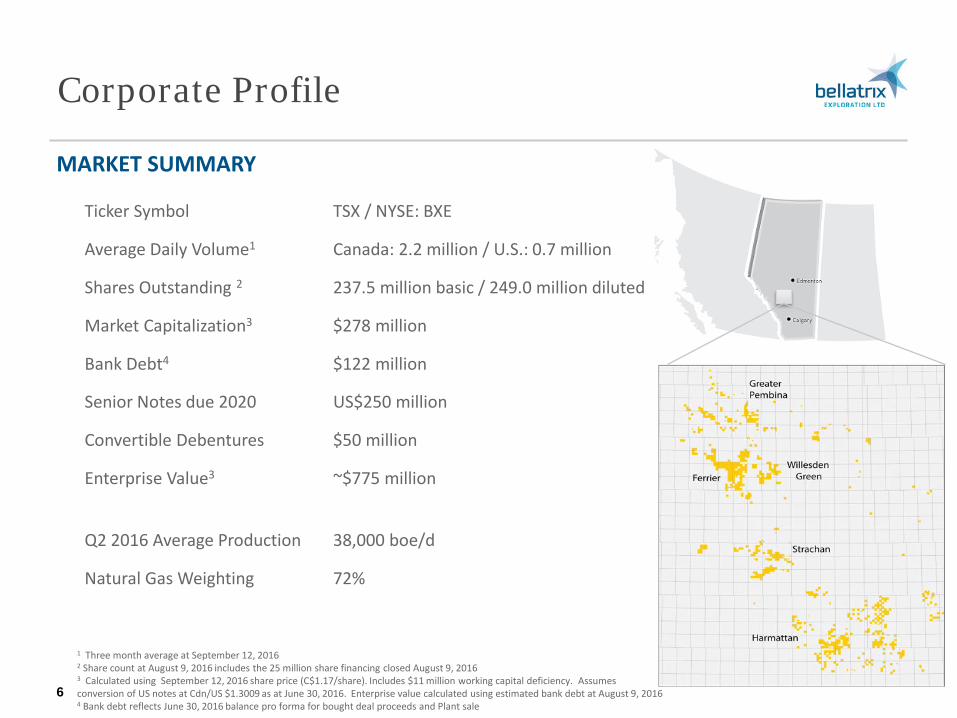
Corporate Profile
MARKET SUMMARY
Ticker Symbol TSX / NYSE: BXE
Average Daily Volume1 Canada: 2.2 million / U.S.: 0.7 million
Shares Outstanding 2 237.5 million basic / 249.0 million diluted
Market Capitalization3 $278 million
Bank Debt4 $122 million
Senior Notes due 2020 US$250 million
Convertible Debentures $50 million
Enterprise Value3 ~$775 million
Q2 2016 Average Production 38,000 boe/d
Natural Gas Weighting 72%
6
1 Three month average at September 12, 2016 2 Share count at August 9, 2016 includes the 25 million share financing closed August 9, 2016 3 Calculated using September 12, 2016 share price (C$1.17/share). Includes $11 million working capital deficiency. Assumes conversion of US notes at Cdn/US $1.3009 as at June 30, 2016. Enterprise value calculated using estimated bank debt at August 9, 2016 4 Bank debt reflects June 30, 2016 balance pro forma for bought deal proceeds and Plant sale
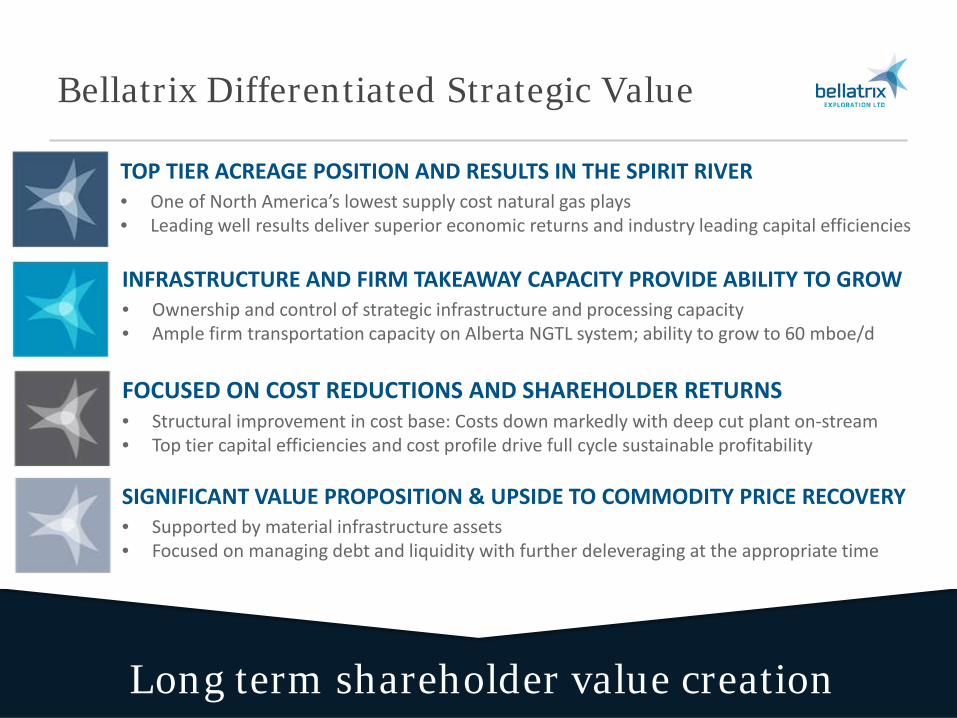
Bellatrix Differentiated Strategic Value
7 Long term shareholder value creation
TOP TIER ACREAGE POSITION AND RESULTS IN THE SPIRIT RIVER • One of North America’s lowest supply cost natural gas plays • Leading well results deliver superior economic returns and industry leading capital efficiencies
SIGNIFICANT VALUE PROPOSITION & UPSIDE TO COMMODITY PRICE RECOVERY • Supported by material infrastructure assets • Focused on managing debt and liquidity with further deleveraging at the appropriate time
INFRASTRUCTURE AND FIRM TAKEAWAY CAPACITY PROVIDE ABILITY TO GROW • Ownership and control of strategic infrastructure and processing capacity • Ample firm transportation capacity on Alberta NGTL system; ability to grow to 60 mboe/d
FOCUSED ON COST REDUCTIONS AND SHAREHOLDER RETURNS • Structural improvement in cost base: Costs down markedly with deep cut plant on-stream • Top tier capital efficiencies and cost profile drive full cycle sustainable profitability
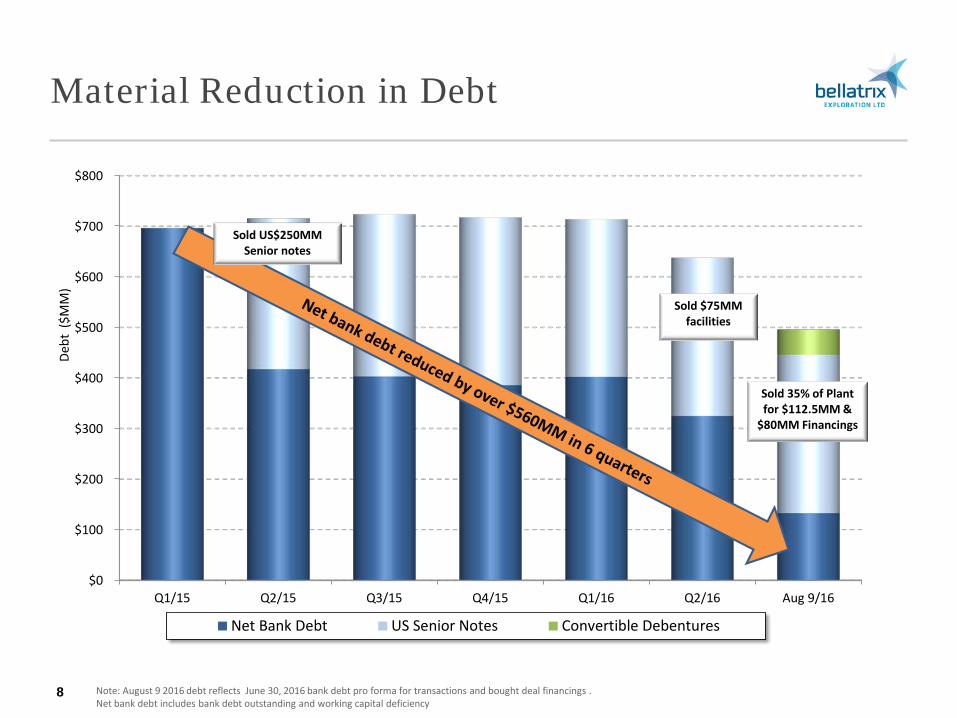
Material Reduction in Debt
8 Note: August 9 2016 debt reflects June 30, 2016 bank debt pro forma for transactions and bought deal financings . Net bank debt includes bank debt outstanding and working capital deficiency
$0
$100
$200
$300
$400
$500
$600
$700
$800
Q1/15 Q2/15 Q3/15 Q4/15 Q1/16 Q2/16 Aug 9/16
Debt
($M
M)
Net Bank Debt US Senior Notes Convertible Debentures
Sold $75MM facilities
Sold 35% of Plant for $112.5MM &
$80MM Financings
Sold US$250MM Senior notes
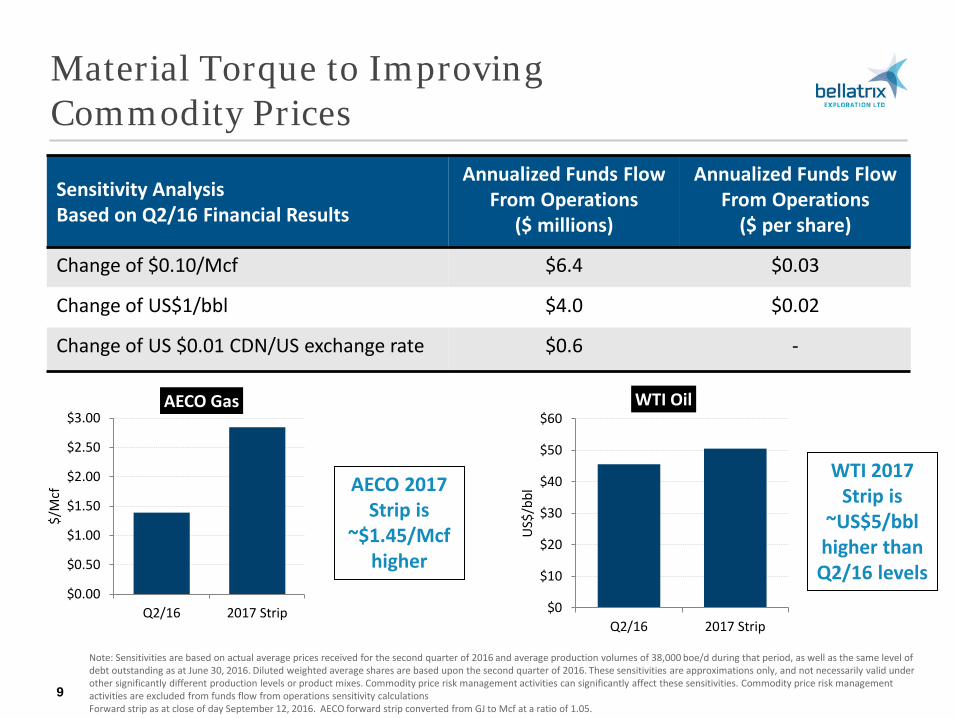
Material Torque to Improving Commodity Prices
9
Note: Sensitivities are based on actual average prices received for the second quarter of 2016 and average production volumes of 38,000 boe/d during that period, as well as the same level of debt outstanding as at June 30, 2016. Diluted weighted average shares are based upon the second quarter of 2016. These sensitivities are approximations only, and not necessarily valid under other significantly different production levels or product mixes. Commodity price risk management activities can significantly affect these sensitivities. Commodity price risk management activities are excluded from funds flow from operations sensitivity calculations Forward strip as at close of day September 12, 2016. AECO forward strip converted from GJ to Mcf at a ratio of 1.05.
Sensitivity Analysis Based on Q2/16 Financial Results
Annualized Funds Flow From Operations
($ millions)
Annualized Funds Flow From Operations
($ per share)
Change of $0.10/Mcf $6.4 $0.03
Change of US$1/bbl $4.0 $0.02
Change of US $0.01 CDN/US exchange rate $0.6 -
WTI 2017 Strip is
~US$5/bbl higher than Q2/16 levels
AECO 2017 Strip is
~$1.45/Mcf higher
$0.00
$0.50
$1.00
$1.50
$2.00
$2.50
$3.00
Q2/16 2017 Strip
$/M
cf
AECO Gas
$0
$10
$20
$30
$40
$50
$60
Q2/16 2017 Strip
US$
/bbl
WTI Oil

2016 Second Half Capital Plan
Capital spending includes exploration and development capital projects and corporate assets, and excludes property acquisitions and dispositions. Natural gas forward strip priced as at August 8, 2016. 10
SECOND HALF 2016 GUIDANCE BALANCES FINANCIAL FLEXIBILITY & MAXIMIZED RETURNS
H2 2016 BUDGET UP TO $40MM CAPITAL ALLOCATION MAXIMIZE RETURNS
Natural gas forward curve contango • December AECO is >20% higher
than September pricing • Maximize Internal rate of return
(IRR) by deferring activity and timing of favorably time on-stream delivery of flush volumes
• Favorably positioned to capitalize on stronger 2017 pricing
Capital by Area
Greater Ferrier / Willesden Green
Drilling Formation
Spirit River
100%
100%
H2 2016 cash flow capital budget of up to $40 million • Modest facility and
infrastructure capital • Balances focused investment
and financial flexibility
Preserving value and preparing to play offense • H2 2016 average production
guidance of ~34,500 boe/d (73% natural gas weighted)
• Back end weighted growth with December 2016 forecast average production guidance of ~36,500 boe/d
$2.00
$2.25
$2.50
$2.75
$3.00
Sep
16
Oct
16
Nov
16
Dec
16
Jan
17
Feb
17
Mar
17
AECO
(C$/
GJ)
A few months for a +25% price improvement
Financial Summary
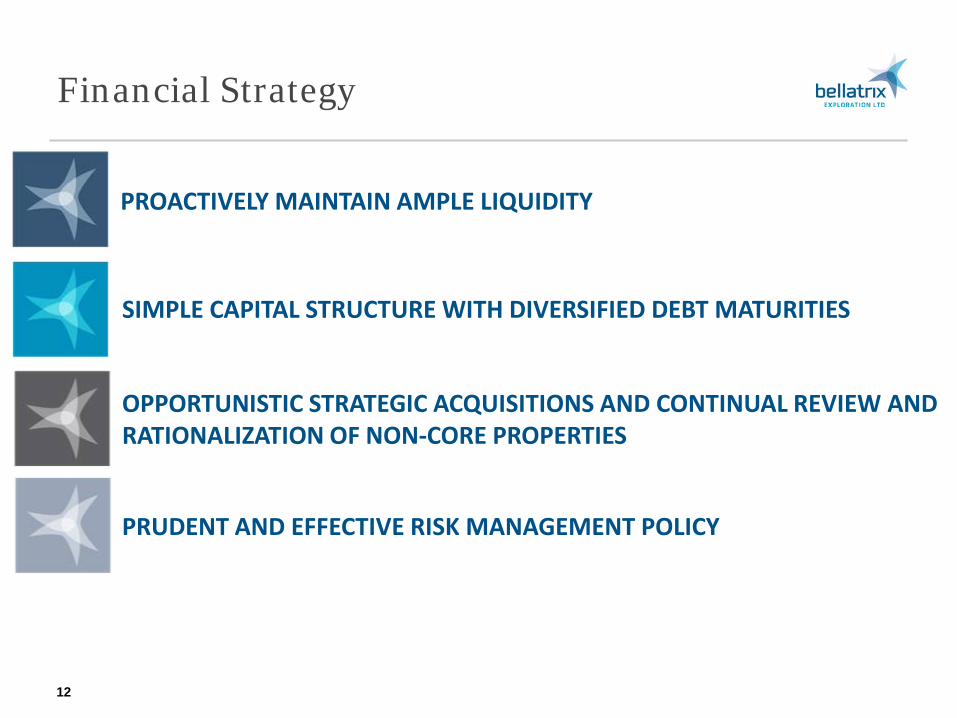
Financial Strategy
12 Long term shareholder value creation
PROACTIVELY MAINTAIN AMPLE LIQUIDITY
PRUDENT AND EFFECTIVE RISK MANAGEMENT POLICY
SIMPLE CAPITAL STRUCTURE WITH DIVERSIFIED DEBT MATURITIES
OPPORTUNISTIC STRATEGIC ACQUISITIONS AND CONTINUAL REVIEW AND RATIONALIZATION OF NON-CORE PROPERTIES
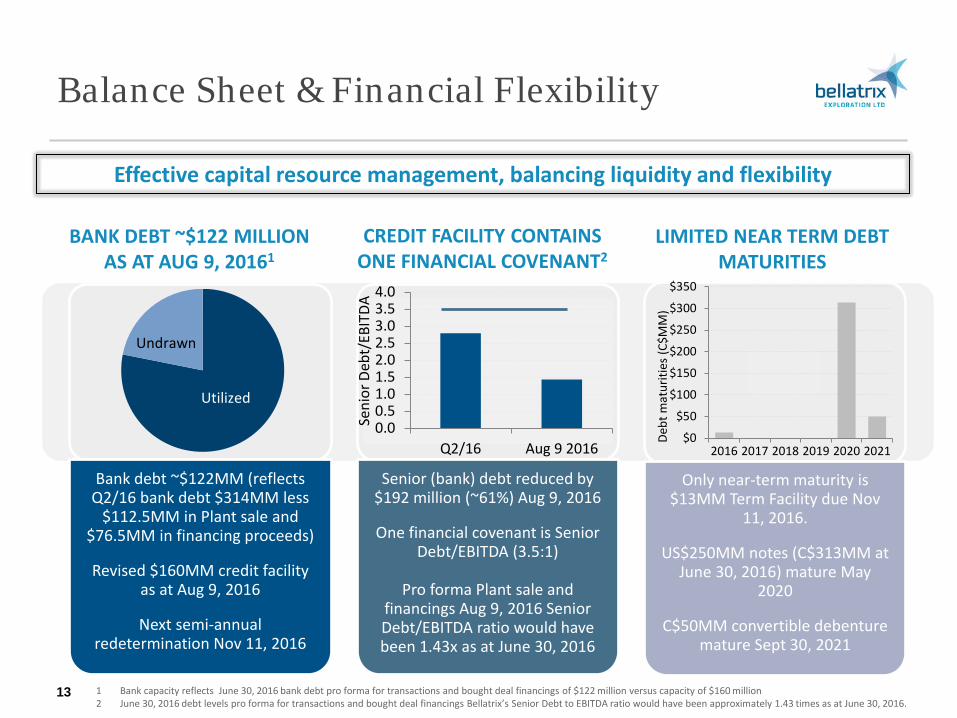
Balance Sheet & Financial Flexibility
13
BANK DEBT ~$122 MILLION AS AT AUG 9, 20161
CREDIT FACILITY CONTAINS ONE FINANCIAL COVENANT2
LIMITED NEAR TERM DEBT MATURITIES
Bank debt ~$122MM (reflects Q2/16 bank debt $314MM less
$112.5MM in Plant sale and $76.5MM in financing proceeds)
Revised $160MM credit facility as at Aug 9, 2016
Next semi-annual redetermination Nov 11, 2016
Senior (bank) debt reduced by $192 million (~61%) Aug 9, 2016
One financial covenant is Senior Debt/EBITDA (3.5:1)
Pro forma Plant sale and
financings Aug 9, 2016 Senior Debt/EBITDA ratio would have been 1.43x as at June 30, 2016
Only near-term maturity is $13MM Term Facility due Nov
11, 2016.
US$250MM notes (C$313MM at June 30, 2016) mature May
2020
C$50MM convertible debenture mature Sept 30, 2021
Effective capital resource management, balancing liquidity and flexibility
1 Bank capacity reflects June 30, 2016 bank debt pro forma for transactions and bought deal financings of $122 million versus capacity of $160 million 2 June 30, 2016 debt levels pro forma for transactions and bought deal financings Bellatrix’s Senior Debt to EBITDA ratio would have been approximately 1.43 times as at June 30, 2016.
Utilized
Undrawn
$0
$50
$100
$150
$200
$250
$300
$350
2016 2017 2018 2019 2020 2021
Debt
mat
uriti
es (C
$MM
)
0.00.51.01.52.02.53.03.54.0
Q2/16 Aug 9 2016
Seni
or D
ebt/
EBIT
DA
Bank Debt Summary
14
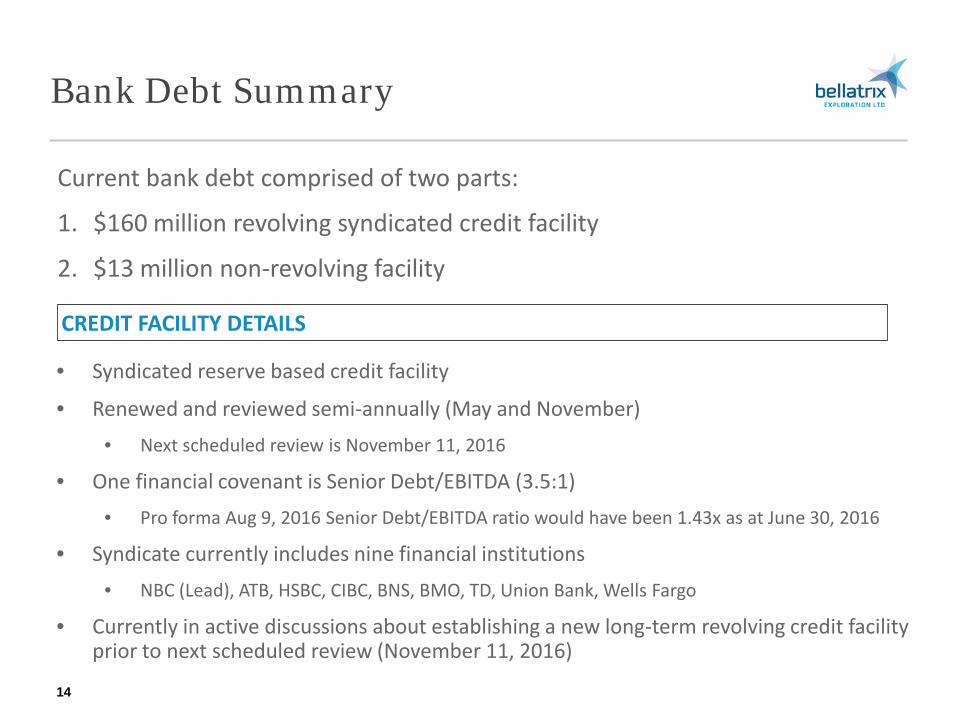
Current bank debt comprised of two parts:
1. $160 million revolving syndicated credit facility
2. $13 million non-revolving facility
• Syndicated reserve based credit facility
• Renewed and reviewed semi-annually (May and November) • Next scheduled review is November 11, 2016
• One financial covenant is Senior Debt/EBITDA (3.5:1) • Pro forma Aug 9, 2016 Senior Debt/EBITDA ratio would have been 1.43x as at June 30, 2016
• Syndicate currently includes nine financial institutions • NBC (Lead), ATB, HSBC, CIBC, BNS, BMO, TD, Union Bank, Wells Fargo
• Currently in active discussions about establishing a new long-term revolving credit facility prior to next scheduled review (November 11, 2016)
CREDIT FACILITY DETAILS
Senior Unsecured Notes Summary
15
US$250 million of 8.50% senior unsecured notes maturing May 15, 2020
• US$ notes translated to Cdn$ quarterly. Q2/16 US notes were C$313.3 million
• Closed the private offering of US$250 million of senior unsecured notes in May 2015
• Five year notes maturing May 15, 2020
• Interest is payable on the Senior Notes semi-annually in May & November
• Notes remain tightly held, with infrequent trading • Notes initially purchased by large U.S. debt and bond funds
• Last trade1 on August 30 at 87.750
• Redeemable at Bellatrix's option, in whole or in part, commencing on May 15, 2017 • Prior to May 15, 2017, some or all of the Senior Notes may be redeemed at a price equal to 100%
of the principal amount plus a make-whole premium
• Additional redemption prices (% of principal amount): May 15, 2017 to May 14, 2018 at 104.250%, May 15, 2018 to May 14, 2019 at 102.125%, May 15, 2019 and thereafter at 100.000%.
SENIOR NOTE DETAILS
1 Last trade source Bloomberg (Referenced through the Trade Reporting and Compliance Engine or “TRACE”)
Convertible Debenture Summary
16
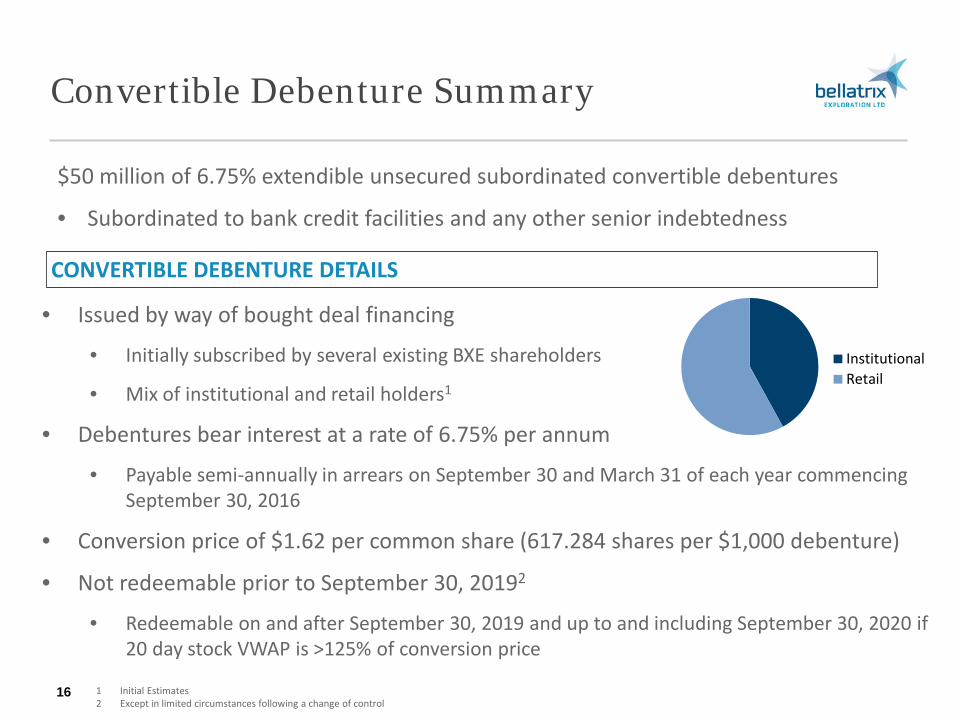
$50 million of 6.75% extendible unsecured subordinated convertible debentures
• Subordinated to bank credit facilities and any other senior indebtedness
• Issued by way of bought deal financing
• Initially subscribed by several existing BXE shareholders
• Mix of institutional and retail holders1
• Debentures bear interest at a rate of 6.75% per annum
• Payable semi-annually in arrears on September 30 and March 31 of each year commencing September 30, 2016
• Conversion price of $1.62 per common share (617.284 shares per $1,000 debenture)
• Not redeemable prior to September 30, 20192
• Redeemable on and after September 30, 2019 and up to and including September 30, 2020 if 20 day stock VWAP is >125% of conversion price
CONVERTIBLE DEBENTURE DETAILS
1 Initial Estimates 2 Except in limited circumstances following a change of control
InstitutionalRetail
Shareholders
17
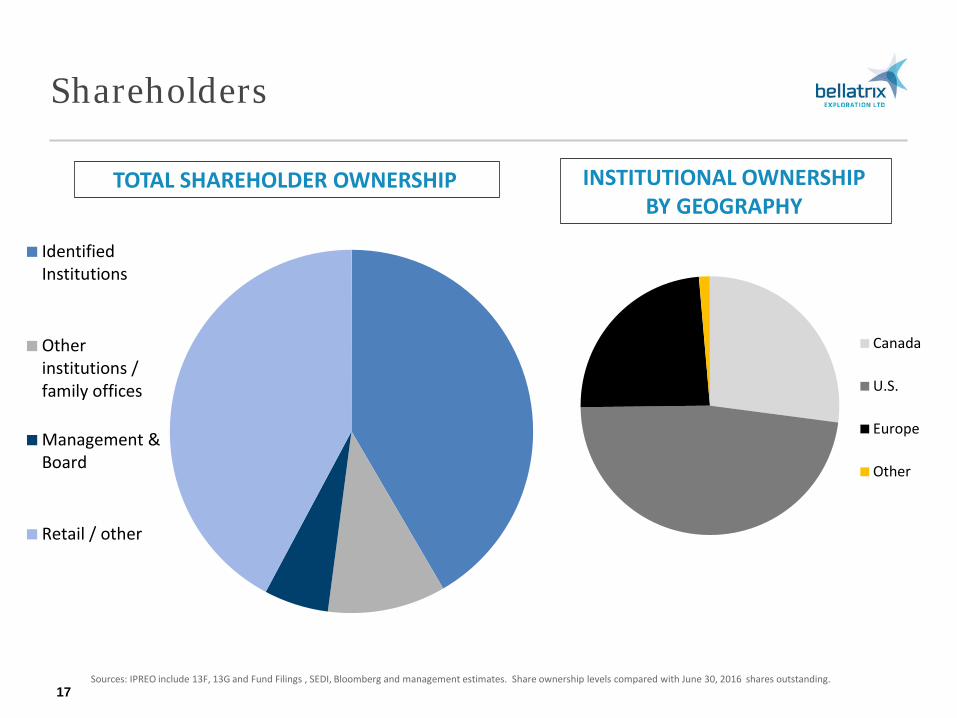
IdentifiedInstitutions
Otherinstitutions /family offices
Management &Board
Retail / other
TOTAL SHAREHOLDER OWNERSHIP
Canada
U.S.
Europe
Other
INSTITUTIONAL OWNERSHIP BY GEOGRAPHY
Sources: IPREO include 13F, 13G and Fund Filings , SEDI, Bloomberg and management estimates. Share ownership levels compared with June 30, 2016 shares outstanding.
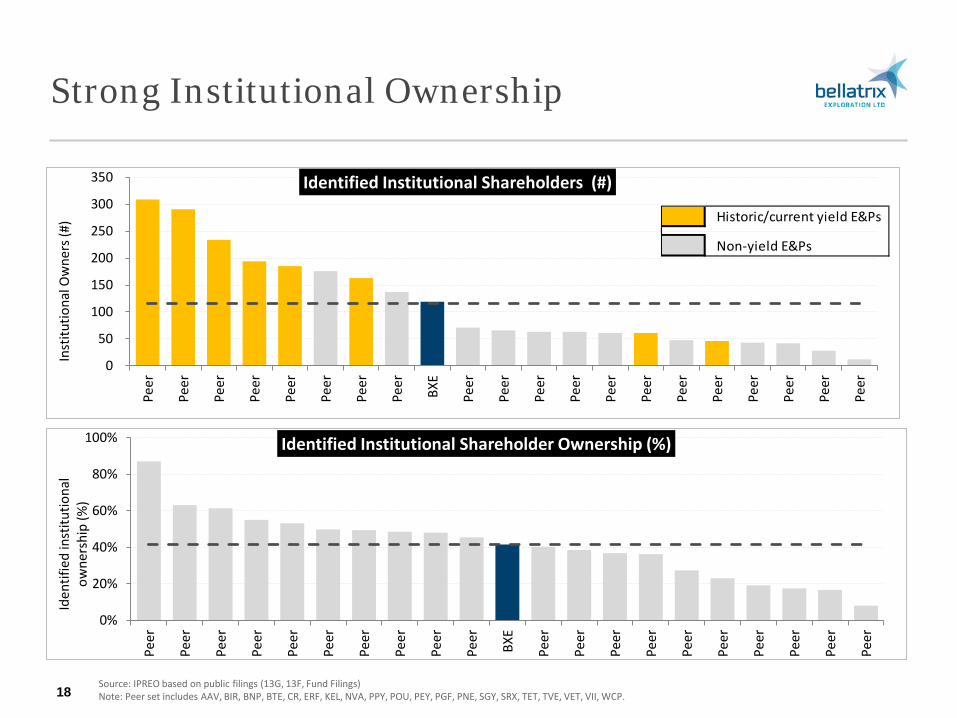
Strong Institutional Ownership
18
0
50
100
150
200
250
300
350
Peer
Peer
Peer
Peer
Peer
Peer
Peer
Peer
BXE
Peer
Peer
Peer
Peer
Peer
Peer
Peer
Peer
Peer
Peer
Peer
Peer
Inst
itutio
nal O
wne
rs (#
)
Identified Institutional Shareholders (#)
Historic/current yield E&Ps
Non-yield E&Ps
Source: IPREO based on public filings (13G, 13F, Fund Filings) Note: Peer set includes AAV, BIR, BNP, BTE, CR, ERF, KEL, NVA, PPY, POU, PEY, PGF, PNE, SGY, SRX, TET, TVE, VET, VII, WCP.
0%
20%
40%
60%
80%
100%
Peer
Peer
Peer
Peer
Peer
Peer
Peer
Peer
Peer
Peer
BXE
Peer
Peer
Peer
Peer
Peer
Peer
Peer
Peer
Peer
Peer
Iden
tifie
d in
stitu
tiona
l ow
ners
hip
(%)
Identified Institutional Shareholder Ownership (%)
Risk Management & Marketing Strategy
19
FINANCIAL RISK MANAGEMENT STRATEGY
A pillar of Bellatrix's strategic planning is a board approved active risk management policy providing reduced commodity price volatility and greater predictability of future revenue and cash flow
Hedging limits form part of the credit facility agreement based on prior quarter average production volumes on a rolling three year basis and are restricted to:
• 70% for forward first year, 60% for second year and 50% for third year for both oil and gas production
PHYSICAL MARKETING STRATEGY
Bellatrix manages its physical marketing exposure through a variety of methods including:
• Crude oil and NGL products are primarily sold at the plant gate which reduces physical and financial exposure to Bellatrix to reach and supply end use markets
• Natural gas volumes are transported on the Nova system to the AECO/NIT market point
• Products sold through ten different physical marketers reduces counterparty risk exposure
• Bellatrix enters into long term agreements for transportation both along the transmission system and through area processing facilities
• Long term fractionation agreements cover 100% of current and forecast NGL volumes
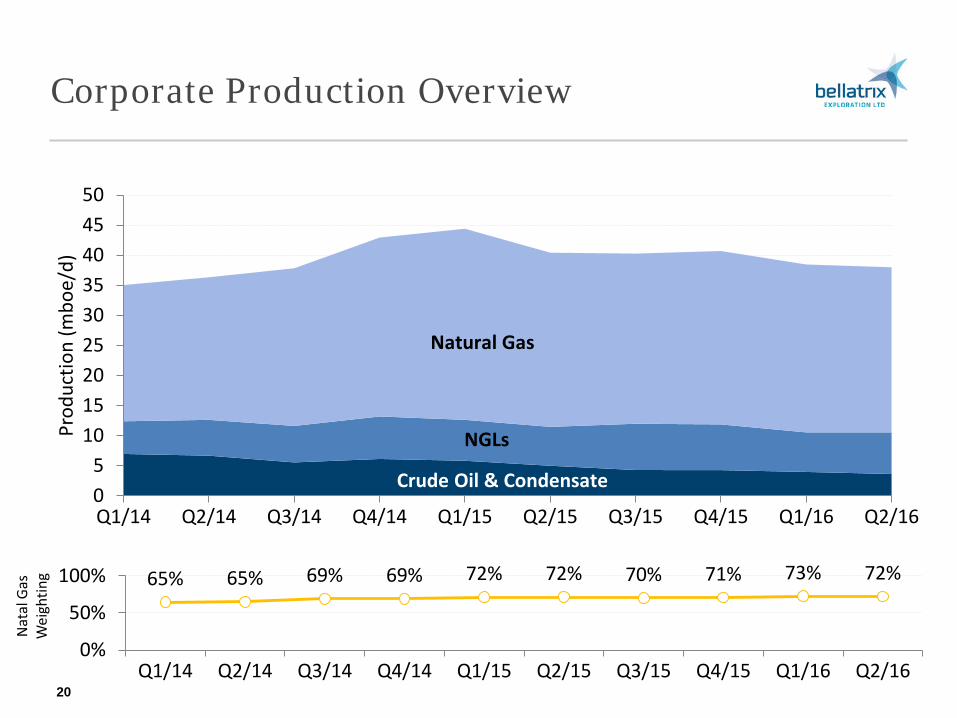
Corporate Production Overview
20
05
101520253035404550
Q1/14 Q2/14 Q3/14 Q4/14 Q1/15 Q2/15 Q3/15 Q4/15 Q1/16 Q2/16
Prod
uctio
n (m
boe/
d)
Crude Oil & Condensate
NGLs
Natural Gas
65% 65% 69% 69% 72% 72% 70% 71% 73% 72%
0%
50%
100%
Q1/14 Q2/14 Q3/14 Q4/14 Q1/15 Q2/15 Q3/15 Q4/15 Q1/16 Q2/16
Nat
al G
as
Wei
ghtin
g
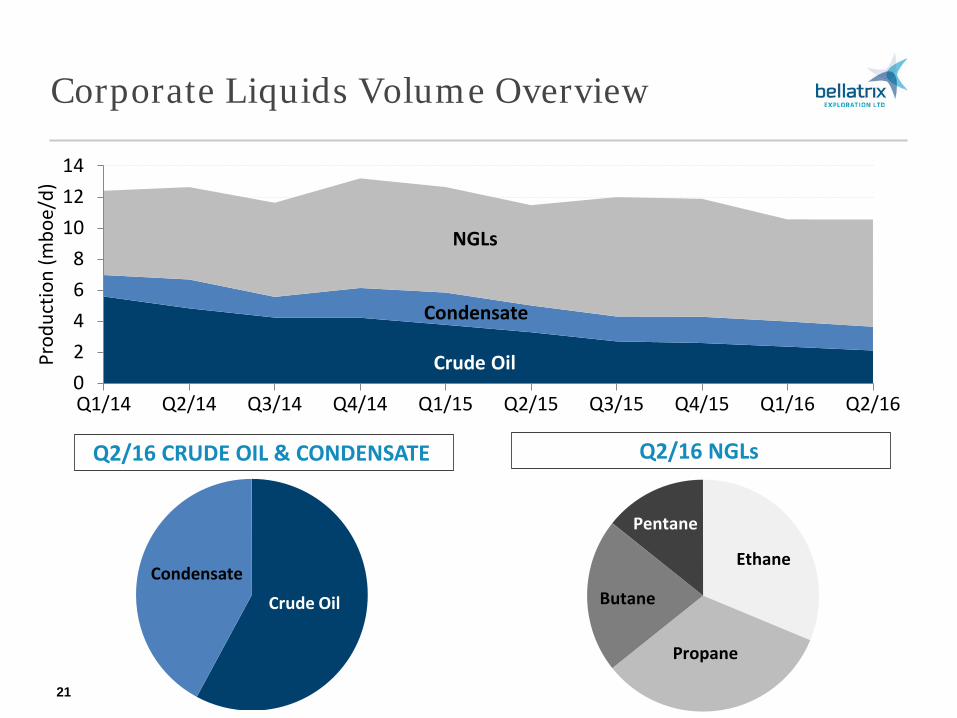
Corporate Liquids Volume Overview
21
02468
101214
Q1/14 Q2/14 Q3/14 Q4/14 Q1/15 Q2/15 Q3/15 Q4/15 Q1/16 Q2/16
Prod
uctio
n (m
boe/
d)
Crude Oil
Condensate
NGLs
Q2/16 CRUDE OIL & CONDENSATE Q2/16 NGLs
Crude Oil Condensate
Pentane
Ethane
Propane
Butane
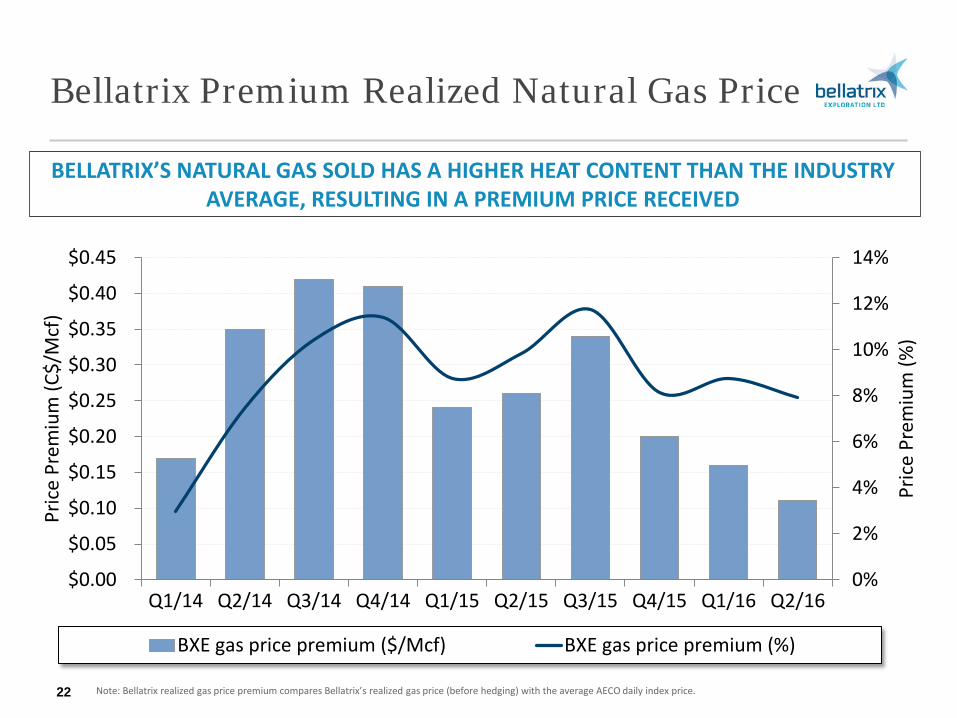
Bellatrix Premium Realized Natural Gas Price
22
BELLATRIX’S NATURAL GAS SOLD HAS A HIGHER HEAT CONTENT THAN THE INDUSTRY AVERAGE, RESULTING IN A PREMIUM PRICE RECEIVED
0%
2%
4%
6%
8%
10%
12%
14%
$0.00
$0.05
$0.10
$0.15
$0.20
$0.25
$0.30
$0.35
$0.40
$0.45
Q1/14 Q2/14 Q3/14 Q4/14 Q1/15 Q2/15 Q3/15 Q4/15 Q1/16 Q2/16
Pric
e Pr
emiu
m (%
)
Pric
e Pr
emiu
m (C
$/M
cf)
BXE gas price premium ($/Mcf) BXE gas price premium (%)
Note: Bellatrix realized gas price premium compares Bellatrix’s realized gas price (before hedging) with the average AECO daily index price.
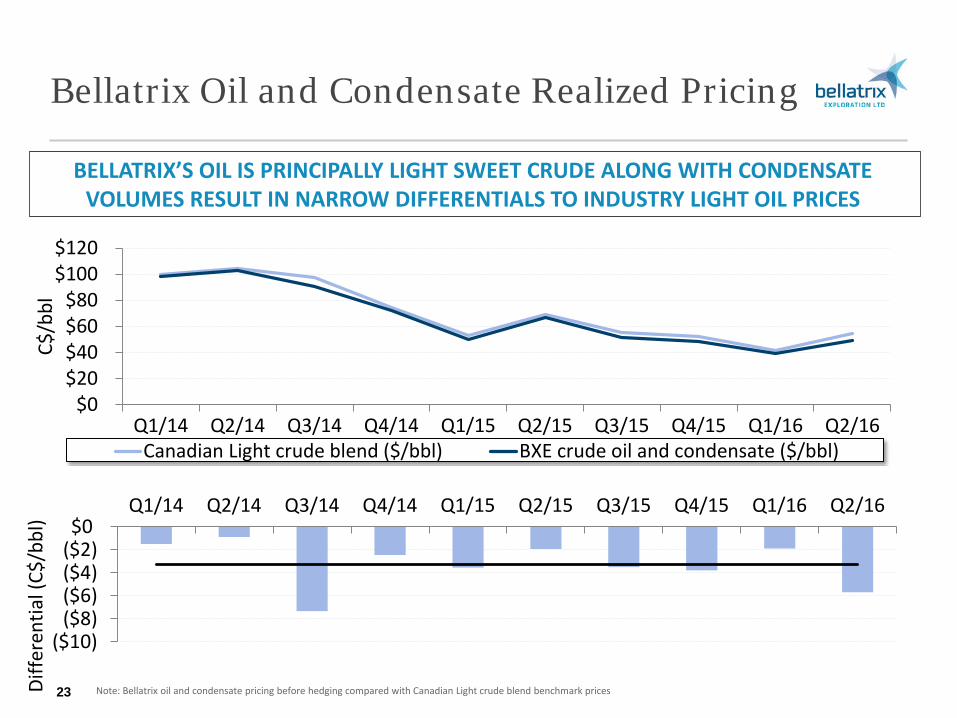
Bellatrix Oil and Condensate Realized Pricing
23
BELLATRIX’S OIL IS PRINCIPALLY LIGHT SWEET CRUDE ALONG WITH CONDENSATE VOLUMES RESULT IN NARROW DIFFERENTIALS TO INDUSTRY LIGHT OIL PRICES
$0$20$40$60$80
$100$120
Q1/14 Q2/14 Q3/14 Q4/14 Q1/15 Q2/15 Q3/15 Q4/15 Q1/16 Q2/16
C$/b
bl
Canadian Light crude blend ($/bbl) BXE crude oil and condensate ($/bbl)
($10)($8)($6)($4)($2)$0
Q1/14 Q2/14 Q3/14 Q4/14 Q1/15 Q2/15 Q3/15 Q4/15 Q1/16 Q2/16
Diffe
rent
ial (
C$/b
bl)
Note: Bellatrix oil and condensate pricing before hedging compared with Canadian Light crude blend benchmark prices
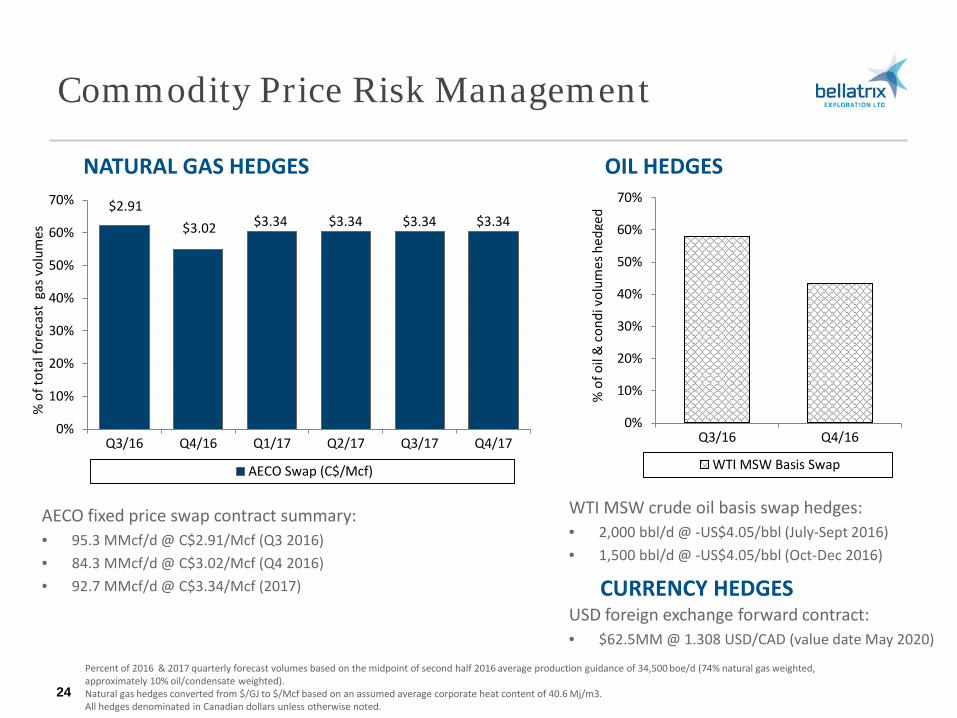
Commodity Price Risk Management
24
AECO fixed price swap contract summary: • 95.3 MMcf/d @ C$2.91/Mcf (Q3 2016) • 84.3 MMcf/d @ C$3.02/Mcf (Q4 2016) • 92.7 MMcf/d @ C$3.34/Mcf (2017)
WTI MSW crude oil basis swap hedges: • 2,000 bbl/d @ -US$4.05/bbl (July-Sept 2016) • 1,500 bbl/d @ -US$4.05/bbl (Oct-Dec 2016)
NATURAL GAS HEDGES OIL HEDGES
Percent of 2016 & 2017 quarterly forecast volumes based on the midpoint of second half 2016 average production guidance of 34,500 boe/d (74% natural gas weighted, approximately 10% oil/condensate weighted). Natural gas hedges converted from $/GJ to $/Mcf based on an assumed average corporate heat content of 40.6 Mj/m3. All hedges denominated in Canadian dollars unless otherwise noted.
CURRENCY HEDGES
USD foreign exchange forward contract: • $62.5MM @ 1.308 USD/CAD (value date May 2020)
$2.91 $3.02 $3.34 $3.34 $3.34 $3.34
0%
10%
20%
30%
40%
50%
60%
70%
Q3/16 Q4/16 Q1/17 Q2/17 Q3/17 Q4/17
% o
f tot
al fo
reca
st g
as v
olum
es
AECO Swap (C$/Mcf)
0%
10%
20%
30%
40%
50%
60%
70%
Q3/16 Q4/16
WTI MSW Basis Swap
% o
f oil
& c
ondi
vol
umes
hed
ged
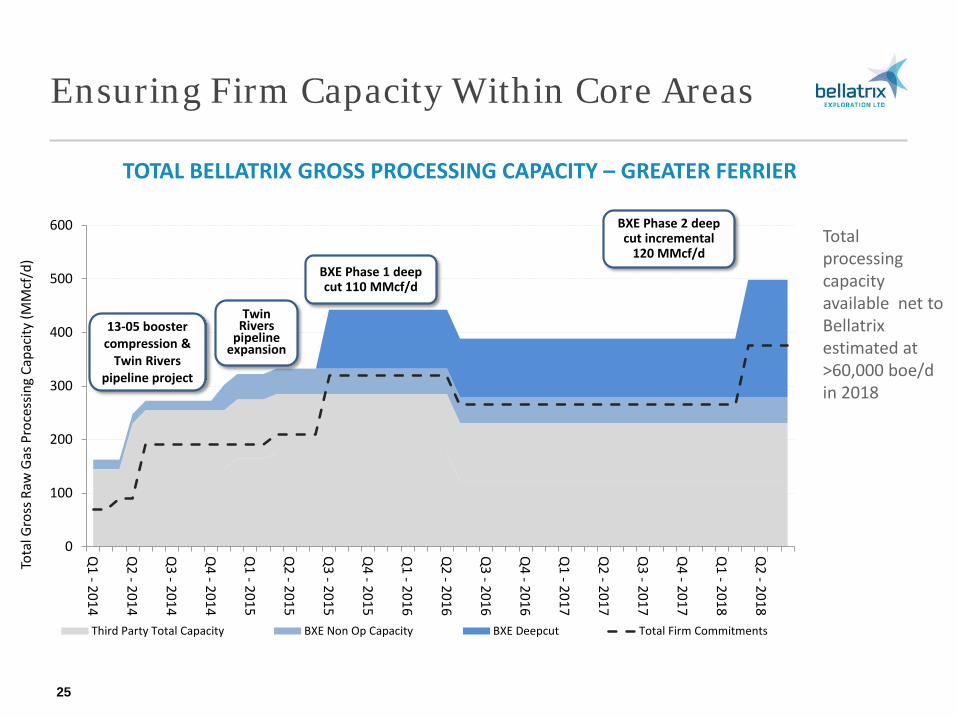
Ensuring Firm Capacity Within Core Areas
TOTAL BELLATRIX GROSS PROCESSING CAPACITY – GREATER FERRIER
25
Total processing capacity available net to Bellatrix estimated at >60,000 boe/d in 2018
0
100
200
300
400
500
600
Q1 - 2014
Q2 - 2014
Q3 - 2014
Q4 - 2014
Q1 - 2015
Q2 - 2015
Q3 - 2015
Q4 - 2015
Q1 - 2016
Q2 - 2016
Q3 - 2016
Q4 - 2016
Q1 - 2017
Q2 - 2017
Q3 - 2017
Q4 - 2017
Q1 - 2018
Q2 - 2018
Tota
l Gro
ss R
aw G
as P
roce
ssin
g Ca
paci
ty (M
Mcf
/d)
Third Party Total Capacity BXE Non Op Capacity BXE Deepcut Total Firm Commitments
13-05 booster compression &
Twin Rivers pipeline project
Twin Rivers
pipeline expansion
BXE Phase 1 deep cut 110 MMcf/d
BXE Phase 2 deep cut incremental
120 MMcf/d

Asset Overview
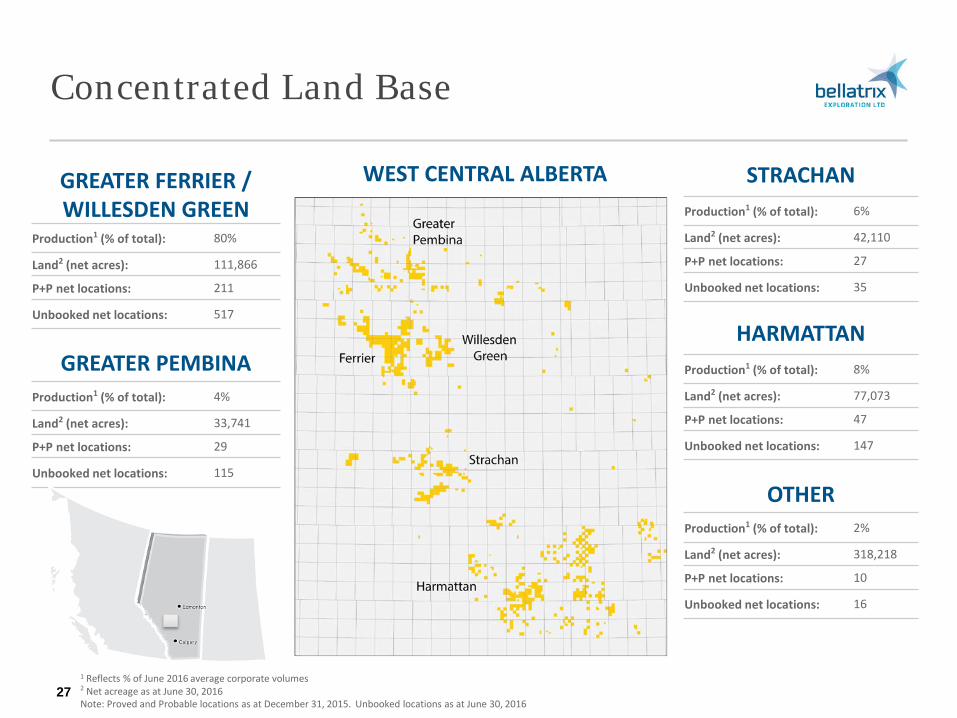
Concentrated Land Base
GREATER FERRIER / WILLESDEN GREEN
Production1 (% of total): 80%
Land2 (net acres): 111,866
P+P net locations: 211
Unbooked net locations: 517
GREATER PEMBINA Production1 (% of total): 4%
Land2 (net acres): 33,741
P+P net locations: 29
Unbooked net locations: 115
STRACHAN Production1 (% of total): 6%
Land2 (net acres): 42,110
P+P net locations: 27
Unbooked net locations: 35
HARMATTAN Production1 (% of total): 8%
Land2 (net acres): 77,073
P+P net locations: 47
Unbooked net locations: 147
OTHER Production1 (% of total): 2%
Land2 (net acres): 318,218
P+P net locations: 10
Unbooked net locations: 16
WEST CENTRAL ALBERTA
27 1 Reflects % of June 2016 average corporate volumes 2 Net acreage as at June 30, 2016 Note: Proved and Probable locations as at December 31, 2015. Unbooked locations as at June 30, 2016
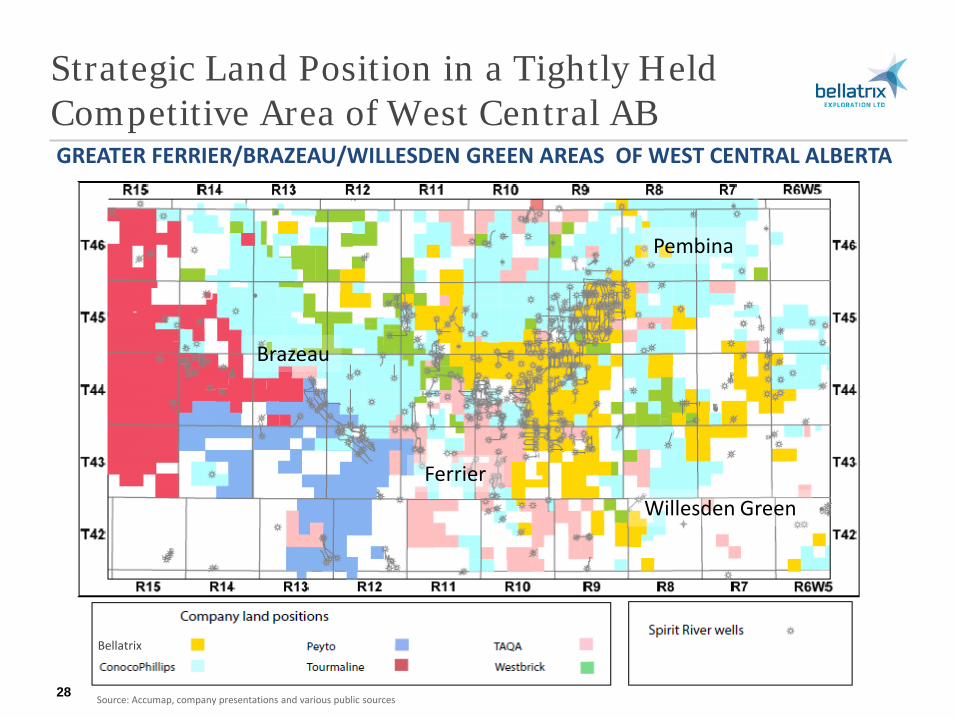
Strategic Land Position in a Tightly Held Competitive Area of West Central AB
28 Source: Accumap, company presentations and various public sources
GREATER FERRIER/BRAZEAU/WILLESDEN GREEN AREAS OF WEST CENTRAL ALBERTA
Brazeau
Ferrier
Pembina
Willesden Green
Bellatrix

Geology Overview
Geology Overview
30 Long term shareholder value creation
FOCUSED ASSET BASE IN AN ESTABLISHED AREA OF THE WESTERN CANADIAN SEDIMENTARY BASIN
MULTI-ZONE PROSPECTIVITY PROVIDES UPSIDE POTENTIAL
ACREAGE CONTAINS FAVORABLE GEOLOGIC CHARACTERISTICS
RIGOROUS & SYSTEMATIC APPROACH TO INVENTORY EVALUATION
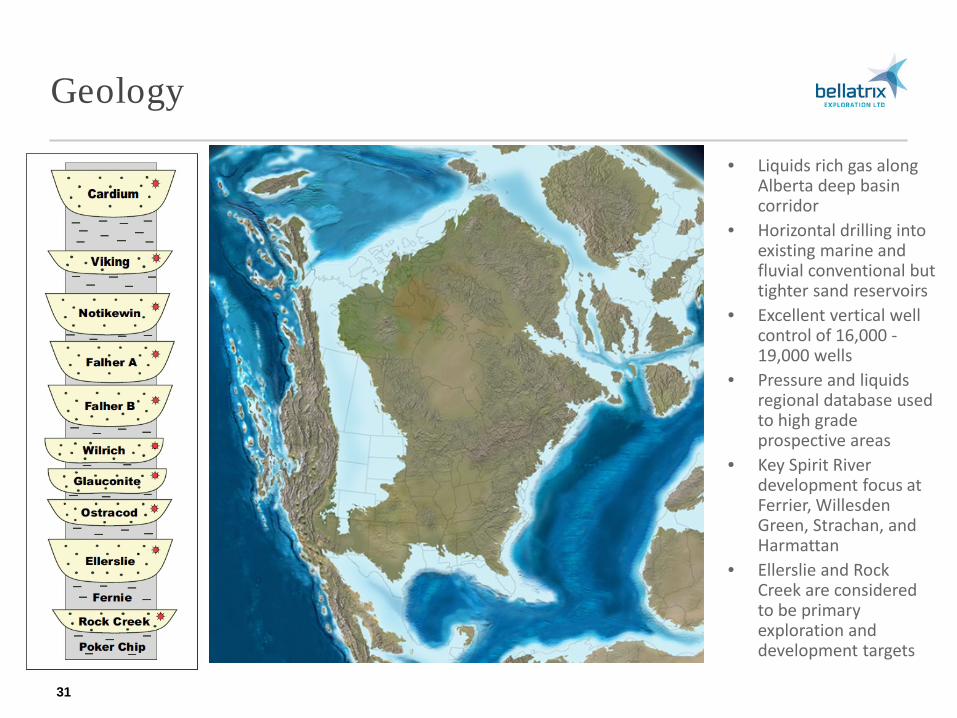
Geology
31
• Liquids rich gas along Alberta deep basin corridor
• Horizontal drilling into existing marine and fluvial conventional but tighter sand reservoirs
• Excellent vertical well control of 16,000 - 19,000 wells
• Pressure and liquids regional database used to high grade prospective areas
• Key Spirit River development focus at Ferrier, Willesden Green, Strachan, and Harmattan
• Ellerslie and Rock Creek are considered to be primary exploration and development targets
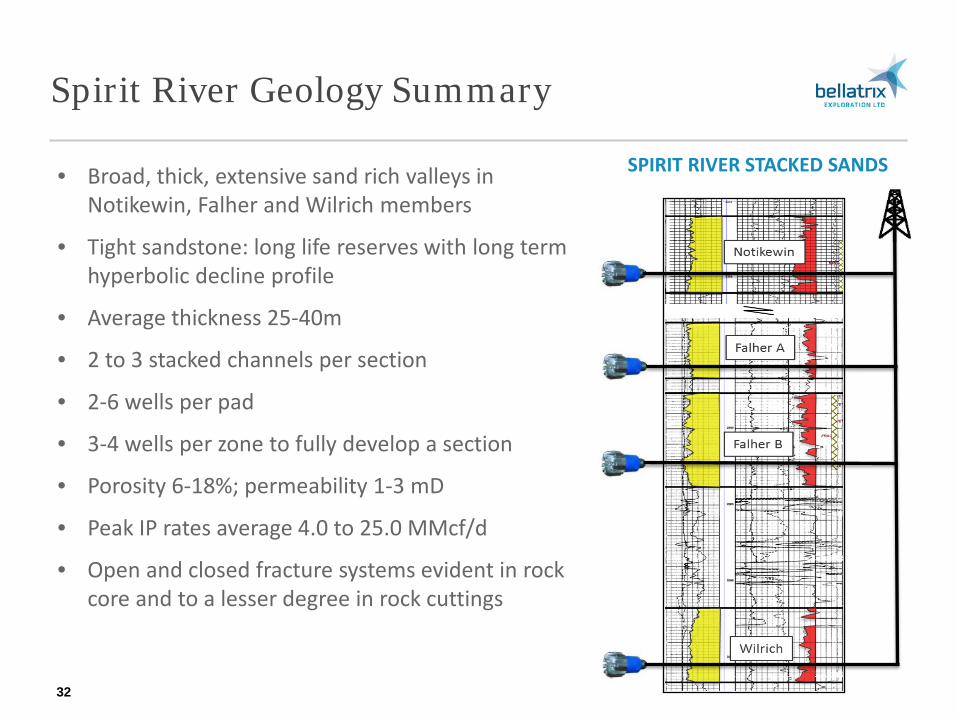
Spirit River Geology Summary
• Broad, thick, extensive sand rich valleys in Notikewin, Falher and Wilrich members
• Tight sandstone: long life reserves with long term hyperbolic decline profile
• Average thickness 25-40m
• 2 to 3 stacked channels per section
• 2-6 wells per pad
• 3-4 wells per zone to fully develop a section
• Porosity 6-18%; permeability 1-3 mD
• Peak IP rates average 4.0 to 25.0 MMcf/d
• Open and closed fracture systems evident in rock core and to a lesser degree in rock cuttings
32
SPIRIT RIVER STACKED SANDS
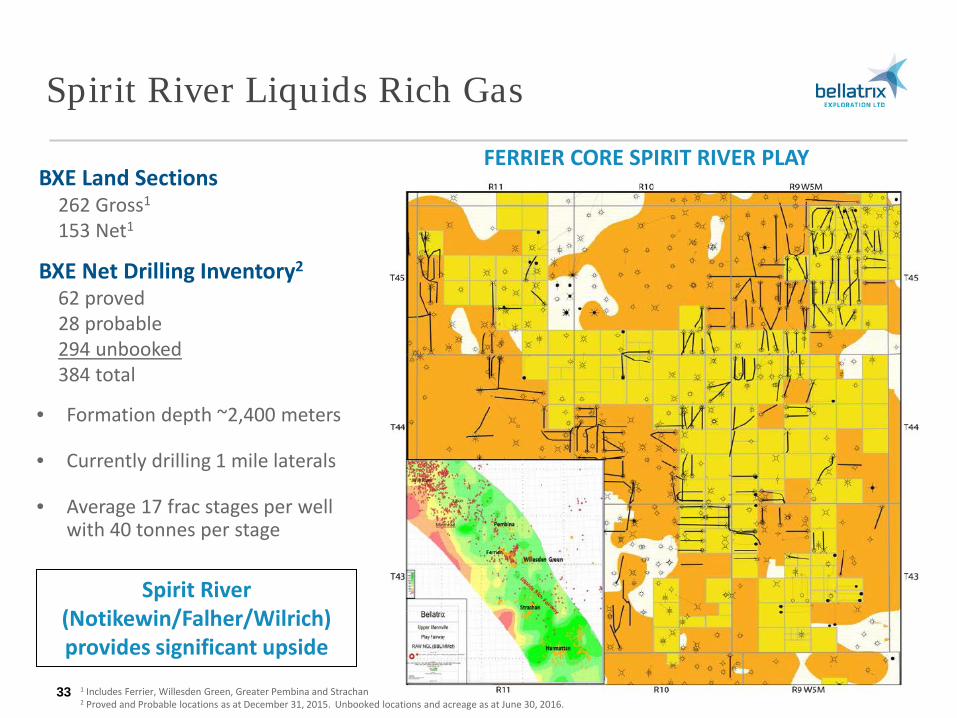
Spirit River Liquids Rich Gas
BXE Land Sections 262 Gross1
153 Net1
BXE Net Drilling Inventory2
62 proved 28 probable 294 unbooked 384 total
Spirit River (Notikewin/Falher/Wilrich) provides significant upside
1 Includes Ferrier, Willesden Green, Greater Pembina and Strachan 2 Proved and Probable locations as at December 31, 2015. Unbooked locations and acreage as at June 30, 2016.
33
FERRIER CORE SPIRIT RIVER PLAY
• Formation depth ~2,400 meters
• Currently drilling 1 mile laterals
• Average 17 frac stages per well with 40 tonnes per stage
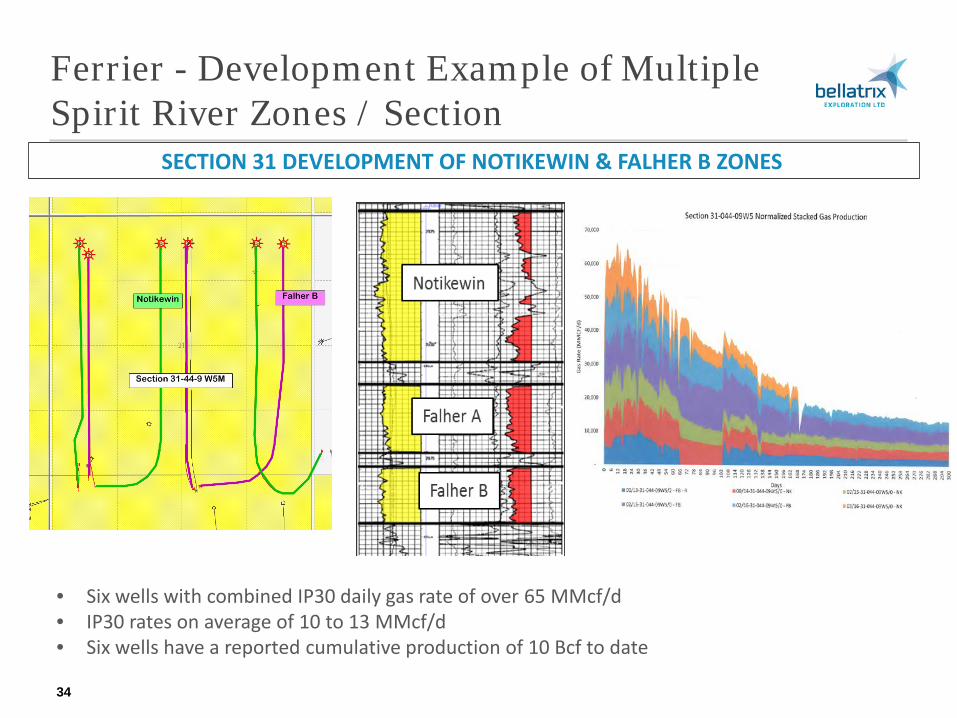
Ferrier - Development Example of Multiple Spirit River Zones / Section
34
• Six wells with combined IP30 daily gas rate of over 65 MMcf/d • IP30 rates on average of 10 to 13 MMcf/d • Six wells have a reported cumulative production of 10 Bcf to date
SECTION 31 DEVELOPMENT OF NOTIKEWIN & FALHER B ZONES
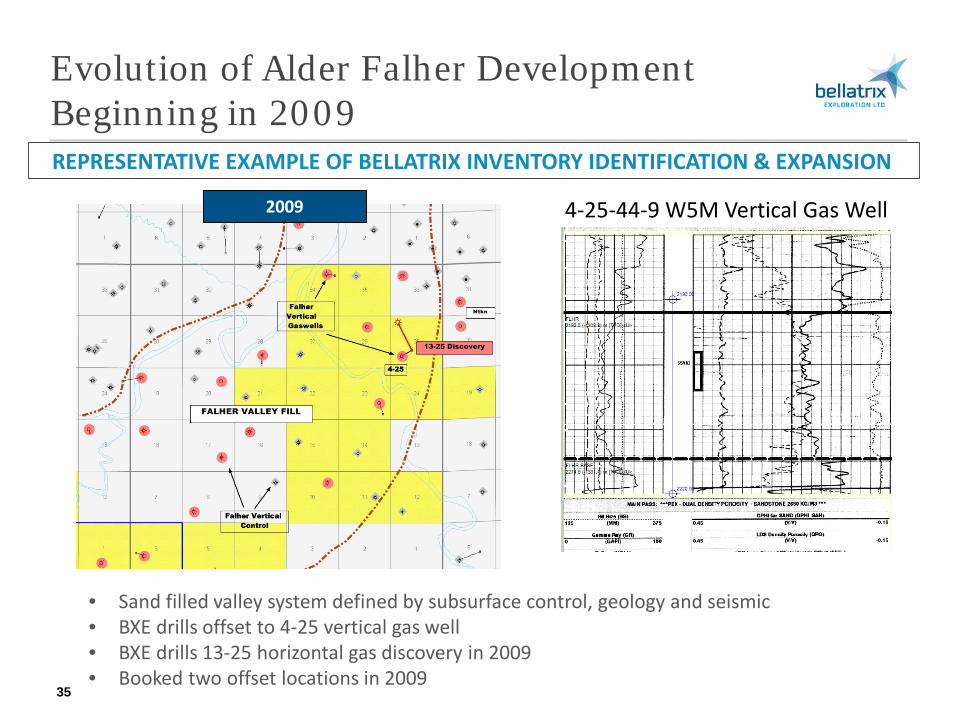
Evolution of Alder Falher Development Beginning in 2009
35
4-25-44-9 W5M Vertical Gas Well
• Sand filled valley system defined by subsurface control, geology and seismic • BXE drills offset to 4-25 vertical gas well • BXE drills 13-25 horizontal gas discovery in 2009 • Booked two offset locations in 2009
REPRESENTATIVE EXAMPLE OF BELLATRIX INVENTORY IDENTIFICATION & EXPANSION
2009
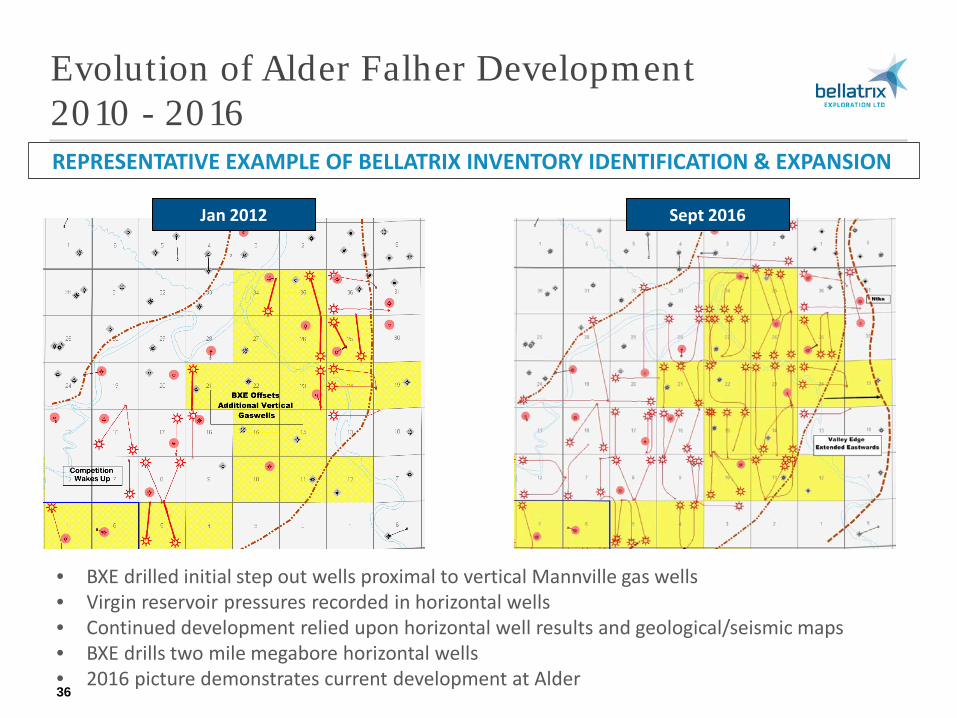
Evolution of Alder Falher Development 2010 - 2016
36
• BXE drilled initial step out wells proximal to vertical Mannville gas wells • Virgin reservoir pressures recorded in horizontal wells • Continued development relied upon horizontal well results and geological/seismic maps • BXE drills two mile megabore horizontal wells • 2016 picture demonstrates current development at Alder
REPRESENTATIVE EXAMPLE OF BELLATRIX INVENTORY IDENTIFICATION & EXPANSION
Jan 2012 Sept 2016

Operations Overview
Operations Overview
38 Long term shareholder value creation
CAPITAL COST SAVINGS INITIATIVES & ACHIEVEMENTS
PLANNING AND OPTIMIZATION
COST SAVINGS SUSTAINABILITY
EFFICIENCY GAINS
Spirit River Well Costs & Capital Efficiencies
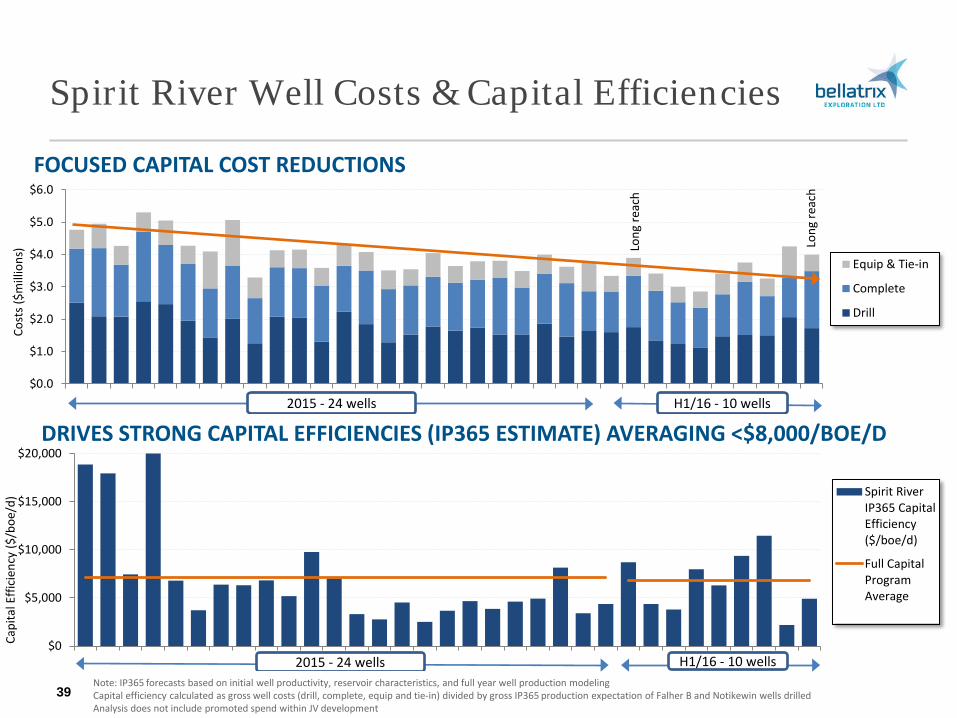
39
FOCUSED CAPITAL COST REDUCTIONS
DRIVES STRONG CAPITAL EFFICIENCIES (IP365 ESTIMATE) AVERAGING <$8,000/BOE/D
Note: IP365 forecasts based on initial well productivity, reservoir characteristics, and full year well production modeling Capital efficiency calculated as gross well costs (drill, complete, equip and tie-in) divided by gross IP365 production expectation of Falher B and Notikewin wells drilled Analysis does not include promoted spend within JV development
$0.0
$1.0
$2.0
$3.0
$4.0
$5.0
$6.0
Cost
s ($m
illio
ns)
Equip & Tie-in
Complete
Drill
2015 - 24 wells H1/16 - 10 wells
Long
reac
h
Long
reac
h
$0
$5,000
$10,000
$15,000
$20,000
Capi
tal E
ffici
ency
($/b
oe/d
) Spirit RiverIP365 CapitalEfficiency($/boe/d)
Full CapitalProgramAverage
2015 - 24 wells H1/16 - 10 wells
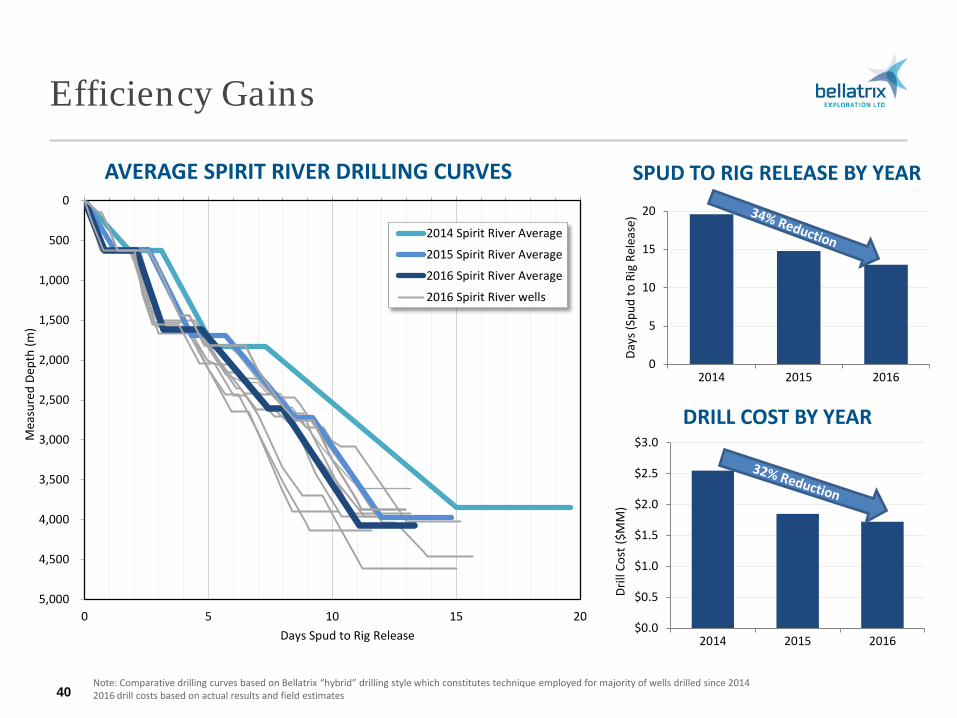
Efficiency Gains
40
AVERAGE SPIRIT RIVER DRILLING CURVES SPUD TO RIG RELEASE BY YEAR
Note: Comparative drilling curves based on Bellatrix “hybrid” drilling style which constitutes technique employed for majority of wells drilled since 2014 2016 drill costs based on actual results and field estimates
0
5
10
15
20
2014 2015 2016
Days
(Spu
d to
Rig
Rel
ease
)
DRILL COST BY YEAR
$0.0
$0.5
$1.0
$1.5
$2.0
$2.5
$3.0
2014 2015 2016Dr
ill C
ost (
$MM
)
0
500
1,000
1,500
2,000
2,500
3,000
3,500
4,000
4,500
5,0000 5 10 15 20
Mea
sure
d De
pth
(m)
Days Spud to Rig Release
2014 Spirit River Average
2015 Spirit River Average
2016 Spirit River Average
2016 Spirit River wells
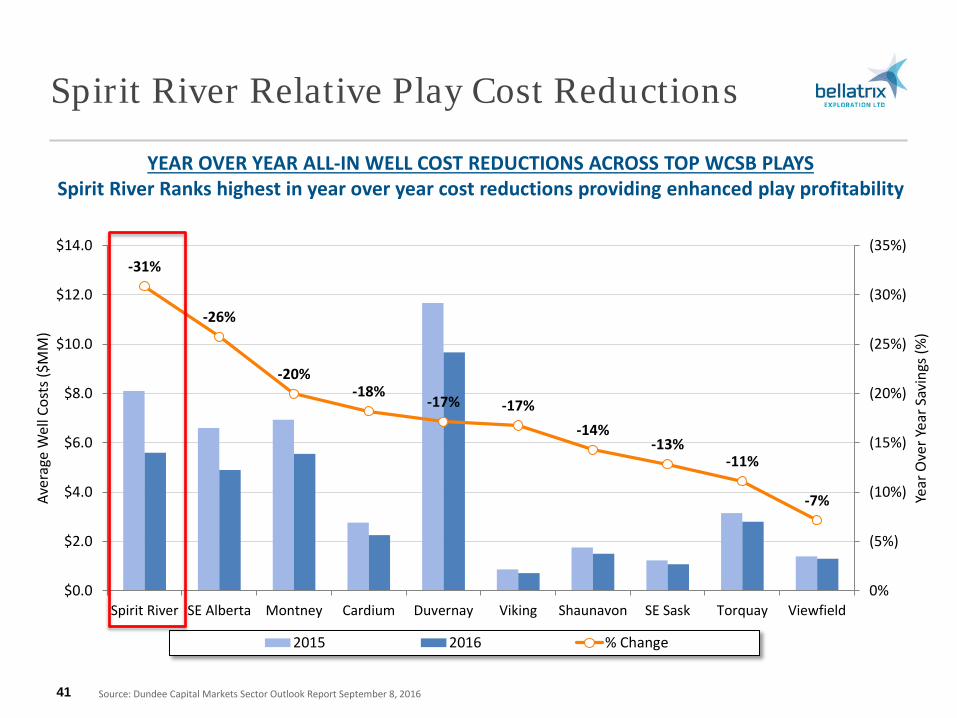
Spirit River Relative Play Cost Reductions
41
-31%
-26%
-20% -18%
-17% -17% -14%
-13% -11%
-7%
(35%)
(30%)
(25%)
(20%)
(15%)
(10%)
(5%)
0%$0.0
$2.0
$4.0
$6.0
$8.0
$10.0
$12.0
$14.0
Spirit River SE Alberta Montney Cardium Duvernay Viking Shaunavon SE Sask Torquay Viewfield
Year
Ove
r Yea
r Sav
ings
(%)
Aver
age
Wel
l Cos
ts ($
MM
)
2015 2016 % Change
Source: Dundee Capital Markets Sector Outlook Report September 8, 2016
YEAR OVER YEAR ALL-IN WELL COST REDUCTIONS ACROSS TOP WCSB PLAYS Spirit River Ranks highest in year over year cost reductions providing enhanced play profitability
Capital Cost Reductions
42
• Review and optimize how surface hole is drilled
• Review and optimize bottom hole assembly
• Review and optimize well design
COST REDUCTIONS AND MAINTENANCE OF A LOW COST PROFILE IS ALL ABOUT “REVIEWING & OPTIMIZING”
REVIEW OPTIMIZE REPEAT
• Re-engineered the use of high performance motors
• Reamer run while drilling
• The use of the same equipment and people for improved consistency of results
• Continuous bidding practices ensure best price available
• Working closely with vendors on optimizing operations
• Better communication with respect to concurrent operations reduces downtime, increases field efficiency and optimizes resources
• New bit designs have demonstrated significant improvements
• Three record runs on three different wells
Improvement & Optimization Efforts
43
TANGIBLE BENEFITS ACHIEVED ACROSS MULTIPLE AREAS
TIMING IS A LARGE COMPONENT OF COST & OPTIMIZATION
TESTING AND IMPLEMENTING NEW EQUIPMENT RECORD RUN
RECORD RUN
RECORD RUN
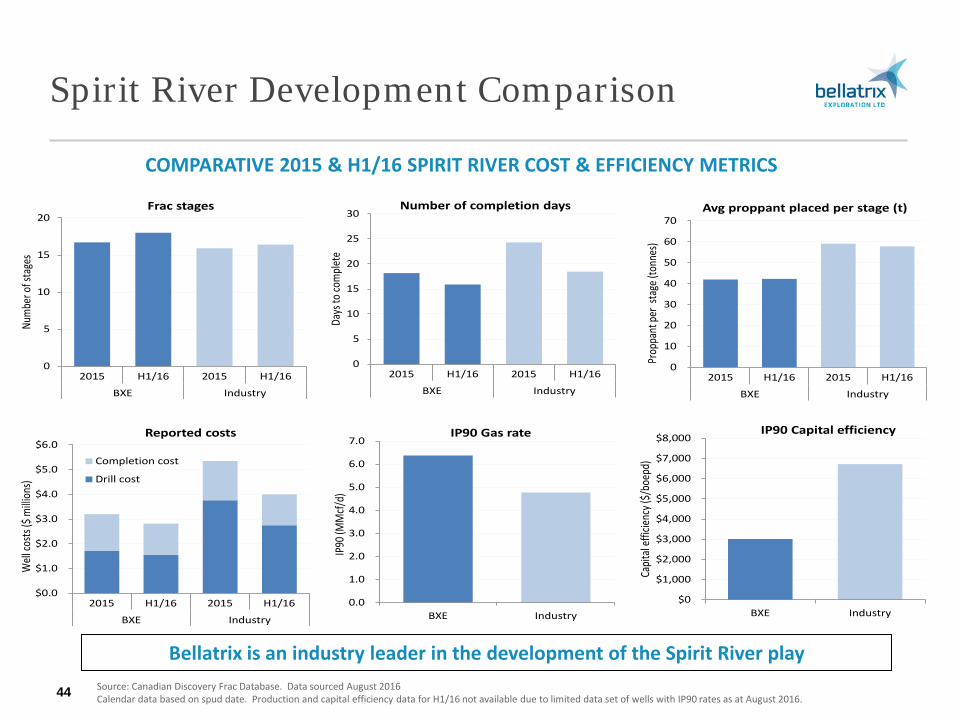
Spirit River Development Comparison
44 Source: Canadian Discovery Frac Database. Data sourced August 2016 Calendar data based on spud date. Production and capital efficiency data for H1/16 not available due to limited data set of wells with IP90 rates as at August 2016.
COMPARATIVE 2015 & H1/16 SPIRIT RIVER COST & EFFICIENCY METRICS
Bellatrix is an industry leader in the development of the Spirit River play
0
5
10
15
20
2015 H1/16 2015 H1/16
BXE Industry
Num
ber o
f sta
ges
Frac stages
0
5
10
15
20
25
30
2015 H1/16 2015 H1/16
BXE Industry
Days
to co
mple
te
Number of completion days
0
10
20
30
40
50
60
70
2015 H1/16 2015 H1/16
BXE Industry
Prop
pant
per
stage
(ton
nes)
Avg proppant placed per stage (t)
$0.0
$1.0
$2.0
$3.0
$4.0
$5.0
$6.0
2015 H1/16 2015 H1/16
BXE Industry
Well
costs
($ m
illion
s)
Reported costs
Completion cost
Drill cost
0.0
1.0
2.0
3.0
4.0
5.0
6.0
7.0
BXE Industry
IP90
(MM
cf/d)
IP90 Gas rate
$0
$1,000
$2,000
$3,000
$4,000
$5,000
$6,000
$7,000
$8,000
BXE Industry
Capit
al ef
ficien
cy ($
/boe
pd)
IP90 Capital efficiency

Engineering Overview
Engineering Overview
46 Long term shareholder value creation
SPIRIT RIVER PLAY PROFITABILITY
ENGINEERING VALUE
PLAY PERFORMANCE
DEPTH OF INVENTORY
0
2,000
4,000
6,000
8,000
10,000
12,000
14,000
16,000
18,000
20,000
22,000
Jan
10Ap
r 10
Jul 1
0O
ct 1
0Ja
n 11
Apr 1
1Ju
l 11
Oct
11
Jan
12Ap
r 12
Jul 1
2O
ct 1
2Ja
n 13
Apr 1
3Ju
l 13
Oct
13
Jan
14Ap
r 14
Jul 1
4O
ct 1
4Ja
n 15
Apr 1
5Ju
l 15
Oct
15
Jan
16Ap
r 16
Aver
age
mon
thly
pro
duct
ion
(boe
/d)
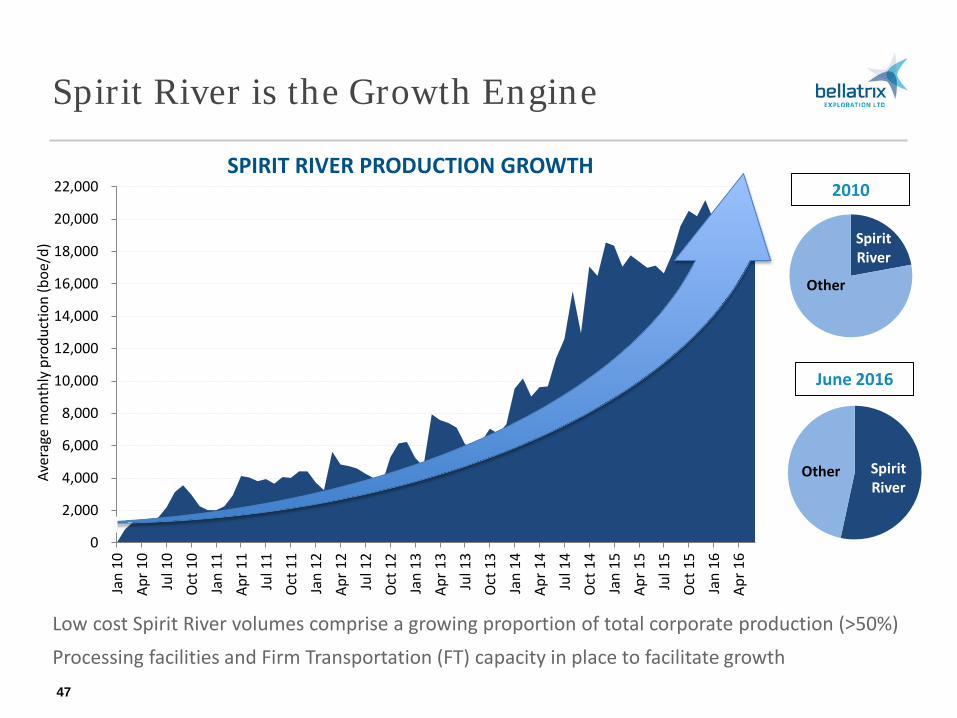
Spirit River is the Growth Engine
47
Low cost Spirit River volumes comprise a growing proportion of total corporate production (>50%) Processing facilities and Firm Transportation (FT) capacity in place to facilitate growth
SPIRIT RIVER PRODUCTION GROWTH 2010
June 2016
Spirit River
Other
Spirit River
Other
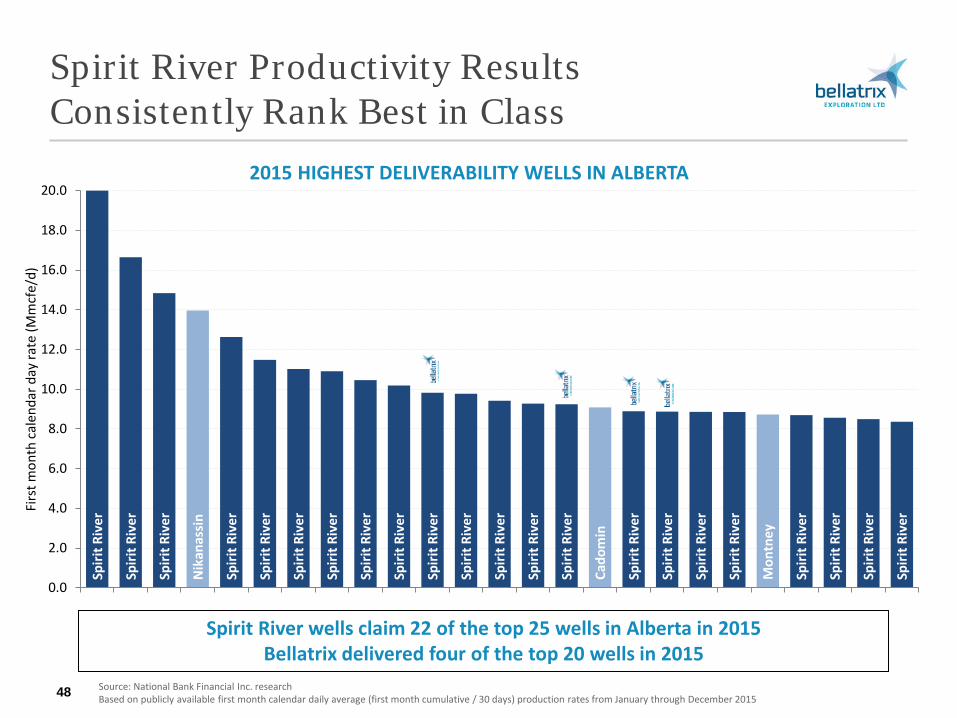
Spirit River Productivity Results Consistently Rank Best in Class
48 Source: National Bank Financial Inc. research Based on publicly available first month calendar daily average (first month cumulative / 30 days) production rates from January through December 2015
2015 HIGHEST DELIVERABILITY WELLS IN ALBERTA
Spirit River wells claim 22 of the top 25 wells in Alberta in 2015 Bellatrix delivered four of the top 20 wells in 2015
Spiri
t Riv
er
Spiri
t Riv
er
Spiri
t Riv
er
Nik
anas
sin
Spiri
t Riv
er
Spiri
t Riv
er
Spiri
t Riv
er
Spiri
t Riv
er
Spiri
t Riv
er
Spiri
t Riv
er
Spiri
t Riv
er
Spiri
t Riv
er
Spiri
t Riv
er
Spiri
t Riv
er
Spiri
t Riv
er
Cado
min
Spiri
t Riv
er
Spiri
t Riv
er
Spiri
t Riv
er
Spiri
t Riv
er
Mon
tney
Spiri
t Riv
er
Spiri
t Riv
er
Spiri
t Riv
er
Spiri
t Riv
er
0.0
2.0
4.0
6.0
8.0
10.0
12.0
14.0
16.0
18.0
20.0
Firs
t mon
th c
alen
dar d
ay ra
te (M
mcf
e/d)
$0.00
$0.50
$1.00
$1.50
$2.00
$2.50
$3.00
$3.50
$4.00
Henr
y Hu
b (U
S$/M
Mbt
u)
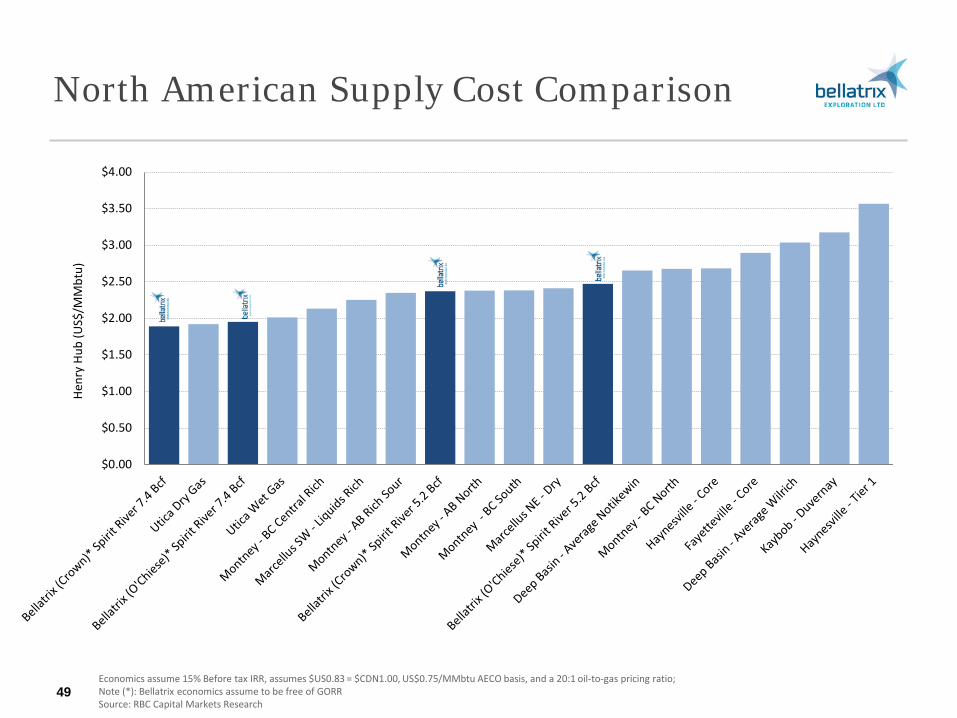
North American Supply Cost Comparison
49 Economics assume 15% Before tax IRR, assumes $US0.83 = $CDN1.00, US$0.75/MMbtu AECO basis, and a 20:1 oil-to-gas pricing ratio; Note (*): Bellatrix economics assume to be free of GORR Source: RBC Capital Markets Research
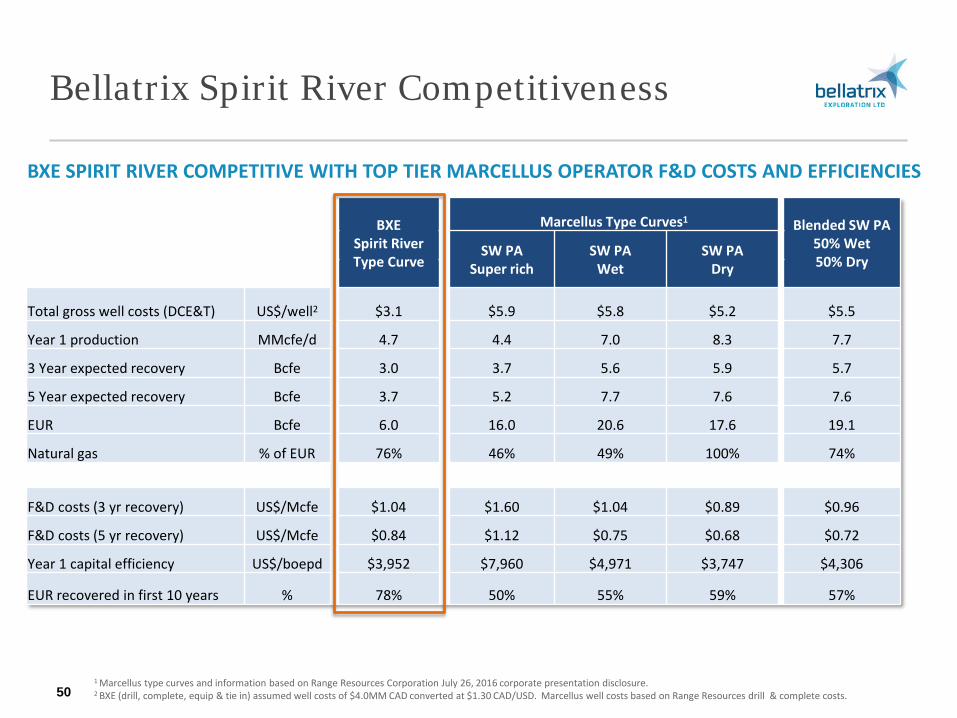
Bellatrix Spirit River Competitiveness
50 1 Marcellus type curves and information based on Range Resources Corporation July 26, 2016 corporate presentation disclosure. 2 BXE (drill, complete, equip & tie in) assumed well costs of $4.0MM CAD converted at $1.30 CAD/USD. Marcellus well costs based on Range Resources drill & complete costs.
BXE SPIRIT RIVER COMPETITIVE WITH TOP TIER MARCELLUS OPERATOR F&D COSTS AND EFFICIENCIES
BXE Spirit River Type Curve
Marcellus Type Curves1 Blended SW PA 50% Wet 50% Dry
SW PA Super rich
SW PA Wet
SW PA Dry
Total gross well costs (DCE&T) US$/well2 $3.1 $5.9 $5.8 $5.2 $5.5
Year 1 production MMcfe/d 4.7 4.4 7.0 8.3 7.7
3 Year expected recovery Bcfe 3.0 3.7 5.6 5.9 5.7
5 Year expected recovery Bcfe 3.7 5.2 7.7 7.6 7.6
EUR Bcfe 6.0 16.0 20.6 17.6 19.1
Natural gas % of EUR 76% 46% 49% 100% 74%
F&D costs (3 yr recovery) US$/Mcfe $1.04 $1.60 $1.04 $0.89 $0.96
F&D costs (5 yr recovery) US$/Mcfe $0.84 $1.12 $0.75 $0.68 $0.72
Year 1 capital efficiency US$/boepd $3,952 $7,960 $4,971 $3,747 $4,306
EUR recovered in first 10 years % 78% 50% 55% 59% 57%
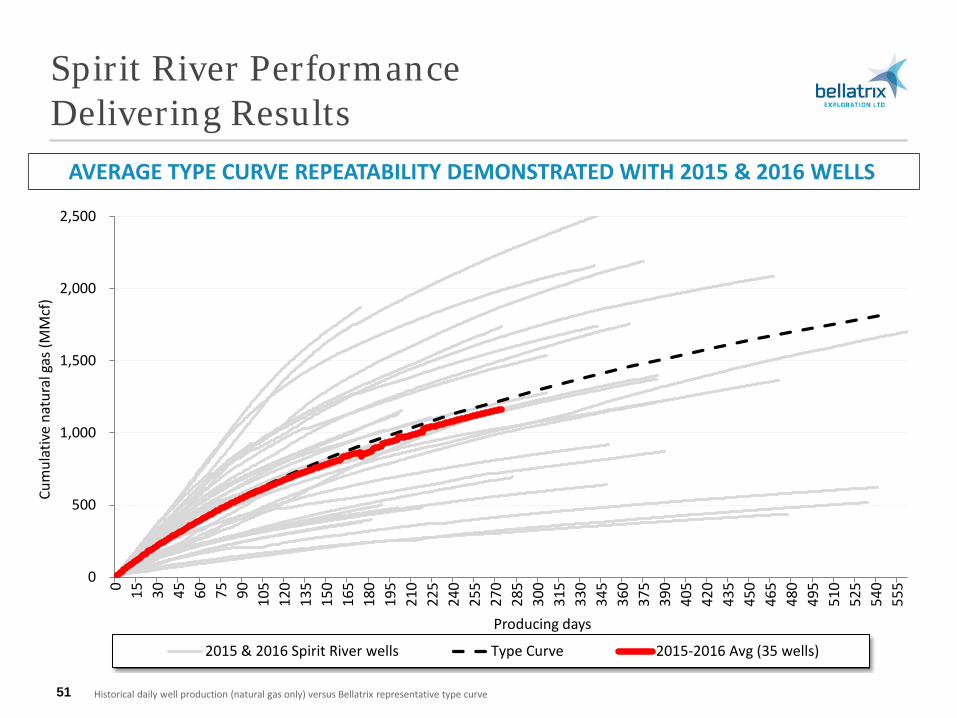
Spirit River Performance Delivering Results
51
0
500
1,000
1,500
2,000
2,500
0 15 30 45 60 75 90 105
120
135
150
165
180
195
210
225
240
255
270
285
300
315
330
345
360
375
390
405
420
435
450
465
480
495
510
525
540
555
Cum
ulat
ive
natu
ral g
as (M
Mcf
)
Producing days
2015 & 2016 Spirit River wells Type Curve 2015-2016 Avg (35 wells)
Historical daily well production (natural gas only) versus Bellatrix representative type curve
AVERAGE TYPE CURVE REPEATABILITY DEMONSTRATED WITH 2015 & 2016 WELLS
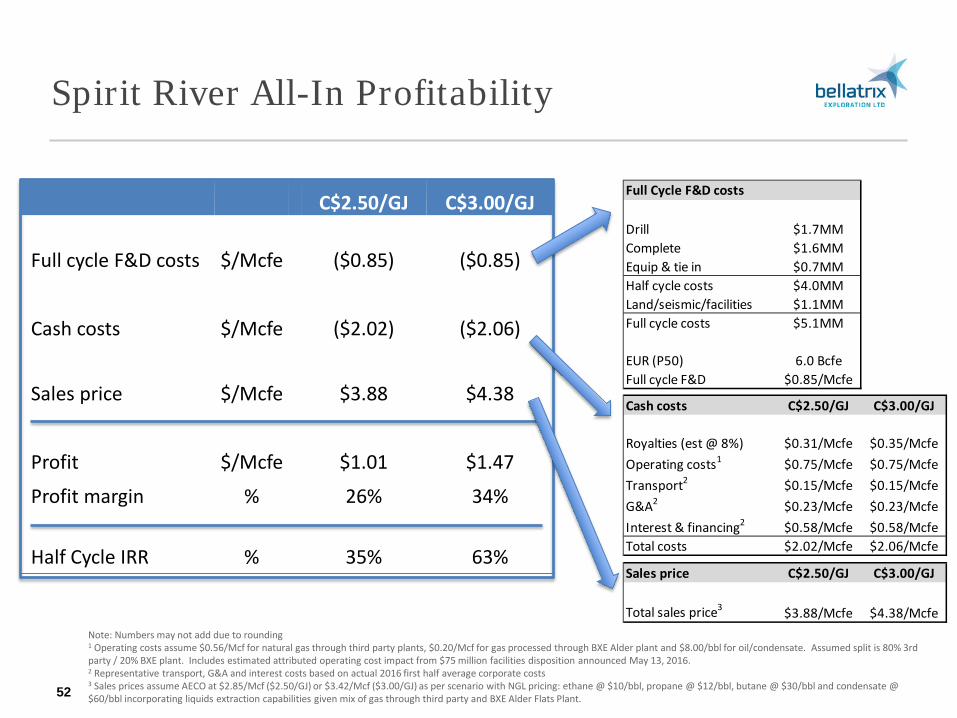
C$2.50/GJ C$3.00/GJ
Full cycle F&D costs $/Mcfe ($0.85) ($0.85)
Cash costs $/Mcfe ($2.02) ($2.06)
Sales price $/Mcfe $3.88 $4.38
Profit $/Mcfe $1.01 $1.47
Profit margin % 26% 34%
Half Cycle IRR % 35% 63%
Spirit River All-In Profitability
52
Note: Numbers may not add due to rounding 1 Operating costs assume $0.56/Mcf for natural gas through third party plants, $0.20/Mcf for gas processed through BXE Alder plant and $8.00/bbl for oil/condensate. Assumed split is 80% 3rd party / 20% BXE plant. Includes estimated attributed operating cost impact from $75 million facilities disposition announced May 13, 2016. 2 Representative transport, G&A and interest costs based on actual 2016 first half average corporate costs 3 Sales prices assume AECO at $2.85/Mcf ($2.50/GJ) or $3.42/Mcf ($3.00/GJ) as per scenario with NGL pricing: ethane @ $10/bbl, propane @ $12/bbl, butane @ $30/bbl and condensate @ $60/bbl incorporating liquids extraction capabilities given mix of gas through third party and BXE Alder Flats Plant.
Full Cycle F&D costs
Drill $1.7MMComplete $1.6MMEquip & tie in $0.7MMHalf cycle costs $4.0MMLand/seismic/facilities $1.1MMFull cycle costs $5.1MM
EUR (P50) 6.0 BcfeFull cycle F&D $0.85/Mcfe
Cash costs C$2.50/GJ C$3.00/GJ
Royalties (est @ 8%) $0.31/Mcfe $0.35/McfeOperating costs1 $0.75/Mcfe $0.75/McfeTransport2 $0.15/Mcfe $0.15/McfeG&A2 $0.23/Mcfe $0.23/McfeInterest & financing2 $0.58/Mcfe $0.58/McfeTotal costs $2.02/Mcfe $2.06/Mcfe
Sales price C$2.50/GJ C$3.00/GJ
Total sales price3 $3.88/Mcfe $4.38/Mcfe
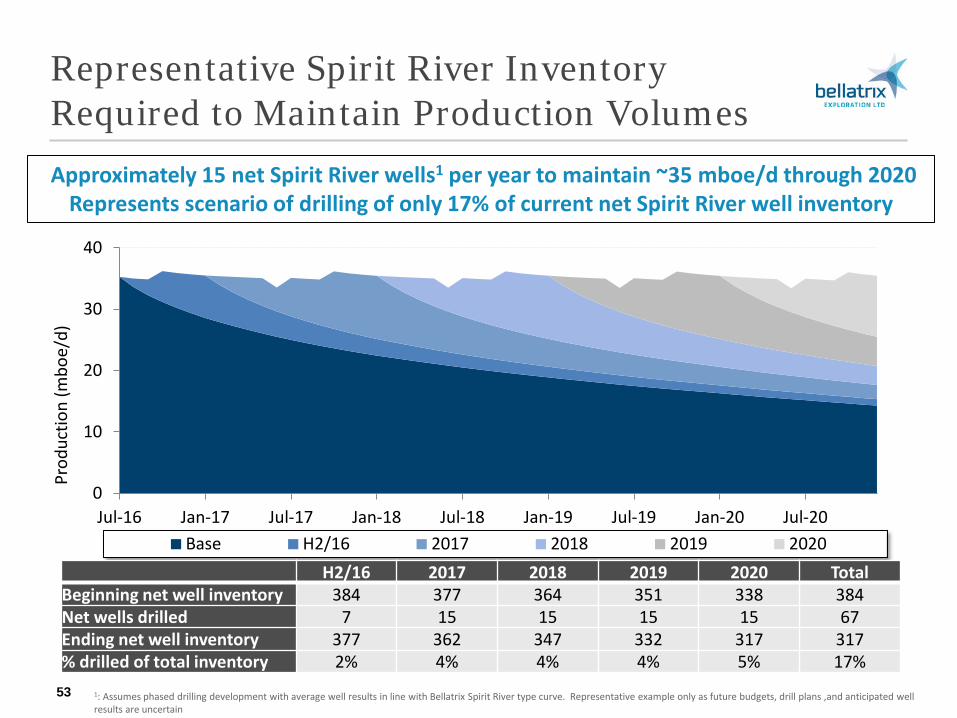
Representative Spirit River Inventory Required to Maintain Production Volumes
53
0
10
20
30
40
Jul-16 Jan-17 Jul-17 Jan-18 Jul-18 Jan-19 Jul-19 Jan-20 Jul-20
Prod
uctio
n (m
boe/
d)
Base H2/16 2017 2018 2019 2020
Approximately 15 net Spirit River wells1 per year to maintain ~35 mboe/d through 2020 Represents scenario of drilling of only 17% of current net Spirit River well inventory
H2/16 2017 2018 2019 2020 Total Beginning net well inventory 384 377 364 351 338 384 Net wells drilled 7 15 15 15 15 67 Ending net well inventory 377 362 347 332 317 317 % drilled of total inventory 2% 4% 4% 4% 5% 17%
1: Assumes phased drilling development with average well results in line with Bellatrix Spirit River type curve. Representative example only as future budgets, drill plans ,and anticipated well results are uncertain
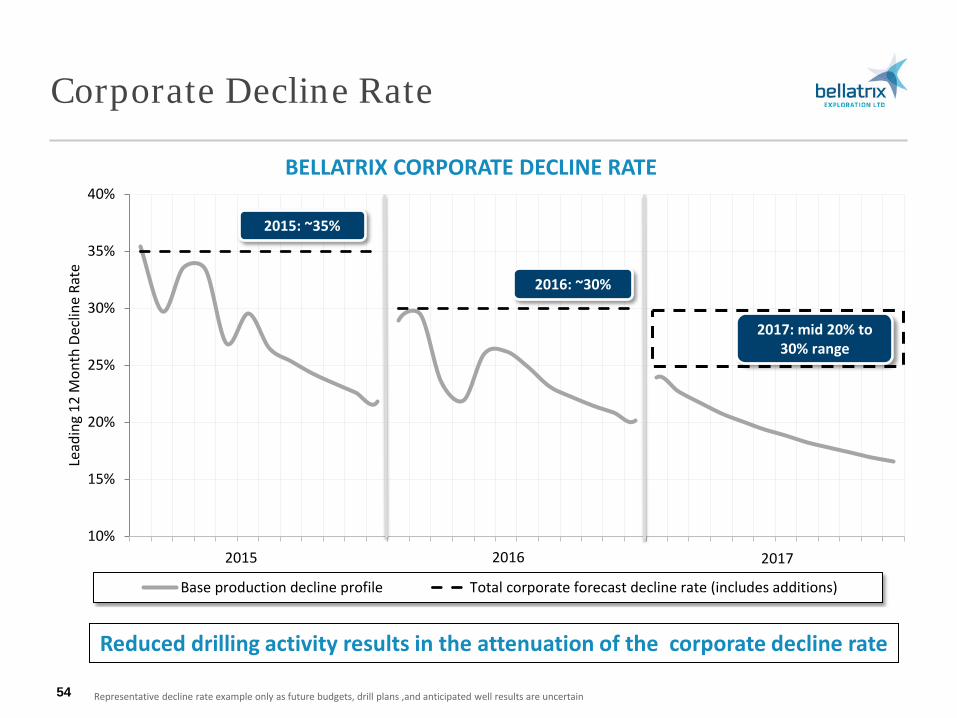
Corporate Decline Rate
54
BELLATRIX CORPORATE DECLINE RATE
Reduced drilling activity results in the attenuation of the corporate decline rate
10%
15%
20%
25%
30%
35%
40%
Lead
ing
12 M
onth
Dec
line
Rate
Base production decline profile Total corporate forecast decline rate (includes additions)
2015: ~35%
2015 2016 2017
2016: ~30%
2017: mid 20% to 30% range
Representative decline rate example only as future budgets, drill plans ,and anticipated well results are uncertain
Production Facilities & Optimization Overview
Production Overview
56 Long term shareholder value creation
STRATEGIC FACILITIES OVERVIEW
BENEFITS OF IN-HOUSE REVIEW & ANALYSIS
FACILITIES INVESTMENT AND IMBEDDED VALUE
OPTIMIZATION EFFORTS & ACHIEVEMENTS
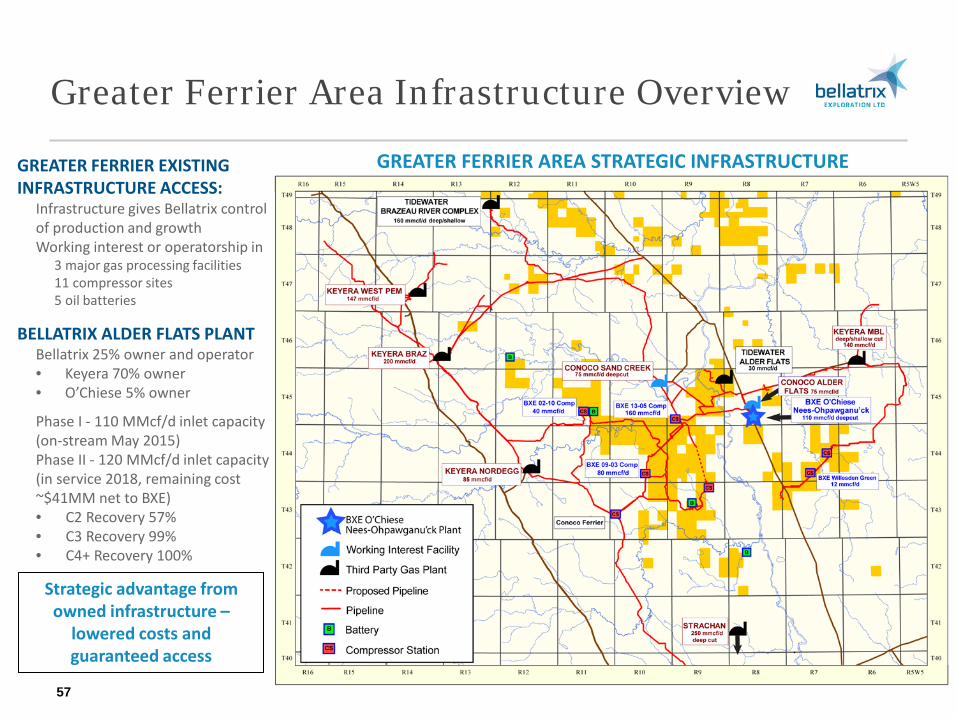
Greater Ferrier Area Infrastructure Overview
GREATER FERRIER EXISTING INFRASTRUCTURE ACCESS:
Infrastructure gives Bellatrix control of production and growth Working interest or operatorship in
3 major gas processing facilities 11 compressor sites 5 oil batteries
BELLATRIX ALDER FLATS PLANT Bellatrix 25% owner and operator • Keyera 70% owner • O’Chiese 5% owner
Phase I - 110 MMcf/d inlet capacity (on-stream May 2015) Phase II - 120 MMcf/d inlet capacity (in service 2018, remaining cost ~$41MM net to BXE) • C2 Recovery 57% • C3 Recovery 99% • C4+ Recovery 100%
Strategic advantage from owned infrastructure –
lowered costs and guaranteed access
57
GREATER FERRIER AREA STRATEGIC INFRASTRUCTURE
Significant Investment in Strategic Infrastructure
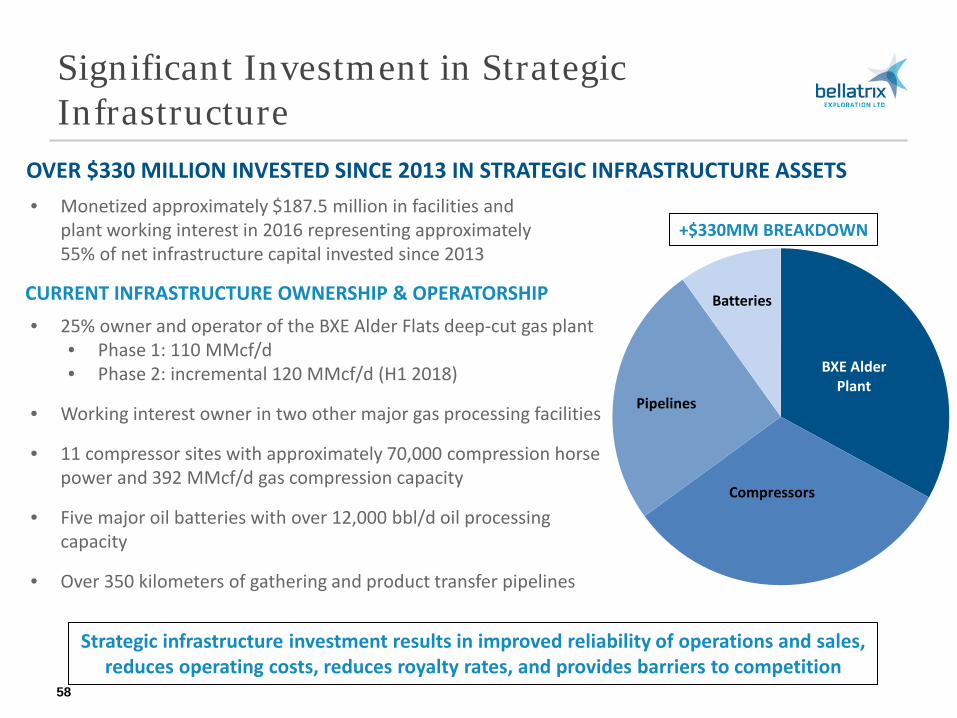
OVER $330 MILLION INVESTED SINCE 2013 IN STRATEGIC INFRASTRUCTURE ASSETS
58
• Monetized approximately $187.5 million in facilities and plant working interest in 2016 representing approximately 55% of net infrastructure capital invested since 2013
+$330MM BREAKDOWN
Strategic infrastructure investment results in improved reliability of operations and sales, reduces operating costs, reduces royalty rates, and provides barriers to competition
BXE Alder Plant
Pipelines
Batteries
Compressors
CURRENT INFRASTRUCTURE OWNERSHIP & OPERATORSHIP
• 25% owner and operator of the BXE Alder Flats deep-cut gas plant • Phase 1: 110 MMcf/d • Phase 2: incremental 120 MMcf/d (H1 2018)
• Working interest owner in two other major gas processing facilities
• 11 compressor sites with approximately 70,000 compression horse power and 392 MMcf/d gas compression capacity
• Five major oil batteries with over 12,000 bbl/d oil processing capacity
• Over 350 kilometers of gathering and product transfer pipelines
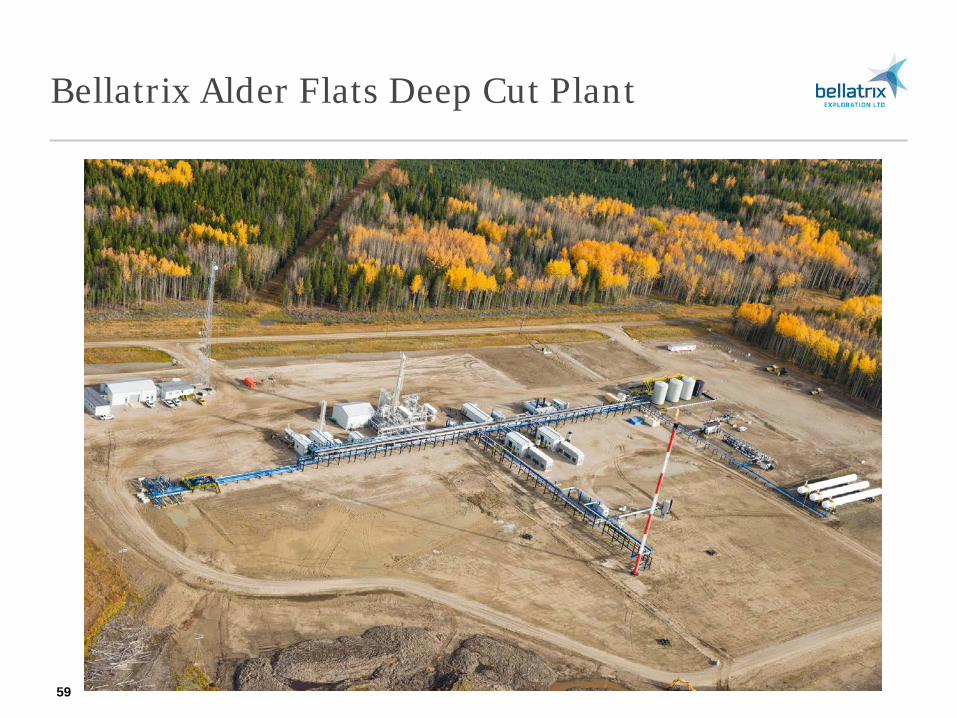
Bellatrix Alder Flats Deep Cut Plant
59
Bellatrix Alder Flats Deep Cut Plant
60
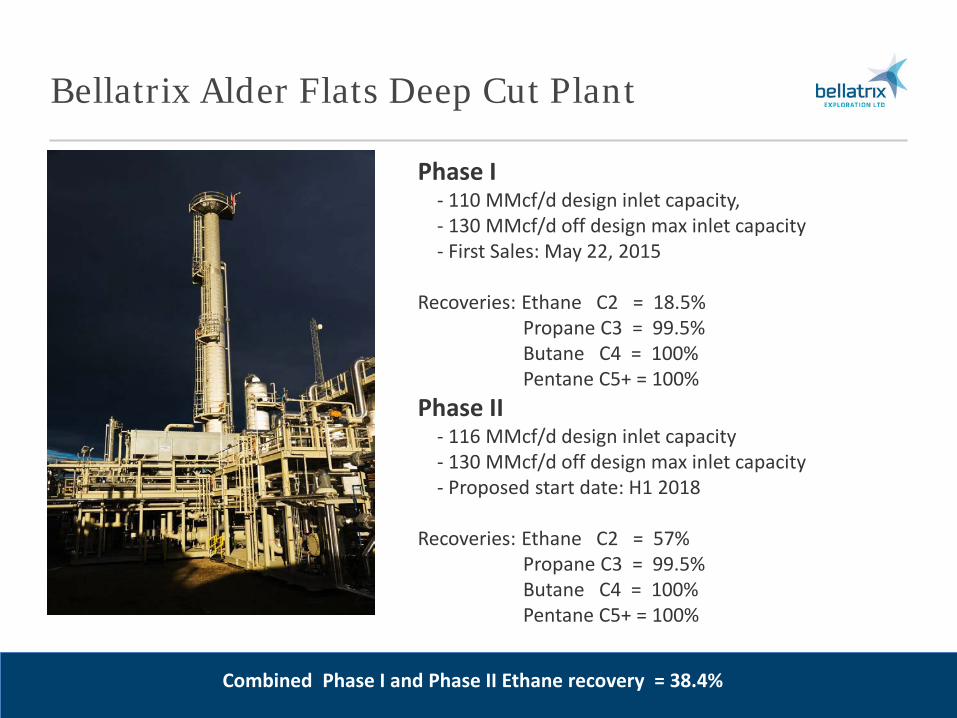
Phase I - 110 MMcf/d design inlet capacity, - 130 MMcf/d off design max inlet capacity - First Sales: May 22, 2015 Recoveries: Ethane C2 = 18.5% Propane C3 = 99.5% Butane C4 = 100% Pentane C5+ = 100% Phase II - 116 MMcf/d design inlet capacity - 130 MMcf/d off design max inlet capacity - Proposed start date: H1 2018 Recoveries: Ethane C2 = 57% Propane C3 = 99.5% Butane C4 = 100% Pentane C5+ = 100%
Combined Phase I and Phase II Ethane recovery = 38.4%
Phase 2 Progressing
61
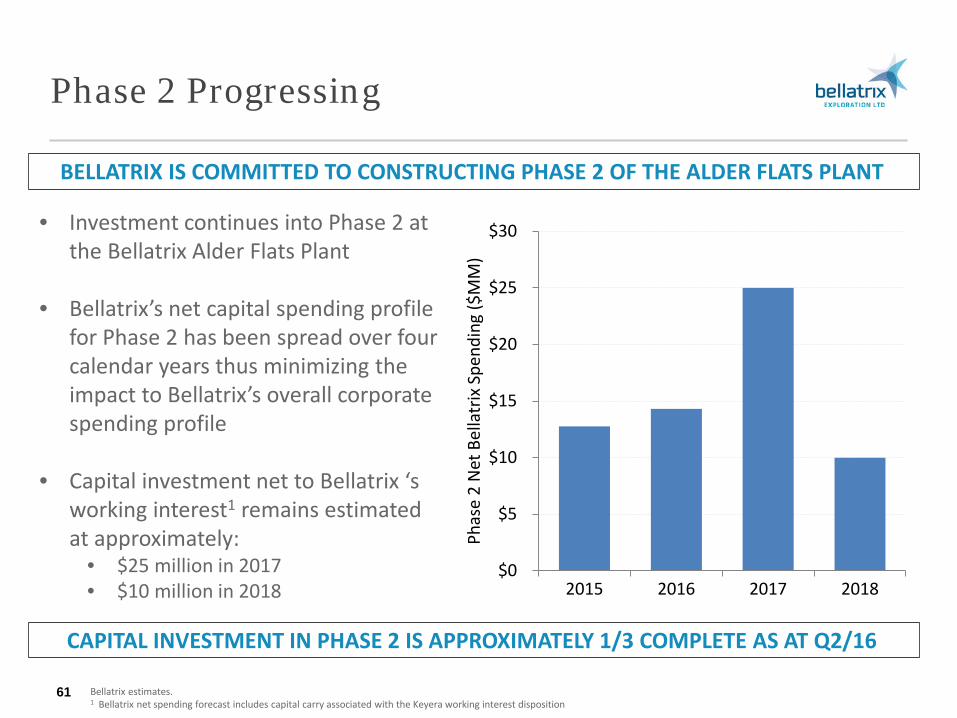
BELLATRIX IS COMMITTED TO CONSTRUCTING PHASE 2 OF THE ALDER FLATS PLANT
• Investment continues into Phase 2 at the Bellatrix Alder Flats Plant
• Bellatrix’s net capital spending profile for Phase 2 has been spread over four calendar years thus minimizing the impact to Bellatrix’s overall corporate spending profile
• Capital investment net to Bellatrix ‘s working interest1 remains estimated at approximately:
• $25 million in 2017 • $10 million in 2018
$0
$5
$10
$15
$20
$25
$30
2015 2016 2017 2018
Phas
e 2
Net
Bel
latr
ix S
pend
ing
($M
M)
CAPITAL INVESTMENT IN PHASE 2 IS APPROXIMATELY 1/3 COMPLETE AS AT Q2/16
Bellatrix estimates. 1 Bellatrix net spending forecast includes capital carry associated with the Keyera working interest disposition
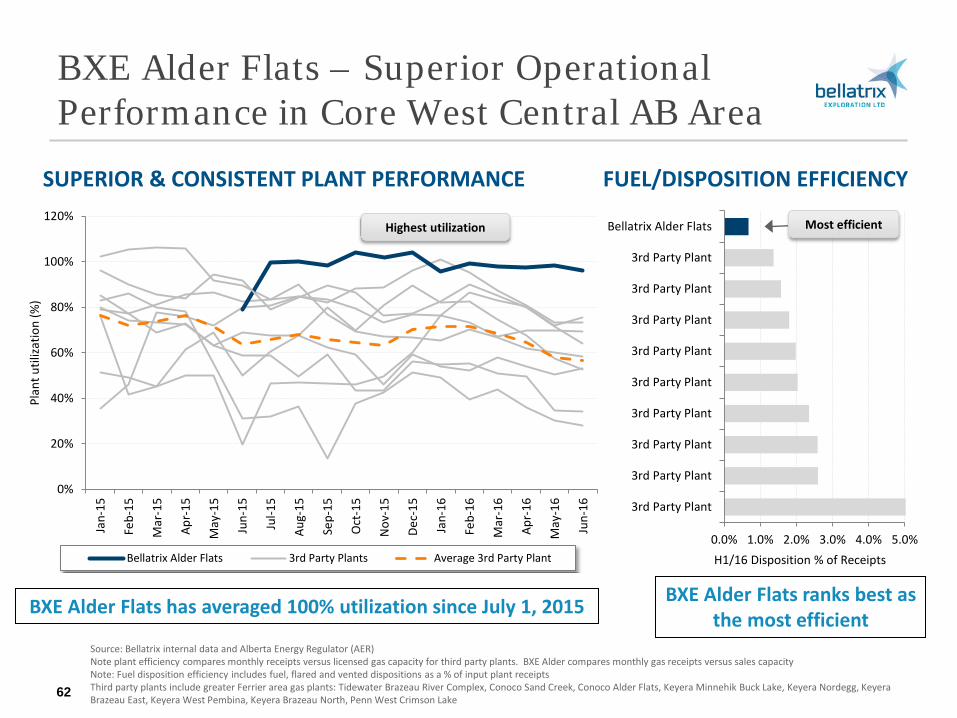
BXE Alder Flats – Superior Operational Performance in Core West Central AB Area
SUPERIOR & CONSISTENT PLANT PERFORMANCE
62
BXE Alder Flats ranks best as the most efficient
FUEL/DISPOSITION EFFICIENCY
Source: Bellatrix internal data and Alberta Energy Regulator (AER) Note plant efficiency compares monthly receipts versus licensed gas capacity for third party plants. BXE Alder compares monthly gas receipts versus sales capacity Note: Fuel disposition efficiency includes fuel, flared and vented dispositions as a % of input plant receipts Third party plants include greater Ferrier area gas plants: Tidewater Brazeau River Complex, Conoco Sand Creek, Conoco Alder Flats, Keyera Minnehik Buck Lake, Keyera Nordegg, Keyera Brazeau East, Keyera West Pembina, Keyera Brazeau North, Penn West Crimson Lake
BXE Alder Flats has averaged 100% utilization since July 1, 2015
0.0% 1.0% 2.0% 3.0% 4.0% 5.0%
3rd Party Plant
3rd Party Plant
3rd Party Plant
3rd Party Plant
3rd Party Plant
3rd Party Plant
3rd Party Plant
3rd Party Plant
3rd Party Plant
Bellatrix Alder Flats
H1/16 Disposition % of Receipts
Most efficient
0%
20%
40%
60%
80%
100%
120%
Jan-
15
Feb-
15
Mar
-15
Apr-
15
May
-15
Jun-
15
Jul-1
5
Aug-
15
Sep-
15
Oct
-15
Nov
-15
Dec-
15
Jan-
16
Feb-
16
Mar
-16
Apr-
16
May
-16
Jun-
16
Plan
t util
izatio
n (%
)
Bellatrix Alder Flats 3rd Party Plants Average 3rd Party Plant
Highest utilization
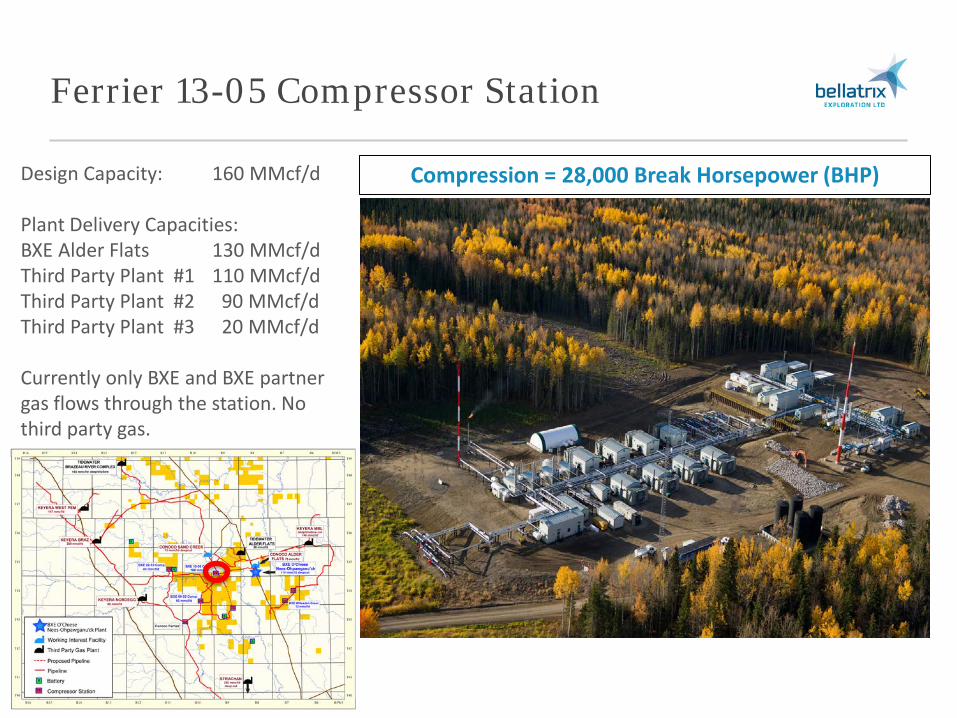
Ferrier 13-05 Compressor Station
63
Design Capacity: 160 MMcf/d Plant Delivery Capacities: BXE Alder Flats 130 MMcf/d Third Party Plant #1 110 MMcf/d Third Party Plant #2 90 MMcf/d Third Party Plant #3 20 MMcf/d Currently only BXE and BXE partner gas flows through the station. No third party gas.
Compression = 28,000 Break Horsepower (BHP)
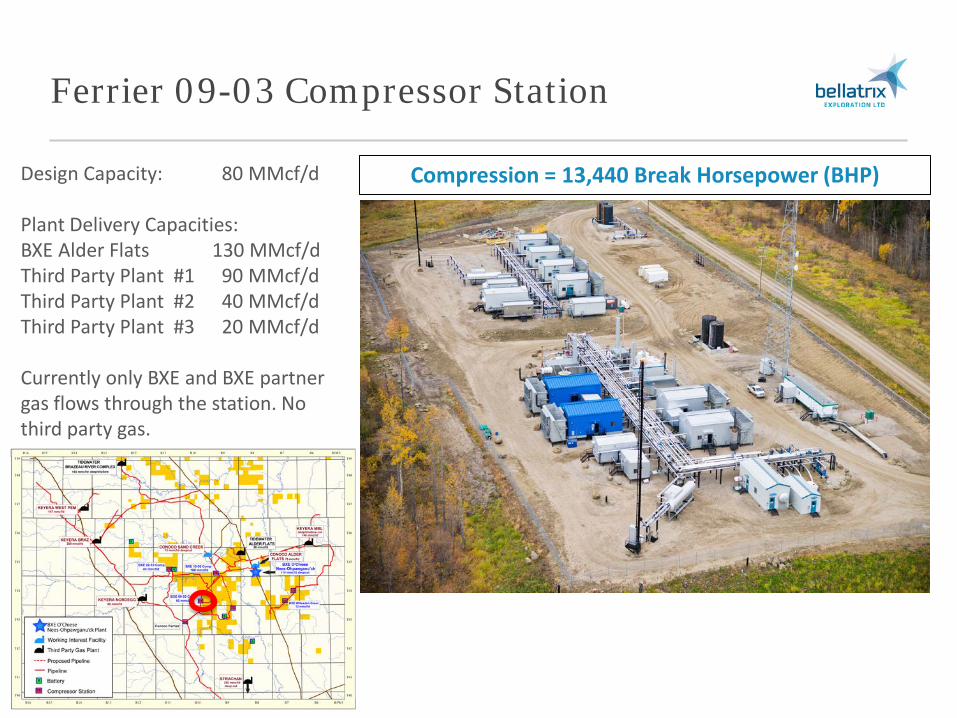
Ferrier 09-03 Compressor Station
64
Design Capacity: 80 MMcf/d Plant Delivery Capacities: BXE Alder Flats 130 MMcf/d Third Party Plant #1 90 MMcf/d Third Party Plant #2 40 MMcf/d Third Party Plant #3 20 MMcf/d Currently only BXE and BXE partner gas flows through the station. No third party gas.
Compression = 13,440 Break Horsepower (BHP)
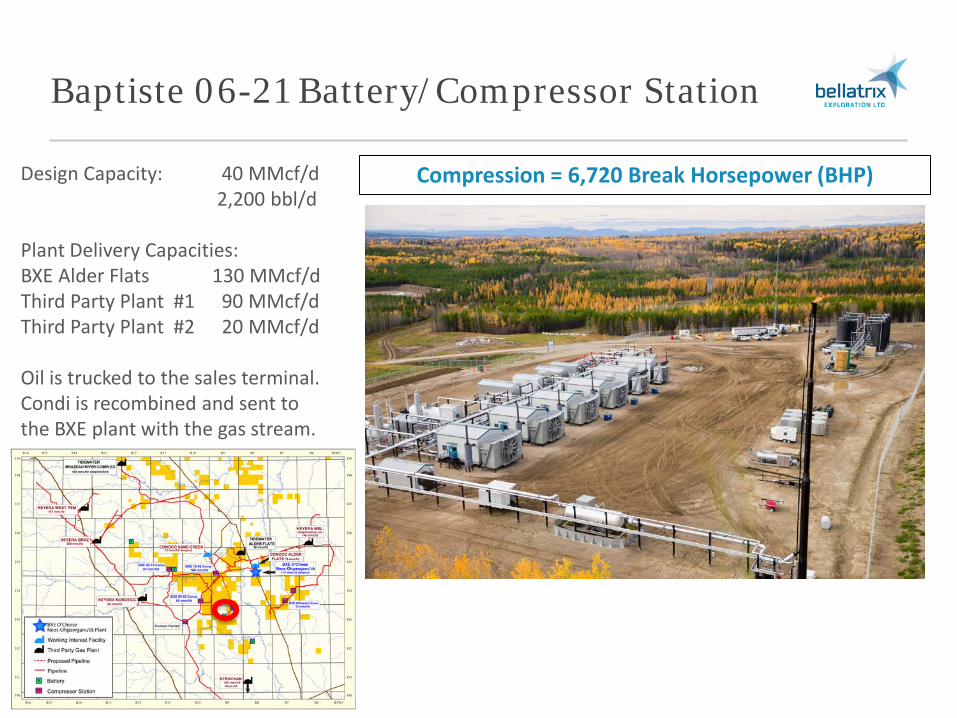
Baptiste 06-21 Battery/Compressor Station
65
Compression = 6,720 Break Horsepower (BHP) Design Capacity: 40 MMcf/d 2,200 bbl/d Plant Delivery Capacities: BXE Alder Flats 130 MMcf/d Third Party Plant #1 90 MMcf/d Third Party Plant #2 20 MMcf/d Oil is trucked to the sales terminal. Condi is recombined and sent to the BXE plant with the gas stream.
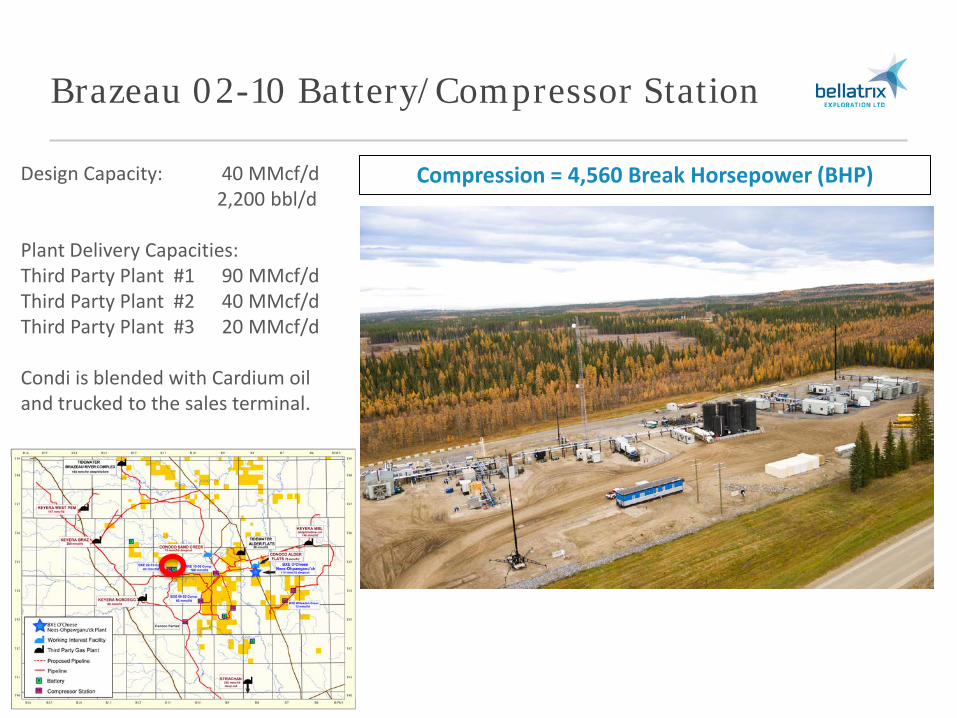
Brazeau 02-10 Battery/Compressor Station
66
Compression = 4,560 Break Horsepower (BHP) Design Capacity: 40 MMcf/d 2,200 bbl/d Plant Delivery Capacities: Third Party Plant #1 90 MMcf/d Third Party Plant #2 40 MMcf/d Third Party Plant #3 20 MMcf/d Condi is blended with Cardium oil and trucked to the sales terminal.
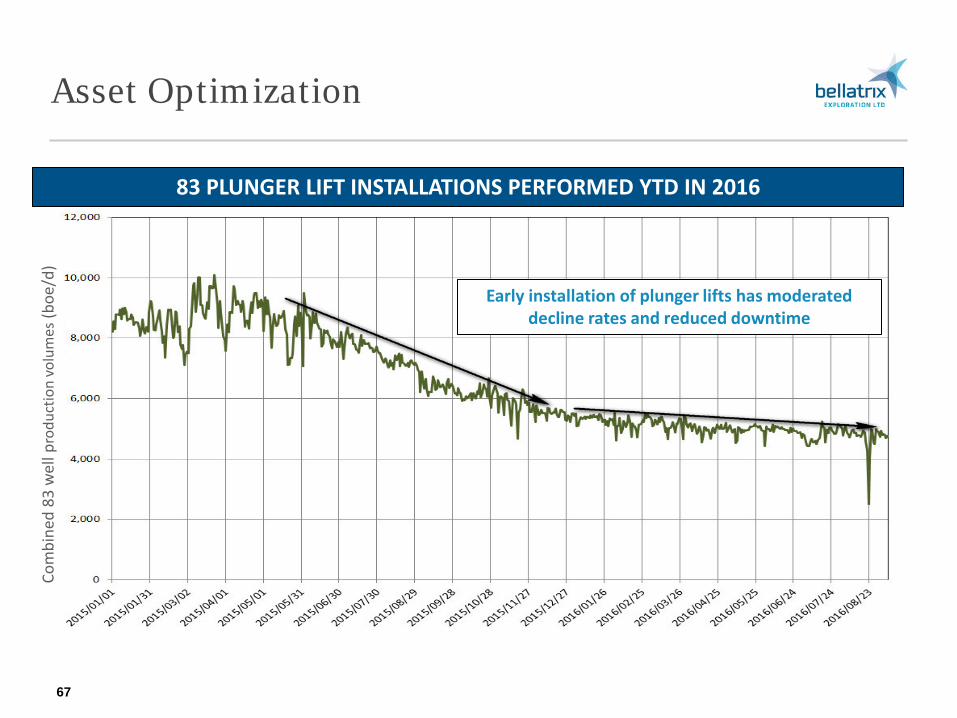
Asset Optimization
67
Early installation of plunger lifts has moderated decline rates and reduced downtime
83 PLUNGER LIFT INSTALLATIONS PERFORMED YTD IN 2016
Com
bine
d 83
wel
l pro
duct
ion
volu
mes
(boe
/d)
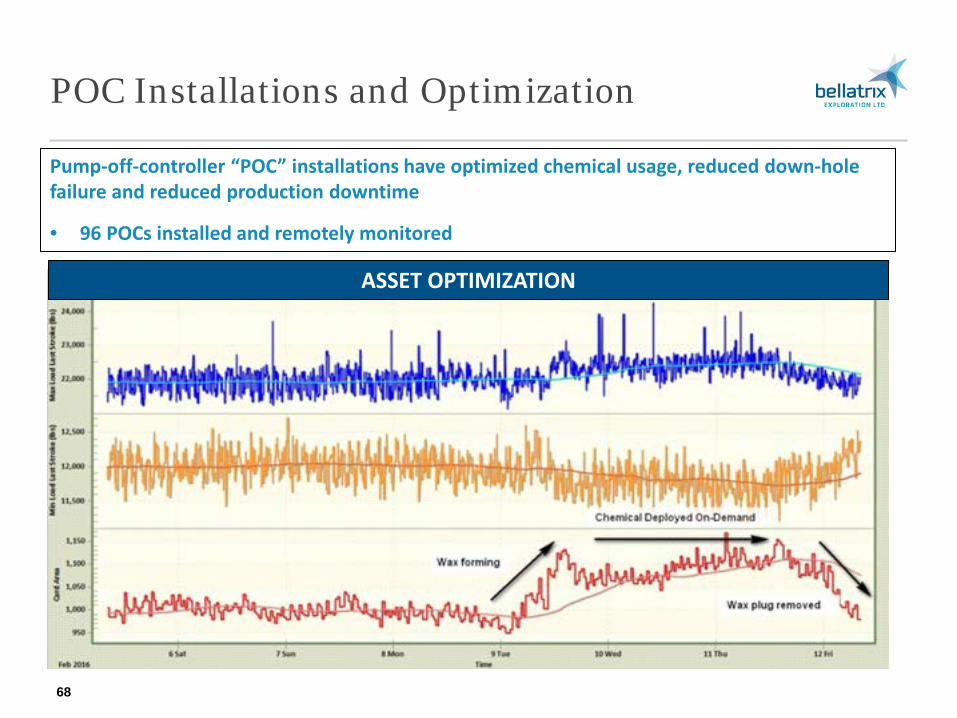
POC Installations and Optimization
68
ASSET OPTIMIZATION
Pump-off-controller “POC” installations have optimized chemical usage, reduced down-hole failure and reduced production downtime
• 96 POCs installed and remotely monitored
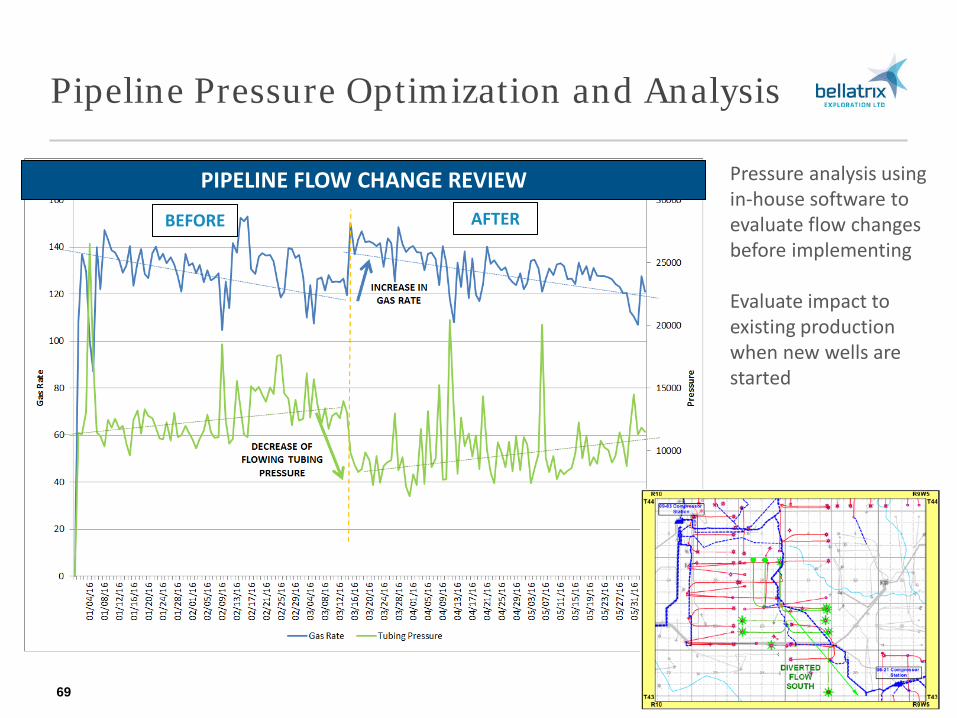
Pipeline Pressure Optimization and Analysis
69
PIPELINE FLOW CHANGE REVIEW
BEFORE AFTER
Pressure analysis using in-house software to evaluate flow changes before implementing Evaluate impact to existing production when new wells are started

Historical Performance & Outlook
Analyst Update Presentation Themes
71 Long term shareholder value creation
TRANSFORMATIONAL DELEVERAGING ACHIEVED IN 2016
REPOSITIONED FOR GROWTH
TOP TIER ASSETS PROVIDE OPTIONALITY FOR BOTH OIL & NATURAL GAS INVESTMENT
MEANINGFUL EQUITY VALUE PROPOSITION
25
42 42
6755
104
124
211
161
250
144
223
0.0
0.2
0.4
0.6
0.8
1.0
1.2
1.4
0
20
40
60
80
100
120
140
160
180
200
220
240
260
Prov
ed P+P
Prov
ed P+P
Prov
ed P+P
Prov
ed P+P
Prov
ed P+P
Prov
ed P+P
2010 2011 2012 2013 2014 2015
Rese
rves
per
yea
r end
shar
e (b
oe/s
hare
)
Rese
rves
(MM
boe)
Natural Gas Oil and Liquids Reserves per share (right side)
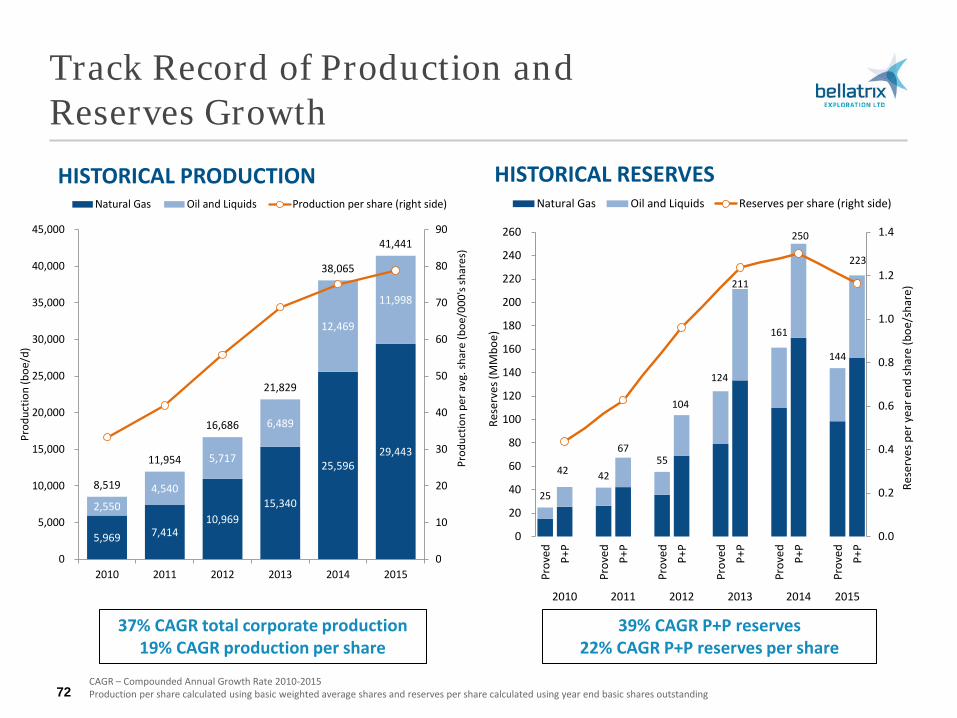
Track Record of Production and Reserves Growth
HISTORICAL PRODUCTION HISTORICAL RESERVES
CAGR – Compounded Annual Growth Rate 2010-2015 Production per share calculated using basic weighted average shares and reserves per share calculated using year end basic shares outstanding 72
37% CAGR total corporate production 19% CAGR production per share
39% CAGR P+P reserves 22% CAGR P+P reserves per share
5,969 7,41410,969
15,340
25,59629,443
2,5504,540
5,717
6,489
12,469
11,998
8,519
11,954
16,686
21,829
38,065
41,441
0
10
20
30
40
50
60
70
80
90
0
5,000
10,000
15,000
20,000
25,000
30,000
35,000
40,000
45,000
2010 2011 2012 2013 2014 2015
Prod
uctio
n pe
r avg
. sha
re (b
oe/0
00's
shar
es)
Prod
uctio
n (b
oe/d
)
Natural Gas Oil and Liquids Production per share (right side)
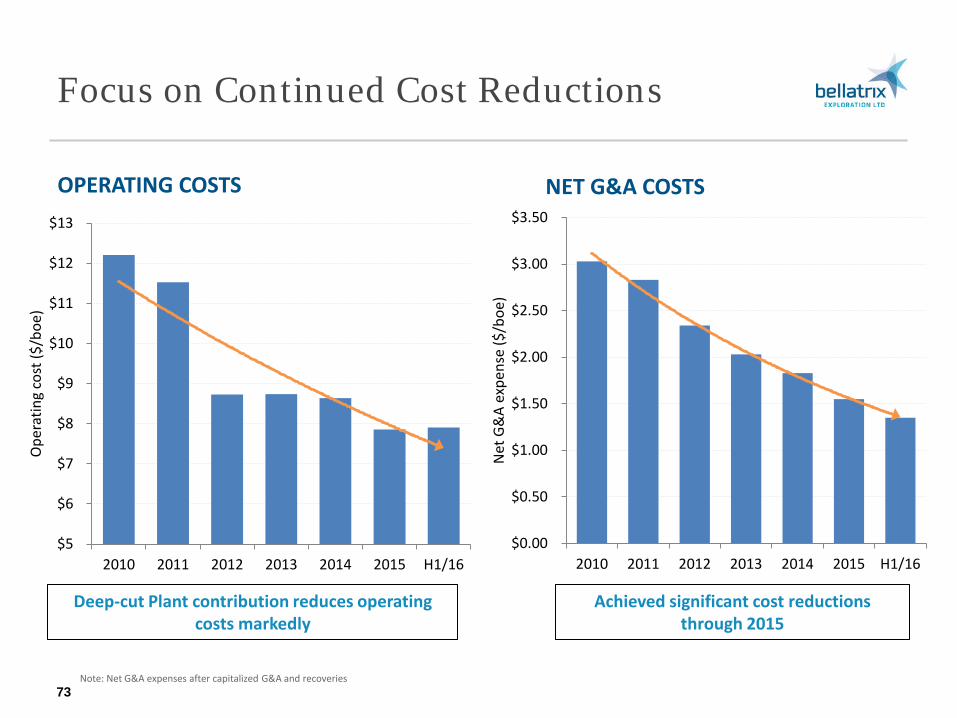
OPERATING COSTS NET G&A COSTS
Deep-cut Plant contribution reduces operating costs markedly
Achieved significant cost reductions through 2015
Note: Net G&A expenses after capitalized G&A and recoveries
73
Focus on Continued Cost Reductions
$0.00
$0.50
$1.00
$1.50
$2.00
$2.50
$3.00
$3.50
2010 2011 2012 2013 2014 2015 H1/16
Net
G&
A ex
pens
e ($
/boe
)
$5
$6
$7
$8
$9
$10
$11
$12
$13
2010 2011 2012 2013 2014 2015 H1/16
Ope
ratin
g co
st ($
/boe
)
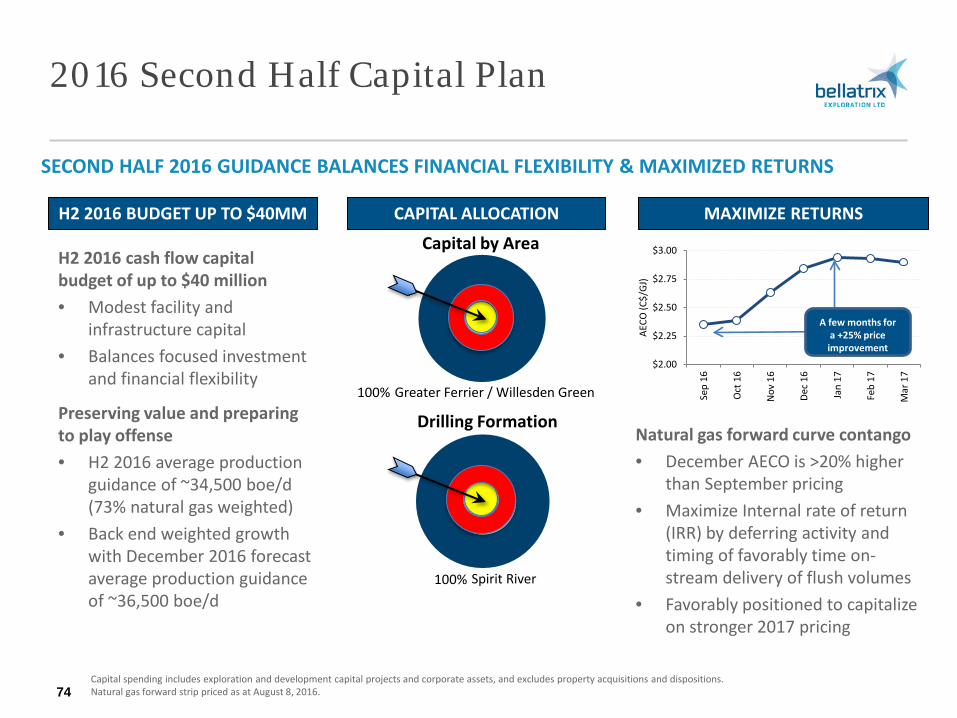
2016 Second Half Capital Plan
Capital spending includes exploration and development capital projects and corporate assets, and excludes property acquisitions and dispositions. Natural gas forward strip priced as at August 8, 2016. 74
SECOND HALF 2016 GUIDANCE BALANCES FINANCIAL FLEXIBILITY & MAXIMIZED RETURNS
H2 2016 BUDGET UP TO $40MM CAPITAL ALLOCATION MAXIMIZE RETURNS
Natural gas forward curve contango • December AECO is >20% higher
than September pricing • Maximize Internal rate of return
(IRR) by deferring activity and timing of favorably time on-stream delivery of flush volumes
• Favorably positioned to capitalize on stronger 2017 pricing
Capital by Area
Greater Ferrier / Willesden Green
Drilling Formation
Spirit River
100%
100%
H2 2016 cash flow capital budget of up to $40 million • Modest facility and
infrastructure capital • Balances focused investment
and financial flexibility
Preserving value and preparing to play offense • H2 2016 average production
guidance of ~34,500 boe/d (73% natural gas weighted)
• Back end weighted growth with December 2016 forecast average production guidance of ~36,500 boe/d
$2.00
$2.25
$2.50
$2.75
$3.00
Sep
16
Oct
16
Nov
16
Dec
16
Jan
17
Feb
17
Mar
17
AECO
(C$/
GJ)
A few months for a +25% price improvement
Capital Allocation & Balanced Opportunity Set
75
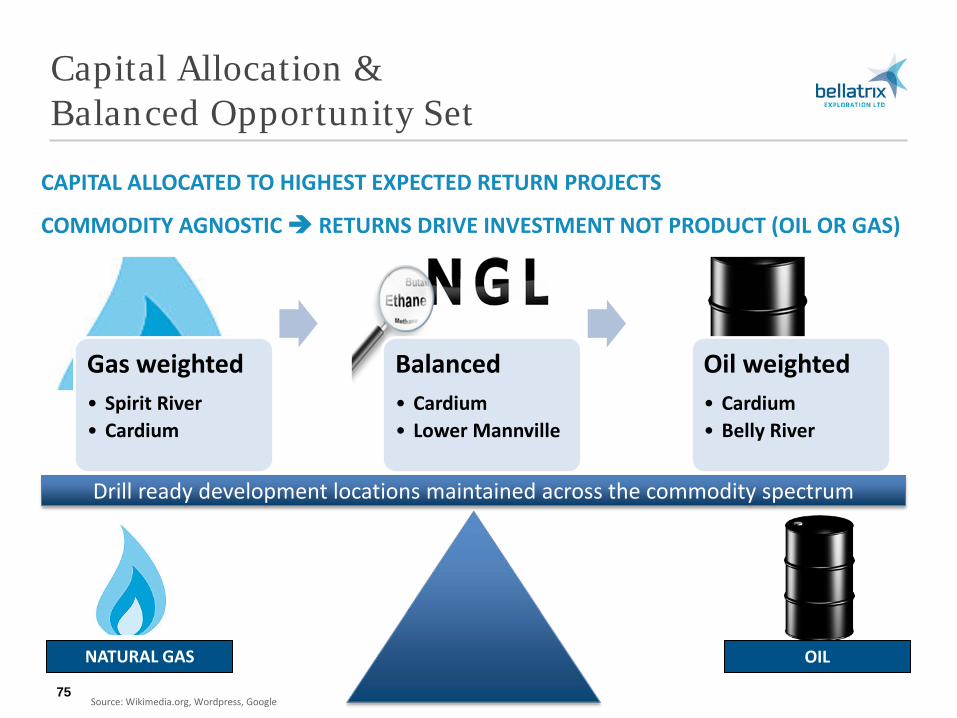
Drill ready development locations maintained across the commodity spectrum
CAPITAL ALLOCATED TO HIGHEST EXPECTED RETURN PROJECTS
COMMODITY AGNOSTIC RETURNS DRIVE INVESTMENT NOT PRODUCT (OIL OR GAS)
OIL NATURAL GAS
Source: Wikimedia.org, Wordpress, Google
Gas weighted • Spirit River • Cardium
Balanced • Cardium • Lower Mannville
Oil weighted • Cardium • Belly River
Long Term Value Enhancing Opportunities
76
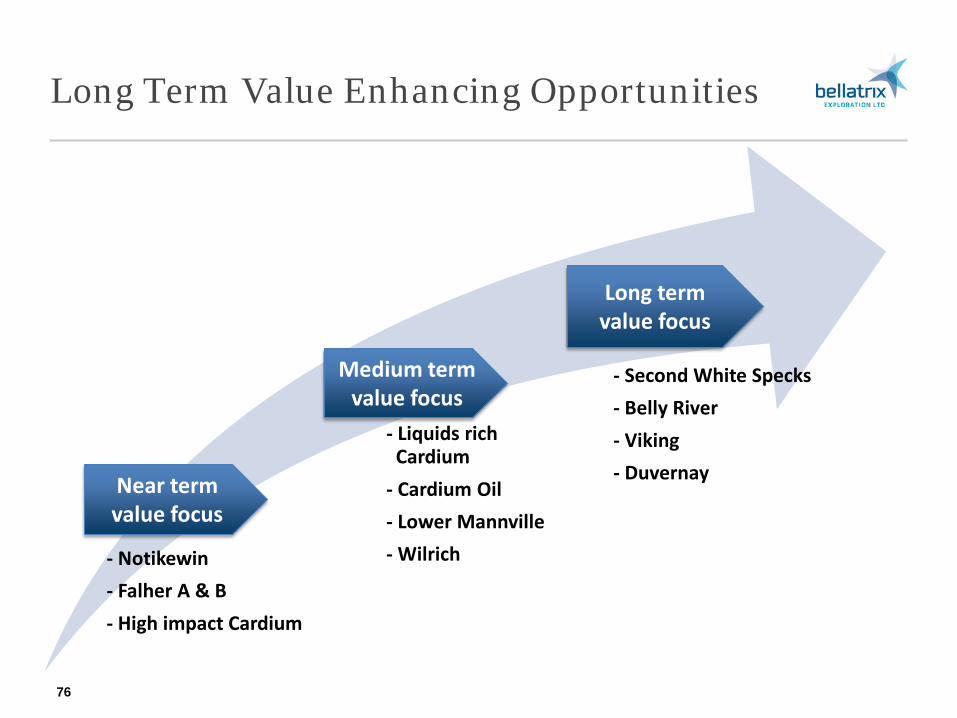
- Notikewin - Falher A & B - High impact Cardium
- Liquids rich Cardium
- Cardium Oil - Lower Mannville - Wilrich
- Second White Specks - Belly River - Viking - Duvernay Near term
value focus
Medium term value focus
Long term value focus
Corporate Responsibility
77
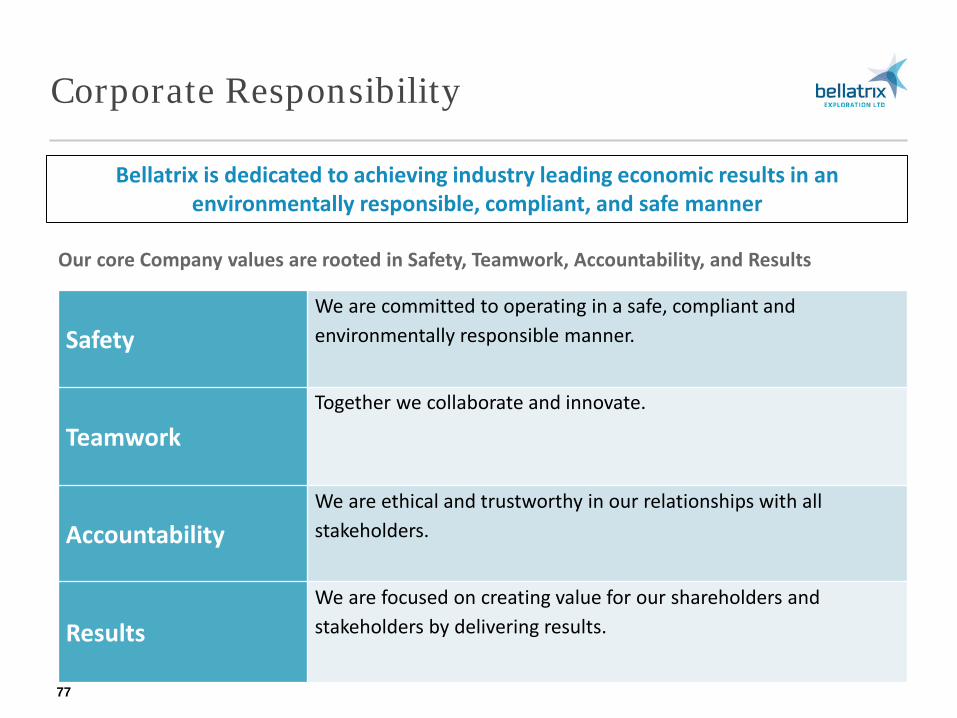
Bellatrix is dedicated to achieving industry leading economic results in an environmentally responsible, compliant, and safe manner
Safety We are committed to operating in a safe, compliant and environmentally responsible manner.
Teamwork Together we collaborate and innovate.
Accountability We are ethical and trustworthy in our relationships with all stakeholders.
Results We are focused on creating value for our shareholders and stakeholders by delivering results.
Our core Company values are rooted in Safety, Teamwork, Accountability, and Results
Responsibility & Oversight
78
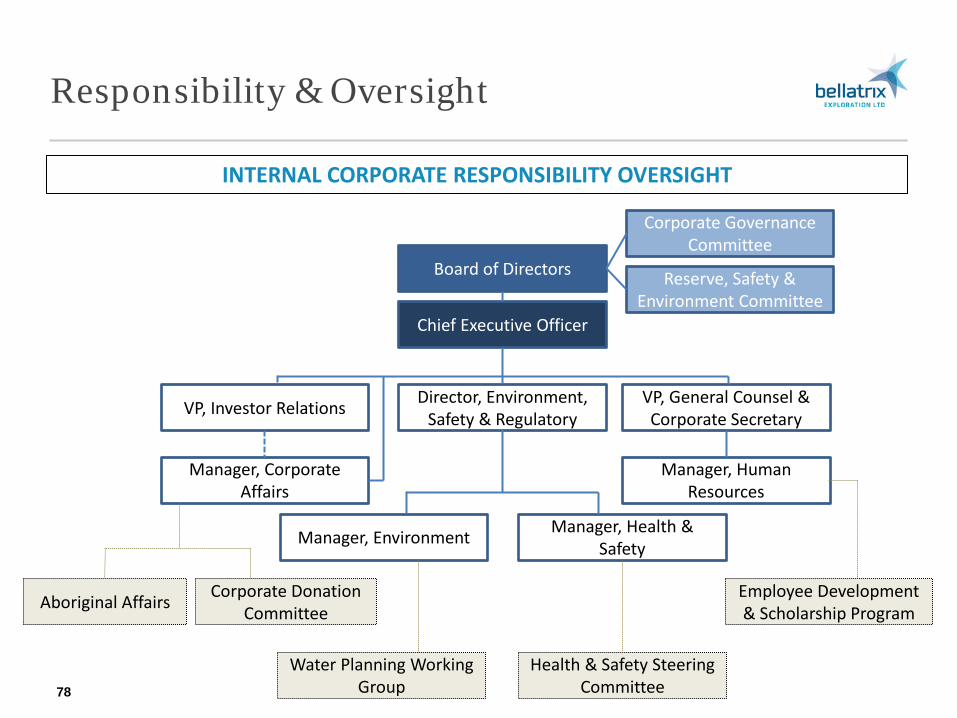
INTERNAL CORPORATE RESPONSIBILITY OVERSIGHT
Board of Directors Reserve, Safety & Environment Committee
Chief Executive Officer
Director, Environment, Safety & Regulatory
Manager, Corporate Affairs
VP, Investor Relations VP, General Counsel & Corporate Secretary
Manager, Human Resources
Manager, Environment Manager, Health & Safety
Water Planning Working Group
Health & Safety Steering Committee
Corporate Donation Committee
Employee Development & Scholarship Program Aboriginal Affairs
Corporate Governance Committee
Stakeholder Engagement
79
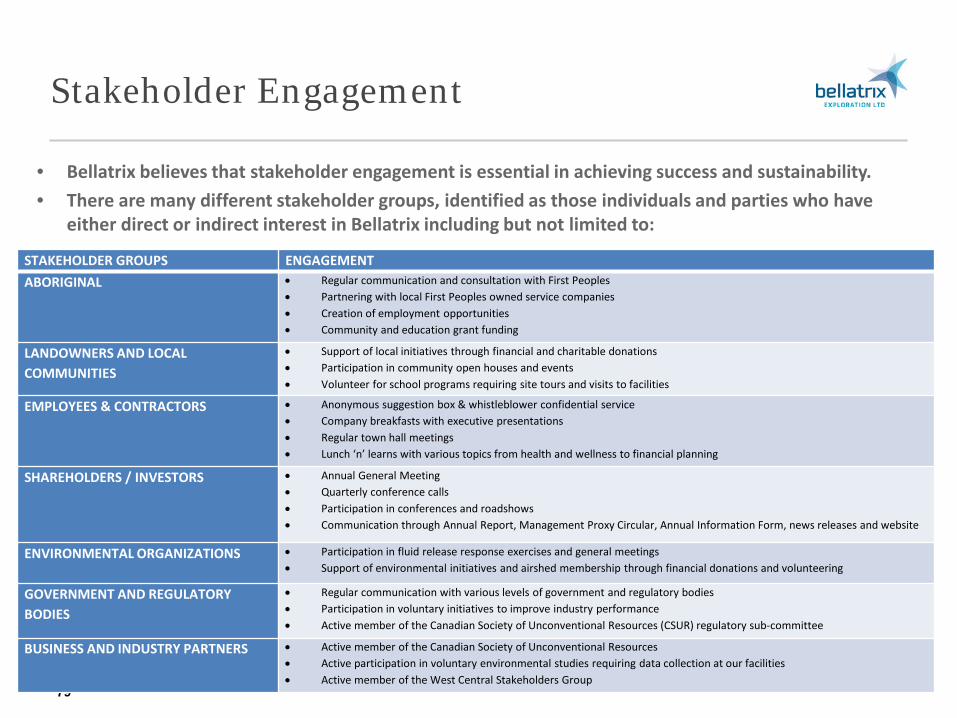
• Bellatrix believes that stakeholder engagement is essential in achieving success and sustainability. • There are many different stakeholder groups, identified as those individuals and parties who have
either direct or indirect interest in Bellatrix including but not limited to:
STAKEHOLDER GROUPS ENGAGEMENT ABORIGINAL • Regular communication and consultation with First Peoples
• Partnering with local First Peoples owned service companies • Creation of employment opportunities • Community and education grant funding
LANDOWNERS AND LOCAL COMMUNITIES
• Support of local initiatives through financial and charitable donations • Participation in community open houses and events • Volunteer for school programs requiring site tours and visits to facilities
EMPLOYEES & CONTRACTORS • Anonymous suggestion box & whistleblower confidential service • Company breakfasts with executive presentations • Regular town hall meetings • Lunch ‘n’ learns with various topics from health and wellness to financial planning
SHAREHOLDERS / INVESTORS • Annual General Meeting • Quarterly conference calls • Participation in conferences and roadshows • Communication through Annual Report, Management Proxy Circular, Annual Information Form, news releases and website
ENVIRONMENTAL ORGANIZATIONS • Participation in fluid release response exercises and general meetings • Support of environmental initiatives and airshed membership through financial donations and volunteering
GOVERNMENT AND REGULATORY BODIES
• Regular communication with various levels of government and regulatory bodies • Participation in voluntary initiatives to improve industry performance • Active member of the Canadian Society of Unconventional Resources (CSUR) regulatory sub-committee
BUSINESS AND INDUSTRY PARTNERS • Active member of the Canadian Society of Unconventional Resources • Active participation in voluntary environmental studies requiring data collection at our facilities • Active member of the West Central Stakeholders Group
Strong Liability Management
80
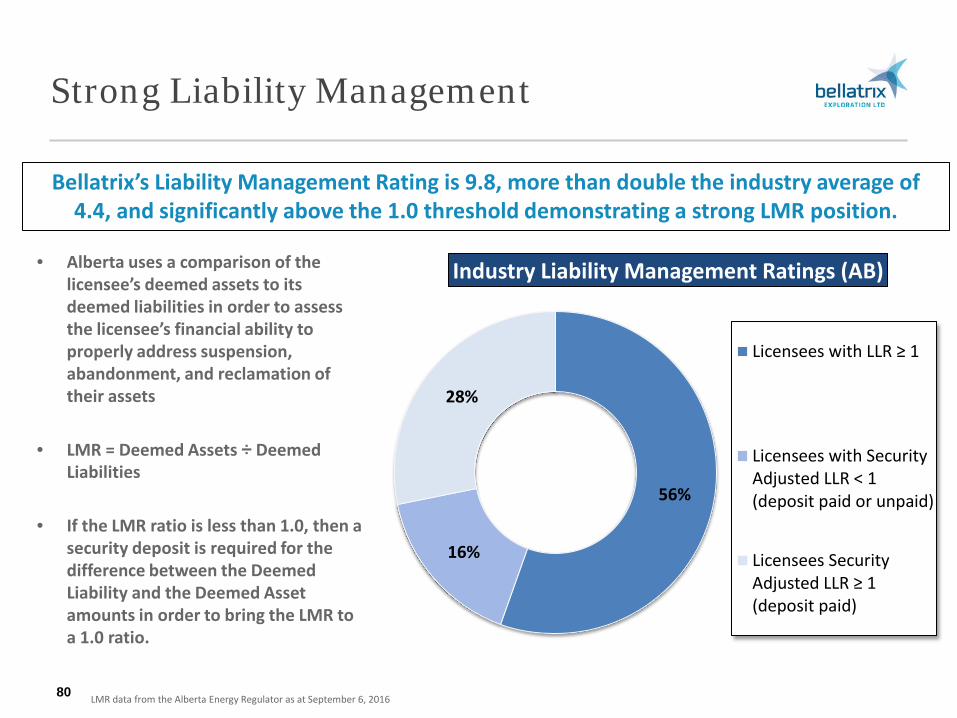
• Alberta uses a comparison of the licensee’s deemed assets to its deemed liabilities in order to assess the licensee’s financial ability to properly address suspension, abandonment, and reclamation of their assets
• LMR = Deemed Assets ÷ Deemed Liabilities
• If the LMR ratio is less than 1.0, then a security deposit is required for the difference between the Deemed Liability and the Deemed Asset amounts in order to bring the LMR to a 1.0 ratio.
Bellatrix’s Liability Management Rating is 9.8, more than double the industry average of 4.4, and significantly above the 1.0 threshold demonstrating a strong LMR position.
LMR data from the Alberta Energy Regulator as at September 6, 2016
56%
16%
28%
Industry Liability Management Ratings (AB)
Licensees with LLR ≥ 1
Licensees with SecurityAdjusted LLR < 1(deposit paid or unpaid)
Licensees Security Adjusted LLR ≥ 1 (deposit paid)
Compelling Equity Value Proposition
81
0.0x
2.0x
4.0x
6.0x
8.0x
10.0x
12.0x
14.0x
Peer Peer BXE Peer Peer Peer Peer Peer Peer Peer Peer Peer Peer Peer Peer Peer Peer Peer Peer
2017
E EV
/DAC
F
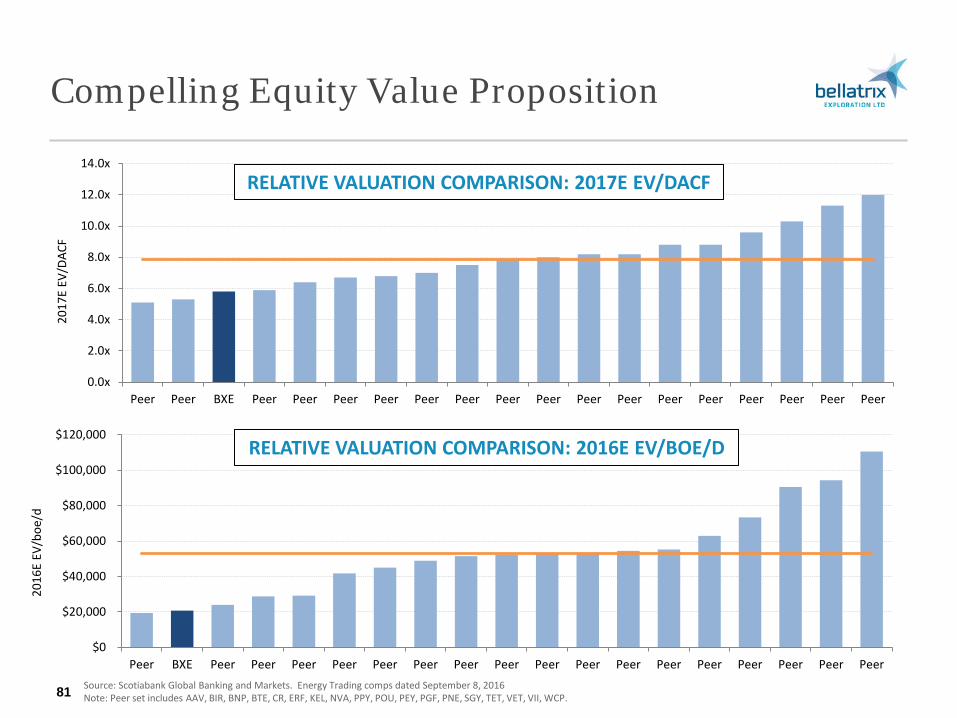
RELATIVE VALUATION COMPARISON: 2017E EV/DACF
Source: Scotiabank Global Banking and Markets. Energy Trading comps dated September 8, 2016 Note: Peer set includes AAV, BIR, BNP, BTE, CR, ERF, KEL, NVA, PPY, POU, PEY, PGF, PNE, SGY, TET, VET, VII, WCP.
$0
$20,000
$40,000
$60,000
$80,000
$100,000
$120,000
Peer BXE Peer Peer Peer Peer Peer Peer Peer Peer Peer Peer Peer Peer Peer Peer Peer Peer Peer
2016
E EV
/boe
/d
RELATIVE VALUATION COMPARISON: 2016E EV/BOE/D
$0.00
$5.00
$10.00
$15.00
$20.00
$25.00
$30.00
$35.00
Peer Peer Peer BXE Peer Peer Peer Peer Peer Peer Peer Peer Peer Peer Peer Peer Peer Peer Peer
EV/$
boe
(2P)
0%
50%
100%
150%
200%
250%
300%
350%
400%
Peer BXE Peer Peer Peer Peer Peer Peer Peer Peer Peer Peer Peer Peer Peer Peer Peer Peer Peer
P/N
AV (2
P)
Compelling Equity Value Proposition
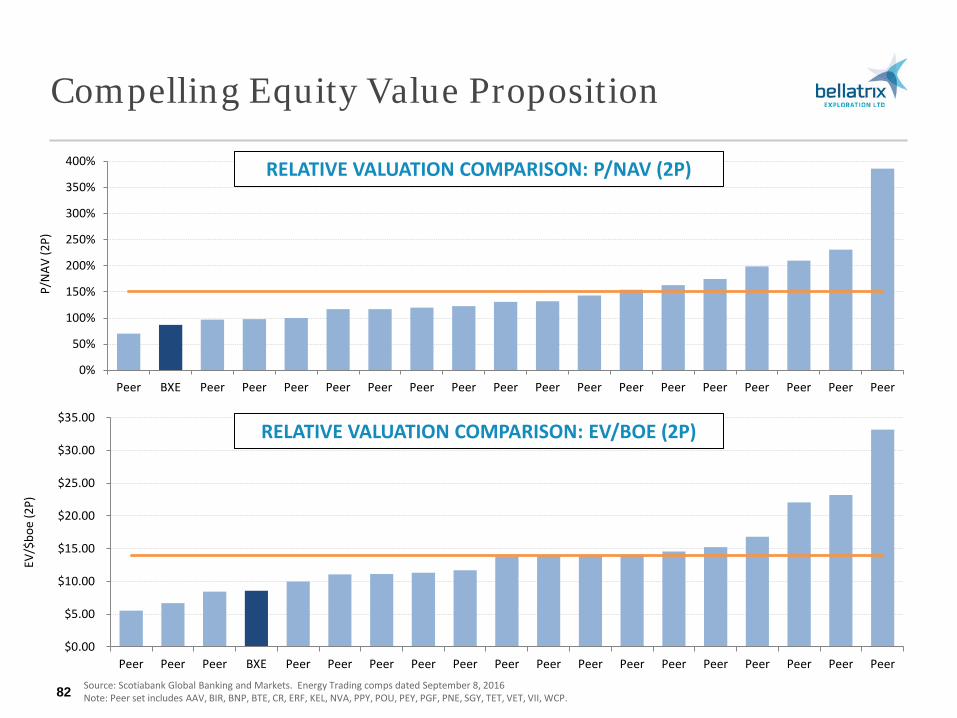
82 Source: Scotiabank Global Banking and Markets. Energy Trading comps dated September 8, 2016 Note: Peer set includes AAV, BIR, BNP, BTE, CR, ERF, KEL, NVA, PPY, POU, PEY, PGF, PNE, SGY, TET, VET, VII, WCP.
RELATIVE VALUATION COMPARISON: P/NAV (2P)
RELATIVE VALUATION COMPARISON: EV/BOE (2P)
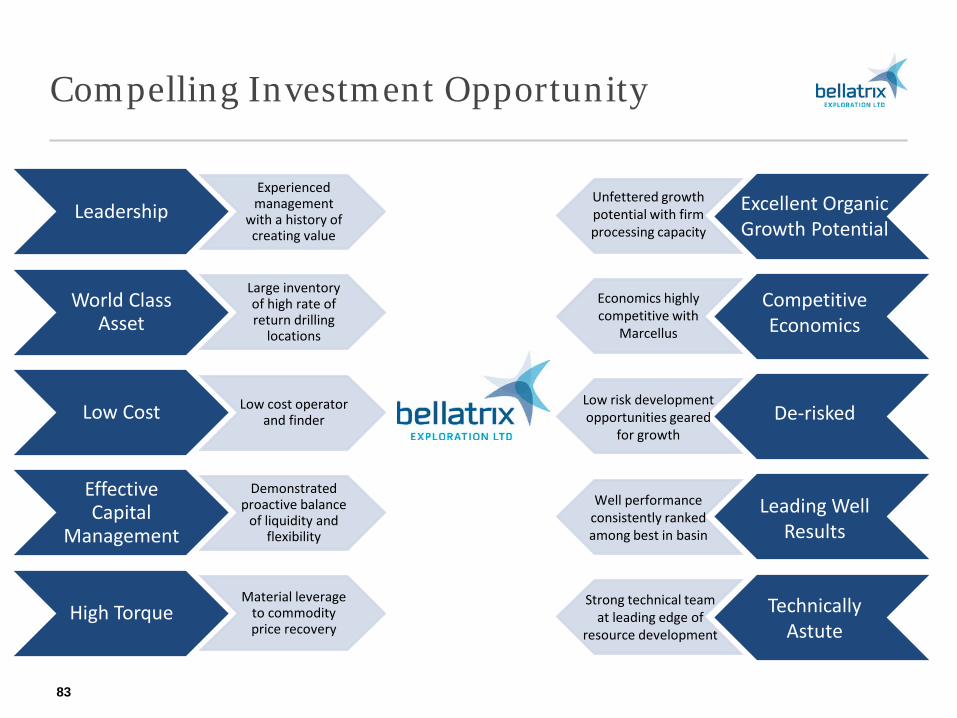
Compelling Investment Opportunity
83
Leadership Experienced management
with a history of creating value
World Class Asset
Large inventory of high rate of return drilling
locations
Low Cost Low cost operator and finder
Effective Capital
Management
Demonstrated proactive balance
of liquidity and flexibility
High Torque Material leverage
to commodity price recovery
Excellent Organic Growth Potential
Competitive Economics
De-risked
Leading Well Results
Technically Astute
Unfettered growth potential with firm processing capacity
Economics highly competitive with
Marcellus
Low risk development opportunities geared
for growth
Well performance consistently ranked among best in basin
Strong technical team at leading edge of
resource development
Supplemental Information
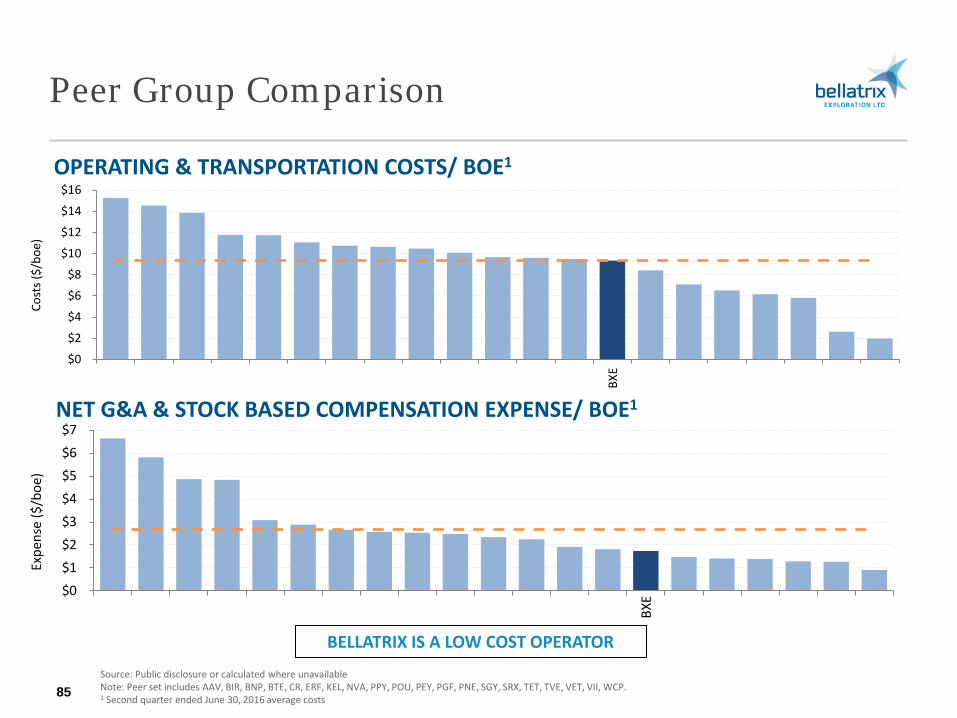
Peer Group Comparison
OPERATING & TRANSPORTATION COSTS/ BOE1
NET G&A & STOCK BASED COMPENSATION EXPENSE/ BOE1
Source: Public disclosure or calculated where unavailable Note: Peer set includes AAV, BIR, BNP, BTE, CR, ERF, KEL, NVA, PPY, POU, PEY, PGF, PNE, SGY, SRX, TET, TVE, VET, VII, WCP. 1 Second quarter ended June 30, 2016 average costs 85
BELLATRIX IS A LOW COST OPERATOR
$0
$2
$4
$6
$8
$10
$12
$14
$16
BXE
Cost
s ($/
boe)
$0$1$2$3$4$5$6$7
BXE
Expe
nse
($/b
oe)
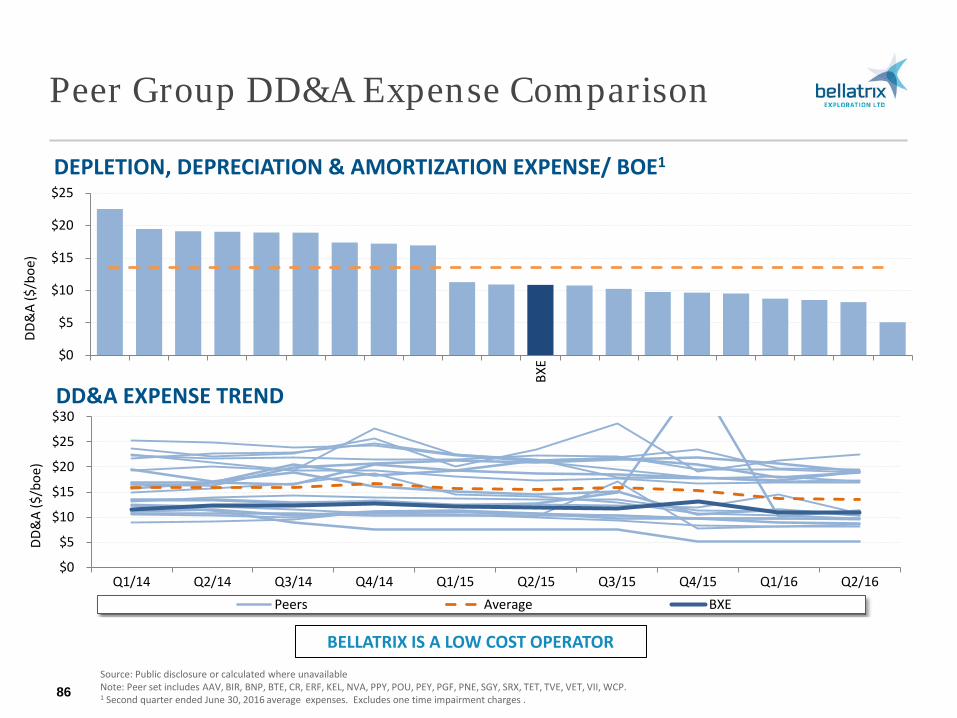
Peer Group DD&A Expense Comparison
DEPLETION, DEPRECIATION & AMORTIZATION EXPENSE/ BOE1
DD&A EXPENSE TREND
Source: Public disclosure or calculated where unavailable Note: Peer set includes AAV, BIR, BNP, BTE, CR, ERF, KEL, NVA, PPY, POU, PEY, PGF, PNE, SGY, SRX, TET, TVE, VET, VII, WCP. 1 Second quarter ended June 30, 2016 average expenses. Excludes one time impairment charges . 86
BELLATRIX IS A LOW COST OPERATOR
$0
$5
$10
$15
$20
$25
BXE
DD&
A ($
/boe
)
$0
$5
$10
$15
$20
$25
$30
Q1/14 Q2/14 Q3/14 Q4/14 Q1/15 Q2/15 Q3/15 Q4/15 Q1/16 Q2/16
DD&
A ($
/boe
)
Peers Average BXE
Joint Ventures
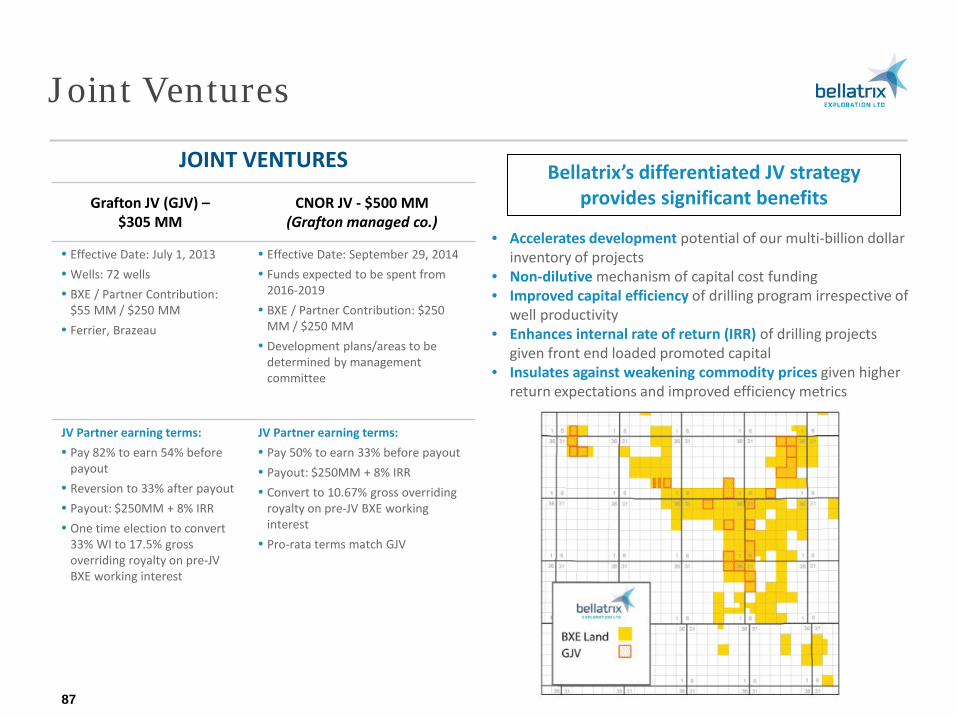
JOINT VENTURES
Grafton JV (GJV) – $305 MM
CNOR JV - $500 MM (Grafton managed co.)
• Effective Date: July 1, 2013 • Wells: 72 wells • BXE / Partner Contribution:
$55 MM / $250 MM • Ferrier, Brazeau
• Effective Date: September 29, 2014 • Funds expected to be spent from
2016-2019 • BXE / Partner Contribution: $250
MM / $250 MM • Development plans/areas to be
determined by management committee
JV Partner earning terms: • Pay 82% to earn 54% before
payout • Reversion to 33% after payout • Payout: $250MM + 8% IRR • One time election to convert
33% WI to 17.5% gross overriding royalty on pre-JV BXE working interest
JV Partner earning terms: • Pay 50% to earn 33% before payout • Payout: $250MM + 8% IRR • Convert to 10.67% gross overriding
royalty on pre-JV BXE working interest
• Pro-rata terms match GJV
87
• Accelerates development potential of our multi-billion dollar inventory of projects
• Non-dilutive mechanism of capital cost funding • Improved capital efficiency of drilling program irrespective of
well productivity • Enhances internal rate of return (IRR) of drilling projects
given front end loaded promoted capital • Insulates against weakening commodity prices given higher
return expectations and improved efficiency metrics
Bellatrix’s differentiated JV strategy provides significant benefits
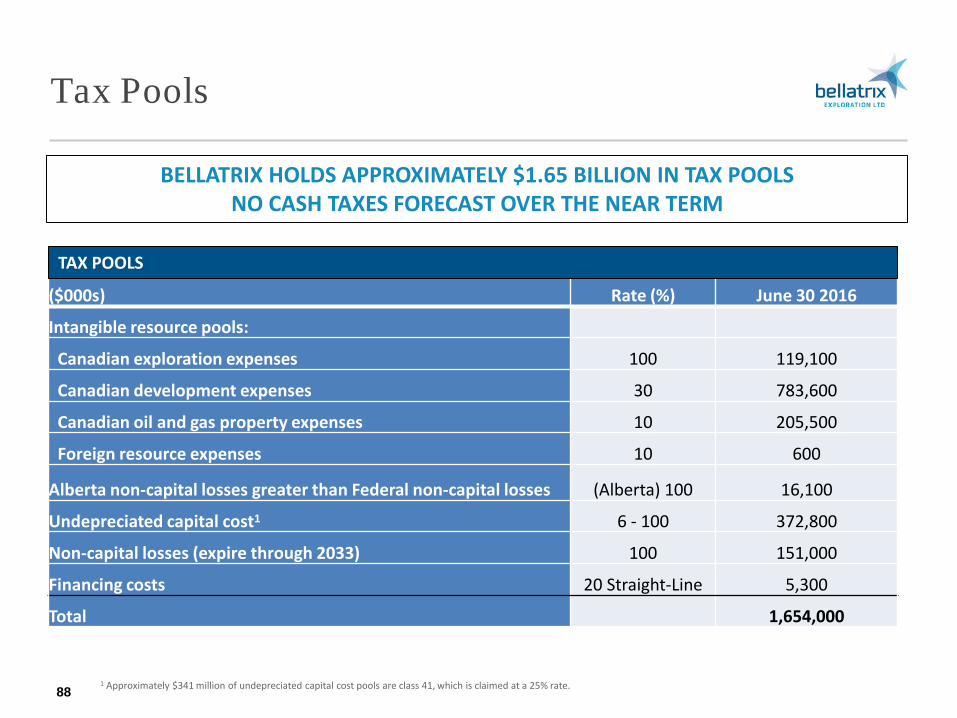
Tax Pools
88
BELLATRIX HOLDS APPROXIMATELY $1.65 BILLION IN TAX POOLS NO CASH TAXES FORECAST OVER THE NEAR TERM
($000s) Rate (%) June 30 2016
Intangible resource pools:
Canadian exploration expenses 100 119,100
Canadian development expenses 30 783,600
Canadian oil and gas property expenses 10 205,500
Foreign resource expenses 10 600
Alberta non-capital losses greater than Federal non-capital losses (Alberta) 100 16,100
Undepreciated capital cost1 6 - 100 372,800
Non-capital losses (expire through 2033) 100 151,000
Financing costs 20 Straight-Line 5,300
Total 1,654,000
TAX POOLS
1 Approximately $341 million of undepreciated capital cost pools are class 41, which is claimed at a 25% rate.
Additional Long Term Opportunities
Cardium Light Oil Resource Play
BXE Cardium Sections 379 Gross 271 Net
BXE Net Drilling Inventory1
141 proved 42 probable 231 unbooked 414 total
Average Lease Operate Expense ~$9.00/boe
Cardium Resource Play Summary Largest accumulation of light oil in the WCSB Approximately 20,000 square miles Approximately 1.9 Billion bbls produced to date Currently producing 140,000 bbl/d & 1.0 Bcf/d
Cardium remains a key focus area for Bellatrix long-term
90 1 Proved and Probable locations as at December 31, 2015. Unbooked locations and acreage as at June 30, 2016
Harmattan
Strachan
Ferrier
Greater Pembina
Willesden Green
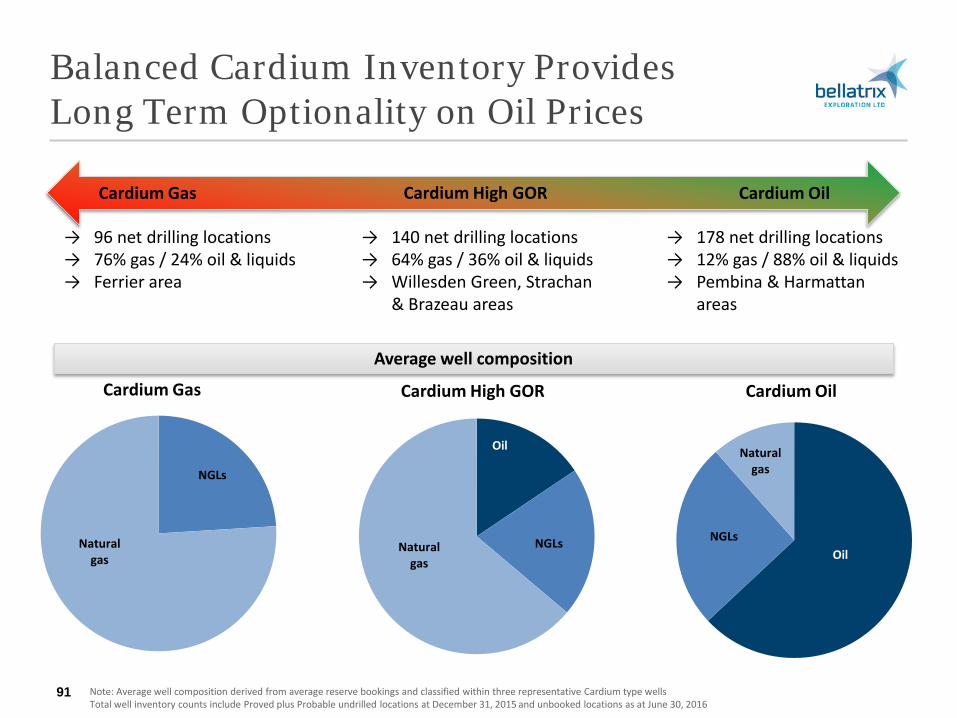
Balanced Cardium Inventory Provides Long Term Optionality on Oil Prices
Note: Average well composition derived from average reserve bookings and classified within three representative Cardium type wells Total well inventory counts include Proved plus Probable undrilled locations at December 31, 2015 and unbooked locations as at June 30, 2016
91
Cardium Gas Cardium High GOR Cardium Oil
Oil NGLs
Natural gas
Oil
NGLs Natural gas
NGLs
Natural gas
Average well composition
Cardium Gas Cardium High GOR Cardium Oil
→ 96 net drilling locations → 76% gas / 24% oil & liquids → Ferrier area
→ 140 net drilling locations → 64% gas / 36% oil & liquids → Willesden Green, Strachan
& Brazeau areas
→ 178 net drilling locations → 12% gas / 88% oil & liquids → Pembina & Harmattan
areas
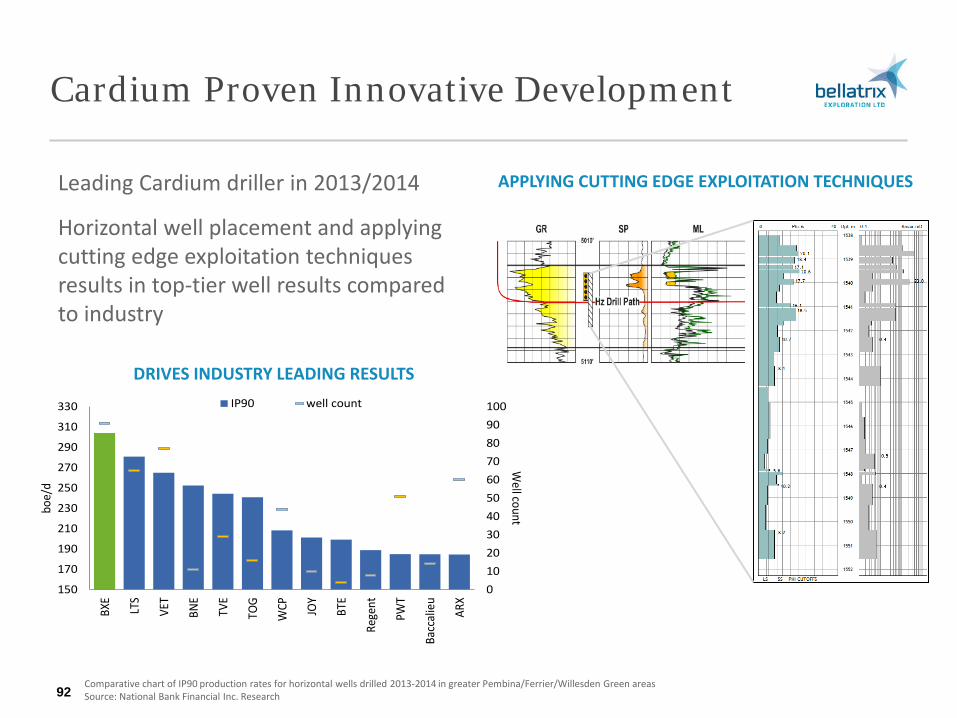
Cardium Proven Innovative Development
Leading Cardium driller in 2013/2014
Horizontal well placement and applying cutting edge exploitation techniques results in top-tier well results compared to industry
APPLYING CUTTING EDGE EXPLOITATION TECHNIQUES
DRIVES INDUSTRY LEADING RESULTS
0102030405060708090100
150
170
190
210
230
250
270
290
310
330
BXE
LTS
VET
BNE
TVE
TOG
WCP JO
Y
BTE
Rege
nt
PWT
Bacc
alie
u
ARX
Well count
boe/
d
IP90 well count
Comparative chart of IP90 production rates for horizontal wells drilled 2013-2014 in greater Pembina/Ferrier/Willesden Green areas Source: National Bank Financial Inc. Research 92
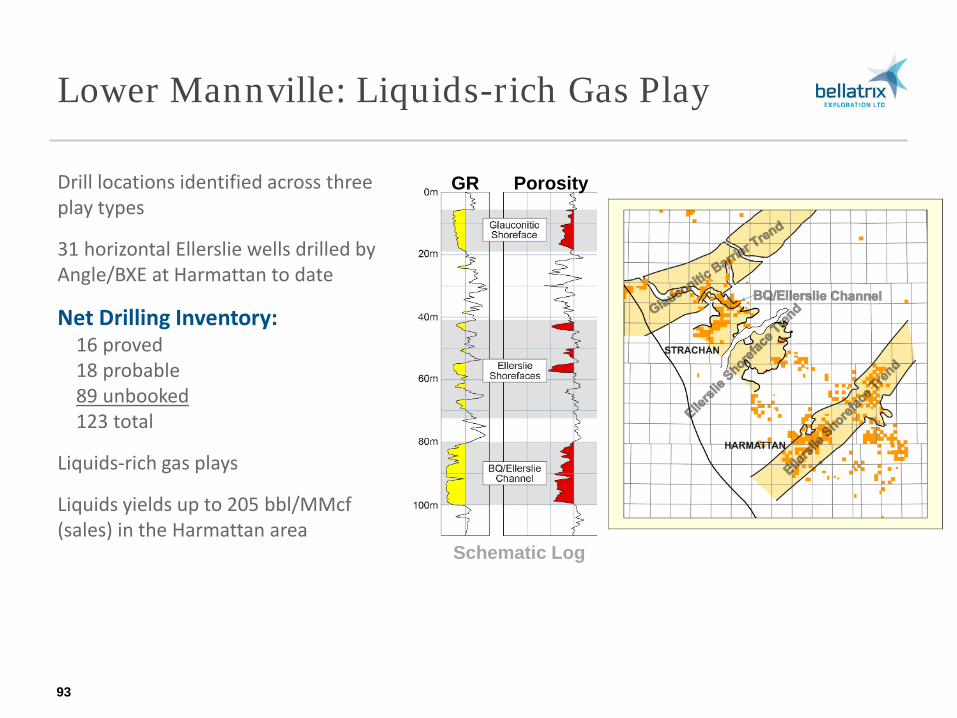
Schematic Log
GR Porosity
Lower Mannville: Liquids-rich Gas Play
Drill locations identified across three play types
31 horizontal Ellerslie wells drilled by Angle/BXE at Harmattan to date
Net Drilling Inventory: 16 proved 18 probable 89 unbooked 123 total
Liquids-rich gas plays
Liquids yields up to 205 bbl/MMcf (sales) in the Harmattan area
93
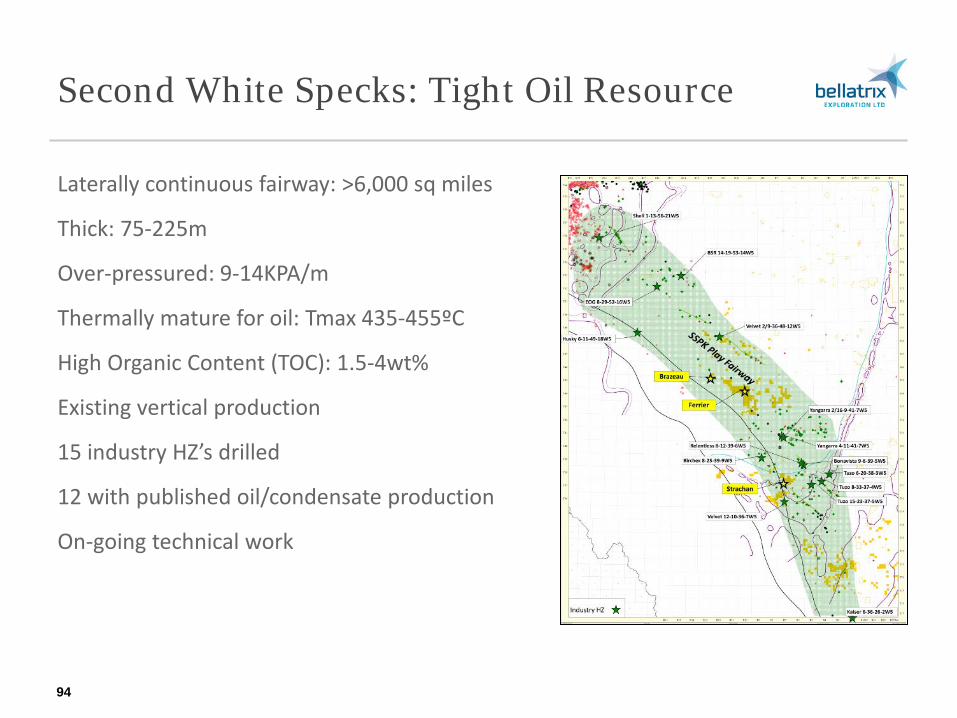
Second White Specks: Tight Oil Resource
Laterally continuous fairway: >6,000 sq miles
Thick: 75-225m
Over-pressured: 9-14KPA/m
Thermally mature for oil: Tmax 435-455ºC
High Organic Content (TOC): 1.5-4wt%
Existing vertical production
15 industry HZ’s drilled
12 with published oil/condensate production
On-going technical work
94
Corporate Information
BOARD OF DIRECTORS W.C. (Mickey) Dunn Chairman
Doug N. Baker, FCA
Murray L. Cobbe
John H. Cuthbertson, QC
Melvin M. Hawkrigg, BA, FCA, LLD (Hon.)
Keith E. Macdonald, CA
Steven J. Pully, CPA, CFA
Raymond G. Smith, P. Eng.
Murray B. Todd, B.Sc., P. Eng.
Keith S. Turnbull, B.Sc., CA
OFFICERS Raymond G. Smith, P.Eng. President & CEO
Edward J. Brown, C.A. Executive Vice President, Finance & CFO
Brent A. Eshleman, P.Eng. Executive Vice President & COO
Charles R. Kraus, Esq. Vice President, General Counsel & Corporate Secretary
Steve G. Toth, CFA Vice President, Investor Relations
ADDRESS 1920, 800 – 5th Avenue SW Calgary, Alberta Canada T2P 3T6 Tel: (403) 266-8670 Fax: (403) 264-8163 www.bellatrixexploration.com [email protected]
BANKERS National Bank of Canada Alberta Treasury Branches HSBC Bank Canada Canadian Imperial Bank of Commerce The Bank of Nova Scotia Bank of Montreal The Toronto Dominion Bank Union Bank, Canada Branch Wells Fargo Bank N.A., Canadian Branch
EVALUATION ENGINEERS Sproule Associates Limited
REGISTRAR & TRANSFER AGENT Computershare Trust Company of Canada
AUDITORS KPMG LLP
EXCHANGE LISTING The Toronto Stock Exchange - BXE The New York Stock Exchange - BXE
95
1920, 800 – 5th Avenue SW Calgary, Alberta Canada T2P 3T6 Tel: (403) 266-8670 Fax: (403) 264-8163 www.bellatrixexploration.com