investor presentation q2 & h1fy17...fortis escorts hospital, jaipur won the quality council of...
TRANSCRIPT
Fortis Healthcare LimitedInvestor Presentation – Q2 & H1FY17
“ Saving and Enriching Lives”
November 10, 2016

This presentation may not be copied, published, distributed or transmitted. The presentation has been prepared solely by the company.
Any reference in this presentation to “Fortis Healthcare Limited” shall mean, collectively, the Company and its subsidiaries. This presentation has
been prepared for informational purposes only. This presentation does not constitute a prospectus, offering circular or offering memorandum and is
not an offer or invitation to buy or sell any securities, nor shall part, or all, of this presentation form the basis of, or be relied on in connection with,
any contract or investment decision in relation to any securities. Furthermore, this presentation is not and should not be construed as an offer or a
solicitation of an offer to buy securities of the company for sale in the United States, India or any other jurisdiction.
Securities may not be offered or sold in the United States absent registration or an exemption from registration. Any public offering in the United
States may be made only by means of an offering document that may be obtained from the Company and that will contain detailed information
about the Company and its management, as well as financial statements. Any offer or sale of securities in a given jurisdiction is subject to the
applicable laws of that jurisdiction.
This presentation contains forward-looking statements based on the currently held beliefs and assumptions of the management of the Company,
which are expressed in good faith and, in their opinion, reasonable. Forward-looking statements involve known and unknown risks, uncertainties
and other factors, which may cause the actual results, financial condition, performance, or achievements of the Company or industry results, to
differ materially from the results, financial condition, performance or achievements expressed or implied by such forward-looking statements. Given
these risks, uncertainties and other factors, recipients of this presentation are cautioned not to place undue reliance on these forward-looking
statements.
The Company assumes no responsibility to publicly amend, modify or revise any forward-looking statements, on the basis of any subsequent
development, information or events, or otherwise. Unless otherwise stated in this presentation, the information contained herein is based on
management information and estimates. The information contained herein is subject to change without notice and past performance is not
indicative of future results. The Company may alter, modify or otherwise change in any manner the content of this presentation, without obligation
to notify any person of such revision or changes.
By attending this presentation you acknowledge that you will be solely responsible for your own assessment of the market and the market position
of the Company and that you will conduct your own analysis and be solely responsible for forming your own view of the potential future
performance of the business of the Company.
Neither the delivery of this presentation nor any further discussions of the Company with any of the recipients shall, under any circumstances,
create any implication that there has been no change in the affairs of the Company since that date.
Disclaimer
2

Discussion Points
3
Business Performance – Hospitals & Diagnostics
Highlights – Q2 & H1FY17
Financial Highlights
Awards & Recognitions
Successes in Clinical Excellence

Highlights – Q2FY17
Group Consolidated Business (Q2 FY17 vs Q2 FY16)
Revenues at Rs 1,196 Cr for the quarter, + 11%
Consolidated EBITDAC* at Rs 219 Cr, 18.3% margin versus 17.3% margin
Consolidated operating EBITDA at Rs 99 Cr, + 40%
Consolidated PBT before forex and exceptional items at Rs 43 Cr, up 86%
Hospital Business (Q2 FY17 vs Q2 FY16)
Revenues at Rs 972 Cr, +11%
EBITDAC at Rs 164 Cr, highest ever reported EBITDAC in a quarter. Represents 16.8% margin versus
15.6% margin
Operating EBITDA at Rs 44 Cr, a 2.2x times increase over Q2FY16
Diagnostics Business .i.e. SRL (Q2 FY17 vs Q2 FY16)
Revenues at Rs 213 Cr, +12%
Operating EBITDA at Rs 54 Cr. Represents 25.3% margin versus 27.9% margin
4*Refers to EBITDA before net business trust costs

Highlights – H1FY17
Group Consolidated Business (H1FY17 vs H1FY16)
Revenues at Rs 2,317 Cr versus Rs 2,113 Cr, + 10%
Consolidated EBITDAC at Rs 399 Cr, 17.2% margin versus 16.4% margin
Consolidated operating EBITDA at Rs 162 Cr, + 40%
Consolidated PBT before forex and exceptional items at Rs 43 Cr vs Rs 3 Cr
Hospital Business (H1FY17 vs H1FY16)
Revenues at Rs 1,882 Cr versus Rs 1,710 Cr, +10%
EBITDAC at Rs 303 Cr. Represents 16.1% margin versus 14.9% margin
Operating EBITDA at Rs 66 Cr, a 3x times increase over H1 FY16
Diagnostics Business .i.e. SRL (H1FY17 vs H1FY16)
Revenues at Rs 405 Cr, +10%
Operating EBITDA at Rs 97 Cr. Represents 23.9% margin versus 26% margin
Net debt of the company as on September 30, 2016 stood at Rs 728 Cr, representing a net debt to equity ratio of
0.15x as compared to 0.18x as on June 30, 2016.
5
*Refers to EBITDA before net business trust costs

Event Update
Demerger of diagnostics business
Company announced the demerger of its diagnostics business, including that housed in its
majority owned subsidiary SRL Limited into another majority owned subsidiary, Fortis Malar
Hospitals Limited, pursuant to a composite scheme of arrangement and amalgamation.
Execution of the above requiring various regulatory and statutory approvals is underway
Completion of acquisition of 51% economic interest in FHTL
In October 2016, the Company completed its acquisition of 51% economic interest in Fortis
Hospotel Limited (FHTL).
FHTL, was a subsidiary of the RHT Health Trust (RHT), and comprised 2 key clinical
establishments of the Fortis Hospital Shalimar Bagh, New Delhi and the Fortis Memorial
Research Institute (FMRI), Gurugram
Effective mid – October, FHTL became a subsidiary of Fortis and hence will be consolidated with
Fortis. Expected to impact operating profitability (EBITDA) positively due to lower BT fees

Key Awards and Recognitions
7
Fortis Hospital, Mohali won the prestigious Asia Pacific Hand Hygiene Excellence Award 2015 for demonstrating
outstanding leadership in the implementation of an effective hand hygiene campaign
Federation of Karnataka Chambers of Commerce and Industry (FKCCI) adjudged Fortis Hospital, BG Road,
Bengaluru as the ‘Best Medical Tourism Hospital’ at the Karnataka Tourism Awards 2016
Fortis Hospital, Mulund, Mumbai was feted with the “Best Hospital Unit in Cardiac Care” and the “Best Medical
Tourism Facility” awards at the CIMS Healthcare Excellence Awards 2016.
Fortis Escorts Hospital, Jaipur won the Quality Council of India (QCI) D. L. Shah Award for the fourth time in a row.
The award was for the Lean Six Sigma project titled ‘Dock to Stock Cycle Reduction Time in Critical Care – Kaizen’.
Fortis Mulund won the “Patient Safety” award for its Insulin Super League programme and the “Outstanding Achievement in
Healthcare” award for its efforts in the Organ Donation space at the 3rd Asia Healthcare Excellence Awards 2016

Successes in Clinical Excellence
8
Doctors at FMRI treated a 43-year-old patient
carrying a cerebrospinal fluid filled bulge
measuring 92cm, on his back and is reportedly
the largest swelling ever recorded in the world.
Fortis Mulund successfully conducted Western
India’s first-ever Heart & Lung Transplant on a 48
year old patient suffering from Congenital
Ventricular Septal Defect with
Eisenmengerization.
Doctors at Shalimar Bagh successfully treated a
nine-month-old infant born with a large gap in her
food pipe, a congenital defect, called oesophageal
atresia
A team of doctors persevered and fought all odds
for nearly 100 days to miraculously revive a
severely underweight, pre-term neonate suffering
from multiple complications
Doctors at FMRI conducted a rare reconstructive
surgery on a 25-yearo ld Iraqi woman suffering
from Mayer-Rokitansky Kuster Hauser (MRKH)
Syndrome, a congenital uro-genital anomaly.
A team of Doctors at Fortis Hospital, Mohail
performed a complex surgery on a 17-year-old
boy by fixing a dislocated vertebra that was
pressing against the boy’s spinal cord, causing
immobility.

Financial Highlights
9

190
218
0
50
100
150
200
Q2FY16 Q2FY17
Consol EBITDAC
1,067
1,185
0
400
800
1,200
Q2FY16 Q2FY17
Consol Revenue
India Financial Highlights – Q2FY17 vs Q2FY16
Consolidated Revenues at Rs 1,185 Cr, + 11%.
Hospital Business – Rs 972 Cr, + 11%
Diagnostic Business – Rs 213 Cr, + 12%
Consolidated Operating EBITDAC* at Rs 218 Cr,
18.4% margin
Hospital Business – Rs 164 Cr, 16.8% margin
Diagnostic Business – Rs 54 Cr, 25.3% margin
10
Rs Cr
Rs Cr
*EBITDAC refers to EBITDA before net business trust costs
11%
15%
351
400
0
100
200
300
400
H1FY16 H1FY17
Consol EBITDAC
2,0792,287
0
500
1,000
1,500
2,000
H1FY16 H1FY17
Consol Revenue
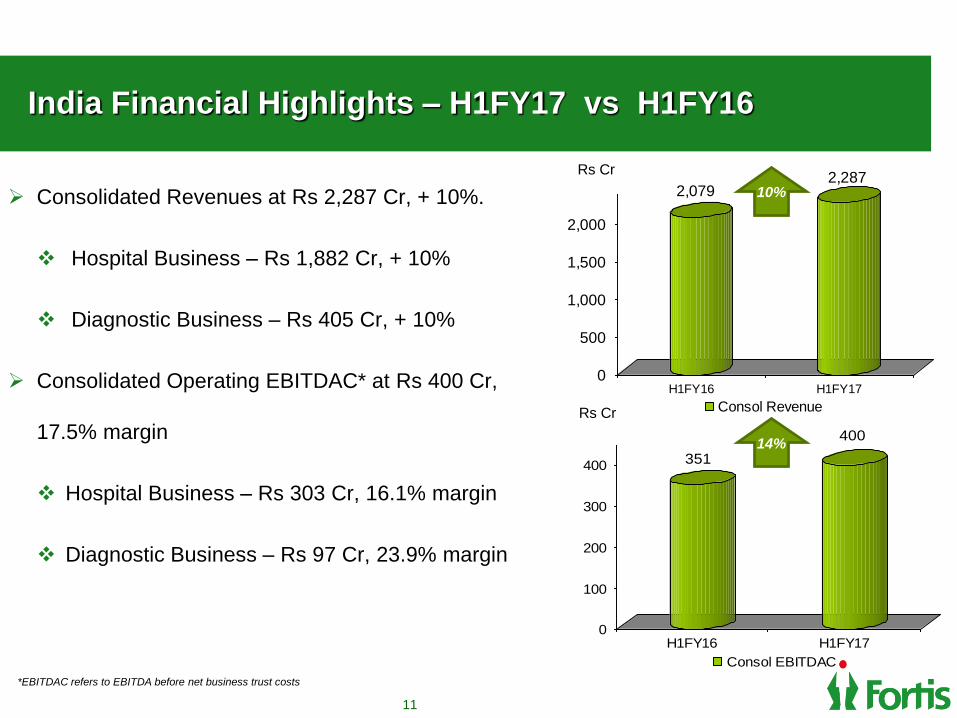
India Financial Highlights – H1FY17 vs H1FY16
Consolidated Revenues at Rs 2,287 Cr, + 10%.
Hospital Business – Rs 1,882 Cr, + 10%
Diagnostic Business – Rs 405 Cr, + 10%
Consolidated Operating EBITDAC* at Rs 400 Cr,
17.5% margin
Hospital Business – Rs 303 Cr, 16.1% margin
Diagnostic Business – Rs 97 Cr, 23.9% margin
11
Rs Cr
Rs Cr
*EBITDAC refers to EBITDA before net business trust costs
10%
14%

India Consolidated P&L – Q2FY17
*EBITDAC refers to EBITDA before net business trust (BT) costs
**Exceptional item in Q2FY16 is wrt the exit of company’s Kangra operations and SRL’s exit from select laboratories
Q2FY16 Q1FY17 Q2FY17QoQ % Change
Particulars (Rs Cr.) (Rs Cr.) (Rs Cr.)
Operating Revenue 1,066.7 1,101.7 1,185.1 11.1%
Operating EBITDAC* 190.0 182.0 217.6 14.5%
Operating EBITDAC margin 17.8% 16.5% 18.4%
Net BT Costs 116.3 117.3 119.7 2.9%
Operating EBITDA 73.7 64.7 97.9 32.8%
Other Income 26.0 24.7 33.0
EBITDA 99.7 89.3 131.0 31.3%
Finance Costs 29.5 41.6 45.6 54.9%
Depreciation & Amortization 46.2 46.1 50.7
PBT before Forex 24.0 1.7 34.6 44.0%
Foreign Exchange (Loss)/ Gain 5.4 5.8 (5.5)
PBT before Exceptional Item 29.5 7.4 29.2
Exceptional (Loss)/ Gain (26.4) 0.1 (1.1)
Tax Expense 17.7 2.3 23.3
PAT before minority interest and share in
associates (14.7) 5.2 4.7
Share in Associates 14.3 19.0 19.4
PAT after minority interest and share in
associates (6.4) 15.1 17.3
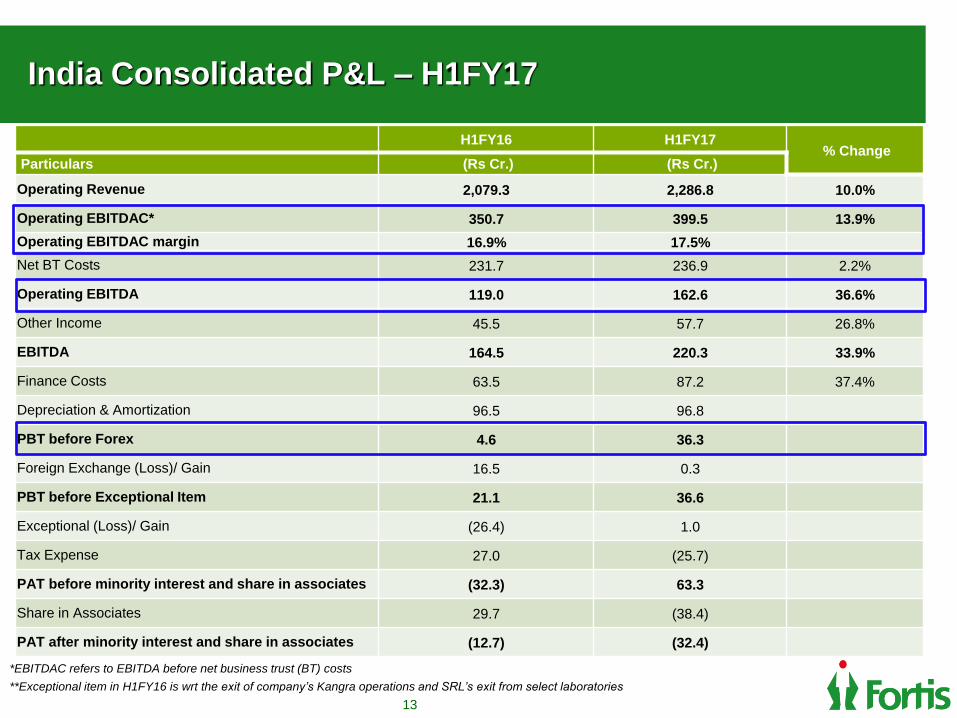
India Consolidated P&L – H1FY17
13
*EBITDAC refers to EBITDA before net business trust (BT) costs
**Exceptional item in H1FY16 is wrt the exit of company’s Kangra operations and SRL’s exit from select laboratories
H1FY16 H1FY17% Change
Particulars (Rs Cr.) (Rs Cr.)
Operating Revenue 2,079.3 2,286.8 10.0%
Operating EBITDAC* 350.7 399.5 13.9%
Operating EBITDAC margin 16.9% 17.5%
Net BT Costs 231.7 236.9 2.2%
Operating EBITDA 119.0 162.6 36.6%
Other Income 45.5 57.7 26.8%
EBITDA 164.5 220.3 33.9%
Finance Costs 63.5 87.2 37.4%
Depreciation & Amortization 96.5 96.8
PBT before Forex 4.6 36.3
Foreign Exchange (Loss)/ Gain 16.5 0.3
PBT before Exceptional Item 21.1 36.6
Exceptional (Loss)/ Gain (26.4) 1.0
Tax Expense 27.0 (25.7)
PAT before minority interest and share in associates (32.3) 63.3
Share in Associates 29.7 (38.4)
PAT after minority interest and share in associates (12.7) (32.4)

Group Consolidated P&L – Q2FY17
14
* EBITDAC refers to EBITDA before net business trust (BT) costs
**Exceptional item in Q2FY16 is wrt the exit of company’s Kangra operations and SRL’s exit from select laboratories
Particulars Q2FY16 Q1FY17 Q2FY17
QoQ % Change(Rs Cr.) (Rs Cr.) (Rs Cr.)
Operating Revenue 1,078.5 1,121.2 1,195.7 10.9%
Operating EBITDAC* 187.0 179.8 218.8 17.0%
Operating EBITDAC margin 17.3% 16.0% 18.3%
Net BT Costs 116.3 117.3 119.7 2.9%
Operating EBITDA 70.7 62.5 99.1 40.1%
Other Income 28.6 27.0 41.2 43.9%
EBITDA 99.3 89.5 140.3 41.2%
Finance Costs 29.5 42.0 46.0 55.9%
Depreciation & Amortization 46.9 47.6 51.7 10.2%
PBT before Forex 22.9 (0.0) 42.6 85.8%
Foreign Exchange (Loss)/ Gain 51.6 6.0 (3.2)
PBT before Exceptional Item 74.5 5.9 39.4
Exceptional (Loss)/ Gain (27.9) 0.1 0.9
Tax Expense 17.8 2.9 24.2
PAT before minority interest and share in
associates 28.8 3.1 16.1
Share in Associates 17.5 22.1 22.3
PAT after minority interest and share in associates 40.2 16.1 31.4

Group Consolidated P&L – H1FY17
15
* EBITDAC refers to EBITDA before net business trust (BT) costs
Exceptional gain during H1FY16 pertains largely to gain arising due to divestment of RadLink and Fortis Surgical Hospital, Singapore.
Particulars H1FY16 H1FY17
% Change(Rs Cr.) (Rs Cr.)
Operating Revenue 2,112.8 2,316.9 9.7%
Operating EBITDAC* 346.8 398.5 14.9%
Operating EBITDAC margin 16.4% 17.2%
Net BT Costs 231.7 236.9 2.2%
Operating EBITDA 115.1 161.6 40.4%
Other Income 51.8 68.2 31.6%
EBITDA 167.0 229.8 37.6%
Finance Costs 63.7 88.0 38.2%
Depreciation & Amortization 100.1 99.2
PBT before Forex 3.1 42.5
Foreign Exchange (Loss)/ Gain 70.0 2.8
PBT before Exceptional Item 73.1 45.3
Exceptional (Loss)/ Gain 59.3 0.9
Tax Expense 27.4 27.1
PAT before minority interest and share in associates 105.0 19.2
Share in Associates 36.3 44.3
PAT after minority interest and share in associates 131.1 47.6
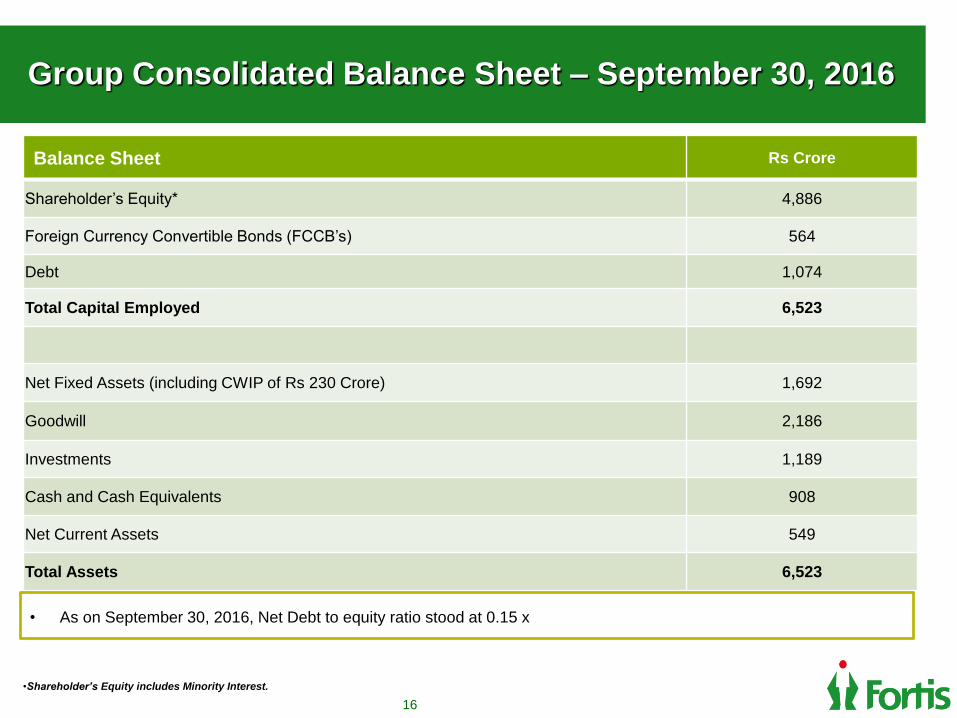
Group Consolidated Balance Sheet – September 30, 2016
16
Balance Sheet Rs Crore
Shareholder’s Equity* 4,886
Foreign Currency Convertible Bonds (FCCB’s) 564
Debt 1,074
Total Capital Employed 6,523
Net Fixed Assets (including CWIP of Rs 230 Crore) 1,692
Goodwill 2,186
Investments 1,189
Cash and Cash Equivalents 908
Net Current Assets 549
Total Assets 6,523
•Shareholder’s Equity includes Minority Interest.
• As on September 30, 2016, Net Debt to equity ratio stood at 0.15 x

Business Performance – Hospitals Business
17

0
400
800
1200
Q2FY16 Q2FY17
10671185
18
Q2FY17 – Consolidated
Operating Revenue - Rs. 1,185 Cr 11%
Hospital business -Rs. 972 Cr 11%
Diagnostics business -Rs. 213 Cr 12%
H1FY17 – Consolidated
Operating Revenue - Rs. 2,287 Cr 10%
Hospital business -Rs. 1,882 Cr 10%
Diagnostics business -Rs. 405 Cr 10%
India Business - Snapshot
Rs Cr
Statutory Q2FY16 Q2FY17
Occupancy 77% 82%
ARPOB (Annualized - Rs. Lacs) 134 139
ALOS (Days) 3.57 3.62
11%
0
600
1200
1800
2400
H1FY16 H1FY17
20792287
Revenue
10%

India Hospital Business P&L
19
Q2FY16 Q2FY17
QoQ % Change
H1FY16 H1FY17
% Change
Particulars (Rs Cr.) (Rs Cr.) (Rs Cr.) (Rs Cr.)
Operating Revenue 876.2 971.9 10.9% 1,710.0 1,882.0 10.1%
Operating EBITDAC* 136.4 163.7 20.0% 254.4 302.7 19.0%
Operating EBITDAC
margin 15.6% 16.8% 14.9% 16.1%
Net BT Costs 116.3 119.7 2.9% 231.7 236.9 2.2%
Operating EBITDA 20.1 44.0 119.0% 22.7 65.8 190.4%
Other Income 22.1 29.9 35.1% 40.2 51.7 28.5%
EBITDA 42.2 73.9 75.1% 62.9 117.5 86.8%
* EBITDAC refers to EBITDA before net business trust (BT) costs

Quarterly Revenue and EBITDAC Trend
Rs Crore
Rs Crore
876 850 878 910 972
400
800
1,200
Q2FY16 Q3FY16 Q4FY16 Q1FY17 Q2FY17
Revenue
136122 130 139
164
15.6%
14.3%14.8%
15.3%
16.8%
13.0%
14.0%
15.0%
16.0%
17.0%
18.0%
0
50
100
150
200
Q2FY16 Q3FY16 Q4FY16 Q1FY17 Q2FY17
EBITDAC EBITDAC Margin

India Hospital Business
21
Operating revenue at Rs 972 Cr, +11%
Operating EBITDAC* margins at 16.8%, up 120
bps.
International patient revenue at Rs 97 Cr, +13%;
representing 10% of overall hospital business
FMRI revenue at Rs 124 Cr, + 24% over corr Q
FEHI witnessed strong traction with revenue
growth of 19%
Ludhiana facility continues on its strong growth
trajectory with 54% qoq growth
Rs Cr
*EBITDAC refers to EBITDA before net business trust costs
11%
21%
876
972
-
200
400
600
800
1,000
1,200
Q2FY16 Q2FY17
Revenue
136
164
0
50
100
150
200
Q2FY16 Q2FY17
EBITDAC

Select Key Highlights / Accomplishments
Fortis Mohali receives JCI reaccreditation for the 4th consecutive time
The Fortis Bone and Joint Institute in FMRI and FEHI crosses 300th procedure
milestone within a month of its launch in July 2016
Fortis Malar completed its 118th heart transplant (as of Sept 2016)
Fortis Hospital, Anandapur, Kolkata inaugurates a Lung Cancer Clinic, to mark World
Lung Cancer Day.
Fortis collaborates with wayForward, to launch an emotional wellness program to solve
problems caused by stress, anxiety and other emotional or mental health issues.
Fortis furthers efforts on organ donation - Commemorates organ donors through a
‘Wall of Tribute’ across its various hospitals to keep alive their memory and honour
their families.
22

Hospital-wise Revenue – Top 10 Hospitals
23
Rs Crore
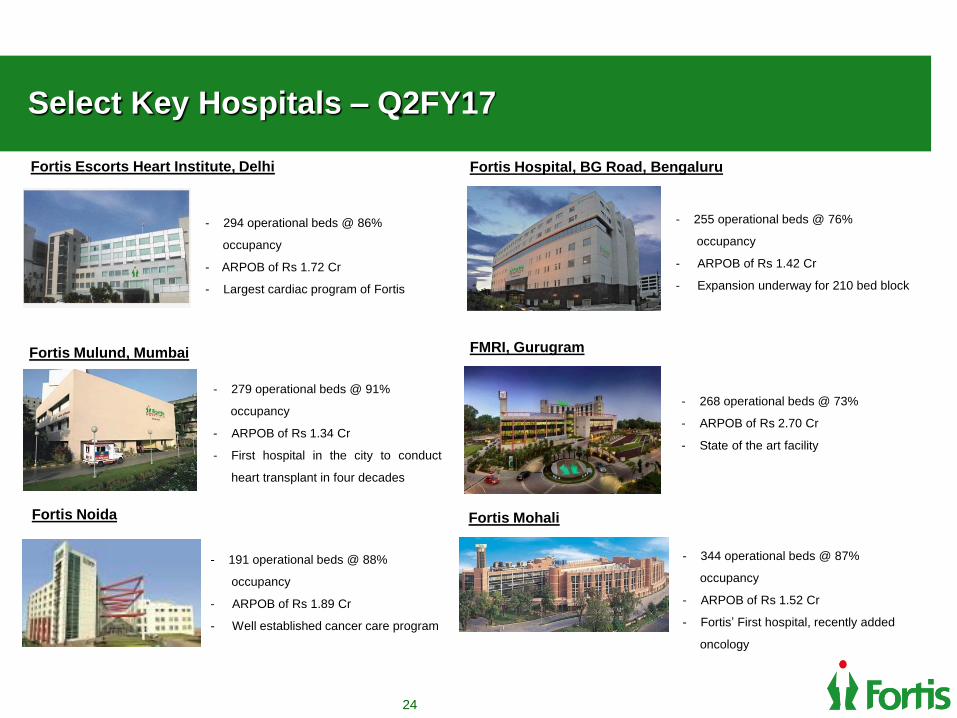
Select Key Hospitals – Q2FY17
24
Fortis Escorts Heart Institute, Delhi
Fortis Mulund, Mumbai FMRI, Gurugram
Fortis Noida Fortis Mohali
- 268 operational beds @ 73%
- ARPOB of Rs 2.70 Cr
- State of the art facility
- 255 operational beds @ 76%
occupancy
- ARPOB of Rs 1.42 Cr
- Expansion underway for 210 bed block
- 294 operational beds @ 86%
occupancy
- ARPOB of Rs 1.72 Cr
- Largest cardiac program of Fortis
- 279 operational beds @ 91%
occupancy
- ARPOB of Rs 1.34 Cr
- First hospital in the city to conduct
heart transplant in four decades
- 191 operational beds @ 88%
occupancy
- ARPOB of Rs 1.89 Cr
- Well established cancer care program
- 344 operational beds @ 87%
occupancy
- ARPOB of Rs 1.52 Cr
- Fortis’ First hospital, recently added
oncology
Fortis Hospital, BG Road, Bengaluru

Key Future Growth Drivers
International Patients – Medical tourism
Swifter organic growth through brownfield expansion
Competitive advantage over peers on brownfield expansion strategy – faster ramp up and lesser capex per bed
Capability to add ~2,000 beds through brownfield expansion over the next few years
Strong process driven platform with improving adherence
Growth through Operations & Management contracts
Asset light growth strategy for newer markets , leveraging Fortis brand, talent, operational expertise and protocols
Looking to expand through O&Ms in India and select emerging markets
Focus on high end high value specialties – Oncology & transplant
New oncology blocks being created in select facilities
Clinical talent to support these specialties
Clinical Excellence and Patient engagement25
Q2FY17 H1FY17
Revenue 97 200
Growth 13% 17%

Business Performance – Diagnostics Business
26

191
213
27.9%25.3%
0%
6%
12%
18%
24%
30%
-
50
100
150
200
Q2FY16 Q2FY17
Net Revenue EBITDA margin
India Diagnostics Business
Operating revenue at Rs 213 Cr, +12%
Operating EBITDA margin stood at 25.3%
compared to 27.9% in Q2FY16
Network rationalisation continues.
13 new labs added and 2 exited.
23 collection centres added and 30
closed.
No of accession at 4.10 million, a 7% Q-o-Q
growth
Expands service offering by adding 5 new
tests
27
Rs Cr12%

India Diagnostics Business
28
Lab medicine business also includes a small proportion ( ~ 6% ) from
clinical trials, wellness and the international segment

Thank You…