investor presentation january march 2017 - smith+nephe fy 2016 inve… · investor presentation...
TRANSCRIPT

Investor Presentation January – March 2017
Forward looking statements
This document may contain forward-looking statements that may or may not prove accurate. For example, statements regarding expected revenue growth and trading margins, market trends and our product pipeline are forward -looking statements. Phrases such as “aim”, “plan”, “intend”, “anticipate”, “well-placed”, “believe”, “estimate”, “expect”, “target”, “consider” and similar expressions are generally intended to identify forward-looking statements. Forward-looking statements involve known and unknown risks, uncertainties and other important factors that could cause actual results to differ materially from what is expressed or implied by the statements. For Smith & Nephew, these factors include: economic and financial conditions in the markets we serve, especially those affecting health care providers, payers and customers; price levels for established and innovative medical devices; developments in medical technology; regulatory approvals, reimbursement decisions or other government actions; product defects or recalls; litigation relating to patent or other claims; legal compliance risks and related investigative, remedial or enforcement actions; strategic actions, including acquisitions and dispositions, our success in performing due diligence, valuing and integrating acquired businesses; disruption that may result from transactions or other changes we make in our business plans or organisation to adapt to market developments; and numerous other matters that affect us or our markets, including those of a political, economic, business, competitive or reputational nature. Please refer to the documents that Smith & Nephew has filed with the U.S. Securities and Exchange Commission under the U.S. Securities Exchange Act of 1934, as amended, including Smith & Nephew’s most recent annual report on Form 20-F, for a discussion of certain of these factors.
Any forward-looking statement is based on information available to Smith & Nephew as of the date of the statement. All written or oral forward-looking statements attributable to Smith & Nephew are qualified by this caution. Smith & Nephew does not undertake any obligation to update or revise any forward-looking statement to reflect any change in circumstances or in Smith & Nephew’s expectations.
2
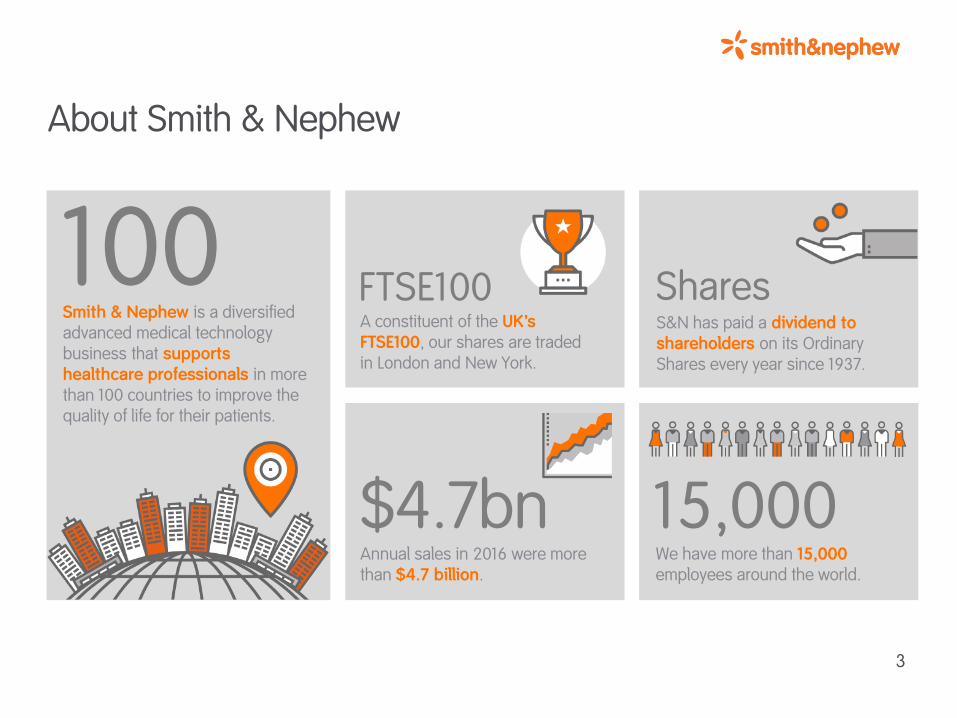
About Smith & Nephew
Smith & Nephew is a diversified advanced medical technology business that supports healthcare professionals in more than 100 countries to improve the quality of life for their patients.
A constituent of the UK’s FTSE100, our shares are traded in London and New York.
FTSE100 S&N has paid a dividend to shareholders on its Ordinary Shares every year since 1937.
Shares
Annual sales in 2016 were more than $4.7 billion.
$4.7bn We have more than 15,000 employees around the world.
15,000
100
3
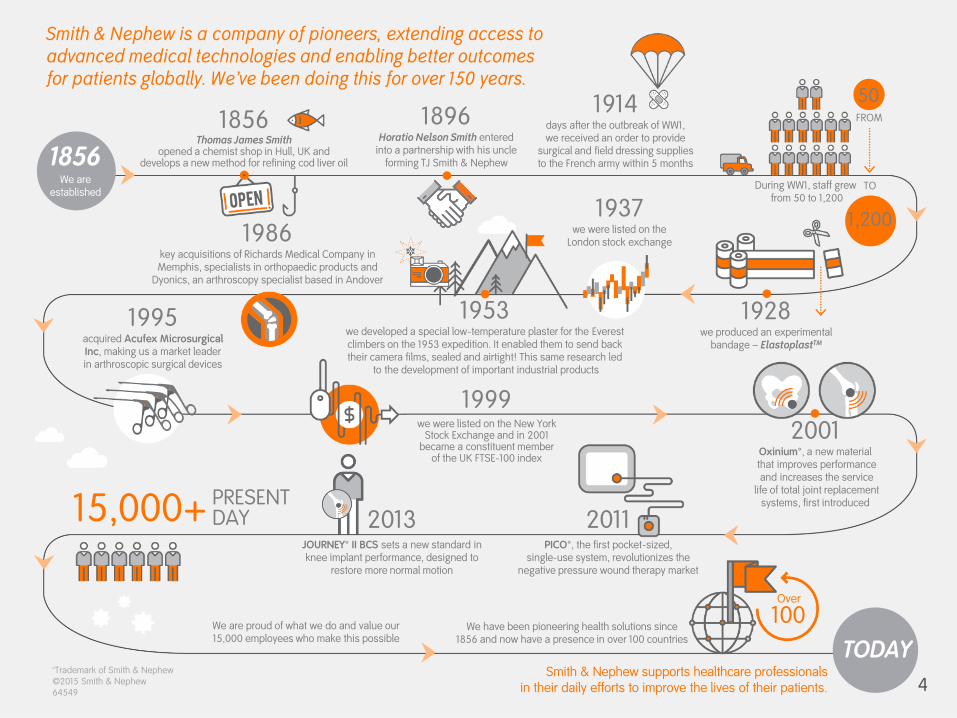
Smith & Nephew is a company of pioneers, extending access to advanced medical technologies and enabling better outcomes for patients globally. We’ve been doing this for over 150 years.
Smith & Nephew supports healthcare professionals in their daily efforts to improve the lives of their patients.
™Trademark of Smith & Nephew ©2015 Smith & Nephew 64549
1856 We are
established
TODAY
1856 Thomas James Smith
opened a chemist shop in Hull, UK and develops a new method for refining cod liver oil
1896 Horatio Nelson Smith entered
into a partnership with his uncle forming TJ Smith & Nephew
1914 days after the outbreak of WW1, we received an order to provide
surgical and field dressing supplies to the French army within 5 months
50 FROM
TO
1,200 1986
key acquisitions of Richards Medical Company in Memphis, specialists in orthopaedic products and
Dyonics, an arthroscopy specialist based in Andover
1937 we were listed on the
London stock exchange
1995 acquired Acufex Microsurgical Inc, making us a market leader in arthroscopic surgical devices
1928 we produced an experimental
bandage – ElastoplastTM
2001 Oxinium™, a new material
that improves performance and increases the service
life of total joint replacement systems, first introduced
1999 we were listed on the New York
Stock Exchange and in 2001 became a constituent member
of the UK FTSE-100 index
2011 PICO™, the first pocket-sized,
single-use system, revolutionizes the negative pressure wound therapy market
2013 JOURNEY™ II BCS sets a new standard in knee implant performance, designed to
restore more normal motion
We are proud of what we do and value our 15,000 employees who make this possible
We have been pioneering health solutions since 1856 and now have a presence in over 100 countries
15,000+ PRESENT DAY
Over
100
1953 we developed a special low-temperature plaster for the Everest climbers on the 1953 expedition. It enabled them to send back their camera films, sealed and airtight! This same research led
to the development of important industrial products
During WW1, staff grew from 50 to 1,200
4
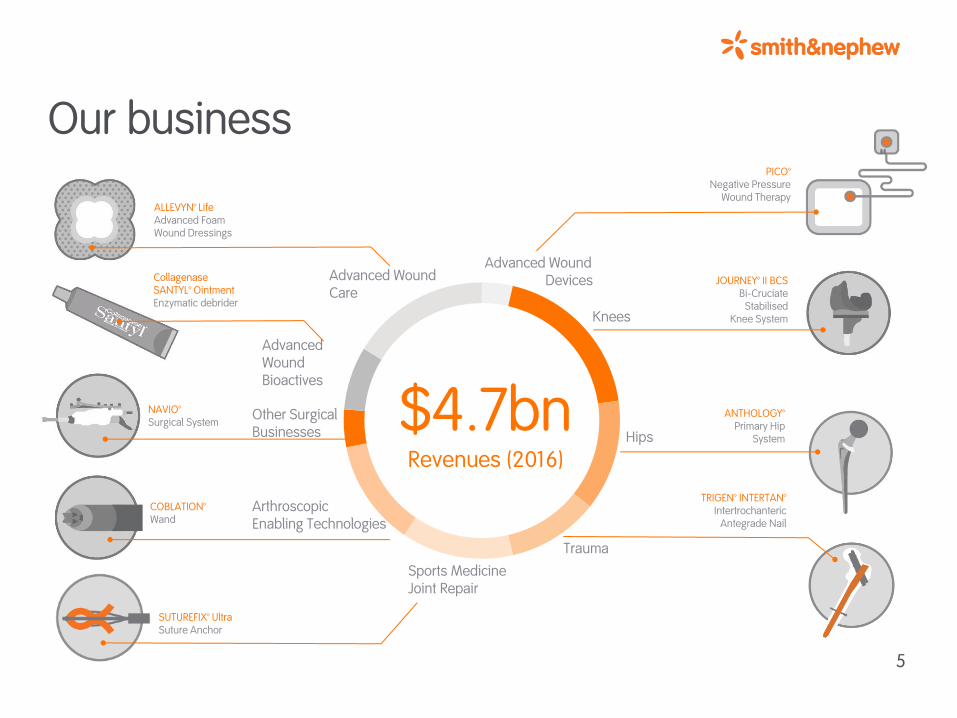
Our business
Advanced Wound Care
Advanced Wound Bioactives
Other Surgical Businesses
Arthroscopic Enabling Technologies
Sports Medicine Joint Repair
Trauma
Hips
Knees
Advanced Wound Devices
ALLEVYN™ Life Advanced Foam Wound Dressings
Collagenase SANTYL™ Ointment Enzymatic debrider
NAVIO™ Surgical System
COBLATION™ Wand
SUTUREFIX™ Ultra Suture Anchor
PICO™ Negative Pressure
Wound Therapy
JOURNEY™ II BCS Bi-Cruciate
Stabilised Knee System
$4.7bn Revenues (2016)
ANTHOLOGY™ Primary Hip
System
TRIGEN™ INTERTAN™ Intertrochanteric
Antegrade Nail
5

Our markets…
15,000 Employees
We have a balanced global footprint…
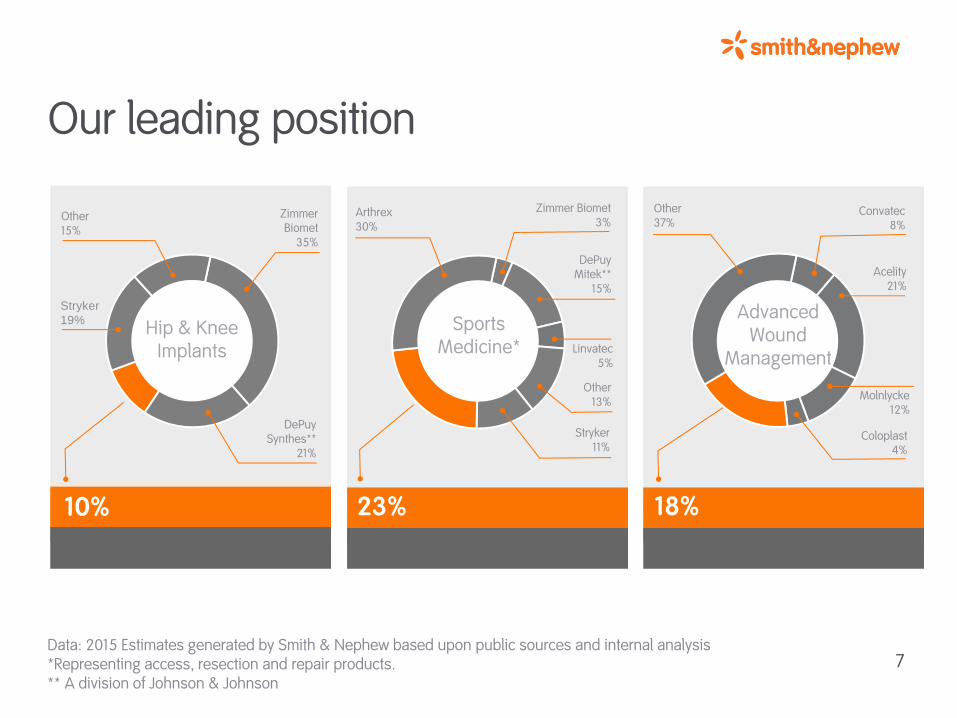
Our leading position
Hip & Knee Implants
Sports Medicine*
Advanced Wound
Management
10% 23% 18%
Data: 2015 Estimates generated by Smith & Nephew based upon public sources and internal analysis *Representing access, resection and repair products. ** A division of Johnson & Johnson
Other 15%
Stryker
19%
Zimmer Biomet
35%
DePuy Synthes**
21%
Arthrex 30%
Zimmer Biomet 3%
DePuy Mitek**
15%
Linvatec 5%
Other 13%
Stryker 11%
Other 37%
Convatec 8%
Acelity 21%
Molnlycke 12%
Coloplast 4%
7

Our market growth drivers
Demographics Emerging Markets Technology
Economics Prevalence Lifestyle
8

Market realities and opportunities
Procedure demand continues to increase
Still room for innovation
Ability to pay continues to decrease in
established markets
New business models slowly emerging, but fragmented
Environment Complexities
Fuelled by expanded access in emerging markets
Demonstrate clinical
benefit or cost
reduction
Regulatory, clinical data,
manufacturing know-how,
patents
Alternative, less costly solutions
Austerity, reduced prices
Mid-tier model
to access emerging markets
Syncera value
solutions – pioneering
model
Customer relationships, distribution channels,
capital
Demographic and disease
led
9

Our performance Trading profit Revenue
$4,669m +2%* $1,020m -4%* 21.8% margin
Trading cash conversion
Net Debt
$1,550m
Adjusted earnings per share (EPSA)
82.6c +2%CAGR
75%
* Underlying growth percentage after adjusting for the effect of currency translation, acquisitions and disposals.
Dividend per share
30.8c +12%CAGR
10
Adjusted earnings per share (EPSA) Dividend per share
4,270
4,137
4,351
4617 4,634 4,669
2011 2012 2013 2014 2015 2016
961 965 987
1055
1099
1020
2011 2012 2013 2014 2015 2016
87%
104% 89%
74% 85%
75%
2011 2012 2013 2014 2015 2016
74.5 75.7 76.9
83.2 85.1
82.6
2011 2012 2013 2014 2015 2016
17.40
26.10 27.4 29.6 30.8 30.8
2011 2012 2013 2014 2015 2016
138 288 253
1613 1361
1550
2011 2012 2013 2014 2015 2016

Our customers
Retail consumers, Patients
Payers, Administrators
Healthcare systems, Procurement groups
Nurses, Nurse specialists
Physicians, GPs
Surgeons
11
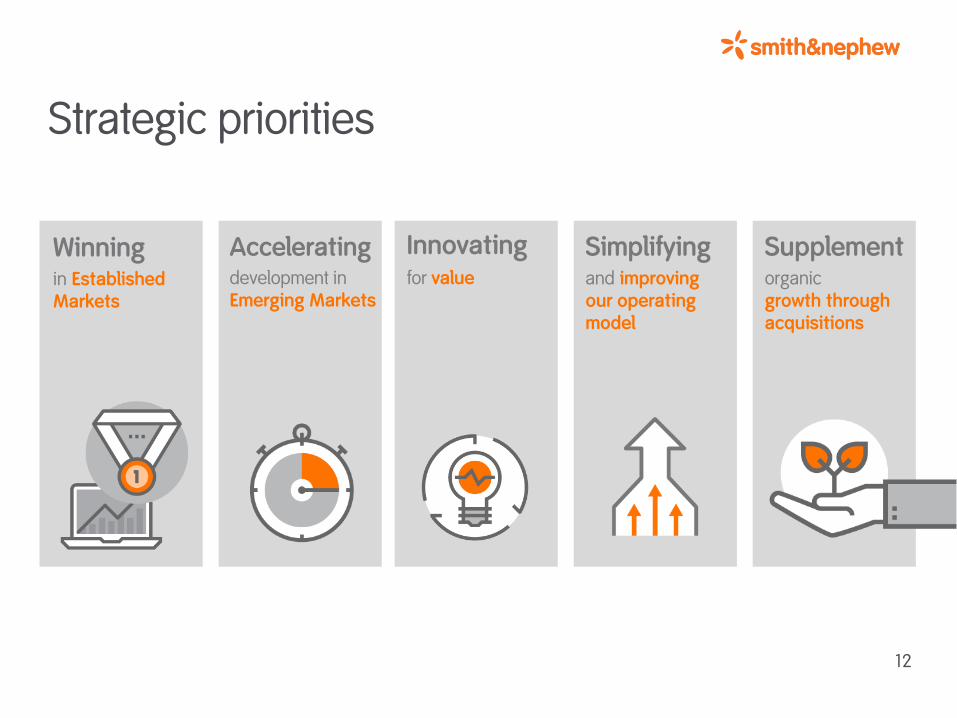
Strategic priorities
Winning in Established Markets
Accelerating development in Emerging Markets
Innovating
Simplifying and improving our operating model
Supplement organic growth through acquisitions
12
for value
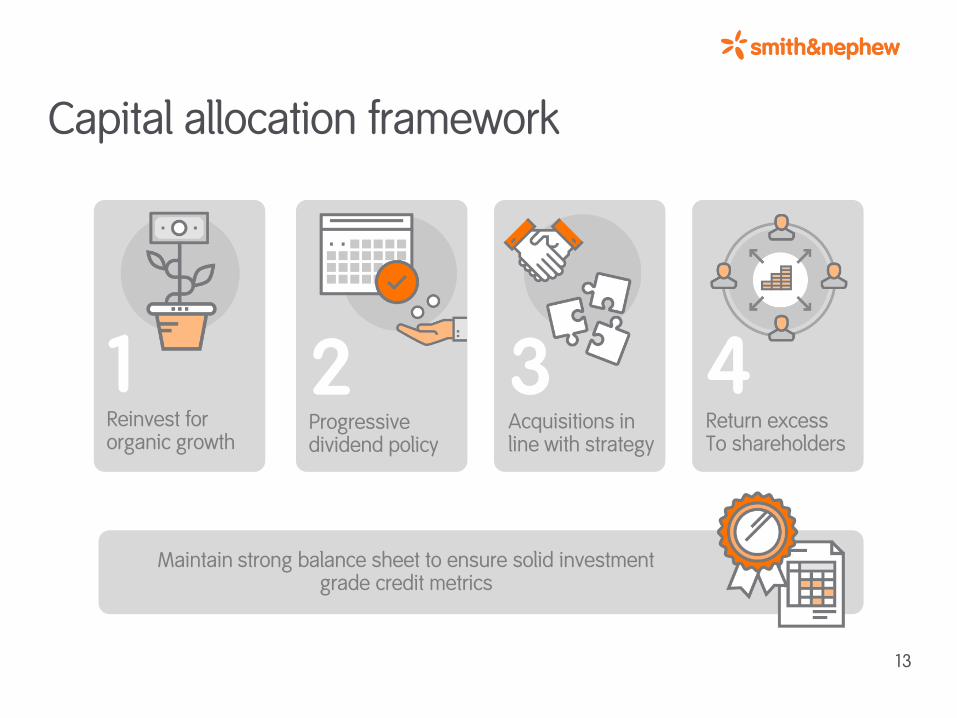
Capital allocation framework
1 Reinvest for organic growth
2 Progressive dividend policy
3 Acquisitions in line with strategy
4 Return excess To shareholders
Maintain strong balance sheet to ensure solid investment grade credit metrics
13

Future – a rebalanced Smith & Nephew
2011* Future
Lower Growth
65%
Higher Growth
35%
Higher Growth
65%
Lower Growth
35%
Proportion of Revenue
Improving Strengthening
Creating
14
Higher Growth: Sports Medicine Joint Repair, Trauma & Extremities, Advanced Wound Bioactives and Devices, Emerging markets (all franchises), COBLATION, Robotics, ENT. Lower Growth: Arthroscopic Enabling Technologies, Reconstruction and Advanced Wound Care (all Established markets)
* Excluding Clinical Therapies

Q4 revenue growth of -1% underlying*
15
3%
-3%
0%
-5% 0% 5%
Emerging
Est OUS
US
AWD
AWB
AWC
Hips
Knees
Arthroscopic Enabling Tech
Sports Medicine Joint Repair
Trauma & Extremities
Other Surgical
2%
1%
-3%
-6%
0%
15%
-4%
-3%
5%
-10% 0% 10%
Geographical growth Product franchise growth Revenue split
Underlying change (%) Underlying change (%)
* Underlying growth is not adjusted for the impact of four fewer selling days in Q4 2016 compared to Q4 2015 ‘Est OUS’ is Australia, Canada, Europe, Japan and New Zealand; ‘Other Surgical’ includes ENT and robotics sales (excluding implant sales)
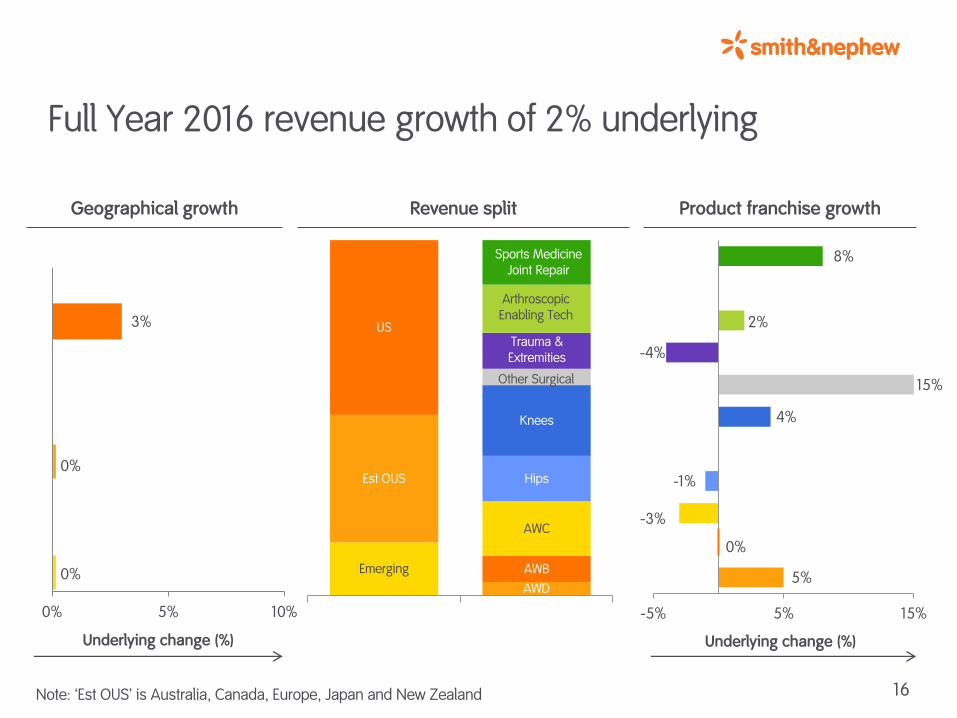
0%
0%
3%
0% 5% 10%
Emerging
Est OUS
US
AWD
AWB
AWC
Hips
Knees
Arthroscopic Enabling Tech
Sports Medicine Joint Repair
Trauma & Extremities
Other Surgical
5%
0%
-3%
-1%
4%
-4%
2%
8%
-5% 5% 15%
Full Year 2016 revenue growth of 2% underlying
16
Geographical growth Product franchise growth Revenue split
Underlying change (%) Underlying change (%)
Note: ‘Est OUS’ is Australia, Canada, Europe, Japan and New Zealand
15%

Our 2017 guidance and medium-term outlook
17
(1) Based on exchanges rates prevailing on 31st January 2017. (2) Tax rate on trading result
Sales growth:
Reported(1): 1.2% to 2.2% Underlying: 3% to 4%
Trading profit margin:
20-70bp improvement
Tax rate(2):
Around 26%
Underlying sales growth:
Consistent growth above market
Trading profit margin:
Ongoing improvement
Cash:
Releasing cash to invest in M&A and/or return to shareholders
2017
Medium - term
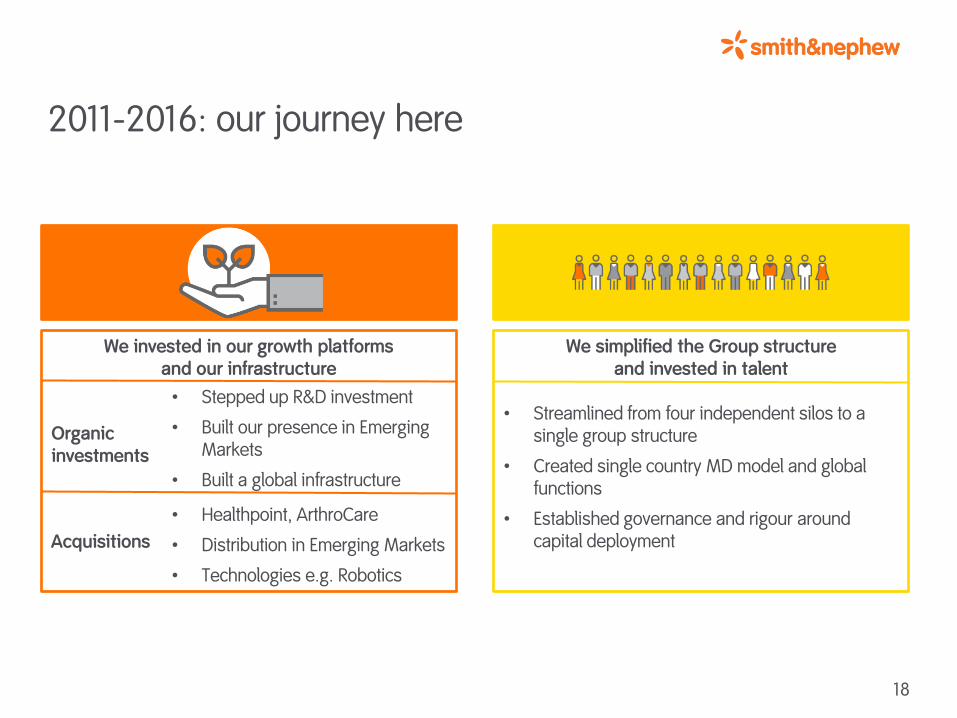
2011-2016: our journey here
18
We simplified the Group structure and invested in talent
• Streamlined from four independent silos to a
single group structure
• Created single country MD model and global functions
• Established governance and rigour around capital deployment
We invested in our growth platforms and our infrastructure
• Stepped up R&D investment
• Built our presence in Emerging Markets
• Built a global infrastructure
• Healthpoint, ArthroCare
• Distribution in Emerging Markets
• Technologies e.g. Robotics
Organic investments
Acquisitions
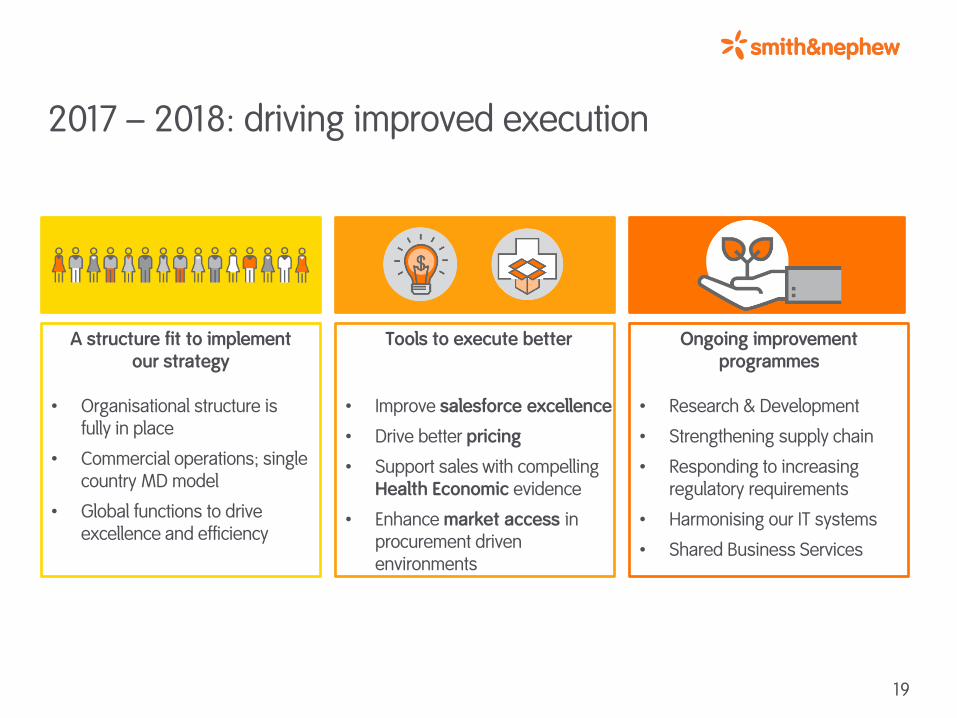
2017 – 2018: driving improved execution
19
Tools to execute better
• Improve salesforce excellence
• Drive better pricing
• Support sales with compelling Health Economic evidence
• Enhance market access in procurement driven environments
Ongoing improvement programmes
• Research & Development
• Strengthening supply chain
• Responding to increasing regulatory requirements
• Harmonising our IT systems
• Shared Business Services
A structure fit to implement our strategy
• Organisational structure is
fully in place
• Commercial operations; single country MD model
• Global functions to drive excellence and efficiency

Innovation remains at the heart of Smith & Nephew
20
• JOURNEY◊ II Knee System
• REDAPT Revision Hip System
• NAVIO◊ Surgical System
• Our comprehensive Joint Repair portfolio
• COBLATION◊ WEREWOLF System
• LENS Surgical Imaging System
• TRIGEN◊ INTERTAN◊ Intertrochanteric Nail
• PICO Single Use NPWT
Global R&D function
• Single group R&D strategy with focused organisation
• Prioritisation and harmonisation of projects
• Better execution of product launches
• External vs internal competencies
Strong product lines Driving innovation
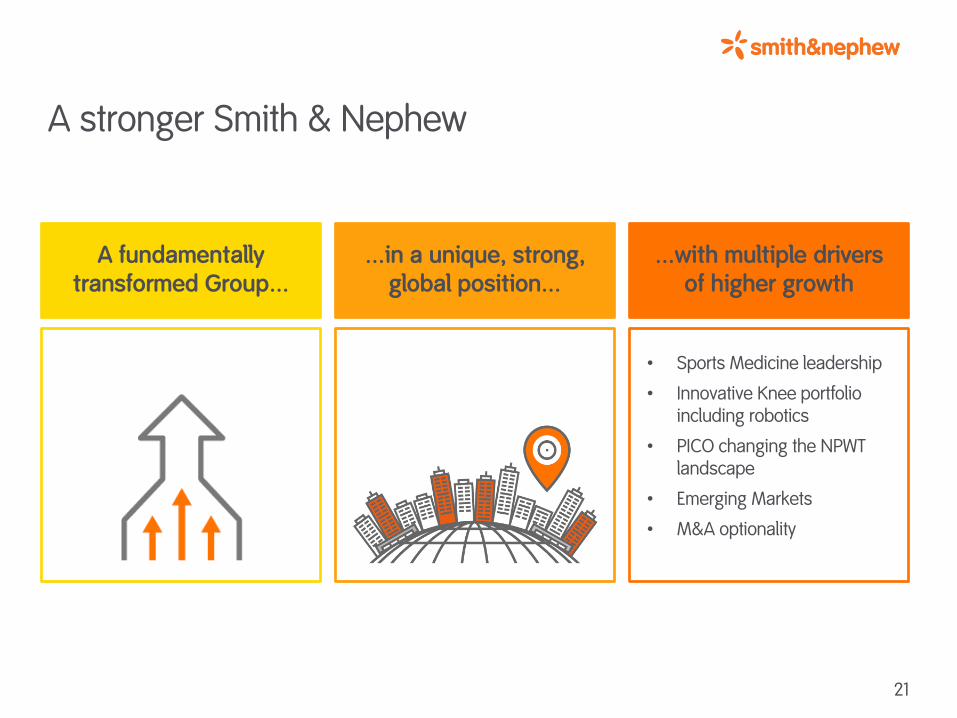
A stronger Smith & Nephew
21
• iple growth drivers A fundamentally transformed Group…
…in a unique, strong, global position…
…with multiple drivers of higher growth
• Sports Medicine leadership
• Innovative Knee portfolio including robotics
• PICO changing the NPWT landscape
• Emerging Markets
• M&A optionality

Appendices
22

Franchise revenue analysis
23 All revenue growth rates are on an underlying basis * ‘Other Surgical Businesses’ includes ENT, Gynaecology (prior to divestment in August) and robotic sales (excluding implant sales)
2015 2016
Q1 Q2 Q3 Q4 Full Year
Q1 Q2 Q3 Q4 Full Year
Growth Growth Growth Growth Growth Growth Growth Growth Growth Revenue Growth
% % % % % % % % % $m %
Sports Medicine, Trauma & OSB
5 4 2 5 4 5 4 4 1 1,907 3
Sports Medicine Joint Repair 9 7 4 9 7 11 10 8 5 587 8
Arthroscopic Enabling Technologies
(2) 1 (2) 3 - 4 4 2 (3) 631 2
Trauma & Extremities 5 2 2 - 2 (7) (6) 1 (4) 475 (4)
Other Surgical Businesses* 11 7 10 13 10 19 14 12 15 214 15
Reconstruction 1 4 3 4 3 7 3 2 (2) 1,529 2
Knee Implants 2 7 6 6 5 9 5 4 - 932 4
Hip Implants (1) 1 (2) 1 - 4 - - (6) 597 (1)
Advanced Wound Management 1 7 6 8 6 - (3) (1) (1) 1,233 (1)
Advanced Wound Care 9 12 6 4 8 - (7) (2) (3) 719 (3)
Advanced Wound Bioactives 5 6 2 16 7 (4) 4 (3) 1 342 -
Advanced Wound Devices (27) (9) 17 14 (3) 11 1 5 2 172 5
Group 3 5 4 5 4 4 2 2 (1) 4,669 2

Regional revenue analysis
24
‘Other Established Markets’ is Australia, Canada, Europe, Japan and New Zealand. All revenue growth rates are on an underlying basis
2015 2016
Q1 Q2 Q3 Q4 Full Year
Q1 Q2 Q3 Q4 Full Year
Growth Growth Growth Growth Growth Growth Growth Growth Growth Revenue Growth
% % % % % % % % % $m %
Geographic regions
US 1 4 4 9 5 8 4 2 - 2,299 3
Other Established Markets (2) 3 1 2 1 4 1 - (3) 1,679 -
Established Markets - 3 3 6 3 6 3 1 (1) 3,978 2
Emerging Markets 22 14 8 2 11 (6) (2) 6 3 691 -
Group 3 5 4 5 4 4 2 2 (1) 4,669 2
25
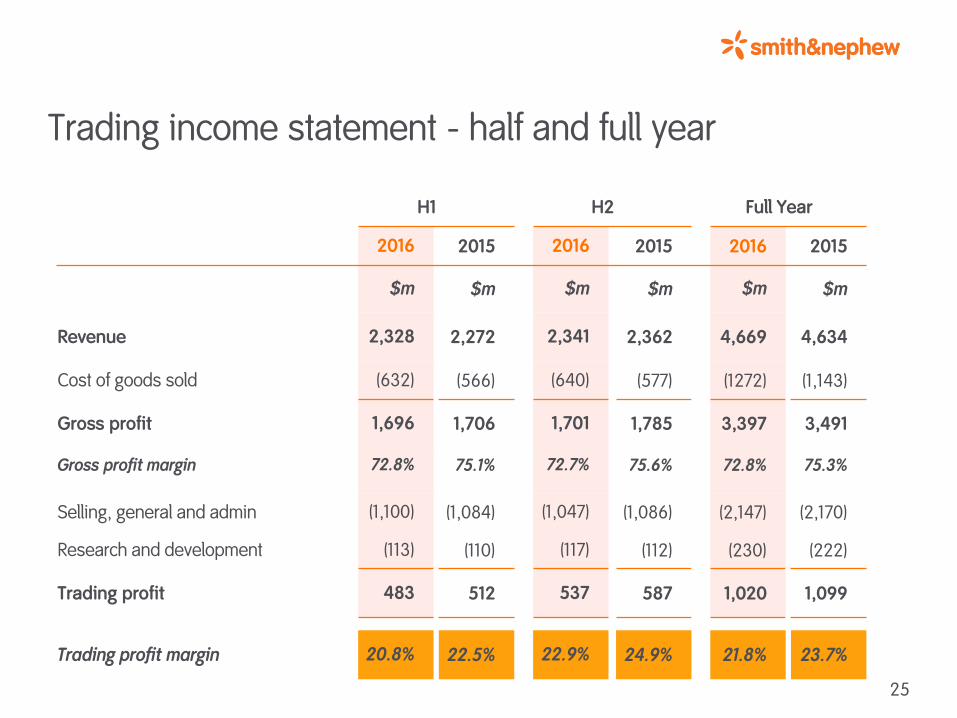
H1 H2 Full Year
2016 2015 2016 2015 2016 2015
$m $m $m $m $m $m
Revenue 2,328 2,272 2,341 2,362 4,669 4,634
Cost of goods sold (632) (566) (640) (577) (1272) (1,143)
Gross profit 1,696 1,706 1,701 1,785 3,397 3,491
Gross profit margin 72.8% 75.1% 72.7% 75.6% 72.8% 75.3%
Selling, general and admin (1,100) (1,084) (1,047) (1,086) (2,147) (2,170)
Research and development (113) (110) (117) (112) (230) (222)
Trading profit 483 512 537 587 1,020 1,099
Trading profit margin 20.8% 22.5% 22.9% 24.9% 21.8% 23.7%
Trading income statement - half and full year
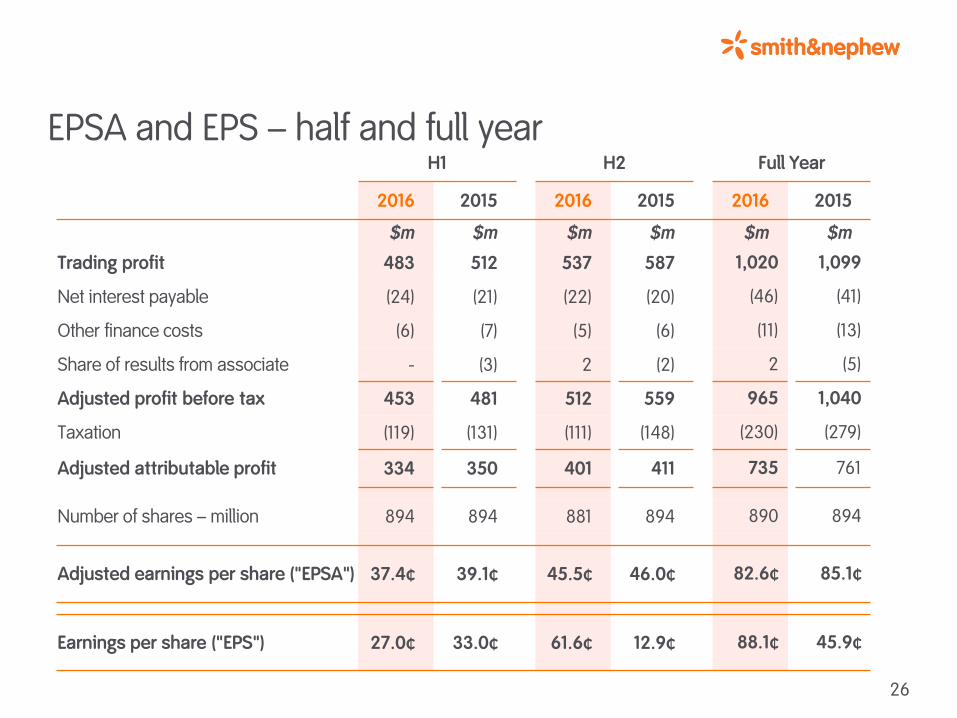
H1 H2 Full Year
2016 2015 2016 2015 2016 2015
$m $m $m $m $m $m
Trading profit 483 512 537 587 1,020 1,099
Net interest payable (24) (21) (22) (20) (46) (41)
Other finance costs (6) (7) (5) (6) (11) (13)
Share of results from associate - (3) 2 (2) 2 (5)
Adjusted profit before tax 453 481 512 559 965 1,040
Taxation (119) (131) (111) (148) (230) (279)
Adjusted attributable profit 334 350 401 411 735 761
Number of shares – million 894 894 881 894 890 894
Adjusted earnings per share ("EPSA") 37.4¢ 39.1¢ 45.5¢ 46.0¢ 82.6¢ 85.1¢
Earnings per share ("EPS") 27.0¢ 33.0¢ 61.6¢ 12.9¢ 88.1¢ 45.9¢
26
EPSA and EPS – half and full year
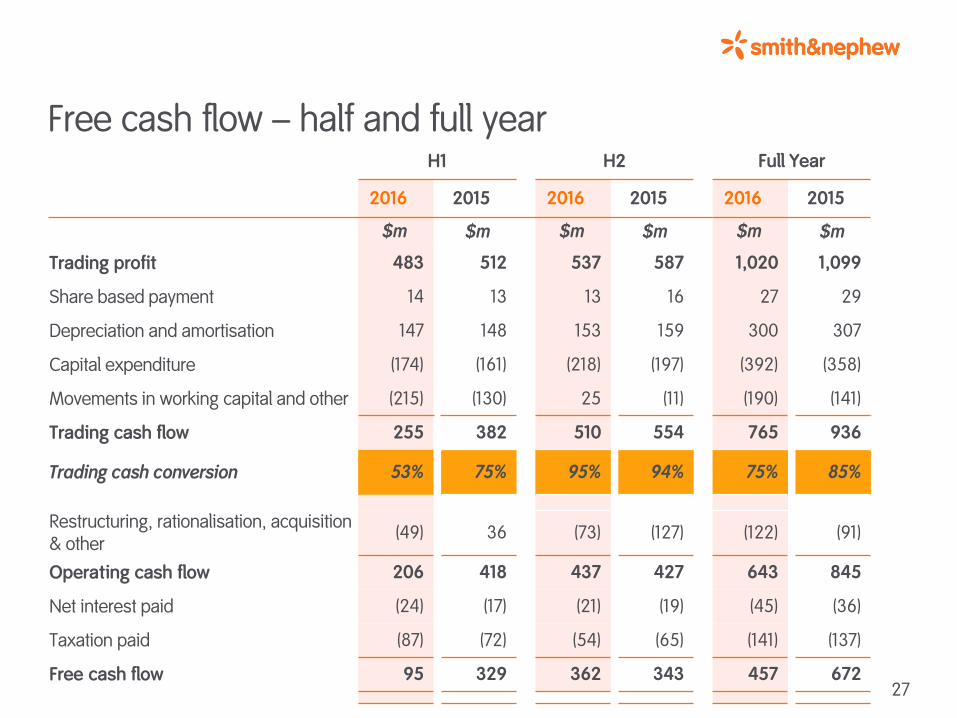
Free cash flow – half and full year
27
H1 H2 Full Year
2016 2015 2016 2015 2016 2015
$m $m $m $m $m $m
Trading profit 483 512 537 587 1,020 1,099
Share based payment 14 13 13 16 27 29
Depreciation and amortisation 147 148 153 159 300 307
Capital expenditure (174) (161) (218) (197) (392) (358)
Movements in working capital and other (215) (130) 25 (11) (190) (141)
Trading cash flow 255 382 510 554 765 936
Trading cash conversion 53% 75% 95% 94% 75% 85%
Restructuring, rationalisation, acquisition & other
(49) 36 (73) (127) (122) (91)
Operating cash flow 206 418 437 427 643 845
Net interest paid (24) (17) (21) (19) (45) (36)
Taxation paid (87) (72) (54) (65) (141) (137)
Free cash flow 95 329 362 343 457 672

Management
28
Olivier Bohuon Chief Executive Officer Olivier joined the Board and was appointed Chief Executive Officer in April 2011. Olivier has had extensive international experience within a number of pharmaceutical and healthcare companies. Prior to joining Smith & Nephew, he was President of Abbott Pharmaceuticals, a division of Abbott Laboratories based in the US, where he was responsible for the entire business, including R&D, Global Manufacturing and global support functions. Olivier has extensive international healthcare leadership experience within a number of significant pharmaceutical and healthcare companies. His global experience provides the skillset required to innovate a FTSE100 company with a deep heritage and provide inspiring leadership. He is a Non-executive Director of Virbac group and Shire plc.

Investor Relations Contacts
29
Ingeborg Øie
VP, Investor Relations
T: +44 (0) 207 960 2285
Smith & Nephew plc
15 Adam Street
London
WC2N 6LA
T: +44 (0) 207 401 7646
Kate Gibbon
Investor Relations Manager
T: +44 (0) 207 960 2339
