investor presentation - january 2017
TRANSCRIPT
Expanding Production and Reducing Costs
2
Disclaimer
SAFE HARBOR: Some statements contained in this presentation are forward-looking statements or forward-looking information (collectively, “forward-looking statements”) withinthe meaning of the United States Private Securities Litigation Reform Act of 1995 and applicable Canadian securities laws. Investors are cautioned that forward-looking statementsare inherently uncertain and involve risks and uncertainties that could cause actual results to differ materially. Such statements include comments regarding: the expansion ofproduction and reduction of costs at Golden Star’s projects, including the estimated amounts thereof; the exploration upside of the Company’s projects and ability of the Companyto increase mine lives; the timing for commercial production at Wassa Underground and Prestea Underground; the achievement of 2016 production, cash operating cost and capitalexpenditure guidance; the benefits of underground mining techniques including the impact on grades, costs, power usage, seasonality and permitting; life of mine average annualproduction at Wassa Underground; the current rate of decline development at Wassa Underground and the time for accessing the B-Shoot; the ability to extend the life of mine atPrestea Underground through exploration; the conversion of mineral resources into mineral reserves; the potential for growth of Golden Star’s share price; the improvement ofgrades at Wassa due to Wassa Underground production; production and cash operating costs for 2016; future work to be completed at Prestea Underground Mine, including thetiming for mechanical and electrical rehabilitation work, as well as pre-development and development work and stoping; and capital expenditures for the development of WassaUnderground and Prestea Underground mine. Factors that could cause actual results to differ materially include timing of and unexpected events at the Bogoso/Prestea and/or theWassa processing plants; variations in ore grade, tonnes mined, crushed or milled; delay or failure to receive board or government approvals and permits; construction delays; theavailability and cost of electrical power; timing and availability of external financing on acceptable terms or at all; technical, permitting, mining or processing issues, includingdifficulties in establishing the infrastructure for Wassa Underground, inconsistent power supplies, plant and/or equipment failures and an inability to obtain supplies and materials onreasonable terms (including pricing) or at all; changes in U.S. and Canadian securities markets; and fluctuations in gold price and input costs and general economic conditions.There can be no assurance that future developments affecting the Company will be those anticipated by management. Please refer to the discussion of these and other factors inour Annual Information Form for the year ended December 31, 2015 filed on SEDAR at www.sedar.com. The forecasts contained in this presentation constitute management'scurrent estimates, as of the date of this presentation, with respect to the matters covered thereby. We expect that these estimates will change as new information is received andthat actual results will vary from these estimates, possibly by material amounts. While we may elect to update these estimates at any time, we do not undertake to update anyestimate at any particular time or in response to any particular event. Investors and others should not assume that any forecasts in this presentation represent management'sestimate as of any date other than the date of this presentation.
NON-GAAP FINANCIAL MEASURES: In this presentation, we use the terms “cash operating cost per ounce”, “all-in sustaining cost per ounce”, “AISC per ounce”, “Adjusted NetLoss”, “Adjusted Net Loss/Share” and “Cash Flow from/(used in) operations”. These terms should be considered as Non-GAAP Financial Measures as defined in applicable Canadianand United States securities laws and should not be considered in isolation or as a substitute for measures of performance prepared in accordance with International FinancialReporting Standards (“IFRS”). “Cash operating cost per ounce” for a period is equal to the cost of sales excluding depreciation and amortization for the period less royalties, thecash component of metals inventory net realizable value adjustments and severance charges divided by the number of ounces of gold sold during the period. “All-in sustaining costsper ounce” commences with cash operating costs and then adds sustaining capital expenditures, corporate general and administrative costs, mine site exploratory drilling andgreenfield evaluation costs and environmental rehabilitation costs, divided by the number of ounces of gold sold during the period. This measure seeks to represent the total costsof producing gold from operations. These measures are not representative of all cash expenditures as they do not include income tax payments or interest costs. In order toindicate to stakeholders the Company's earnings excluding the non-cash (gain)/loss on the fair value of debentures, non-cash impairment charges and severance charges, theCompany calculates “Adjusted Net Loss” and “Adjusted Net Loss/Share” to supplement the condensed interim consolidated financial statements. “Cash flow from/(used in)operations” is calculated by subtracting the "Changes in working capital" from "Net cash provided by operating activities" as found in the statements of cash flows. These measuresare not necessarily indicative of operating profit or cash flow from operations as would be determined under IFRS. Changes in numerous factors including, but not limited to, miningrates, milling rates, gold grade, gold recovery, and the costs of labor, consumables and mine site general and administrative activities can cause these measures to increase ordecrease. We believe that these measures are the same or similar to the measures of other gold mining companies, but may not be comparable to similarly titled measures in everyinstance. Please see our “Management’s Discussion and Analysis for the three and six months ended June 30, 2016” and our “Management’s Discussion and Analysis of FinancialCondition and Results of Operations for the year ended December 31, 2015” for a reconciliation of these Non-GAAP measures to the nearest IFRS measure.
INFORMATION: The information contained in this presentation has been obtained by Golden Star from its own records and from other sources deemed reliable, however norepresentation or warranty is made as to its accuracy or completeness. The technical information relating to Golden Star's material properties disclosed herein is based upontechnical reports prepared and filed pursuant to National Instrument 43-101 - Standards of Disclosure for Mineral Projects ("NI 43-101") and other publicly available informationregarding the Company, including the following: (i) “NI 43-101 Technical Report on a Feasibility Study of the Wassa Open Pit Mine and Underground Project in Ghana” effectiveDecember 31, 2014; (ii) “NI 43-101 Technical Report on Resources and Reserves, Golden Star Resources Ltd., Bogoso Prestea Gold Mine, Ghana” effective December 31, 2013, and(iii) “NI 43-101 Technical Report on a Feasibility Study of the Prestea Underground gold project in Ghana” effective November 5, 2015. Additional information is included in GoldenStar's Annual Information Form for the year ended December 31, 2015 which is filed on SEDAR. Mineral Reserves were prepared under the supervision of Dr. Martin Raffield, SeniorVice President Technical Services for the Company. Dr. Raffield is a "Qualified Person" as defined by NI 43-101. The Qualified Person reviewing and validating the estimation of theMineral Resources is S. Mitchel Wasel, Golden Star Resources Vice President of Exploration.
CURRENCY: All monetary amounts refer to United States dollars unless otherwise indicated.
NYSE: GSSTSX: GSC
3
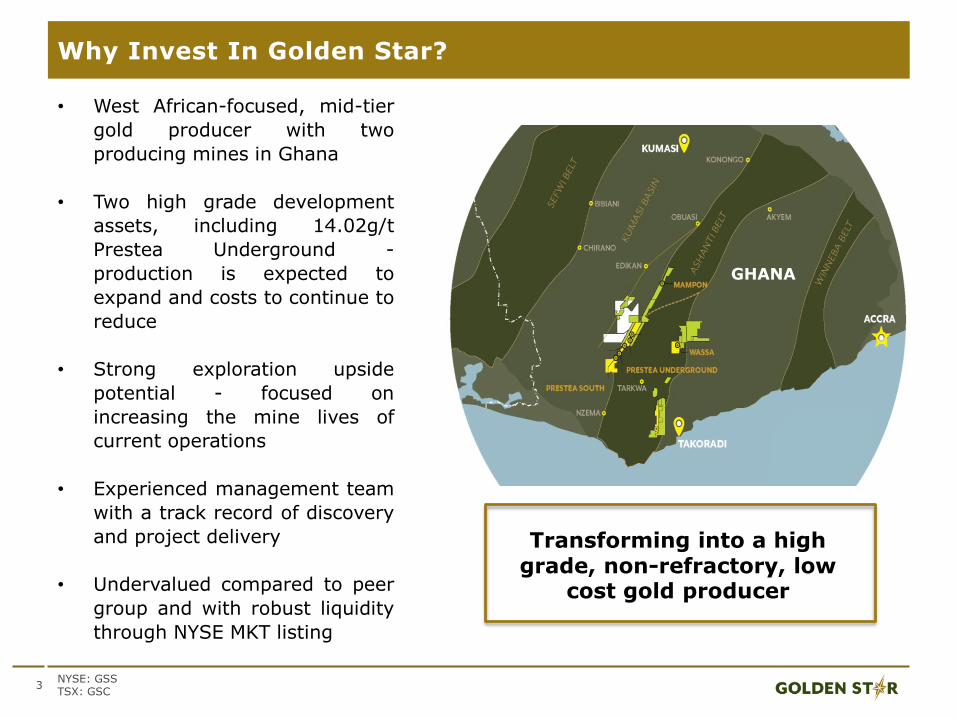
Why Invest In Golden Star?
• West African-focused, mid-tier
gold producer with two
producing mines in Ghana
• Two high grade development
assets, including 14.02g/t
Prestea Underground -
production is expected to
expand and costs to continue to
reduce
• Strong exploration upside
potential - focused on
increasing the mine lives of
current operations
• Experienced management team
with a track record of discovery
and project delivery
• Undervalued compared to peer
group and with robust liquidity
through NYSE MKT listing
Transforming into a high grade, non-refractory, low
cost gold producer
GHANA
NYSE: GSSTSX: GSC

4
Experienced Management and Technical Leadership
André van Niekerk, EVP & ChiefFinancial Officer• Joined GSR in 2006 - 5 years in
Ghana as GSR’s Head of Finance andBusiness Operations
• Previously VP, Financial Controller• Trained at KPMG
Sam Coetzer, President & CEO
• Mining engineer with over 26 years’experience with Kinross, Xstrata Nickel,Xstrata Coal and Placer Dome
• Previously SVP South American Operationsand managed integration of Red Back Miningfor Kinross
Daniel Owiredu, EVP & ChiefOperating Officer• 20 years’ experience in West African
mining, based in Ghana• Previously Deputy COO for AngloGold
- managed construction andoperation of the Bibiani, Siguiri andObuasi mines
Martin Raffield, SVP, ProjectDevelopment & Technical Services• Ph.D. geotechnical engineering & P.
Engineering• Previously worked for SRK, Placer
Dome and Breakwater Resources• Based at Prestea mine in Ghana
Mitch Wasel, VP Exploration• Joined GSR in 1993• Based in Ghana for GSR for past17
years• Previously spent 10 years in gold &
base metal exploration in northwestern Canada
NYSE: GSSTSX: GSC
5
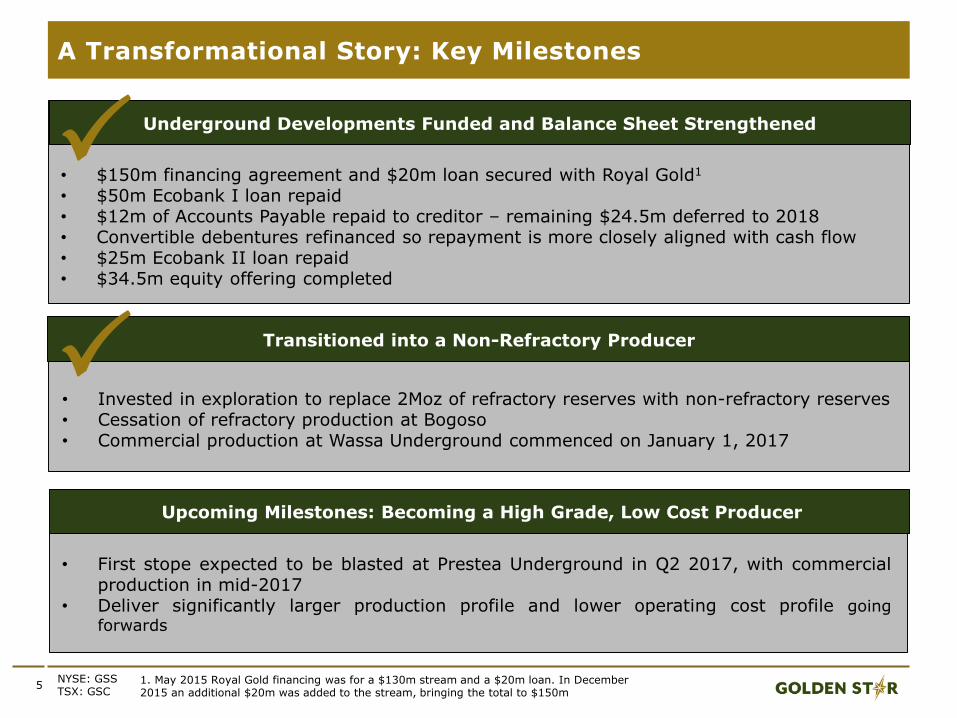
A Transformational Story: Key Milestones
Expected: Q2 2017
NYSE: GSSTSX: GSC
Achieved: xx Achieved: xx
Expected: Q2 2017
1. May 2015 Royal Gold financing was for a $130m stream and a $20m loan. In December 2015 an additional $20m was added to the stream, bringing the total to $150m
• $150m financing agreement and $20m loan secured with Royal Gold1
• $50m Ecobank I loan repaid• $12m of Accounts Payable repaid to creditor – remaining $24.5m deferred to 2018• Convertible debentures refinanced so repayment is more closely aligned with cash flow• $25m Ecobank II loan repaid• $34.5m equity offering completed
• First stope expected to be blasted at Prestea Underground in Q2 2017, with commercialproduction in mid-2017
• Deliver significantly larger production profile and lower operating cost profile goingforwards
Underground Developments Funded and Balance Sheet Strengthened
• Invested in exploration to replace 2Moz of refractory reserves with non-refractory reserves• Cessation of refractory production at Bogoso• Commercial production at Wassa Underground commenced on January 1, 2017
Transitioned into a Non-Refractory Producer
Upcoming Milestones: Becoming a High Grade, Low Cost Producer
6
2016 Production Guidance Achieved
NYSE: GSSTSX: GSC
0
10,000
20,000
30,000
40,000
50,000
Q1 16 Q2 16 Q3 16 Q4 16
Pro
duction ‘000oz
Quarters
2016 Quarterly Gold Production
Wassa Main Pit Prestea Open Pits Wassa Underground
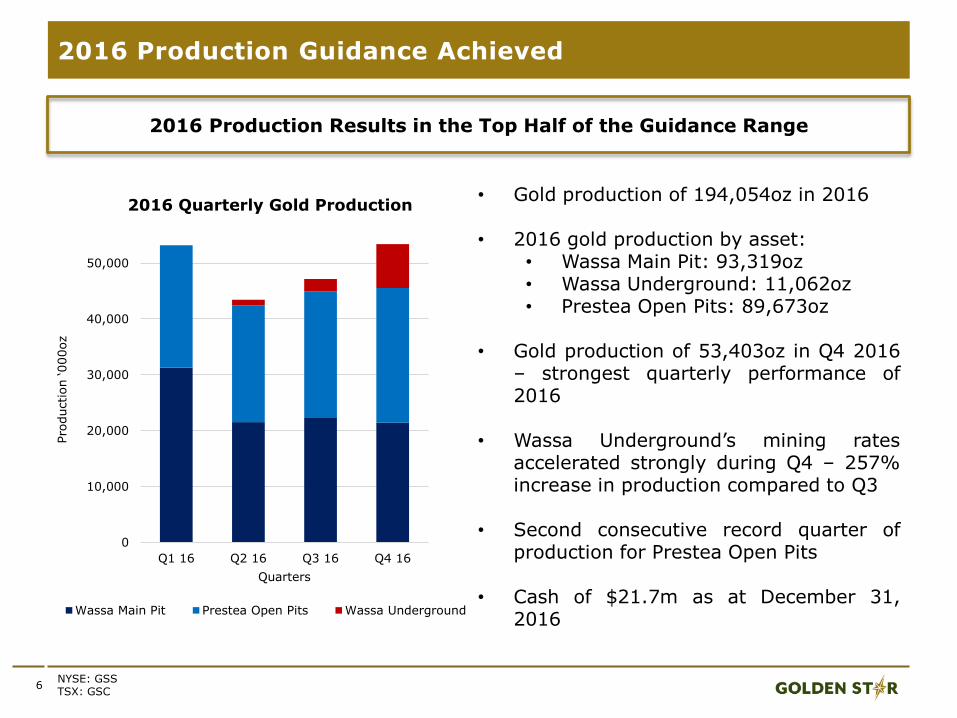
• Gold production of 194,054oz in 2016
• 2016 gold production by asset:• Wassa Main Pit: 93,319oz• Wassa Underground: 11,062oz• Prestea Open Pits: 89,673oz
• Gold production of 53,403oz in Q4 2016– strongest quarterly performance of2016
• Wassa Underground’s mining ratesaccelerated strongly during Q4 – 257%increase in production compared to Q3
• Second consecutive record quarter ofproduction for Prestea Open Pits
• Cash of $21.7m as at December 31,2016
2016 Production Results in the Top Half of the Guidance Range
7
2017 Guidance: Production and Cash Operating Costs1
NYSE: GSSTSX: GSC
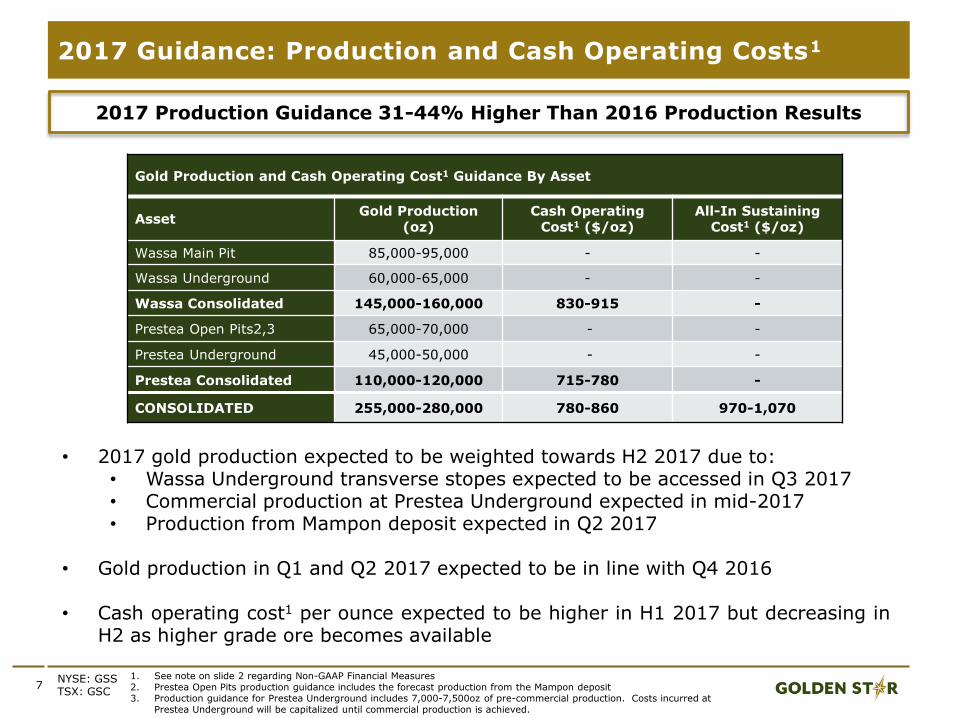
Gold Production and Cash Operating Cost1 Guidance By Asset
AssetGold Production
(oz)Cash Operating
Cost1 ($/oz)All-In Sustaining
Cost1 ($/oz)
Wassa Main Pit 85,000-95,000 - -
Wassa Underground 60,000-65,000 - -
Wassa Consolidated 145,000-160,000 830-915 -
Prestea Open Pits2,3 65,000-70,000 - -
Prestea Underground 45,000-50,000 - -
Prestea Consolidated 110,000-120,000 715-780 -
CONSOLIDATED 255,000-280,000 780-860 970-1,070
1. See note on slide 2 regarding Non-GAAP Financial Measures2. Prestea Open Pits production guidance includes the forecast production from the Mampon deposit3. Production guidance for Prestea Underground includes 7,000-7,500oz of pre-commercial production. Costs incurred at
Prestea Underground will be capitalized until commercial production is achieved.
• 2017 gold production expected to be weighted towards H2 2017 due to:• Wassa Underground transverse stopes expected to be accessed in Q3 2017• Commercial production at Prestea Underground expected in mid-2017• Production from Mampon deposit expected in Q2 2017
• Gold production in Q1 and Q2 2017 expected to be in line with Q4 2016
• Cash operating cost1 per ounce expected to be higher in H1 2017 but decreasing inH2 as higher grade ore becomes available
2017 Production Guidance 31-44% Higher Than 2016 Production Results
8
2017 Guidance: Capital Expenditures
NYSE: GSSTSX: GSC
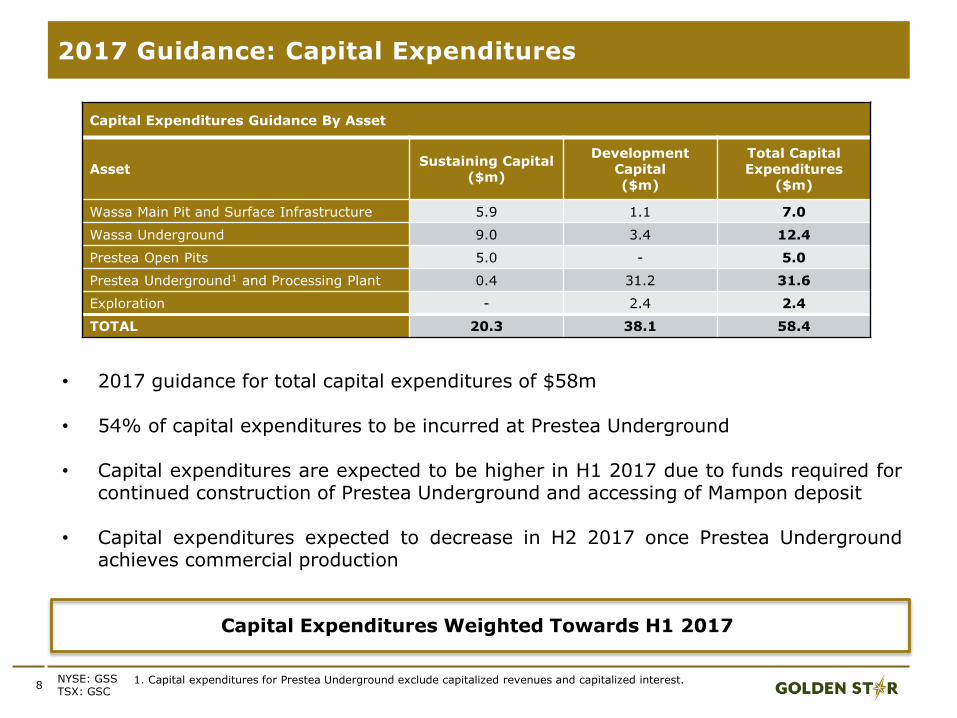
Capital Expenditures Weighted Towards H1 2017
Capital Expenditures Guidance By Asset
AssetSustaining Capital
($m)
Development Capital ($m)
Total Capital Expenditures
($m)
Wassa Main Pit and Surface Infrastructure 5.9 1.1 7.0
Wassa Underground 9.0 3.4 12.4
Prestea Open Pits 5.0 - 5.0
Prestea Underground1 and Processing Plant 0.4 31.2 31.6
Exploration - 2.4 2.4
TOTAL 20.3 38.1 58.4
• 2017 guidance for total capital expenditures of $58m
• 54% of capital expenditures to be incurred at Prestea Underground
• Capital expenditures are expected to be higher in H1 2017 due to funds required forcontinued construction of Prestea Underground and accessing of Mampon deposit
• Capital expenditures expected to decrease in H2 2017 once Prestea Undergroundachieves commercial production
1. Capital expenditures for Prestea Underground exclude capitalized revenues and capitalized interest.
9
Lower Costs and Stronger Cash Margin
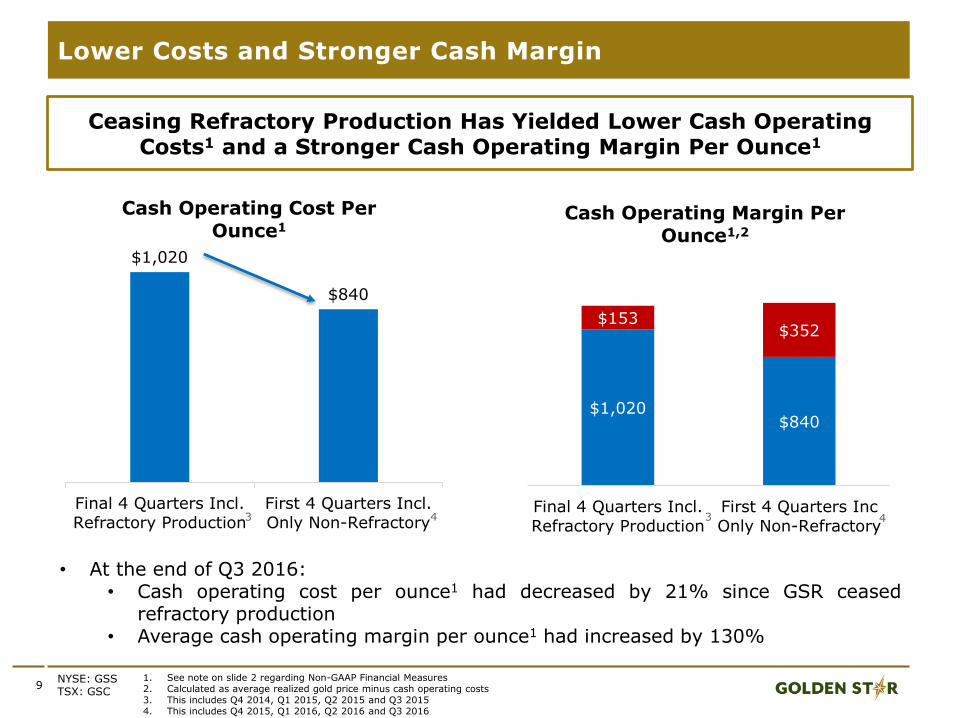
Ceasing Refractory Production Has Yielded Lower Cash Operating Costs1 and a Stronger Cash Operating Margin Per Ounce1
NYSE: GSSTSX: GSC
1. See note on slide 2 regarding Non-GAAP Financial Measures2. Calculated as average realized gold price minus cash operating costs3. This includes Q4 2014, Q1 2015, Q2 2015 and Q3 20154. This includes Q4 2015, Q1 2016, Q2 2016 and Q3 2016
$1,020
$840
Final 4 Quarters Incl.Refractory Production
First 4 Quarters Incl.Only Non-Refractory
Cash Operating Cost Per Ounce1
$1,020 $840
$153 $352
Final 4 Quarters Incl.Refractory Production
First 4 Quarters IncOnly Non-Refractory
Cash Operating Margin Per Ounce1,2
3 4 3
• At the end of Q3 2016:• Cash operating cost per ounce1 had decreased by 21% since GSR ceased
refractory production• Average cash operating margin per ounce1 had increased by 130%
4
10
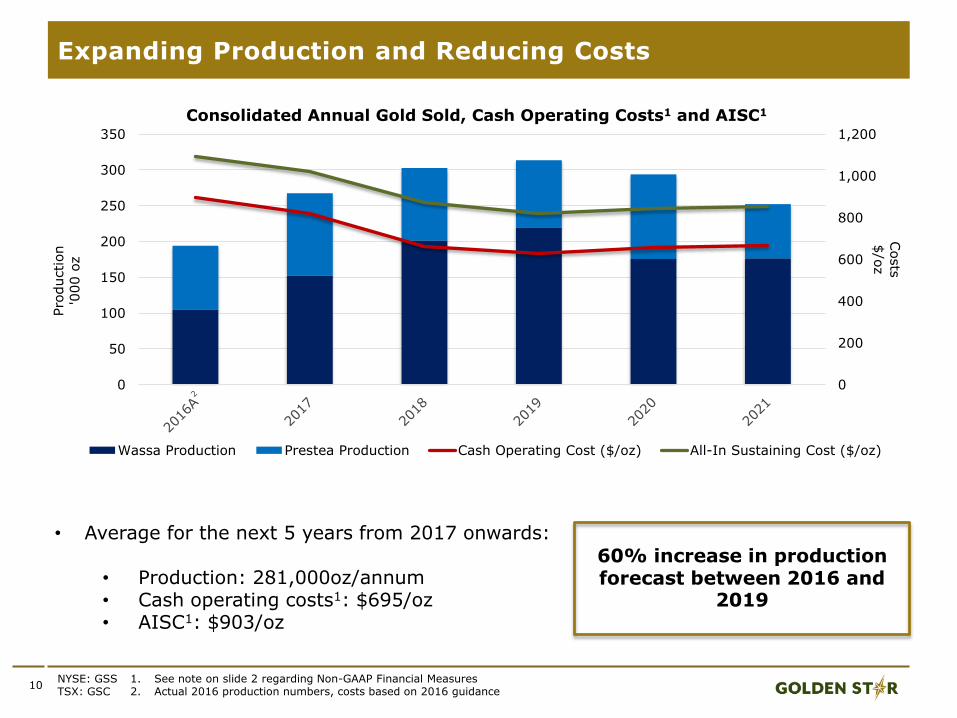
Expanding Production and Reducing Costs
• Average for the next 5 years from 2017 onwards:
• Production: 281,000oz/annum• Cash operating costs1: $695/oz• AISC1: $903/oz
NYSE: GSSTSX: GSC
60% increase in production forecast between 2016 and
2019
1. See note on slide 2 regarding Non-GAAP Financial Measures2. Actual 2016 production numbers, costs based on 2016 guidance
0
200
400
600
800
1,000
1,200
0
50
100
150
200
250
300
350
Costs
$/o
z
Pro
duction
'000 o
z
Consolidated Annual Gold Sold, Cash Operating Costs1 and AISC1
Wassa Production Prestea Production Cash Operating Cost ($/oz) All-In Sustaining Cost ($/oz)
11
OPERATIONS & EXPLORATIONOVERVIEW
Wassa Gold Mine
Prestea Gold Mine
12
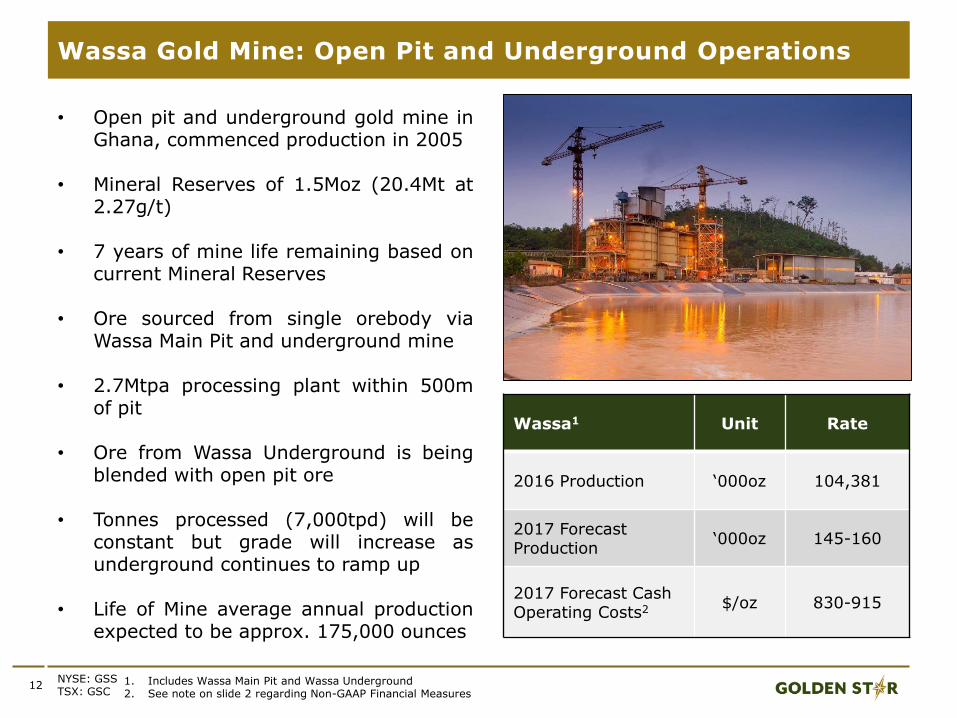
Wassa Gold Mine: Open Pit and Underground Operations
Wassa1 Unit Rate
2016 Production ‘000oz 104,381
2017 Forecast Production
‘000oz 145-160
2017 Forecast Cash Operating Costs2 $/oz 830-915
• Open pit and underground gold mine inGhana, commenced production in 2005
• Mineral Reserves of 1.5Moz (20.4Mt at2.27g/t)
• 7 years of mine life remaining based oncurrent Mineral Reserves
• Ore sourced from single orebody viaWassa Main Pit and underground mine
• 2.7Mtpa processing plant within 500mof pit
• Ore from Wassa Underground is beingblended with open pit ore
• Tonnes processed (7,000tpd) will beconstant but grade will increase asunderground continues to ramp up
• Life of Mine average annual productionexpected to be approx. 175,000 ounces
NYSE: GSSTSX: GSC
1. Includes Wassa Main Pit and Wassa Underground2. See note on slide 2 regarding Non-GAAP Financial Measures
13
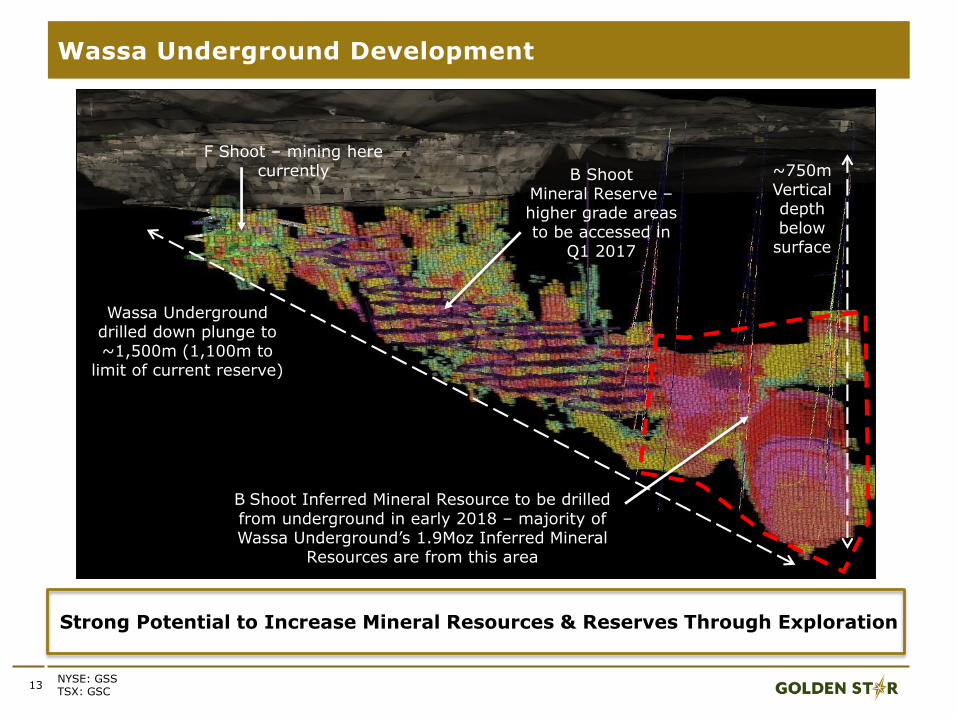
Wassa Underground Development
F Shoot
B Shoot
Strong Potential to Increase Mineral Resources & Reserves Through Exploration
NYSE: GSSTSX: GSC
F Shoot – mining here currently B Shoot
Mineral Reserve –higher grade areas to be accessed in
Q1 2017
~750m Vertical depth below
surface
Wassa Underground drilled down plunge to ~1,500m (1,100m to
limit of current reserve)
B Shoot Inferred Mineral Resource to be drilled from underground in early 2018 – majority of Wassa Underground’s 1.9Moz Inferred Mineral
Resources are from this area
14
Wassa UG: Significant Exploration Upside Potential
F Shoot
B Shoot
NYSE: GSSTSX: GSC
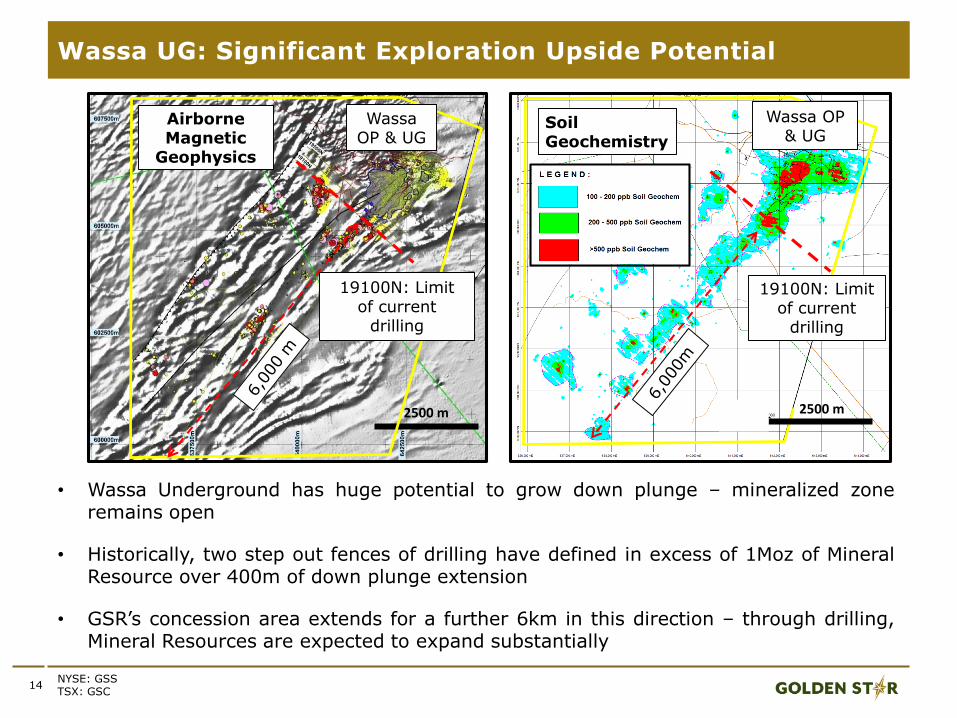
• Wassa Underground has huge potential to grow down plunge – mineralized zoneremains open
• Historically, two step out fences of drilling have defined in excess of 1Moz of MineralResource over 400m of down plunge extension
• GSR’s concession area extends for a further 6km in this direction – through drilling,Mineral Resources are expected to expand substantially
Soil Geochemistry
19100N: Limit of current
drilling
Wassa OP & UG
2500 m
Wassa OP & UG
Airborne Magnetic
Geophysics
19100N: Limit of current
drilling
2500 m
15
Prestea Gold Mine: Refractory Ore Phased Out
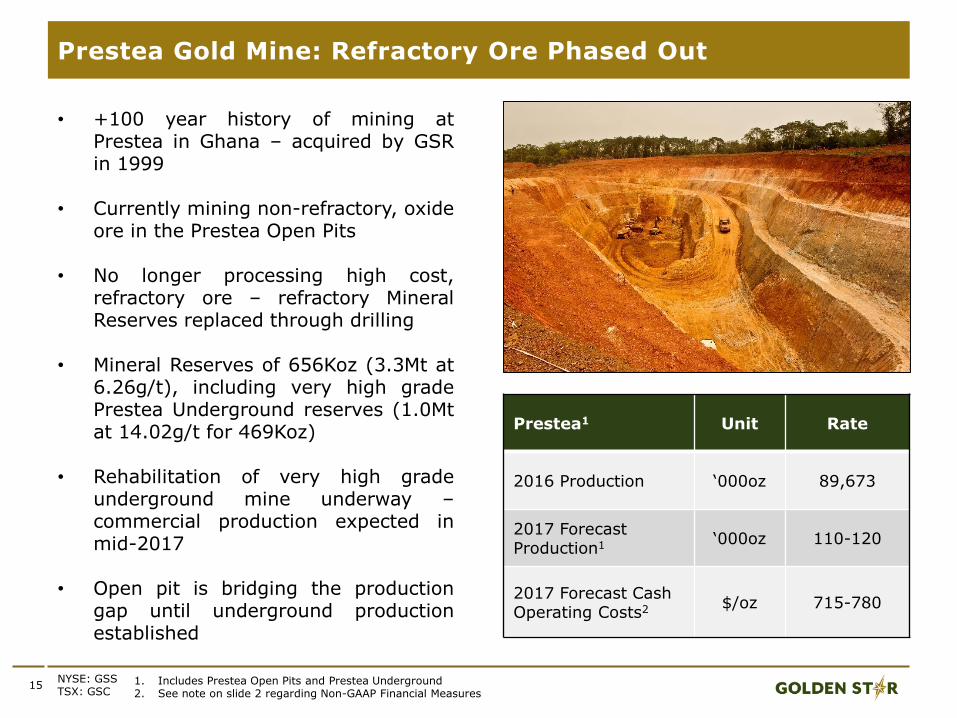
• +100 year history of mining atPrestea in Ghana – acquired by GSRin 1999
• Currently mining non-refractory, oxideore in the Prestea Open Pits
• No longer processing high cost,refractory ore – refractory MineralReserves replaced through drilling
• Mineral Reserves of 656Koz (3.3Mt at6.26g/t), including very high gradePrestea Underground reserves (1.0Mtat 14.02g/t for 469Koz)
• Rehabilitation of very high gradeunderground mine underway –commercial production expected inmid-2017
• Open pit is bridging the productiongap until underground productionestablished
1. Includes Prestea Open Pits and Prestea Underground2. See note on slide 2 regarding Non-GAAP Financial Measures
NYSE: GSSTSX: GSC
Prestea1 Unit Rate
2016 Production ‘000oz 89,673
2017 Forecast Production1 ‘000oz 110-120
2017 Forecast Cash Operating Costs2 $/oz 715-780
16
Mampon Mining Lease Received
NYSE: GSSTSX: GSC
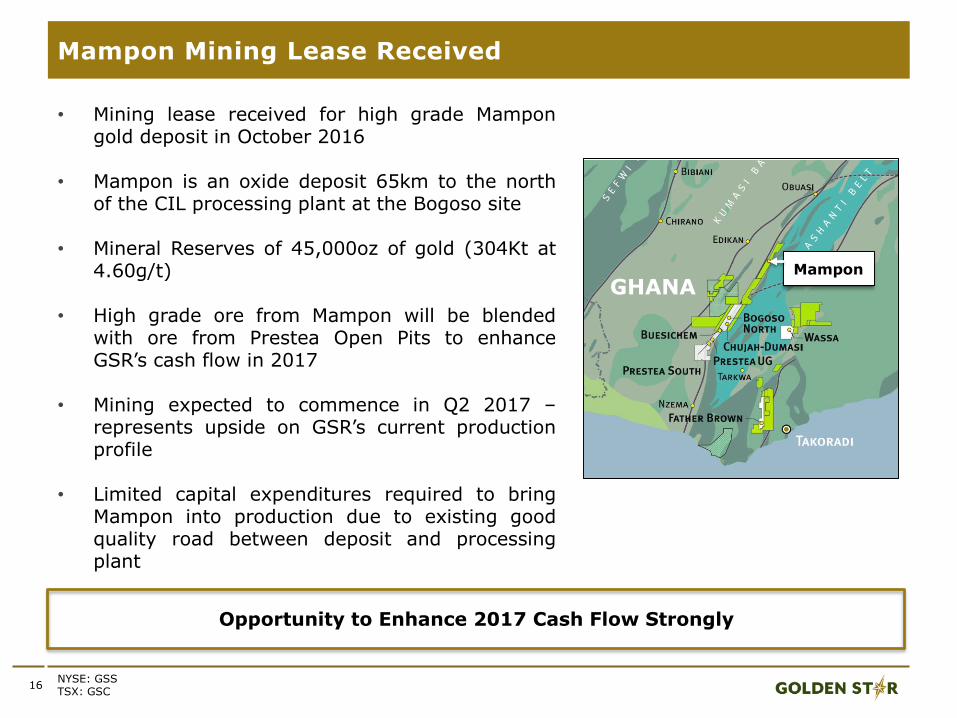
• Mining lease received for high grade Mampongold deposit in October 2016
• Mampon is an oxide deposit 65km to the northof the CIL processing plant at the Bogoso site
• Mineral Reserves of 45,000oz of gold (304Kt at4.60g/t)
• High grade ore from Mampon will be blendedwith ore from Prestea Open Pits to enhanceGSR’s cash flow in 2017
• Mining expected to commence in Q2 2017 –represents upside on GSR’s current productionprofile
• Limited capital expenditures required to bringMampon into production due to existing goodquality road between deposit and processingplant
Opportunity to Enhance 2017 Cash Flow Strongly
GHANAMampon
17
Prestea Underground: Project Update
1. See note on slide 2 regarding Non-GAAP Financial MeasuresNYSE: GSSTSX: GSC
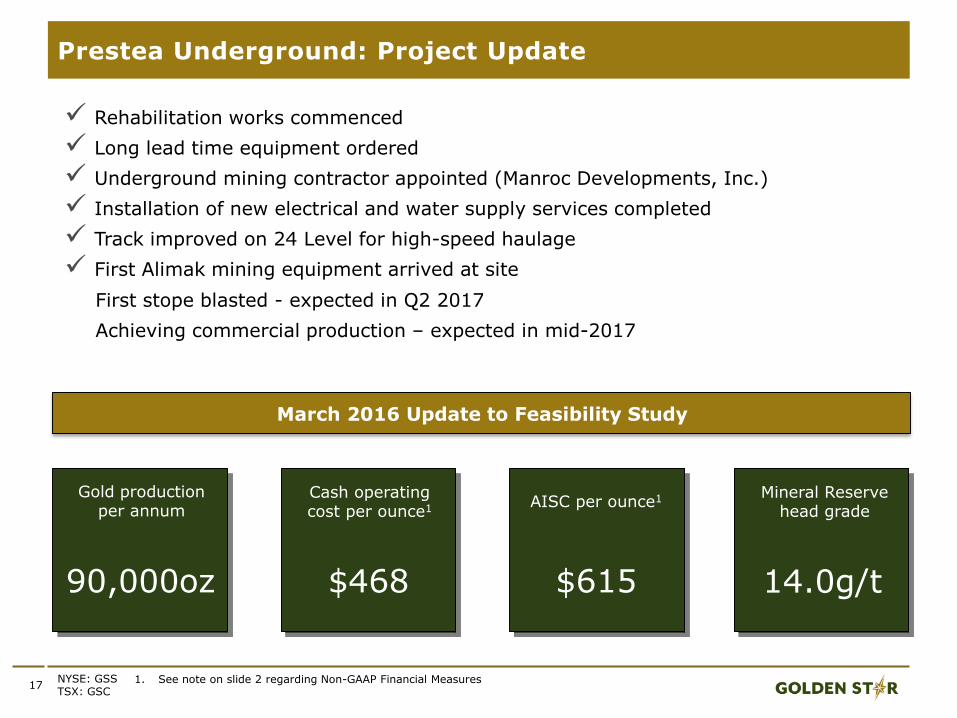
Rehabilitation works commenced
Long lead time equipment ordered
Underground mining contractor appointed (Manroc Developments, Inc.)
Installation of new electrical and water supply services completed
Track improved on 24 Level for high-speed haulage
First Alimak mining equipment arrived at site
First stope blasted - expected in Q2 2017
Achieving commercial production – expected in mid-2017
March 2016 Update to Feasibility Study
Gold production per annum
90,000oz
Cash operating cost per ounce1
$468
Mineral Reserve head grade
14.0g/t
AISC per ounce1
$615
18
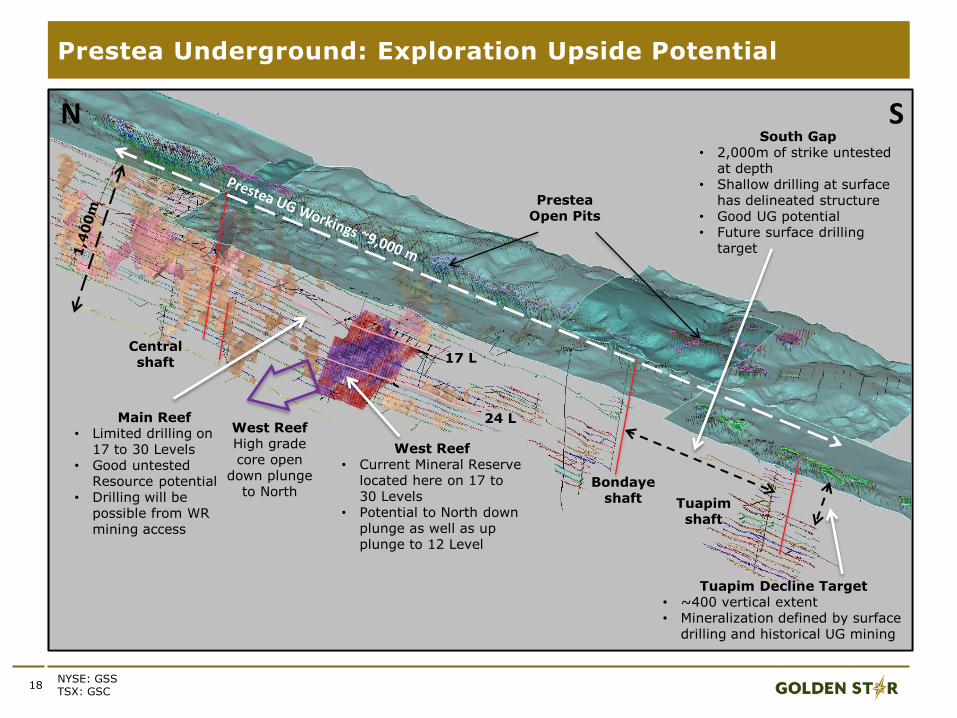
Prestea Underground: Exploration Upside Potential
NYSE: GSSTSX: GSC
West Reef• Current Mineral Reserve
located here on 17 to 30 Levels
• Potential to North down plunge as well as up plunge to 12 Level
PresteaOpen Pits
Main Reef• Limited drilling on
17 to 30 Levels• Good untested
Resource potential • Drilling will be
possible from WR mining access
South Gap • 2,000m of strike untested
at depth• Shallow drilling at surface
has delineated structure• Good UG potential • Future surface drilling
target
Tuapim Decline Target• ~400 vertical extent• Mineralization defined by surface
drilling and historical UG mining
N
Bondaye shaft Tuapim
shaft
17 L
24 L
Central shaft
West Reef High grade core open
down plunge to North
S
19
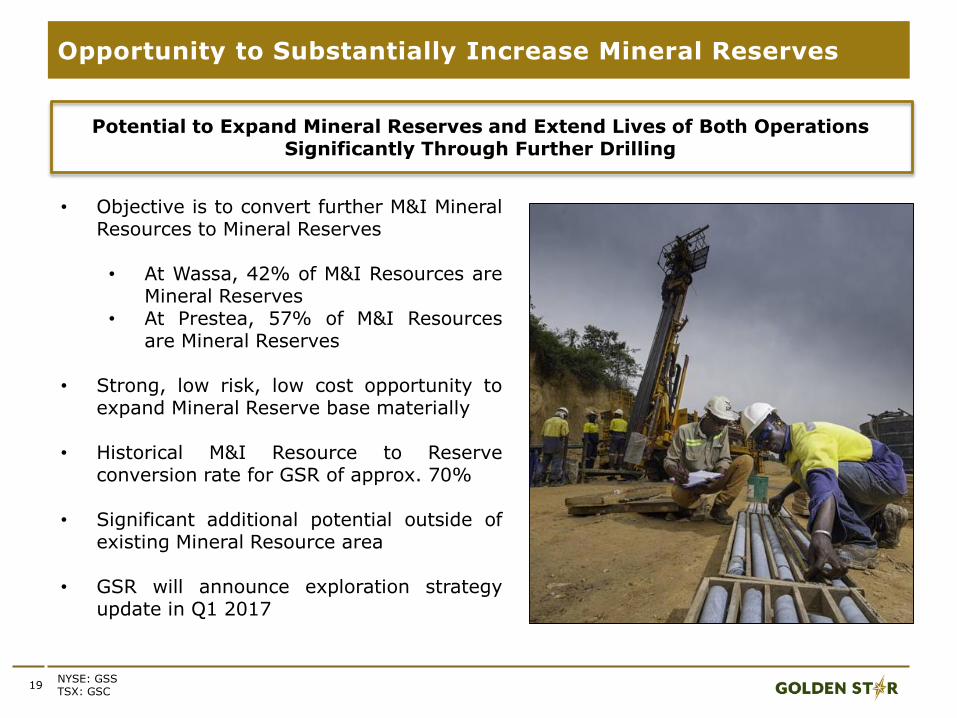
Opportunity to Substantially Increase Mineral Reserves
NYSE: GSSTSX: GSC
• Objective is to convert further M&I MineralResources to Mineral Reserves
• At Wassa, 42% of M&I Resources areMineral Reserves
• At Prestea, 57% of M&I Resourcesare Mineral Reserves
• Strong, low risk, low cost opportunity toexpand Mineral Reserve base materially
• Historical M&I Resource to Reserveconversion rate for GSR of approx. 70%
• Significant additional potential outside ofexisting Mineral Resource area
• GSR will announce exploration strategyupdate in Q1 2017
Potential to Expand Mineral Reserves and Extend Lives of Both Operations Significantly Through Further Drilling
20
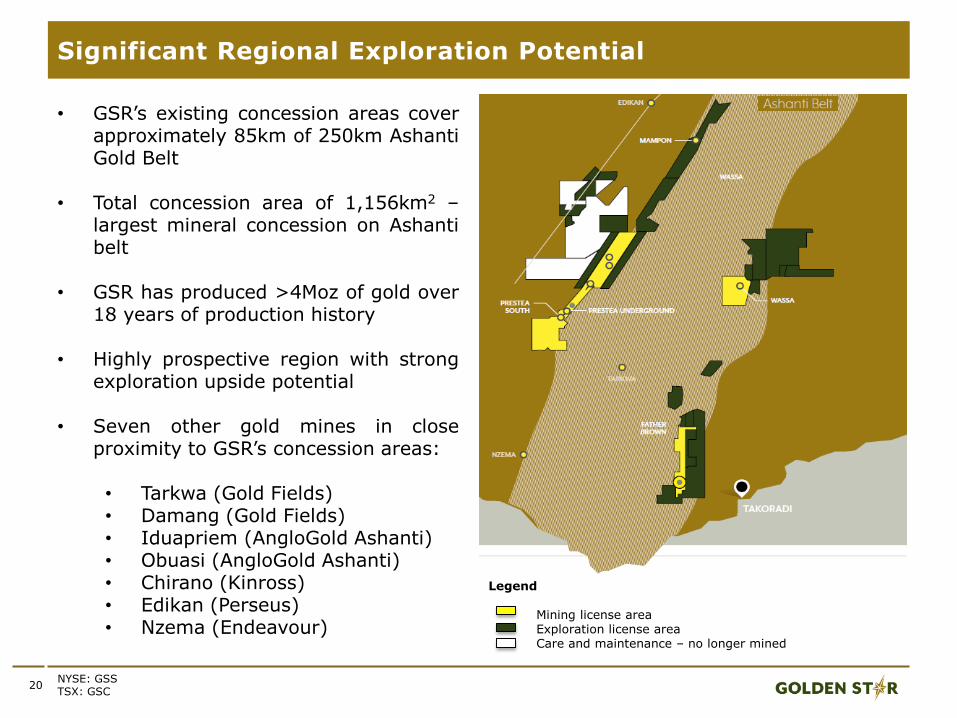
Significant Regional Exploration Potential
NYSE: GSSTSX: GSC
• GSR’s existing concession areas coverapproximately 85km of 250km AshantiGold Belt
• Total concession area of 1,156km2 –largest mineral concession on Ashantibelt
• GSR has produced >4Moz of gold over18 years of production history
• Highly prospective region with strongexploration upside potential
• Seven other gold mines in closeproximity to GSR’s concession areas:
• Tarkwa (Gold Fields)• Damang (Gold Fields)• Iduapriem (AngloGold Ashanti)• Obuasi (AngloGold Ashanti)• Chirano (Kinross)• Edikan (Perseus)• Nzema (Endeavour)
Legend
Mining license areaExploration license areaCare and maintenance – no longer mined
21NYSE: GSSTSX: GSC
DEBT MATURITY SCHEDULE AND KEY MILESTONES
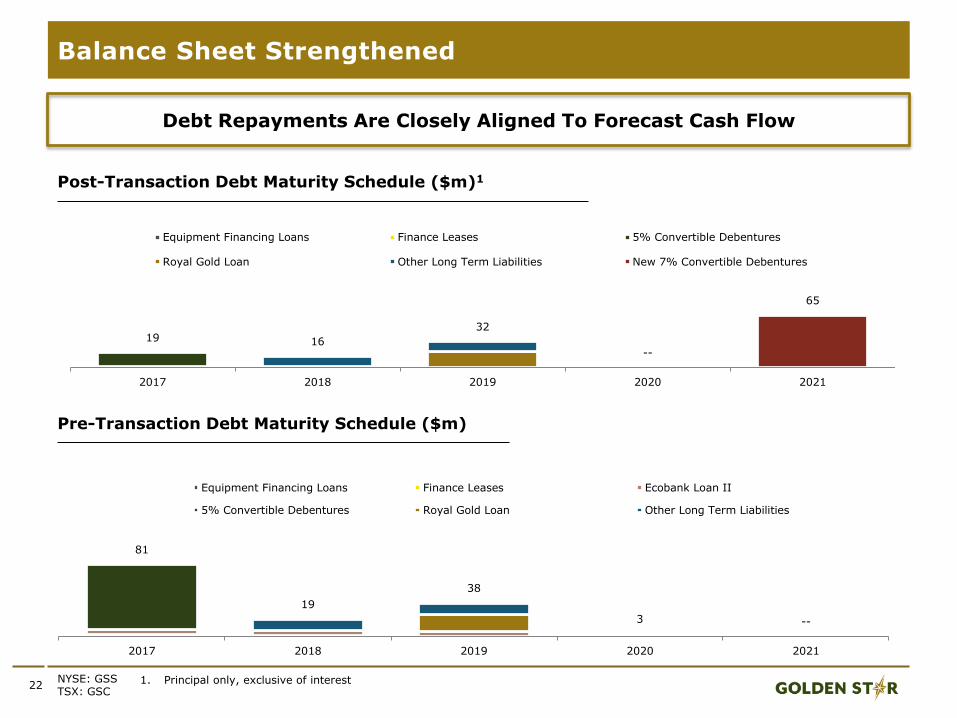
Post-Transaction Debt Maturity Schedule ($m)1
22
Balance Sheet Strengthened
NYSE: GSSTSX: GSC
Pre-Transaction Debt Maturity Schedule ($m)
1. Principal only, exclusive of interest
Debt Repayments Are Closely Aligned To Forecast Cash Flow
81
19
38
3 --
2017 2018 2019 2020 2021
Equipment Financing Loans Finance Leases Ecobank Loan II
5% Convertible Debentures Royal Gold Loan Other Long Term Liabilities
19 16
32
--
65
2017 2018 2019 2020 2021
Equipment Financing Loans Finance Leases 5% Convertible Debentures
Royal Gold Loan Other Long Term Liabilities New 7% Convertible Debentures
23
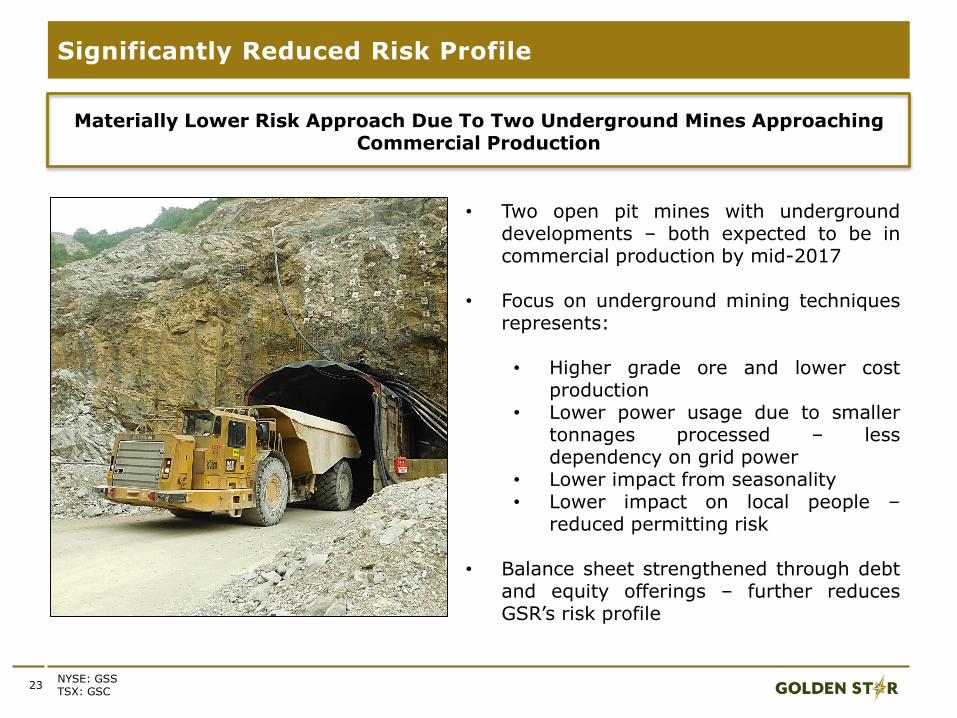
Significantly Reduced Risk Profile
NYSE: GSSTSX: GSC
• Two open pit mines with undergrounddevelopments – both expected to be incommercial production by mid-2017
• Focus on underground mining techniquesrepresents:
• Higher grade ore and lower costproduction
• Lower power usage due to smallertonnages processed – lessdependency on grid power
• Lower impact from seasonality• Lower impact on local people –
reduced permitting risk
• Balance sheet strengthened through debtand equity offerings – further reducesGSR’s risk profile
Materially Lower Risk Approach Due To Two Underground Mines Approaching Commercial Production
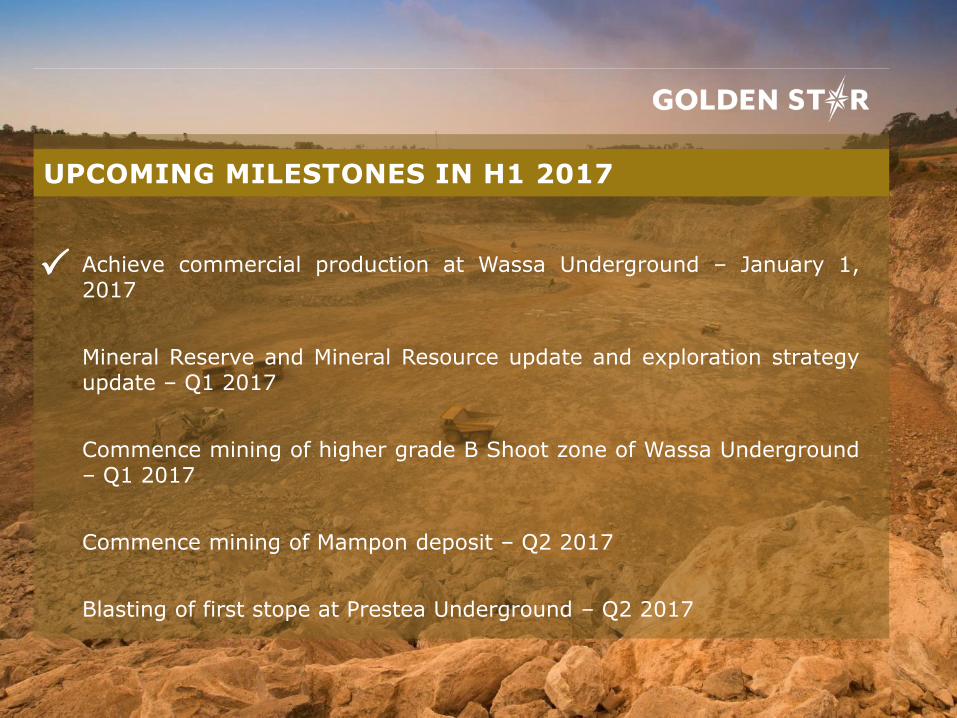
Achieve commercial production at Wassa Underground – January 1,2017
Mineral Reserve and Mineral Resource update and exploration strategyupdate – Q1 2017
Commence mining of higher grade B Shoot zone of Wassa Underground– Q1 2017
Commence mining of Mampon deposit – Q2 2017
Blasting of first stope at Prestea Underground – Q2 2017
UPCOMING MILESTONES IN H1 2017
26
Appendices: Market Information
One year SP graph
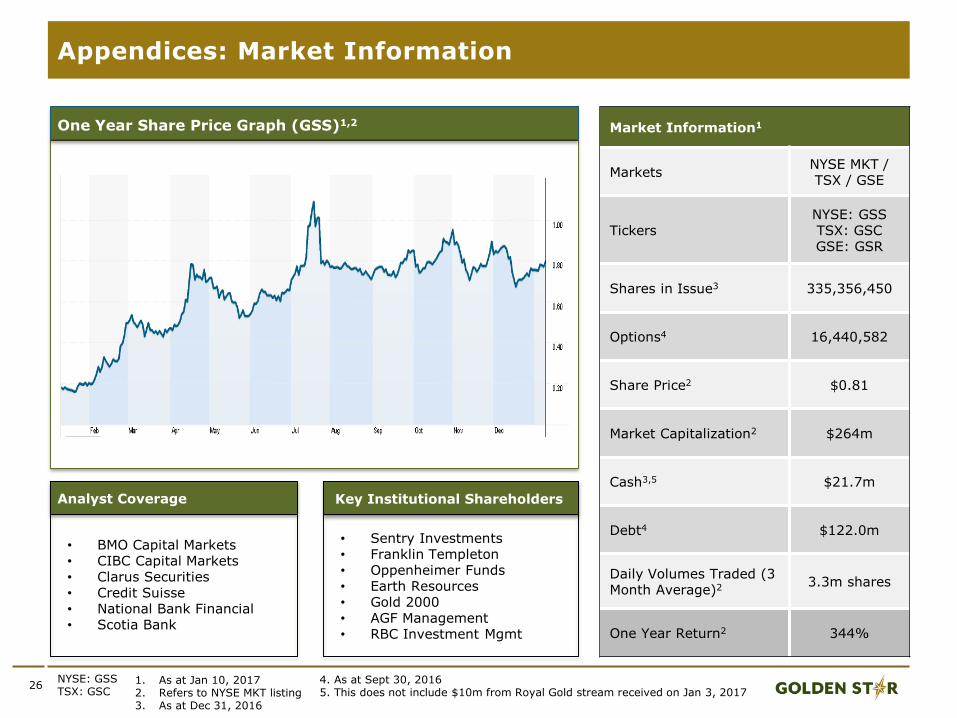
Market Information1
MarketsNYSE MKT / TSX / GSE
TickersNYSE: GSSTSX: GSCGSE: GSR
Shares in Issue3 335,356,450
Options4 16,440,582
Share Price2 $0.81
Market Capitalization2 $264m
Cash3,5 $21.7m
Debt4 $122.0m
Daily Volumes Traded (3 Month Average)2 3.3m shares
One Year Return2 344%
One Year Share Price Graph (GSS)1,2
Xxx% share price increase in 1 year
Analyst Coverage Key Institutional Shareholders
• BMO Capital Markets• CIBC Capital Markets• Clarus Securities• Credit Suisse• National Bank Financial• Scotia Bank
• Sentry Investments• Franklin Templeton• Oppenheimer Funds• Earth Resources• Gold 2000• AGF Management• RBC Investment Mgmt
1. As at Jan 10, 20172. Refers to NYSE MKT listing3. As at Dec 31, 2016
NYSE: GSSTSX: GSC
4. As at Sept 30, 20165. This does not include $10m from Royal Gold stream received on Jan 3, 2017

27
A Responsible Corporate Citizen
NYSE: GSSTSX: GSC
99% of our workforce and contractors are Ghanaian59% of our workforce and contractors are from local communities
GSR supports a range of community projects focused on thekey areas of healthcare, education and sustainableagribusiness.
For more information on our commitment to corporate socialresponsibility, please visit www.gsr.com/responsibility
1
1. Refers to the 10% of royalties given to stools/traditional authorities. The total amount paid by GSR in 2015 to Government came to $36.9m and the total over the Company’s life to $287m..
28
Q3 2016 Financial Highlights
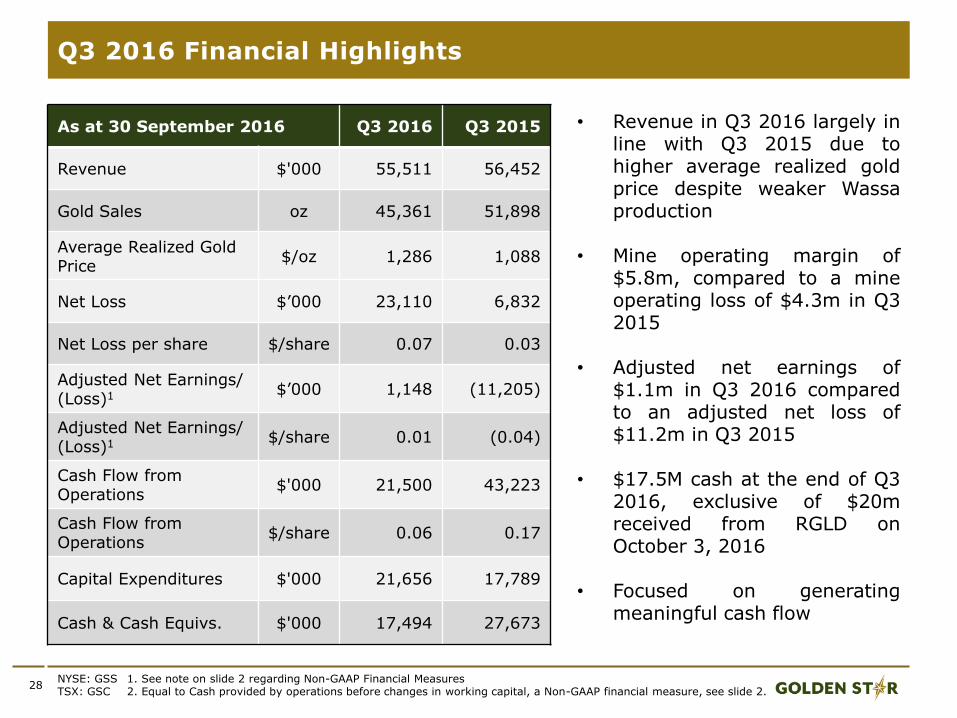
As at 30 September 2016 Q3 2016 Q3 2015
Revenue $'000 55,511 56,452
Gold Sales oz 45,361 51,898
Average Realized Gold Price
$/oz 1,286 1,088
Net Loss $’000 23,110 6,832
Net Loss per share $/share 0.07 0.03
Adjusted Net Earnings/ (Loss)1 $’000 1,148 (11,205)
Adjusted Net Earnings/ (Loss)1 $/share 0.01 (0.04)
Cash Flow from Operations
$'000 21,500 43,223
Cash Flow from Operations
$/share 0.06 0.17
Capital Expenditures $'000 21,656 17,789
Cash & Cash Equivs. $'000 17,494 27,673
NYSE: GSSTSX: GSC
• Revenue in Q3 2016 largely inline with Q3 2015 due tohigher average realized goldprice despite weaker Wassaproduction
• Mine operating margin of$5.8m, compared to a mineoperating loss of $4.3m in Q32015
• Adjusted net earnings of$1.1m in Q3 2016 comparedto an adjusted net loss of$11.2m in Q3 2015
• $17.5M cash at the end of Q32016, exclusive of $20mreceived from RGLD onOctober 3, 2016
• Focused on generatingmeaningful cash flow
1. See note on slide 2 regarding Non-GAAP Financial Measures2. Equal to Cash provided by operations before changes in working capital, a Non-GAAP financial measure, see slide 2.
29
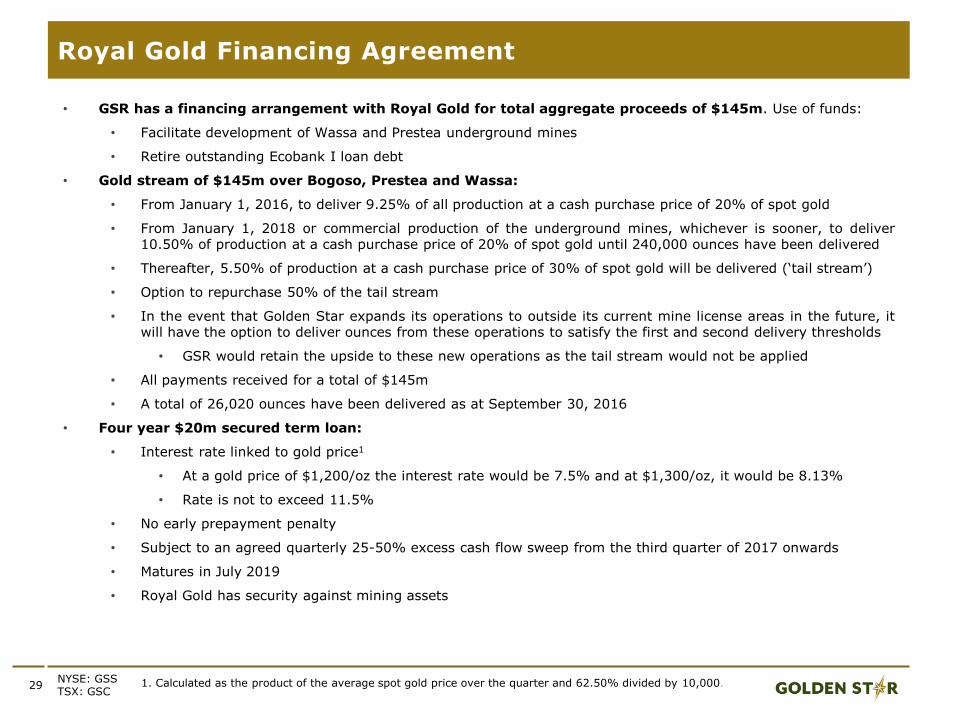
• GSR has a financing arrangement with Royal Gold for total aggregate proceeds of $145m. Use of funds:
• Facilitate development of Wassa and Prestea underground mines
• Retire outstanding Ecobank I loan debt
• Gold stream of $145m over Bogoso, Prestea and Wassa:
• From January 1, 2016, to deliver 9.25% of all production at a cash purchase price of 20% of spot gold
• From January 1, 2018 or commercial production of the underground mines, whichever is sooner, to deliver10.50% of production at a cash purchase price of 20% of spot gold until 240,000 ounces have been delivered
• Thereafter, 5.50% of production at a cash purchase price of 30% of spot gold will be delivered (‘tail stream’)
• Option to repurchase 50% of the tail stream
• In the event that Golden Star expands its operations to outside its current mine license areas in the future, itwill have the option to deliver ounces from these operations to satisfy the first and second delivery thresholds
• GSR would retain the upside to these new operations as the tail stream would not be applied
• All payments received for a total of $145m
• A total of 26,020 ounces have been delivered as at September 30, 2016
• Four year $20m secured term loan:
• Interest rate linked to gold price1
• At a gold price of $1,200/oz the interest rate would be 7.5% and at $1,300/oz, it would be 8.13%
• Rate is not to exceed 11.5%
• No early prepayment penalty
• Subject to an agreed quarterly 25-50% excess cash flow sweep from the third quarter of 2017 onwards
• Matures in July 2019
• Royal Gold has security against mining assets
1. Calculated as the product of the average spot gold price over the quarter and 62.50% divided by 10,000.NYSE: GSSTSX: GSC
Royal Gold Financing Agreement
30
Mineral Reserves and Resources
NYSE: GSSTSX: GSC
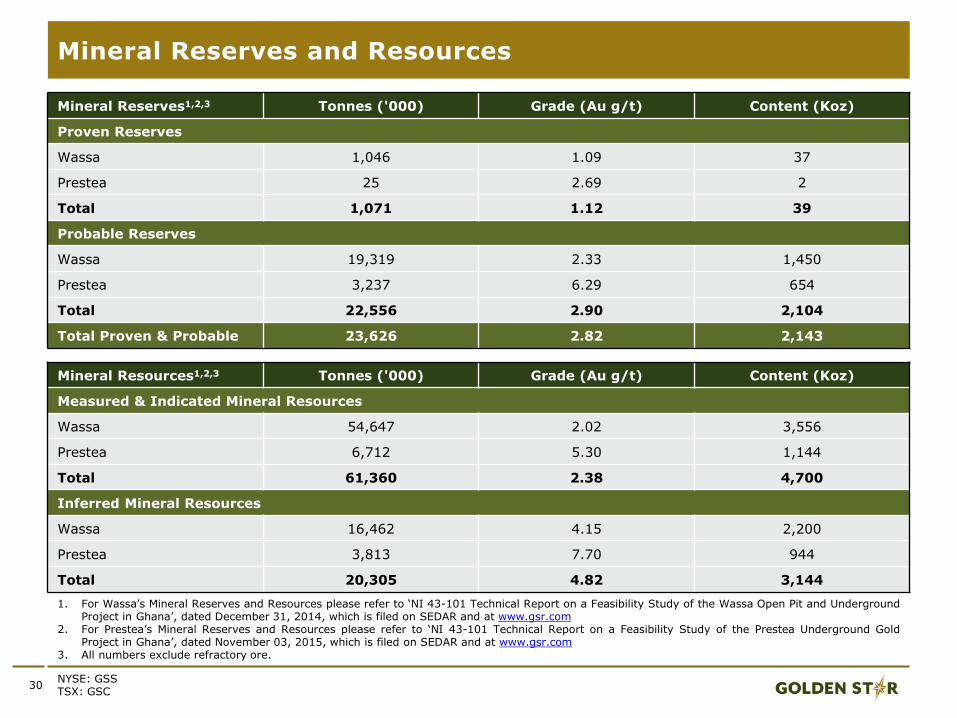
Mineral Reserves1,2,3 Tonnes ('000) Grade (Au g/t) Content (Koz)
Proven Reserves
Wassa 1,046 1.09 37
Prestea 25 2.69 2
Total 1,071 1.12 39
Probable Reserves
Wassa 19,319 2.33 1,450
Prestea 3,237 6.29 654
Total 22,556 2.90 2,104
Total Proven & Probable 23,626 2.82 2,143
Mineral Resources1,2,3 Tonnes ('000) Grade (Au g/t) Content (Koz)
Measured & Indicated Mineral Resources
Wassa 54,647 2.02 3,556
Prestea 6,712 5.30 1,144
Total 61,360 2.38 4,700
Inferred Mineral Resources
Wassa 16,462 4.15 2,200
Prestea 3,813 7.70 944
Total 20,305 4.82 3,144
1. For Wassa’s Mineral Reserves and Resources please refer to ‘NI 43-101 Technical Report on a Feasibility Study of the Wassa Open Pit and UndergroundProject in Ghana’, dated December 31, 2014, which is filed on SEDAR and at www.gsr.com
2. For Prestea’s Mineral Reserves and Resources please refer to ‘NI 43-101 Technical Report on a Feasibility Study of the Prestea Underground GoldProject in Ghana’, dated November 03, 2015, which is filed on SEDAR and at www.gsr.com
3. All numbers exclude refractory ore.