2015 january investor presentation
TRANSCRIPT

Investor Presentation
January 2015

Non-GAAP Financial Measures
SemGroup
Adjusted EBITDA is presented in this presentation for certain periods. Adjusted EBITDA is not a U.S. generally accepted accounting principles (“GAAP”) measure
and is not intended to be used in lieu of a GAAP presentation of net income (loss). Adjusted EBITDA is presented in this presentation because SemGroup believes
it provides additional information with respect to its performance. Adjusted EBITDA represents earnings before interest, taxes, depreciation and amortization,
adjusted for selected items that SemGroup believes impact the comparability of financial results between reporting periods. Although SemGroup presents selected
items that it considers in evaluating its performance, you should also be aware that the items presented do not represent all items that affect comparability between
the periods presented. Variations in SemGroup’s operating results are also caused by changes in volumes, prices, exchange rates, mechanical interruptions and
numerous other factors. These types of variances are not separately identified in this presentation. Because all companies do not use identical calculations,
SemGroup’s presentation of Adjusted EBITDA may be different from similarly titled measures of other companies, thereby diminishing its utility. Reconciliations of
net income (loss) to Adjusted EBITDA for the periods presented are included on our website.
Rose Rock Midstream
This presentation includes the non-GAAP financial measures of Adjusted gross margin, Adjusted EBITDA and distributable cash flow, which may be used
periodically by management when discussing our financial results with investors and analysts. Our website provides reconciliations of these non-GAAP financial
measures to their most directly comparable financial measures calculated and presented in accordance with GAAP. Adjusted gross margin, Adjusted EBITDA and
distributable cash flow are presented as management believes they provide additional information and metrics relative to the performance of our business.
Operating income (loss) is the GAAP measure most directly comparable to Adjusted gross margin, net income (loss) and cash provided by (used in) operating
activities are the GAAP measures most directly comparable to Adjusted EBITDA, and net income (loss) is the GAAP measure most directly comparable to
distributable cash flow. Our non-GAAP financial measures should not be considered as alternatives to the most directly comparable GAAP financial measures.
These non-GAAP financial measures have important limitations as analytical tools because they exclude some, but not all, items that affect the most directly
comparable GAAP financial measures. You should not consider Adjusted gross margin, Adjusted EBITDA or distributable cash flow in isolation or as substitutes for
analysis of our results as reported under GAAP. Because Adjusted gross margin, Adjusted EBITDA and distributable cash flow may be defined differently by other
companies in our industry, our definitions of these non-GAAP financial measures may not be comparable to similarly titled measures of other companies, thereby
diminishing their utility.
Management compensates for the limitation of Adjusted gross margin, Adjusted EBITDA and distributable cash flow as analytical tools by reviewing the comparable
GAAP measures, understanding the differences between Adjusted gross margin, Adjusted EBITDA and distributable cash flow, on the one hand, and operating
income (loss), net income (loss) and net cash provided by (used in) operating activities, on the other hand, and incorporating this knowledge into its decision-
making processes. We believe that investors benefit from having access to the same financial measures that our management uses in evaluating our operating
results.
2

Forward-looking Information
Certain matters contained in this presentation include "forward-looking statements" within the meaning of Section 27A of the Securities Act of 1933, as amended,
and Section 21E of the Securities Exchange Act of 1934, as amended. We make these forward-looking statements in reliance on the safe harbor protections
provided under the Private Securities Litigation Reform Act of 1995.
All statements, other than statements of historical fact, included in this presentation including the prospects of our industry, our anticipated financial performance,
our anticipated annual dividend growth rate, NGL Energy Partners LP (NYSE: NGL) anticipated financial performance, management's plans and objectives for
future operations, business prospects, outcome of regulatory proceedings, market conditions and other matters, may constitute forward-looking statements.
Although we believe that the expectations reflected in these forward-looking statements are reasonable, we cannot assure you that these expectations will prove
to be correct. These forward-looking statements are subject to certain known and unknown risks and uncertainties, as well as assumptions that could cause actual
results to differ materially from those reflected in these forward-looking statements. Factors that might cause actual results to differ include, but are not limited to,
the factors discussed above; our ability to comply with the covenants contained in the instruments governing our indebtedness and to maintain certain financial
ratios required by our credit facilities; NGL's operations, which we do not control; the ability of our subsidiary, Rose Rock Midstream L.P. (NYSE: RRMS), to make
minimum quarterly distributions; the possibility that our hedging activities may result in losses or may have a negative impact on our financial results; any
sustained reduction in demand for the petroleum products we gather, transport, process and store; our ability to obtain new sources of supply of petroleum
products; our failure to comply with new or existing environmental laws or regulations or cross border laws or regulations; the possibility that the construction or
acquisition of new assets may not result in the corresponding anticipated revenue increases; changes in currency exchange rates; and the risks and uncertainties
of doing business outside of the U.S., including political and economic instability and changes in local governmental laws, regulations and policies, as well as other
risk factors discussed from time to time in each of our documents and reports filed with the SEC.
Readers are cautioned not to place undue reliance on any forward-looking statements contained in this presentation which reflect management's opinions only as
of the date hereof. Except as required by law, we undertake no obligation to revise or publicly release the results of any revision to any forward-looking statements.
SemGroup and Rose Rock Midstream use their Investor Relations website and social media outlets as channels of distribution of material company information.
Such information is routinely posted and accessible on our Investor Relations websites at ir.semgroupcorp.com and ir.rrmidstream.com.
Both companies are present on Twitter and LinkedIn, follow us at the links below:
SemGroup Twitter and LinkedIn Rose Rock Midstream Twitter and LinkedIn
3
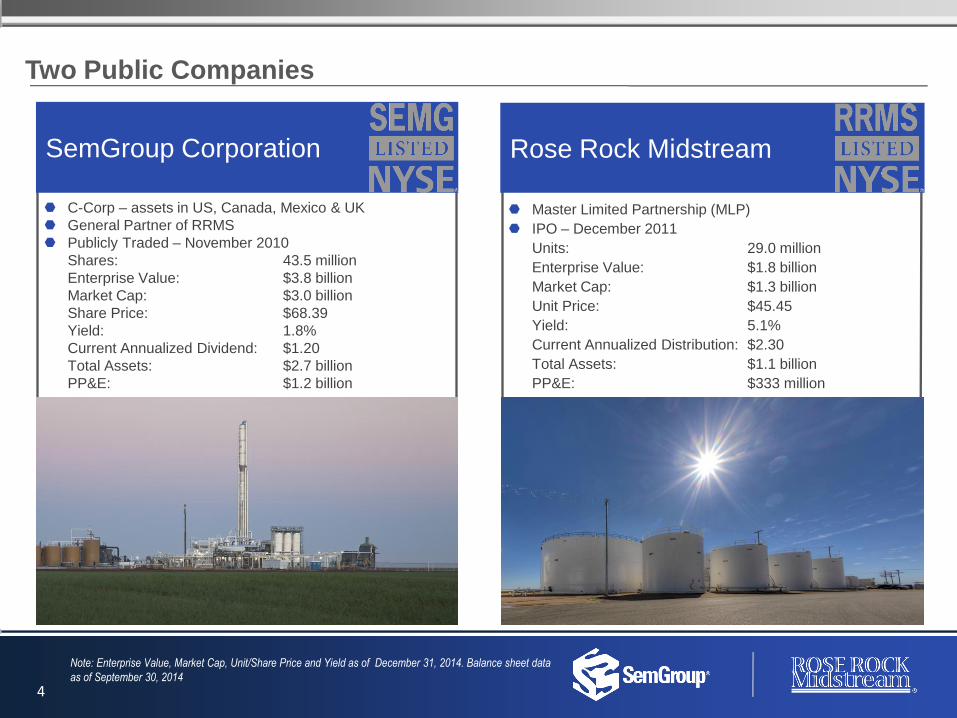
Two Public Companies
Note: Enterprise Value, Market Cap, Unit/Share Price and Yield as of December 31, 2014. Balance sheet data
as of September 30, 2014
C-Corp – assets in US, Canada, Mexico & UK
General Partner of RRMS
Publicly Traded – November 2010
Shares: 43.5 million
Enterprise Value: $3.8 billion
Market Cap: $3.0 billion
Share Price: $68.39
Yield: 1.8%
Current Annualized Dividend: $1.20
Total Assets: $2.7 billion
PP&E: $1.2 billion
Master Limited Partnership (MLP)
IPO – December 2011
Units: 29.0 million
Enterprise Value: $1.8 billion
Market Cap: $1.3 billion
Unit Price: $45.45
Yield: 5.1%
Current Annualized Distribution: $2.30
Total Assets: $1.1 billion
PP&E: $333 million
SemGroup Corporation Rose Rock Midstream
4
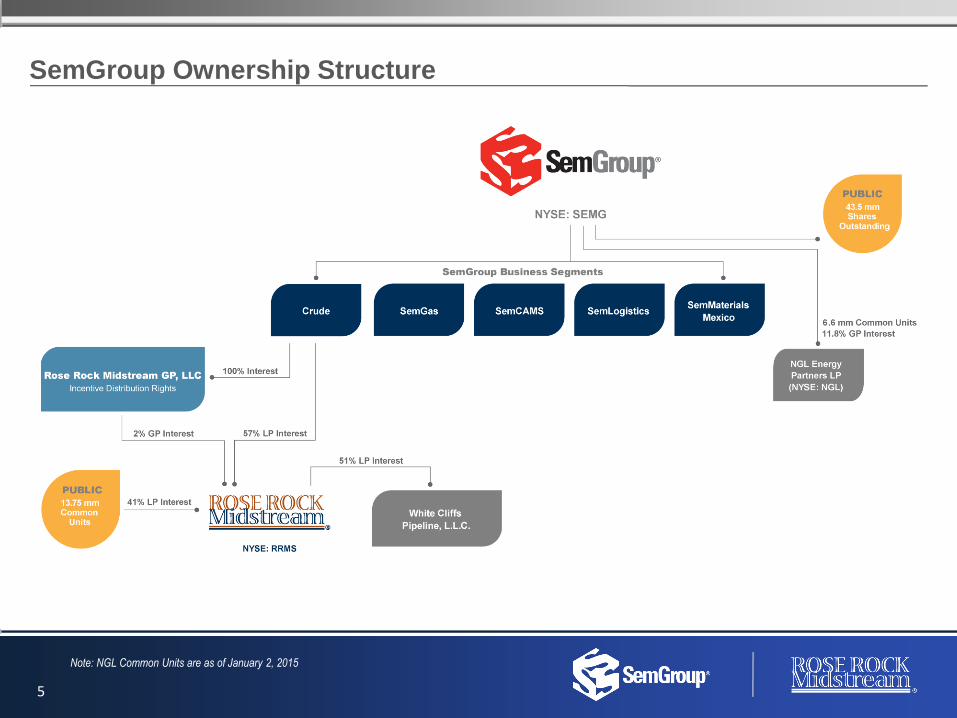
SemGroup Ownership Structure
5
Note: NGL Common Units are as of January 2, 2015

Business Strategy
Risk Management
Mitigate commodity price exposure
Maintain financial flexibility and utilize
leverage prudently
Quality Cash Flows
Generate consistent earnings and
cash flows
Focus on fee-based activities
Focused Growth
Capitalize on organic growth
opportunities with existing and
new assets
Grow our business through strategic
and accretive asset acquisitions
6

Crude and Gas Assets in Key Growth Areas
7

Crude Business Overview
Glass Mountain Pipeline – In service February 2014
210-mile pipeline
Two laterals – Granite Wash and Mississippi
Lime Play join and terminate in Cushing
140,000 bpd current capacity
Wattenberg Oil Trunkline – In service November 2013
37-mile, 12-inch pipeline and storage in DJ Basin
Transports Noble Energy production to White Cliffs
38-mile pipeline extension backed by long-term agreement with
Noble Energy – Expected 4Q 2014
SemGroup Corporation
8

Crude Business Overview
Cushing
7.6 million barrels of storage
86% under long-term fixed fee contracts with first expiration
2016
2014 average storage rate of $0.37 per month
Connectivity to all major inbound/outbound pipelines
White Cliffs Pipeline
51% ownership
DJ Basin to Cushing, OK
Two 527-mile, 12-inch pipelines
150,000 bpd current capacity
Expanding capacity to approximately 215,000 bpd
– Expected completion 3Q 2015
Field Services
Fleet of more than 250 crude oil trucks
Servicing the Bakken, DJ/Niobrara, Eagle Ford, Granite Wash,
Mississippi Lime, Permian, San Juan and Utica plays
Tampa Pipeline
12-mile, 12-inch pipeline from Platteville to Tampa, CO rail
facility
Constructed a new 5-mile lateral pipeline segment
Rose Rock Midstream
Kansas/Oklahoma System
Approximately 600-mile gathering and
transportation pipeline system
Currently operating at full capacity
Connects to third-party pipelines, Kansas and
Oklahoma refineries and Cushing terminal
620,000 barrels of storage capacity
Platteville
16-lane truck unloading facility
Origin of White Cliffs Pipeline
230,000 barrels of storage capacity
4 new truck unloading bays and 100,000 barrels of
additional storage – Expected completion 2Q 2015
Bakken Shale 17 gathering trucks
Transport via truck, third-party pipeline or rail
61,800 barrels of storage capacity
9

24.1 22.1 25.6
48.7 49.6 39.3
51.5
0
15
30
45
60
1Q 2Q 3Q 4Q 1Q 2Q 3Q
29.7 30.9 42.7 46.1
75.0
0
20
40
60
80
3Q 4Q 1Q 2Q 3Q
2013
2014
2013
2014
2013
2014
Crude Key Performance Metrics
(1) Pipeline volumes include KS/OK system, ND transportation and Tampa pipeline
(2) White Cliffs Pipeline is currently owned 51% by RRMS; includes Platteville and Healy volumes; 100% throughput
(3) Glass Mountain Pipeline is owned 50% by SEMG; average volumes Q1 2014 reflects two months operational; 100% throughput
(4) Field Services average volumes for Q3 2013 reflects one month operational
Crude Transportation Volumes
(Thousand Barrels per Day)
n Contracted(1) n Operational / Marketing n Uncontracted
Crude Cushing Storage 7.6 million Barrels Capacity
10
n Pipeline Volumes(1) n White Cliffs PL(2)
n Wattenberg Oil Trunkline n Glass Mountain PL(3)
Crude Marketing Volumes (Thousand Barrels per Day)
Field Services Transportation Volumes(4)
(Thousand Barrels per Day)
6.50 6.50 6.00
4.40
2.90
1.10 1.10 1.10
1.10
1.10
0.50
2.10
3.60
0
2
4
6
8
2014 2015 2016 2017 2018
55.7 57.3 54.6 57.1 67.3 64.9 65.2
66.8 66.8 67.3 77.4 72.7 74.1 98.5
11.0 26.6 28.5 31.2 43.7 61.7 61.1
0
50
100
150
200
250
300
1Q 2Q 3Q 4Q 1Q 2Q 3Q

97% 98% 100% 95% 92% 91% 90%
3% 2%
5% 8% 9% 10%
0%
20%
40%
60%
80%
100%
1Q 2Q 3Q 4Q 1Q 2Q 3Q
Owner Non-Owner
11
White Cliffs Pipeline Customer Mix
2013
2014
White Cliffs Pipeline volumes are primarily driven by owner throughput
White Cliffs Customer Throughput %

60.0 67.1 66.7 71.0 70.5 96.6
143.4 156.9 167.7
251.4
315.9
0
50
100
150
200
250
300
350
400
1Q 2Q 3Q 4Q 1Q 2Q 3Q 4Q 1Q 2Q 3Q
Processing Volumes Capacity
2012
2013
2014
SemGas Areas of Operation Northern Oklahoma Average Processed Volume (mmcf/d)
12
Located in liquids rich oil plays
Four processing facilities - 388 mmcf/d of current capacity
1,300 miles of gathering lines
Significant growth in Mississippi Lime Play
– Rose Valley II – 200 mmcf/d capacity – Expected completion mid-2015
SemGas Natural Gas Business

213.9 250.3
283.9 272.6 285.8
148.2
274.2
162.6 128.5
159.6 146.9
152.6
186.1
138.3
0
100
200
300
400
500
1Q 2Q 3Q 4Q 1Q 2Q 3Q 2013
2014
SemCAMS Natural Gas Business
SemCAMS Areas of Operation Average Throughput Volume (mmcf/d)
13
Located in:
– Western Canadian Sedimentary Basin – sour gas
– Montney – liquids rich sour gas
– Duvernay – liquids rich sweet gas
Current operational capacity aproximately 700 mmcf/d
600 miles of transport and gathering lines
n K3 Plant n KA Plant
376.5 378.8
443.5
419.5 438.4
334.3
412.5
“Montney continues to gain steam (currently ~3Bcf/d) as operators look to accelerate in a $3-4/mcf price world. Scale (450Tcf recoverable) and
economics ($0-2.50/mcf break-even) conjure images of a thicker Marcellus. Changes in completion design are another arrow in quiver to improve
economics. And just like the leading US gas basin, takeaway is crucial, leading many E&Ps to own midstream and hoard FT. While bottlenecks could
emerge with high tariffs, we believe economics will justify increased drilling in basin and drive NA gas supply growth.”
– TPH 12/4/2014

SemGroup Capitalization & Liquidity
Conservative leverage ratio
provides financial flexibility
Perspective consolidated Net
Debt / Adjusted EBITDA
target of 3.5x or better
Available liquidity to fund
future growth opportunities
(in millions) September 30, 2014
December 31,
2013
Total Consolidated Debt $ 793 $ 615
Owner's Equity 1,171 1,214
Total Book Capitalization $ 1,964 $ 1,829
Consolidated Credit Metrics
Net Debt $ 726 $ 536
Total Debt/Capitalization 40% 34%
Net Debt/Adjusted EBITDA LTM 2.8x 2.8x
Committed Liquidity
Cash and Cash Equivalents $ 67 $ 79
Revolver Availability(1)
SemGroup 476 426
Rose Rock Midstream 426 306
Total Liquidity $ 969 $ 811
14
(1) Availability reduced by outstanding letters of credit

SemGroup Corporation 2014 Capital Expenditure Guidance
2014 Capital Expenditures – $475 million(1)(2)
Nearly 90% of capital expenditures are
focused on growth capital
Mid-teens or higher returns on organic
growth projects in key asset plays
Maintenance and Regulatory capital
focused on pipeline integrity
n Natural Gas
n Crude
n Other Growth Projects
n Maintenance and Regulatory
$185
48%
39%
2%
11%
$227
$11
$52
(1) Includes Rose Rock Midstream and excludes potential acquisitions
(2) Guidance updated June 23, 2014
15

SemGroup Corporation 2014 Capital Expenditure Guidance
(1) Guidance updated June 23, 2014
(2) Investments in affiliate; reflects our ownership in joint ventures
(3) Includes amounts paid to acquire additional ownership
Delivering organic growth with mid-teen or higher returns
16
(in millions)
Segment Description
Estimated
Completion Date
Project Spend
Through
12/31/2013 2014 Capex(1) 2015 Capex
Total
CapEx
Crude-RRMS White Cliffs Pipeline expansion(2) August 2014 32 30 — 62
Crude-RRMS Tampa Pipeline lateral July 2014 5 — 5
Crude-RRMS Chesapeake trucking acquisition June 2014 — 46 — 46
Crude-RRMS Platteville expansion 2Q 2015 — 7 4 11
Crude-SEMG Glass Mountain Pipeline and truck unloading facilities(2)(3) February 2014 128 8 — 136
Crude-SEMG Wattenberg Oil Trunkline extension 4Q 2014 — 34 16 50
Crude-SEMG White Cliffs Pipeline expansion(2) August 2014 66 23 — 89
SemGas Northern Oklahoma gas gathering and processing expansion varies 157 135
SemGas Cryo Plant redeployment 4Q 2014 — 6 2 8
SemCAMS Montney and Duvernay Pipeline growth varies 24 9 — 33
SemCAMS K3 Plant projects varies 4 14 — 18
SemCAMS Wapiti Pipeline Expansion varies 14 27 41
Other/undesignated growth projects varies 70 116-166
Maintenance, refurbishment & regulatory 52
Total $254 $475 $300 - $350

17
Adjusted EBITDA(1)
3Q 2014 2Q 2014 1Q 2014 2014 Guidance(2)
SemGroup $79.4 million $57.5 million $67.3 million $260 - $275 million
Rose Rock Midstream $31.0 million $20.6 million $27.8 million $115 - $120 million
Third Quarter Results
(1) Non-GAAP Financial Data Reconciliations can be found on the company’s
website, SemGroup includes fully consolidated Rose Rock Midstream
(2) Guidance updated June 23, 2014
(3) CAGR is based on the midpoint of 2014 Adjusted EBITDA Guidance

SemGroup Segment Results
(1) Non-GAAP Financial Data Reconciliations can be found on the company’s website
(2) Crude segment includes fully consolidated Rose Rock Midstream
Key Highlights (3Q 2014 vs 2Q 2014)
Crude increased $10.3 million – $4.6 million increase driven by increased White Cliffs Pipeline transportation volumes
– $2.3 million increase related to higher transportation volumes, excluding White Cliffs Pipeline
– $1.7 million decrease in G&A expenses primarily due to rating agency fees and drop down costs incurred during 2Q
SemCAMS increased $8.8 million – $3.6 million increase related to higher capital fee recoveries
– $3.4 million increase a result of higher volumes which were primarily impacted by the planned outage at the K3 Plant
– $1.8 million increase related to operating expense recoveries
Segment Adjusted EBITDA(1) (in millions, unaudited) 3Q 2014 2Q 2014 1Q 2014
Crude(2) $ 40.6 $ 30.3 $ 35.1
SemGas 17.1 14.6 12.8
SemCAMS 16.8 8.0 11.7
SemLogistics (2.3) 0.4 1.1
SemMaterials Mexico 4.5 3.0 5.1
SemStream 6.4 5.7 5.2
Corporate and Other (3.7) (4.5) (3.7)
Total Adjusted EBITDA(1) $ 79.4 $ 57.5 $ 67.3
18

SemGroup’s Fee-based Business Model
(1) LTM September 30, 2014
(2) SemGas 3Q 2014 margin contribution 59% fixed fee, 41% variable fee
(3) Rose Rock Midstream includes White Cliffs cash distributions resulting from 17% ownership for 3
months, 34% ownership for 6 months and 51% ownership for 3 months
Fixed Fee Variable Fee Marketing
SemGas(2) 53% 47%
SemCAMS 100%
SemLogistics 100%
SemMaterials Mexico 100%
White Cliffs Pipeline 100%
Rose Rock Midstream(3) 83% 17%
Margin Contribution(1)
n Fixed Fee n Variable Fee n Marketing
86 %
5 %
9 %
Fixed Fee
– Storage fees
– Transportation fees
– Unloading fees
– Gathering and processing fees
Variable Fee
– Gas processing – percent of proceeds
Marketing
– Back-to-back marketing transactions
Margin Descriptions
19

2013
2014
$0.1900 $0.2000
$0.2100 $0.2200
$0.2400
$0.2700
$0.3000
$0.1500
$0.2500
$0.3500
1Q 2Q 3Q 4Q 1Q 2Q 3Q
20
SemGroup Corporation Dividend Growth
58% cumulative increase in dividends since initiation in 1Q 2013
Our current dividend policy is to pass
through the after-tax cash distributions
received from our MLP investments
Targeting dividend growth of 40-45%
year over year

2012
2013
2014
$0.4025
$0.4300 $0.4400
$0.4500 $0.4650
$0.4950
$0.5350
$0.5750
$0.2000
$0.3000
$0.4000
$0.5000
$0.6000
4Q 1Q 2Q 3Q 4Q 1Q 2Q 3Q
21
2014 Target Annual Coverage Ratio 1.1x-1.2x
2014 Target Distribution Growth 25% year-over-year(1)
Rose Rock Midstream Distribution Per LP Unit
59% cumulative increase in distributions since IPO
(1) Assumes no further drop downs or acquisitions

• Four natural gas processing facilities
• Total processing capacity of 388 mmcf/d
• ~1,300 miles of gathering lines
• 8.7 million barrels of owned multi-product storage
• Two deep water jetties
• 100% fixed-fee gross margin
Glass Mountain Pipeline • Joint venture with NGL Energy Partners – 50% ownership
• 210-mile, 140,000 barrel per day crude oil pipeline and storage
• Two laterals – Granite Wash and Mississippi Lime Play join and terminate in Cushing, OK
Wattenberg Oil Trunkline • 37-mile, 12-inch pipeline and storage in DJ Basin
• Transports Noble Energy production to White Cliffs Pipeline
SemLogistics
Future Growth in Drop Downs
Glass Mountain Pipeline • Joint venture with Gavilon – 50% ownership
• 210-mile, 140,000 barrel per day crude oil pipeline and storage
• Operational January 2014
White Cliffs Pipeline
(51% ownership)
• 527-mile crude oil pipeline - 76,000 bpd capacity
• Incremental 80,000 bpd expansion – 2Q 2014 completion
• 100,000 barrels of crude oil storage
Glass Mountain Pipeline • Joint venture with Gavilon – 50% ownership
• 210-mile, 140,000 barrel per day crude oil pipeline and storage
• Operational January 2014
SemCAMS • Two sour and two sweet natural gas processing plants
• Total capacity of approximately 700 mmcf/d
• ~600 miles of transport and gathering lines
White Cliffs Pipeline
(51% ownership)
• 527-mile crude oil pipeline - 76,000 bpd capacity
• Incremental 80,000 bpd expansion – 2Q 2014 completion
• 100,000 barrels of crude oil storage
Glass Mountain Pipeline • Joint venture with Gavilon – 50% ownership
• 210-mile, 140,000 barrel per day crude oil pipeline and storage
• Operational January 2014
Rose Rock Midstream’s relationship with SemGroup allows for potential future drop downs
SemGas
Wattenberg Oil Trunkline
Extension
• 38-mile, 12-inch pipeline extension and storage in DJ Basin to move crude oil from Noble
Energy production to White Cliffs Pipeline
• 4Q 2014 completion
22
Glass Mountain Pipeline, Wattenberg Oil Trunkline and Wattenberg Oil Trunkline Extension are
expected to be dropped down 1Q 2015