investor presentation...investor presentation april 2020 tsx: tmr tsx: tmr 2 caution regarding...
TRANSCRIPT

INVESTOR PRESENTATIONApril 2020
TSX: TMR
2TSX: TMR
CAUTION REGARDING FORWARD-LOOKING INFORMATION
Readers are cautioned that we will be making forward-looking comments. To fully understand the risks inherent in our comments, forecasts and estimates you are encouraged to read our Annual Information Form for the year ended December 31, 2018 and our Management Discussion and Analysis for the third quarter ended September 30, 2019 together with our Financial Statements for the same period as well as the Management Discussion and Analysis for the year ended December 31, 2018 together with our Financial Statements for the same period.
3TSX: TMR
UNIQUE INVESTMENT RATIONALE
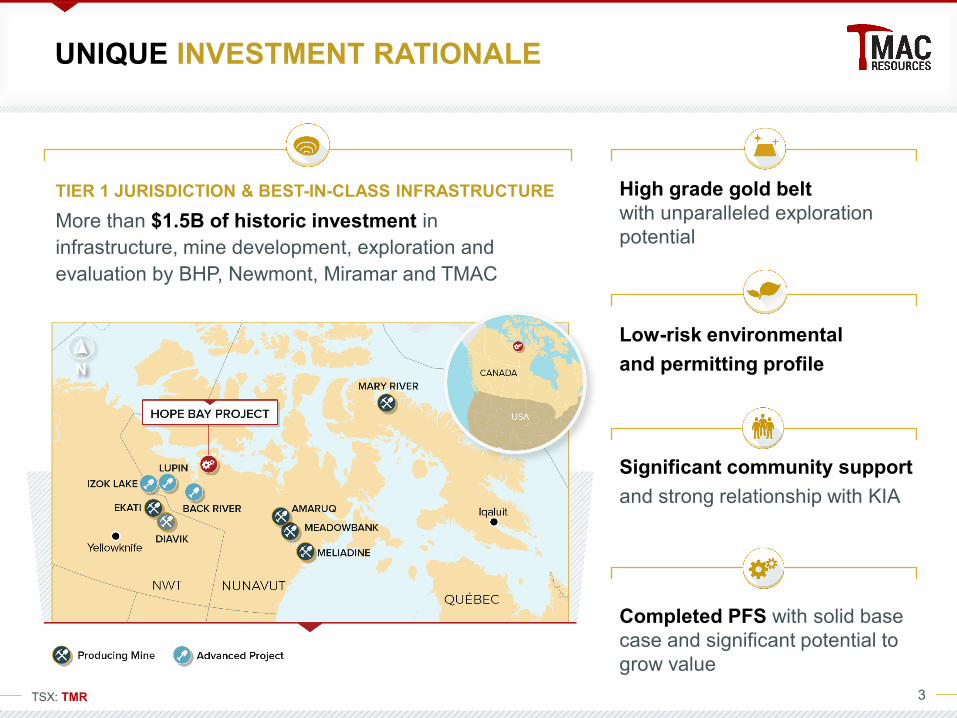
TIER 1 JURISDICTION & BEST-IN-CLASS INFRASTRUCTUREMore than $1.5B of historic investment in infrastructure, mine development, exploration and evaluation by BHP, Newmont, Miramar and TMAC
High grade gold belt with unparalleled exploration potential
Completed PFS with solid base case and significant potential to grow value
Significant community support and strong relationship with KIA
Low-risk environmental and permitting profileN
4TSX: TMR
LOW RELATIVE RISK PROFILE
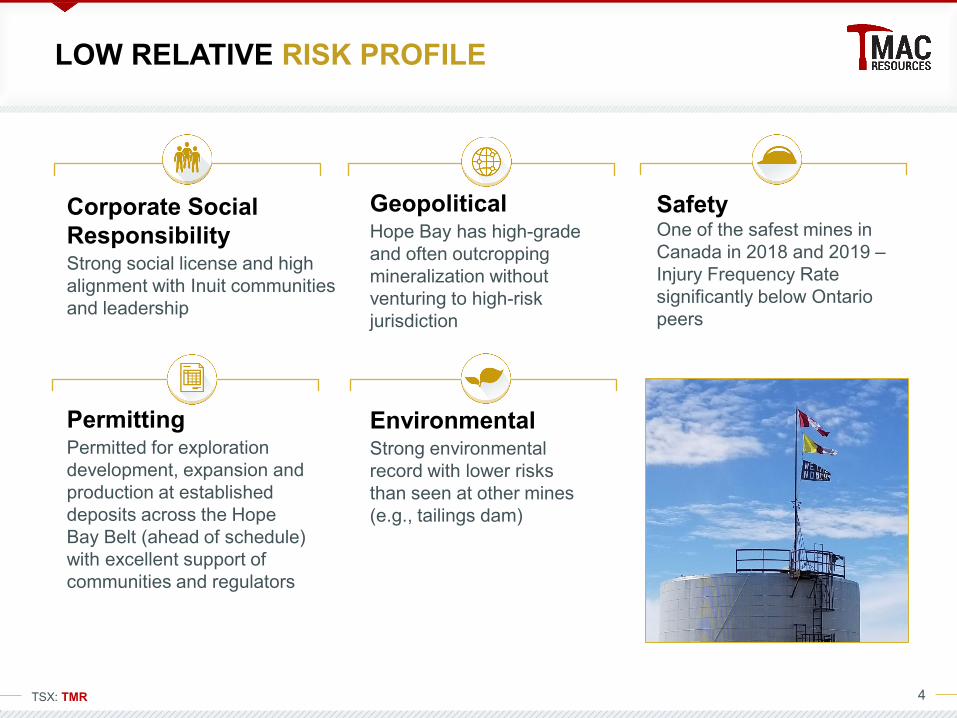
EnvironmentalStrong environmental record with lower risks than seen at other mines (e.g., tailings dam)
Corporate Social ResponsibilityStrong social license and high alignment with Inuit communities and leadership
GeopoliticalHope Bay has high-grade and often outcropping mineralization without venturing to high-risk jurisdiction
PermittingPermitted for exploration development, expansion and production at established deposits across the Hope Bay Belt (ahead of schedule) with excellent support of communities and regulators
SafetyOne of the safest mines in Canada in 2018 and 2019 –Injury Frequency Rate significantly below Ontario peers

5TSX: TMR
$406
$332
$309
$292
$241
$207
$203
$153
$148
$51
$41
Wesdome (13.4 g/t)
Alacer (2.6 g/t)
Roxgold (8.2 g/t)
Torex (3.1 g/t)
SSR Mining (0.7 g/t)
Pretium (13.2 g/t)
Golden Star (2.9 g/t)
Teranga (1.9 g/t)
Equinox (0.9 g/t)
Asanko (1.4 g/t)
New Gold (1.0 g/t)
TMAC (6.5 g/t)
$1,394 0.99x
0.97x
0.94x
0.73x
0.72x
0.66x
0.59x
0.59x
0.56x
0.55x
0.43x
0.14x
SSR Mining
Pretium
Wesdome
Alacer
Equinox
Teranga
Asanko
Golden Star
New Gold
Torex
Roxgold
TMAC
25.7
19.4
13.1
11.2
10.6
10.0
9.5
8.4
8.4
5.8
5.2
4.8
TMAC
Pretium
Equinox
New Gold
Alacer
Asanko
SSR Mining
Golden Star
Teranga
Torex
Roxgold
Wesdome
COMPELLING RELATIVE VALUE – PRODUCER COMPS
Street Consensus P/NAV (Ratio)
Mine Life Index(Years) **
Denotes > 50% of Gold Reserves in Canada/USA
Overall Median: 0.66xCanada/USA Median: 0.95x
EV / Reserves($/oz Au Eq.)
Overall Median: $241/ozCanada/USA Median: $266/oz
Reserve Grade*
Source: FactSet, street research | Note: Medians exclude TMAC. Market data as of 03-Apr-20. | * Grade calculated as gold equivalent g/t. | ** Calculated as attributable reserves of producing assets divided by broker attributable 2021E gold equivalent production, TMAC production based on 2019A. |
TMAC 0.14x
TMAC 25.7
TMAC (6.5 g/t) $41

6TSX: TMR
0.64x
0.61x
0.51x
0.49x
0.47x
0.36x
0.36x
0.34x
0.34x
0.32x
0.27x
0.25x
0.17x
0.15x
0.14x
0.11x
Pure Gold
Orla
Seabridge
Osisko Mining
Liberty
Belo Sun
Sabina
Falco
Gold Standard
Corvus
Rubicon
Probe Metals
Midas
Orezone
TMAC
Treasury Metals
$329
$84
$81
$63
$54
$44
$41
$33
$28
$22
$22
$21
$17
$9
$6
$5
Osisko Mining (9 .1 g/t)
Liberty (0.7 g/t)
Gold Standard (0.8 g/t)
Pure Gold (8.9 g/t)
Rubicon (6.5 g/t)
Sabina (5.9 g/t)
Corvus (0.4 g/t)
Probe Metals (1.8 g/t)
TMAC (7.4 g/t)
Orla (1 .1 g/t)
Belo Sun (1.0 g/t)
Midas (1.7 g/t)
Treasury Metals (2.6 g/t)
Orezone (0.7 g/t)
Seabridge (0.9 g/t)
Falco (2.5 g/t)
$329
COMPELLING RELATIVE VALUE – DEVELOPER COMPS
Street Consensus P/NAV (Ratio)
TMAC’s advantages as compared to other developers include:
EV / M&I Resources($/oz Au Eq.)
Resource Grade*
Overall Median: 0.34xCanada/USA Median: 0.34x
Overall Median: $33/ozCanada/USA Median: $43/oz
Denotes > 50% of Gold Resources in Canada/USA
TMAC 0.14x
Source: FactSet, street research | Note: Medians exclude TMAC. Market data as of 03-Apr-20. | * Grade calculated as gold equivalent g/t. |
TMAC (7.4 g/t) $28
Significant infrastructure already built
Hope Bay is a camp rather than a single mine, with significant exploration upside
Lower development risk brownfield v greenfield development
Permitting in place with minor amendments required
PFS cost estimates based on actual operating experience
Community supportestablished with three years of production and employment
>$850M Tax assets
7TSX: TMR
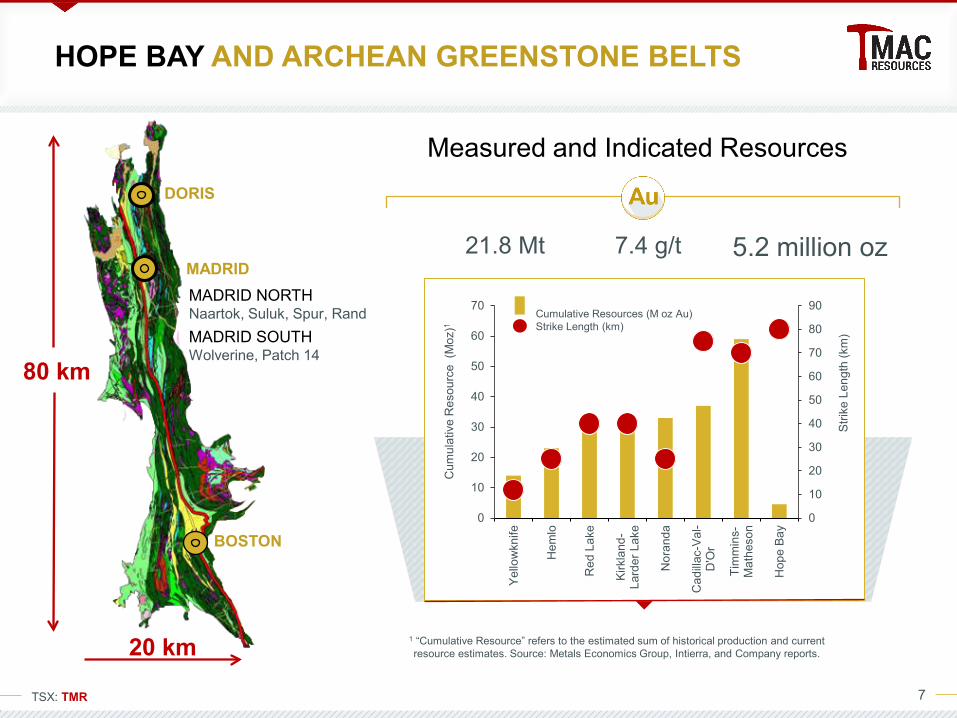
5.2 million ozMADRID
20 km
DORIS
BOSTON
80 km
MADRID NORTHNaartok, Suluk, Spur, RandMADRID SOUTHWolverine, Patch 14
Measured and Indicated Resources
21.8 Mt 7.4 g/t
1 “Cumulative Resource” refers to the estimated sum of historical production and current resource estimates. Source: Metals Economics Group, Intierra, and Company reports.
0
10
20
30
40
50
60
70
80
90
0
10
20
30
40
50
60
70
Yello
wkn
ife
Hem
lo
Red
Lak
e
Kirk
land
-La
rder
Lak
e
Nor
anda
Cad
illac-
Val-
D'O
r
Tim
min
s-M
athe
son
Hop
e Ba
y
Strik
e Le
ngth
(km
)
Cum
ulat
ive
Res
ourc
e (M
oz)1
Cumulative Resources (M oz Au)Strike Length (km)
HOPE BAY AND ARCHEAN GREENSTONE BELTS

8TSX: TMR
2020 PRE-FEASIBILITY STUDY SUMMARY
Expansion Capex$683M in 2020 to 2023
Incl. $184M for a new conventional processing plant
Valuation (1)
After-tax NPV5% $486M IRR 19.7%Payback 7 years
LOM 15 years
SensitivityAt US$1,625/oz gold price, the after-tax NPV5% is $870M
P&P Mineral Reserve 3.5M oz Au
M&I Mineral Resource5.2M oz Au
Inferred Resource2.1M oz Au
OptimizationOngoing work on optimization before feasibility study begins, targeting reduced upfront capital, optimized mining fleet, higher recovery and improved NPV and IRR
PFS Milestone . . . Optimization and Feasibility Study Next
(1) PFS consensus gold price US$1,400/oz long-term
Exploration ImpactfulNPV to grow quickly with exploration success as upfront capital leveraged
First priority is sustaining established, open deposits
9TSX: TMR
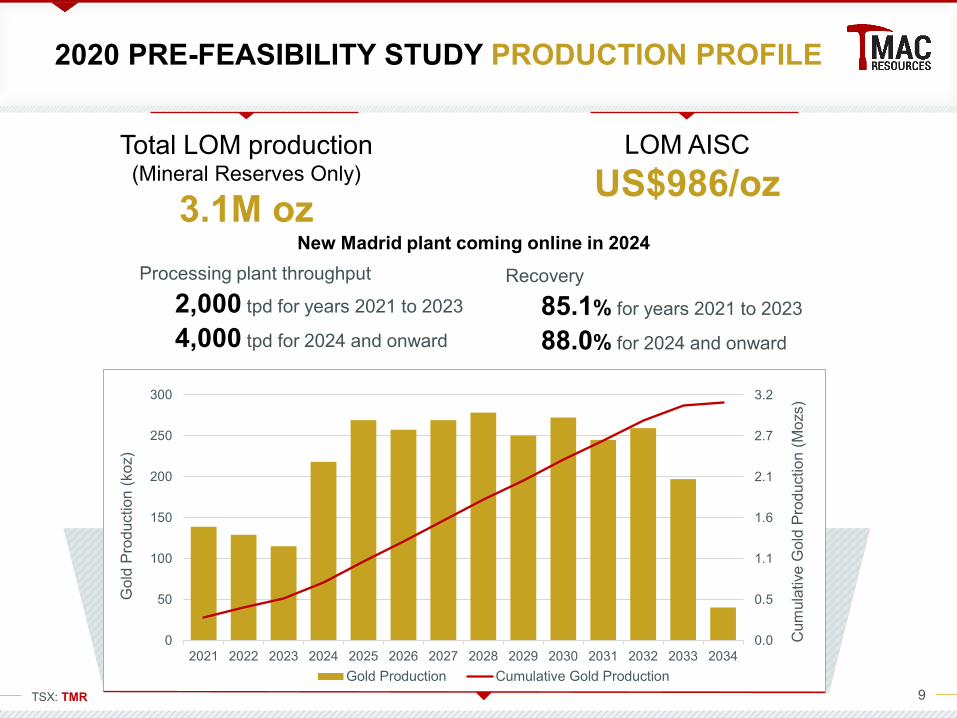
Processing plant throughput
2,000 tpd for years 2021 to 2023
4,000 tpd for 2024 and onward
2020 PRE-FEASIBILITY STUDY PRODUCTION PROFILE
Total LOM production(Mineral Reserves Only)
3.1M oz
LOM AISCUS$986/oz
New Madrid plant coming online in 2024Recovery
85.1% for years 2021 to 2023
88.0% for 2024 and onward
0.0
0.5
1.1
1.6
2.1
2.7
3.2
0
50
100
150
200
250
300
2021 2022 2023 2024 2025 2026 2027 2028 2029 2030 2031 2032 2033 2034
Cum
ulat
ive
Gol
d Pr
oduc
tion
(Moz
s)
Gol
d Pr
oduc
tion
(koz
)
Gold Production Cumulative Gold Production

10TSX: TMR
2020 PRE-FEASIBILITY STUDY COSTS
Capital Costincl. contingency
EXPANSION CAPITALProcessing 184Site Development 90Power Generation & Distribution 94Accommodation 40Bulk Fuel Storage 37Infrastructure and Utilities 63Indirect Project Cost 114Construction Facilities & Site Support Services (during construction) 54
Owners Cost 7Total Expansion Capital 683SUSTAINING CAPITALMine Development 294Other Mining Capital 308Environmental Equipment 2Total Sustaining Capital 604Total Capital Cost 1,287
LOM Unit Cost
Underground Mining(1) 99.45 / t ore mined
Surface Ore Haulage 9.96 / t ore hauled
Ore Stockpile Rehandle 1.16 / t ore rehandled
Processing – Current Doris Mill 56.00 / t processed
Processing – New Madrid Mill 39.26 / t processed
General & Administration 43.48 / t processed
Environmental, Levies, LandTaxes 5.63 / t processed
(1) Excludes C$294M in sustaining capital for mine development life of mine included in capital costs
Capital Costs Operating Costs
11TSX: TMR
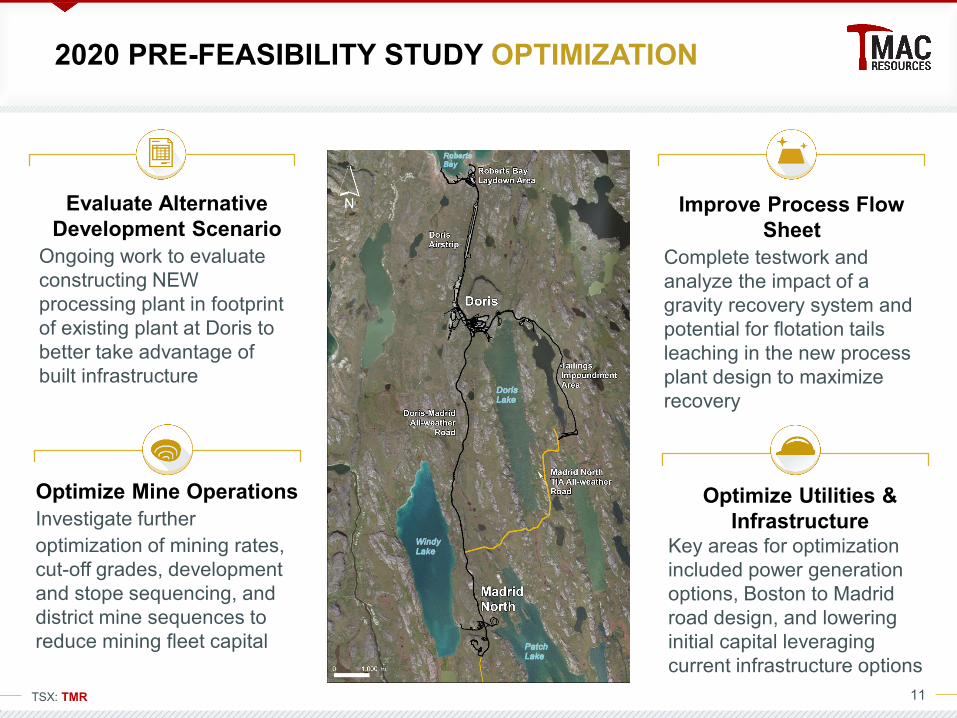
2020 PRE-FEASIBILITY STUDY OPTIMIZATION
Improve Process Flow Sheet
Complete testwork and analyze the impact of a gravity recovery system and potential for flotation tails leaching in the new process plant design to maximize recovery
Optimize Utilities & Infrastructure
Key areas for optimization included power generation options, Boston to Madrid road design, and lowering initial capital leveraging current infrastructure options
Optimize Mine OperationsInvestigate furtheroptimization of mining rates, cut-off grades, development and stope sequencing, and district mine sequences to reduce mining fleet capital
Evaluate Alternative Development Scenario
Ongoing work to evaluate constructing NEW processing plant in footprint of existing plant at Doris to better take advantage of built infrastructure

12TSX: TMR
PERMITTING COMPLETE
Underground mines at Doris, Madrid North, Madrid South and Boston
Surface crown pillar recoveries at Madrid North
55 km all-weather road from Madrid to Boston
Security: No “Overbonding” and spread over 15 life-of-mine installments
Excellent support from Inuit communities
Permitting achieved substantially ahead of our original schedule
Permitted infrastructure is well beyond our 2015 PFS to provide flexibility to enhance project economics; alternatives, not commitments:• 6,000 tpd processing across Hope Bay Belt• Tailings impoundment capacity (18MT at Doris,
5.1MT at Boston)• Boston permitted as self sufficient mine and
processing operation• Port expansion• Wind power generation

13TSX: TMR
BTD Extension
BTD Connector
BTD Central
Central
N
ConnectorNorth
< 33-5
10-20>20
DDHAu g/t
5-10
TMDBE-19-50148196.1 g/t Au/6.8 m
10TDD69410.7 g/t Au/4.3 m
08TDD62322.5 g/t Au/4.9 m
TMRDC-19-000027.7 g/t Au/7.5 m
TMRDC-19-000049.0 g/t Au/8.5 m
500 m
EXPLORATION UPSIDE DORIS
Expansion of the high-grade BTD Extension zone to the north
2019 drilling in Doris Valley, 325m north of BTD Extension, intersected Doris stratigraphy and significant mineralization
Current Mineral Resources & Mineral Reserves are relatively shallow - Significant potential to increase below the diabase dyke with continued drilling
Mined
Reserve Stope
-250 el
-500 el
-750 el
Doris Valley

14TSX: TMR
DORIS NORTH BTD EXTENSION
Growing high grade zone is top exploration target
Significant Drill Hole
Mineralized Vein (g/t Au)
>12090 - 12060 - 90
30 - 6020 - 3010 - 20
4 - 102 - 4<2
Existing UG Development
150 mLooking down

15TSX: TMR
EXPLORATION UPSIDE MADRID
500 m
N
Naartok Suluk
More than 5.5 km Mineralized Trend
Patch 7 Patch 14 Wolverine
TMMP7-19-0003115.6 g/t Au/7.7 m
And 32.4 g/t/2.5 m
TMMSU-19-0002310.0 g/t Au/3.0 m
And 14.3 g/t Au/5.5mAnd 10.8 g/t Au/9.3 m
TMMP7-19-0003114.4 g/t Au/7.4m
And 13.0 g/t Au/2.4 mAnd 9.4 g/t Au/11.0 m
04PMD28512.4 g/t Au/4.2 m
Suluk South
Current Mineral Resources & Mineral Reserves arerelatively shallow
2019 drilling intersected high-grade mineralization below and along strike of current Mineral Resources
> 5 km mineralized trend associated with the Madrid Deformation zone
< 33-5
10-20>20
DDHAu g/t
5-10
Mined
Reserve Stope
0 el
-250 el
-500 el
-750 el
-1000 el

16TSX: TMR
More than 25 years of modern exploration
Four owners
More than 1 million metres of historic drilling with at least 90% occurring on established deposits
Enormous amount of high-quality data available
More than 90 exploration targets identified
High-Resolution Gravity Image
DORIS AND MADRID REGIONAL EXPLORATION
Au > 10 g/t
1st order Structure
2nd order Structure
Gold Deposit
Au > 30 g/t
Surface Samples
5 Km
TM0002314.1 g/t Au/0.5 m
And 3.3 g/t Au/6.4 m
Pogey
Kamik
Doris
Madrid
Quaqtuq
North DorisExploration Datasets
Airborne geophysics• Magnetic• Electro-magnetic• High-resolution gravity
gradiometry
Ground geophysics• Magnetic• Induced polarization• Seismic
Geological mapping
Outcrop sampling
Gold in glacial till sampling
Diamond drilling
RC drilling

17TSX: TMR
EXPLORATION UPSIDE BOSTON
Boston Miska Domani North Domani SouthN
11SBD411A10.2 g/t Au/12.5m10.6 g/t Au/12.4 m16.1 g/t Au/2.7 m
11SBD414A25.2 g/t Au/8.1m46.2 g/t Au/9.1 m
36.3 g/t Au/10.3 m
TMRDO-19-0000495.8 g/t Au/0.7m
11DMR00616.8 g/t Au/1.5 m
11SBD41610.2 g/t Au/4.7 m
S03-293156.6 g/t Au/8.7 m
TMBBO-19-00002274.0 g/t Au/1.1 m14.2 g/t Au/6.8 m
High-Grade drillhole intersections down to approx 1,000 m2019 drilling on the B3-Newton zone intersected significant mineralization similar to 2011 Newmont resultsLocated at north end of >6km alteration trend, with associated surface mineralization and near surface, high-grade drillhole intercepts
< 33-5
10-20>20
DDHAu g/t
5-10
Mined
Reserve Stope 500 m
0 el
-250 el
-750 el
-1000 el
-500 el

18TSX: TMR
COVID-19 RESPONSE
Reduced OperationsExpect to run the processing plant for minimum 8-10 weeks on stockpiles and limited underground mining at Doris
Suspended exploration activities at Hope Bay and development activity of the Madrid North underground and the Naartok East crown pillar
Suspended underground development at Doris
If the risk of COVID-19 continues, after stockpiles exhausted TMAC would execute a controlled transition into temporary care and maintenance
Employee & Community SafetyInfectious Disease Control Plan implemented at Hope Bay on March 12, 2020
Decision to demobilize workers who reside in Nunavut communicated on March 17, 2020
Enhanced pre-boarding health screening of each passenger by a medical professional was initiated on March 17, 2020 for crew change flights
April moved to 4x4 schedule and one crew flight every four weeks (rather than eight)
Increased frequency and rigour of the already robust hygiene measures at Hope Bay
Enhanced communications and information campaigns for employees and contractors
Disciplined response to COVID-19 to protect employees, communities, assets and preserve cash balance

19TSX: TMR
2020 OUTLOOK
Complete strategic review process in Q2 2020
Manage COVID-19 related ramp down of operations and
potential temporary care & maintenance
Manage balance sheet and sealift for restart
scenarios
PFS optimization before initiating feasibility
study
Focused on maximizing shareholder value
Aligning stakeholder interests
Explore, review and evaluate a broad range of potential alternatives
20TSX: TMR
APPENDIX
21TSX: TMR
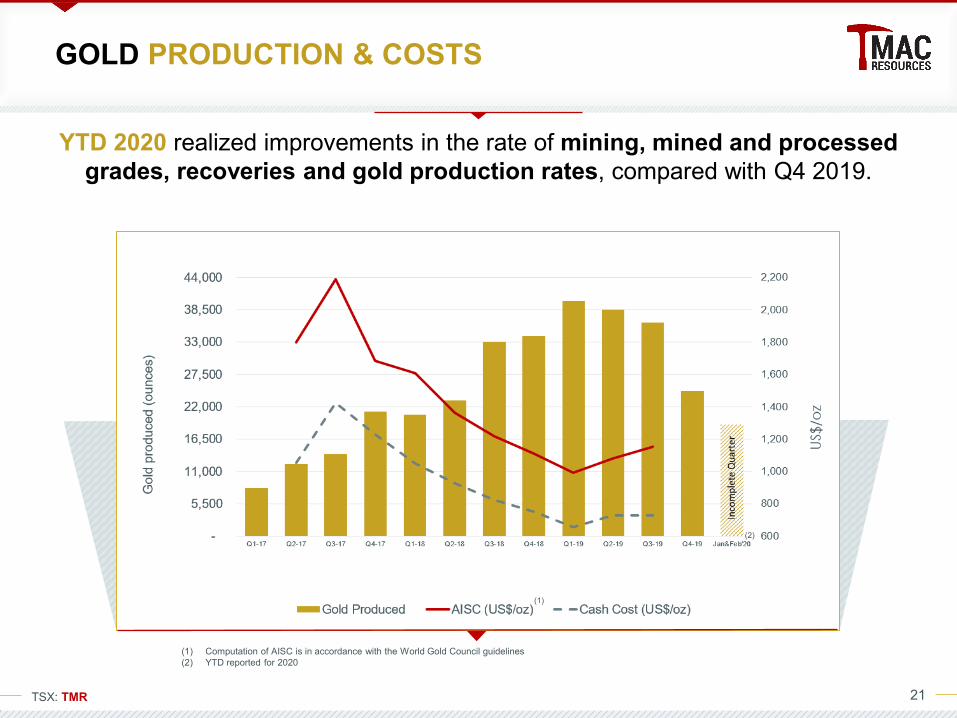
(1) Computation of AISC is in accordance with the World Gold Council guidelines(2) YTD reported for 2020
GOLD PRODUCTION & COSTS
(1)
(2)
YTD 2020 realized improvements in the rate of mining, mined and processed grades, recoveries and gold production rates, compared with Q4 2019.
22TSX: TMR
a
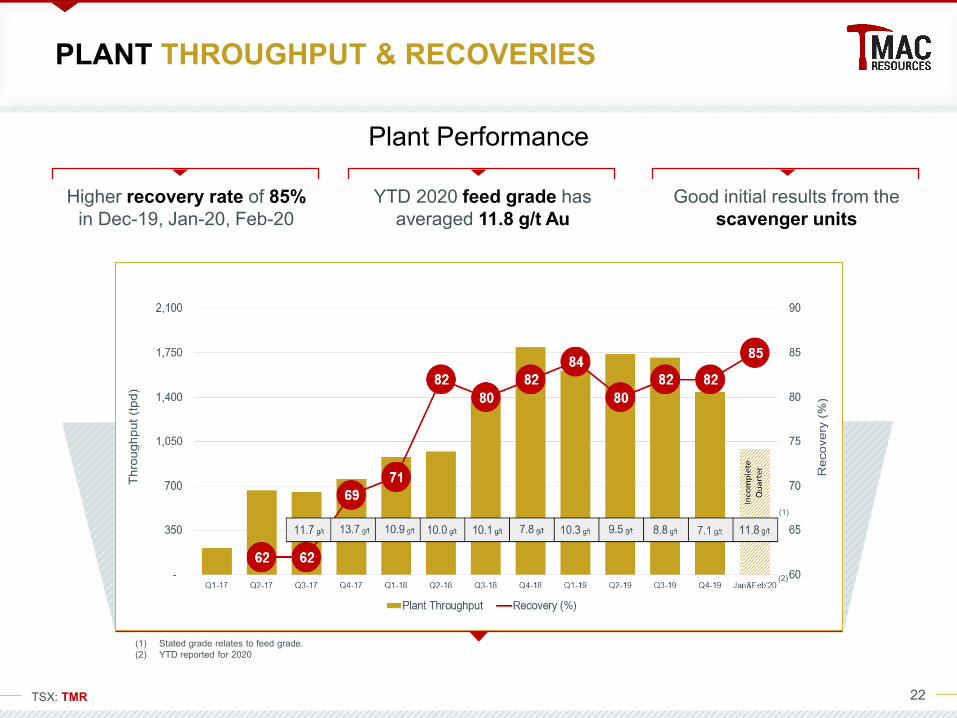
(1) Stated grade relates to feed grade.(2) YTD reported for 2020
(1)
PLANT THROUGHPUT & RECOVERIES
(2)
Higher recovery rate of 85% in Dec-19, Jan-20, Feb-20
YTD 2020 feed grade has averaged 11.8 g/t Au
Plant Performance
Good initial results from the scavenger units
23TSX: TMR
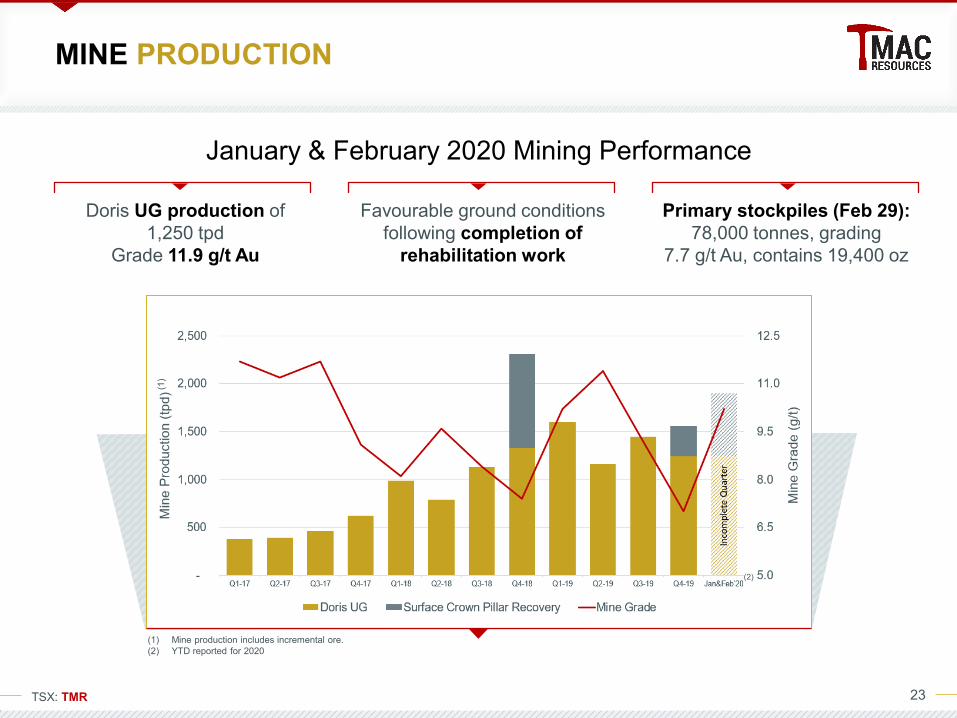
(1) Mine production includes incremental ore.(2) YTD reported for 2020
MINE PRODUCTION
a(1
)
(2)
Doris UG production of1,250 tpd
Grade 11.9 g/t Au
Favourable ground conditions following completion of
rehabilitation work
January & February 2020 Mining Performance
Primary stockpiles (Feb 29): 78,000 tonnes, grading
7.7 g/t Au, contains 19,400 oz
24TSX: TMR
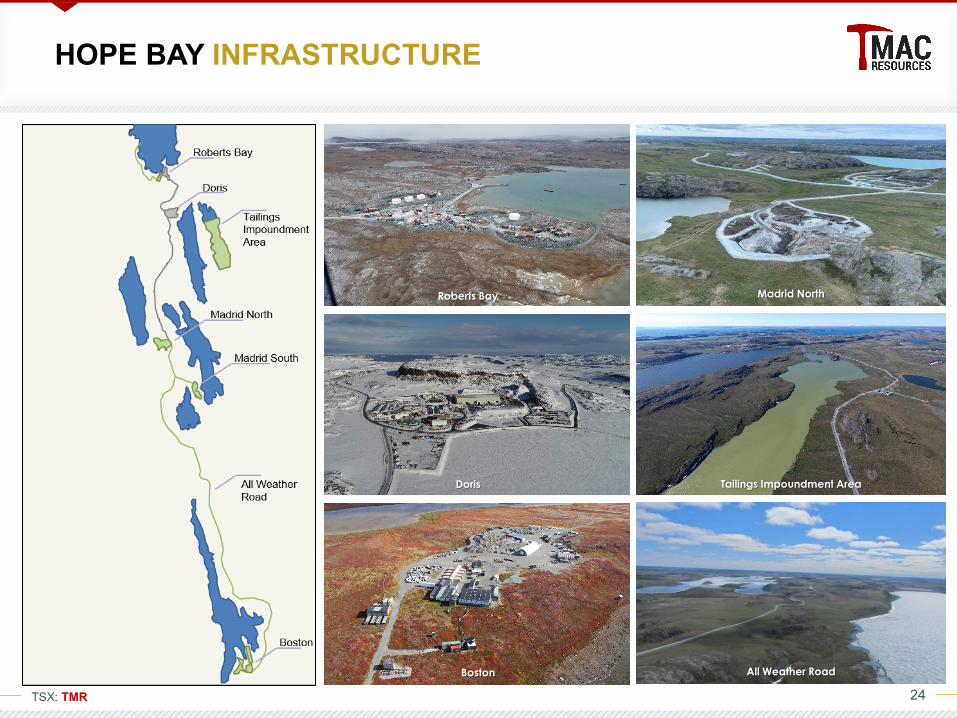
HOPE BAY INFRASTRUCTURE
All Weather Road
Roberts Bay
Doris
Madrid North
Boston
Tailings Impoundment Area

25TSX: TMR
0.00
3.00
6.00
9.00
12.00
15.00
18.00
21.00
Jul-15 Jan-16 Jul-16 Jan-17 Jul-17 Jan-18 Jul-18 Jan-19 Jul-19 Jan-20
TMR
Sha
re P
rice
(C$)
TMAC HISTORY AND CAPITAL STRUCTURE
Type Quantity
Common Shares(1) 115,299,078
Options(2) 3,503,231
Restricted Share Rights(2) 1,431,488
Warrants(2) 2,333,834
Shareholder Share Ownership Percent Ownership
Resource Capital Funds 35.0 million 30.4%
Newmont 32.2 million 28.0%
BlackRock(1) 6.3 million 5.5%
KIA (Inuit Landowner) 1.2 million 1.1%
Directors and Officers(2) 1.1 million 0.9%(1) Based on data from IPREO and FactSet as of February 29, 2020(2) Common shares only. Excludes 2.6 million rights (RSR, DSU, RSU) and options
2015-2016Exploration and Development
Feb 2017 First Gold Poured
Jul 2015 IPO
Feb 2018 Jason Neal joins as CEO
Aug 2017 Gil Lawson joins as COO
Jul 2017 Announce Plant issues
Oct 2017 Hired new General Manager
Nov 2017 CEO Retires
Dec 2017 President Retires
April 2018 Hiring Sr Director, Metallurgy Director, Strategic Mine Planning Assistant General Manager
(1) As of February 29, 2020(2) As of October 31, 2019
26TSX: TMR
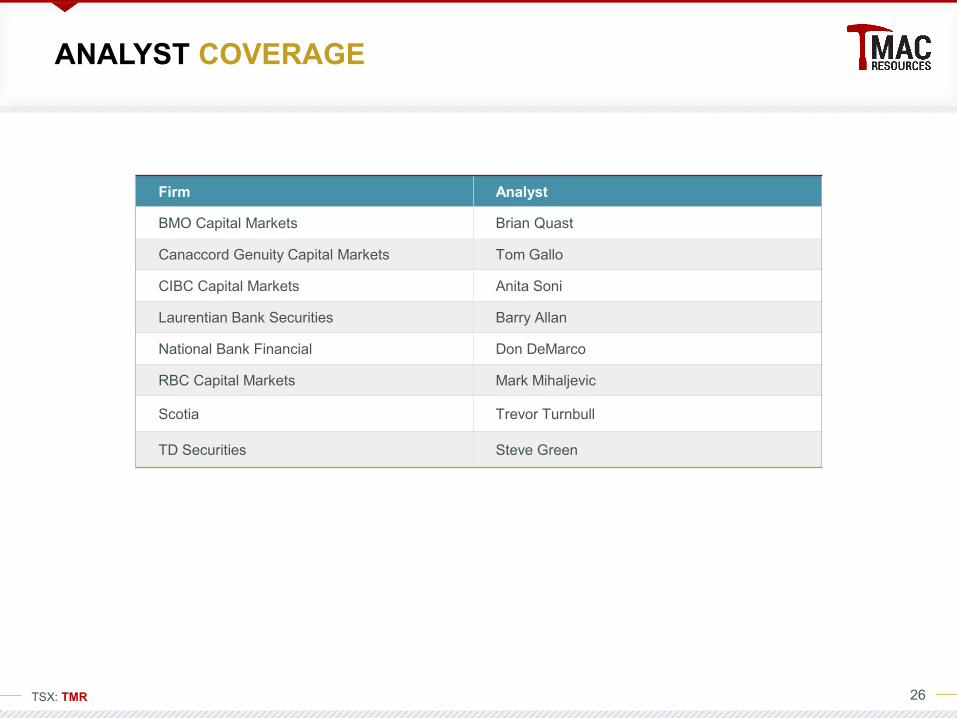
ANALYST COVERAGE
Firm Analyst
BMO Capital Markets Brian Quast
Canaccord Genuity Capital Markets Tom Gallo
CIBC Capital Markets Anita Soni
Laurentian Bank Securities Barry Allan
National Bank Financial Don DeMarco
RBC Capital Markets Mark Mihaljevic
Scotia Trevor Turnbull
TD Securities Steve Green
27TSX: TMR
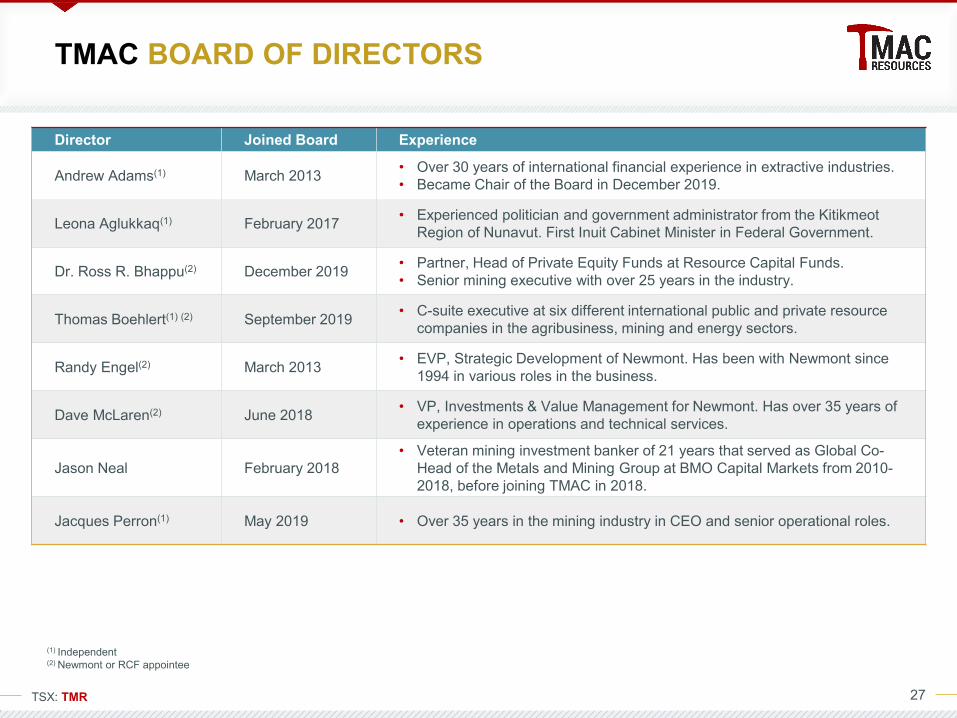
TMAC BOARD OF DIRECTORS
Director Joined Board Experience
Andrew Adams(1) March 2013 • Over 30 years of international financial experience in extractive industries.• Became Chair of the Board in December 2019.
Leona Aglukkaq(1) February 2017 • Experienced politician and government administrator from the Kitikmeot Region of Nunavut. First Inuit Cabinet Minister in Federal Government.
Dr. Ross R. Bhappu(2) December 2019 • Partner, Head of Private Equity Funds at Resource Capital Funds.• Senior mining executive with over 25 years in the industry.
Thomas Boehlert(1) (2) September 2019 • C-suite executive at six different international public and private resource companies in the agribusiness, mining and energy sectors.
Randy Engel(2) March 2013 • EVP, Strategic Development of Newmont. Has been with Newmont since 1994 in various roles in the business.
Dave McLaren(2) June 2018 • VP, Investments & Value Management for Newmont. Has over 35 years of experience in operations and technical services.
Jason Neal February 2018• Veteran mining investment banker of 21 years that served as Global Co-
Head of the Metals and Mining Group at BMO Capital Markets from 2010-2018, before joining TMAC in 2018.
Jacques Perron(1) May 2019 • Over 35 years in the mining industry in CEO and senior operational roles.
(1) Independent(2) Newmont or RCF appointee

28TSX: TMR
TMAC MANAGEMENT TEAM
Management Team Position Experience
Jason Neal President & CEO• Veteran mining investment banker of 21 years that served as Global Co-Head
of the Metals and Mining Group at BMO Capital Markets from 2010-2018, before joining TMAC in February 2018.
Gil Lawson COO • Over 31 years of experience in the mining business, primarily in narrow vein underground gold operations. Joined TMAC in August 2017.
Maarten Theunissen CFO • CA (South Africa) with over 17 years of experience in the resource sector including seven years at Uranium One Inc. Joined TMAC in May 2013.
Calum Semple EVP, Operations • Over 30 years of leadership experience in the industrial and mining sectors globally. UK Chartered Engineer, joined TMAC in February 2020.
Ronald P. Gagel EVP, Corporate Affairs & Corporate Secretary
• CA with more than 40 years of professional experience, the last 30 of which have been in the mining sector. Joined TMAC in March 2013.
Julia Micks EVP, Human Resources • Over 29 years of experience in Human Resources and brings over 22 years of experience within the mining industry. Joined TMAC in April 2013.
Alex Buchan VP, Corporate Social Responsibility
• Over 26 years of experience in wildlife management and community economic development in Nunavut. Joined TMAC in October 2013.
Oliver Curran VP, Environmental Affairs• Over 15 years of experience in the mining sector focused on environmental
approvals, compliance monitoring, environmental management systems and reporting. Joined TMAC in March 2016.
Dave King VP, Exploration & Geoscience
• Registered professional geologist with over 17 years of experience focused on both mining exploration and production. Joined TMAC in May 2013.
Lisa Wilkinson VP, IR & Strategic Development
• Extensive mining finance experience, both corporately and in capital markets. Joined TMAC in March 2019.

29TSX: TMR
GOLD PRICE AND CURRENCY
Source: Factset
Hope Bay operating costs are 85%
Canadian dollars
Diesel price fixed in C$ during
each sealift
15% US$ exposure is mainly diesel and
reagents
700
900
1,100
1,300
1,500
1,700
1,900
2,100
2,300
Mar-10 Mar-11 Mar-12 Mar-13 Mar-14 Mar-15 Mar-16 Mar-17 Mar-18 Mar-19 Mar-20
Gold Price (C$) Gold Price (US$)
30TSX: TMR
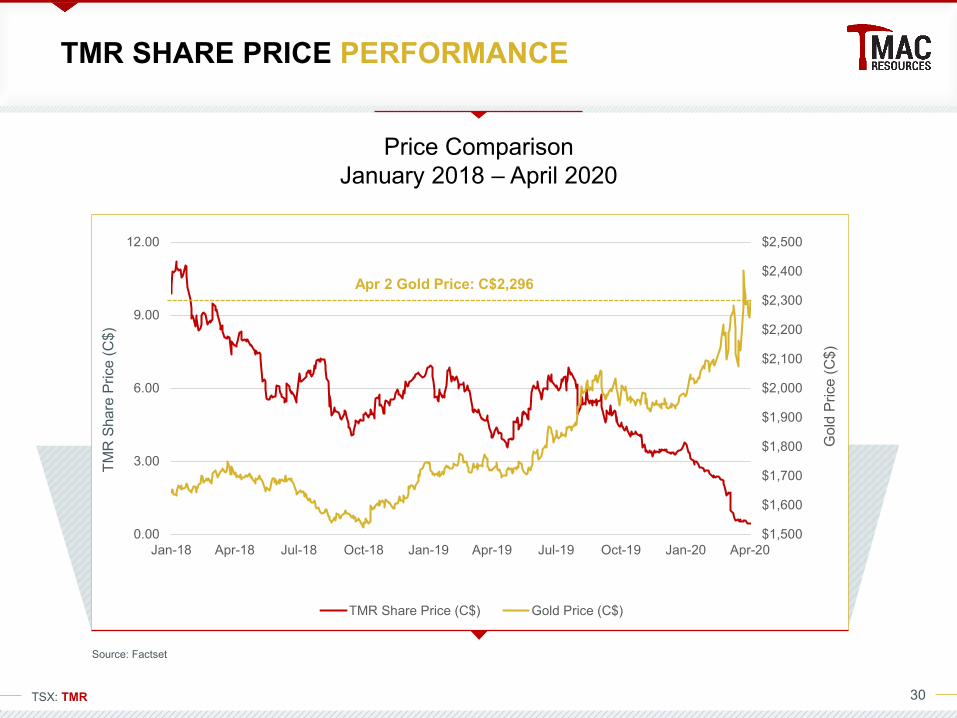
TMR SHARE PRICE PERFORMANCE
Source: Factset
Price ComparisonJanuary 2018 – April 2020
$1,500
$1,600
$1,700
$1,800
$1,900
$2,000
$2,100
$2,200
$2,300
$2,400
$2,500
0.00
3.00
6.00
9.00
12.00
Jan-18 Apr-18 Jul-18 Oct-18 Jan-19 Apr-19 Jul-19 Oct-19 Jan-20 Apr-20
Gol
d Pr
ice
(C$)
TMR
Sha
re P
rice
(C$)
TMR Share Price (C$) Gold Price (C$)
Apr 2 Gold Price: C$2,296

31TSX: TMR
ONE OF THE SAFEST MINES IN CANADA
Total Injuries Frequency*
Group 2017 2018 2019
Gold and Nickel Mines 4.28 3.69 3.84
Miscellaneous Metals 3.05 3.62 2.18
Miscellaneous Industrials 2.21 2.78 4.59
Diamond Drill Contractors 2.23 2.76 7.49
Mining Contractors 3.05 3.80 3.23
Other Contractors 5.68 4.36 N/A
Total Mining and Contractors 3.48 3.53 3.75
TMAC Resources 1.53 1.06 2.52
Ontario Mining IndustryPeer Group Safety Statistics
* Total Injury Frequency is a combination of the number of Lost Time Injuries and Non-Lost Time Injuries divided by 200,000 hours worked.

32TSX: TMR
KEY OPERATING METRICS
Q4-17 Q1-18 Q2-18 Q3-18 Q4-18 Q1-19 Q2-19 Q3-19 Q4-19 Jan-Feb-20
Plant
Recovery (%) 69 71 82 80 82 84 80 82 82 85
Throughput (tpd) 760 930 970 1,390 1,800 1,610 1,740 1,710 1,440 990
Grade (g/t) 13.7 10.9 10.0 10.1 7.8 10.3 9.5 8.8 7.1 11.8
Mine
Production (tpd) 620 990 790 1,130 2,310 1,600 1,160 1,450 1,560 1,900
Grade (g/t) 9.1 8.1 9.6 8.4 7.4 10.2 11.4 9.2 7.0 10.2
Development (m) 990 1,370 1,670 1,810 1,620 1,660 1,840 2,140 2,080 1,560
Gold Production (oz) 21,200 20,650 23,140 33,100 34,080 40,050 38,520 36,290 24,650 18,950
Gold Sold (oz) 17,350 19,540 25,760 32,140 31,380 39,200 37,730 37,580 24,650 17,760

33TSX: TMR
KEY FINANCIAL METRICS
(1) The key financial metrics for the year ended December 31, 2017 only cover the period from June 1, 2017 onwards, the date for accounting recognition of commercial production, for many items including revenue, realized gold price, Cash Costs, AISC and ounces sold.
(2) Refer to non-IFRS measures section of the Management Discussion and Analysis for further information on these measures.(3) Computation of AISC is in accordance with the World Gold Council guidelines, as updated in November 2018.
2017(1) 2018 Q3-2019 YTD
Gold Produced (ounces) 55,150 110,970 114,860
Gold Sold (ounces) 34,860 108,820 114,510
Revenue (C$ millions) 56.4 178.0 206.8
Realized Gold Price (C$/oz / US$/oz) 1,618 / 1,278 1,635 / 1,257 1,806 / 1,360
Cash Costs (US$/oz)(2) 1,288 868 705
AISC (US$/oz)(2)(3) 1,870 1,291 1,075
Sustaining capital (US$/oz) 353 296 277
Cash Flow from Operating Activities before Working Cap Changes (C$ millions) (19.1) 24.2 76.9
Cash Flow from Operating Activities (C$ millions) (33.9) 21.6 68.9
Adjusted EBITDA (C$ millions)(2) (18.0) 37.7 90.9
Capital Expenditures (C$ millions) 72.9 86.9 77.1
Ending Unrestricted / Restricted Cash Balance (C$ millions) 42.0 / 43.9 24.8 / 27.7 47.4 / 29.4
Principal Debt (C$ millions) 200.7 171.6 154.9

34TSX: TMR
Consideration
• US$40 million proceeds
• US$3 million equity issuance to Maverix (at a price of C$6.00 per share)
• US$43 million (C$57 million) Total Gross Proceeds
Royalty Terms
• Additional 1.5% NSR royalty (total rate of Royalty will increase from 1.0% to 2.5% effective August 1, 2019)
• Short-term 0.25% NSR until additional 1.5% NSR is registered against property (once Sprott debt is repaid, latest expected is June 2021)
Change of ControlBuyback Right
• Full buyback right on additional 1.5% NSR (and bonus 0.25% NSR) for US$50 million in the event of a change of control transaction announced before June 30, 2021
Partial Buyback Right • Partial buyback right on 0.5% of the additional NSR for US$15 million after June 30, 2021
Step-Down• Step-down of additional 1.5% NSR to 0.75% after 3 million ounces of
gold produced (regardless of whether the partial buyback right has been exercised)
MAVERIX ROYALTY AMENDMENT SUMMARY

35TSX: TMR
Principal Amount • US$118.7 million outstanding at March 2019
Interest Rate • 6.5% per annum plus US$ 3-mth LIBOR
Principal Payments
• No principal payments during 2019 and H1 2020
• US6.7M principal payment on July 1, 2020
• US$2.5M Quarterly from October 1, 2020* Quarterly payments made first day of months of January, April, July, and October
Maturity Date • December 31, 2020 (extension to June 30, 2021 with 2% fee)
Prepayment/Repayment Fee • 2% on principal payments (excluding scheduled quarterly payments)
Voluntary Prepayment • No prepayment until September 30, 2020
Covenants
• Working capital > $20 M after June 30, 2020
• Minimum cash > $10 M June 30, 2020
• Eliminated repayment test and reserve tail covenants
• Unsecured hedging allowed under ISDA
Change of Control• Prepaid on change of control at option of TMAC or Sprott
• No fee other than prepayment/repayment fee
DEBT FACILITY SUMMARY

36TSX: TMR
CATEGORY / DEPOSIT TONNES (t 000) GRADE (g/t Au) CONTAINED AU (oz 000)
PROVEN
Stockpiles 99 4.1 13
Total Proven 99 4.1 13
PROBABLE
Doris 1,194 8.4 321
Madrid North UG 7,525 6.1 1,466
Madrid North Crown Pillar 212 5.7 39
Suluk 3,703 5.8 695
Madrid South 842 9.1 245
Boston 3,306 7.2 766
Total Probable 16,782 6.5 3,532
TOTAL P & P
Stockpiles 99 4.1 13
Doris 1,194 8.4 321
Madrid North UG 7,525 6.1 1,466
Madrid North Crown Pillar 212 5.7 39
Suluk 3,703 5.8 695
Madrid South 842 9.1 245
Boston 3,306 7.2 766
Total P & P 16,881 6.5 3,545
HOPE BAY PROVEN & PROBABLE MINERAL RESERVESAs of Dec. 31, 2019

37TSX: TMR
HOPE BAY MEASURED, INDICATED & INFERRED RESOURCES
CATEGORY / DEPOSIT TONNES (t 000) GRADE (g/t Au) CONTAINED Au (oz 000)MEASURED
Doris 240 11.0 85Boston 1,330 9.3 397
Total Measured 1,570 9.5 481INDICATED
Doris 1,726 9.0 499Madrid North 10,761 6.6 2,273 Suluk 3,670 7.2 851 Madrid South 648 14.0 292Boston 3,441 7.0 776
Total Indicated 20,246 7.2 4,691 MEASURED AND INDICATED
Doris 1,966 9.2 584 Madrid North 10,761 6.6 2,273 Suluk 3,670 7.2 851 Madrid South 648 14.0 292 Boston 4,771 7.6 1,173
Total Measured & Indicated 21,816 7.4 5,173INFERRED
Doris 1,750 7.1 399 Madrid North 1,113 5.3 190 Suluk 4,339 5.7 792 Madrid South 662 7.1 152 Boston 3,053 6.1 594
Total Inferred 10,917 6.1 2,127
As of Dec. 31, 2019

38TSX: TMR
NOTES TO PROVEN & PROBABLE MINERAL RESERVES1. CIM definitions were followed for the statement of Mineral Reserves.2. The Mineral Reserves for each Individual deposit were defined utilizing the following cut-off grades:
a) 4.0 g/t gold for longhole stopes.b) 3.0 g/t gold for incremental development ore required for mining.c) 2.0 g/t gold for the Madrid North crown pillar surface mining.
3. All Mineral Reserve are estimated using an average long-term gold price of US$1,325 per ounce and a C$/US$ exchange rate of 1.34.
4. A 50-m crown pillar allowance was applied to Mineral Reserves located below lakes where applicable.5. Numbers may not add due to rounding.
NOTES TO MEASURED, INDICATED & INFERRED RESOURCES1. CIM definitions were followed for the statement of Mineral Resources.2. Mineral Resources are inclusive of those resources converted to Mineral Reserves and are in-situ resources excluding
stockpiles.3. Mineral Resources that are not Mineral Reserves do not have demonstrated economic viability.4. The Mineral Resources for each Individual deposit were defined utilizing a block cut-off grade of 3.5 g/t.5. All Mineral Resources are estimated using an average long-term gold price of US$1,500 per ounce and a C$/US$ exchange
rate of 1.34.6. A 50 m crown pillar allowance was applied to Mineral Resources located below lakes where applicable.7. A minimum intercept width of 1.5 m was applied to the Mineral Resource modelling.8. Ore density was calculated using the geological block model density field.9. Numbers may not add due to rounding.
The information in this presentation was reviewed and approved by David King, P.Geo., Vice President, Exploration & Geoscience of TMAC for information pertaining to exploration and Mineral Resources, and Gilbert Lawson, P.Eng., Chief Operating Officer of TMAC for Mineral Reserves and all other technical information. By virtue of their education and relevant experience, Mr. King and Mr.Lawson are "Qualified Persons" as defined by National Instrument 43-101 – Standards of Disclosure for Mineral Projects.
INFORMATION REGARDING SCIENTIFIC ANDTECHNICAL INFORMATION

39TSX: TMR
• Several slides reported drill intervals representing downhole thickness; true width varies depending on the dip of the drill hole. True widths range significantly and can vary from approximately 15% to 90% of downhole widths. Composite intervals are based on geological observations. Gold values used to calculate composite intervals are uncut.
• Refer to the current technical report “NI 43-101 Technical Report on the Hope Bay Property, Nunavut, Canada” dated March 30, 2020 for details on validation of the historical drillhole database and assay intervals referenced in this presentation.
• Please refer to the news releases published on TMAC’s website at www.tmacresources.com for more details on the results of the exploration work.
INFORMATION REGARDING SCIENTIFIC ANDTECHNICAL INFORMATION

181 University AvenueSuite 300P.O. Box 33Toronto, Ontario, M5H 3M7Phone: 647-480-3110
Corporate Office
Investor [email protected]