investor flows and share restrictions in the hedge fund ... · pdf fileinvestor flows and...
TRANSCRIPT
Investor Flows and Share Restrictions in the Hedge Fund Industry
Bill Ding, Mila Getmansky, Bing Liang, and Russ Wermers
Ninth Conference of the ECB-CFS Research NetworkOctober 9, 2007
Page 2 of 31
MotivationWe study the flow-performance relation for individual hedge fundsFlow behavior is important in understanding:
Structure and survival characteristics of hedge fund marketsImpact of hedge funds on markets (stabilizing or destabilizing?)Financial contagion
Hedge fund flows are complicated by both direct share restrictions and restrictions implied by asset illiquidity
We are the first to formally study restrictionsDistinguish money flows into live database funds from flows to funds in defunct databaseStudy “smart money” effect under share restrictions
Page 3 of 31
Literature• Fund Flow-Performance:
– Sirri and Tufano (1998) (MF, convex)– Chevalier and Ellison (1997) (MF, convex)– Del Guercio and Tkac (2002) (Pension less convex than
Mutuals)– Goetzmann, Ingersoll and Ross (2003) (HF, concave)– Agarwal, Daniel and Naik (2004) (HF, convex)– Baquero and Verbeek (2005) (HF, linear)
• Smart Money Effect:– Gruber (1996)– Zheng (1999)– Wermers (2004)– Barquero and Verbeek (2005)
Page 4 of 31
Restrictions on Hedge Fund Flows
• Restrictions on Inflows– Capacity/Style– Onshore/Offshore– Subscription frequency
• Restrictions on outflows– Lockup– Redemption frequency– Advance notice period
• Asset illiquidity may affect flows as well

Page 5 of 31
Results• Hedge fund investors chase performance• With share restrictions the fund flow-performance
relation is concave; it is convex without share restrictions-consistent with the mutual fund literature
• Flow-performance relationship differs for live and defunct funds
• For live funds, flow-performance relationship is concave:– Closure to new investment
• For defunct funds, flow-performance relationship is convex:– Bifurcation (liquidation vs. voluntary withdrawal)
• Find presence of smart money effect: flows can predict future performance. However, this effect is reduced by share restrictions
Page 6 of 31
Hypothesis 1
• Share Restrictions and Asset Illiquidity– Direct Effect (Binding Restriction)
• Lower outflows from poor performers• Lower inflows to good performers• Lower flow sensitivity to past performance
Page 7 of 31
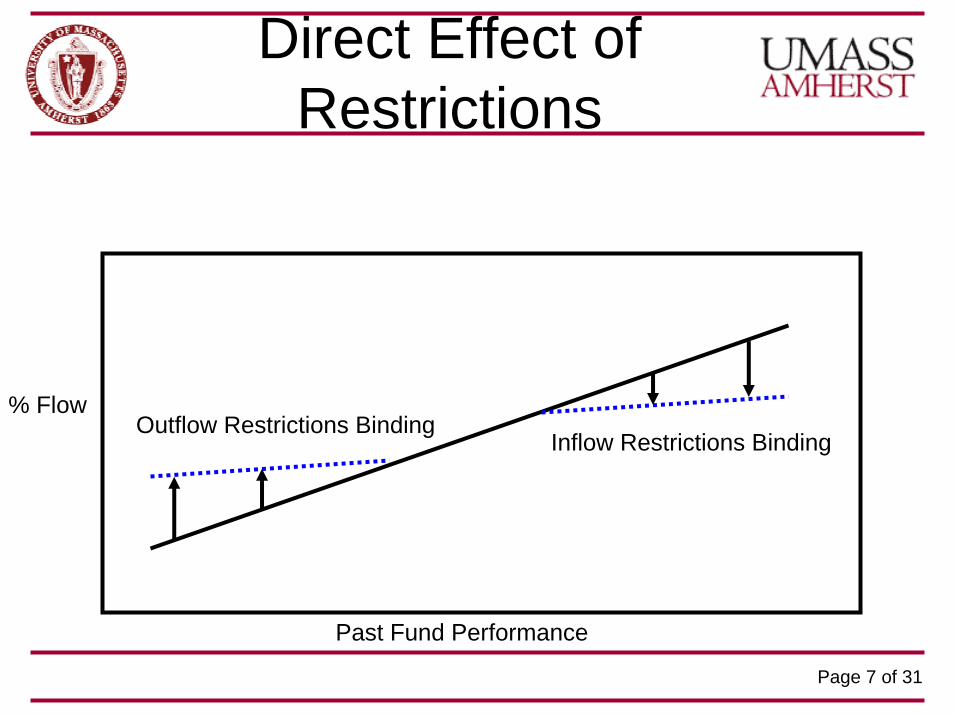
Direct Effect of Restrictions
Past Fund Performance
% FlowInflow Restrictions Binding
Outflow Restrictions Binding
Page 8 of 31
Hypothesis 1
• Share Restrictions and Asset Illiquidity– Indirect Effect (Investor Expectation of
Future Binding Restriction)• Higher inflows to poor performers• Higher outflows from good performers • Higher flow sensitivity to past performance

Page 9 of 31
Indirect Effect of Restrictions
Past Fund Performance
% Flow
Investors React toBinding Outflow Restrictions
Investors React toBinding Inflow Restrictions
Page 10 of 31
Hypothesis 2
• Live vs. Defunct FundsLive funds: concave flow-performance relation due to voluntary closures of good performers
Defunct funds: convex flow-performance relation due to different exit reasons:– well-performing funds attract substantial new
investments – poorly-performing funds liquidate
Page 11 of 31
Hypothesis 3
• Smart Money Effect– Direct Effect (Binding Restriction)
• Lower ability of flows to respond to expected future performance—lower performance of flows

Page 12 of 31
Data
TASS databaseTime: January 1993 – December 200411 Distinct categoriesEliminated funds with
gross returnsstale pricingless than 12 months of observationsmissing assets under management
4,594 funds in the combined database (75% of the initial fund sample size of 6,097)

Page 13 of 31
Measuring Flows
• Monthly returns are used to estimate flows• End-of-month flow assumed
Page 14 of 31
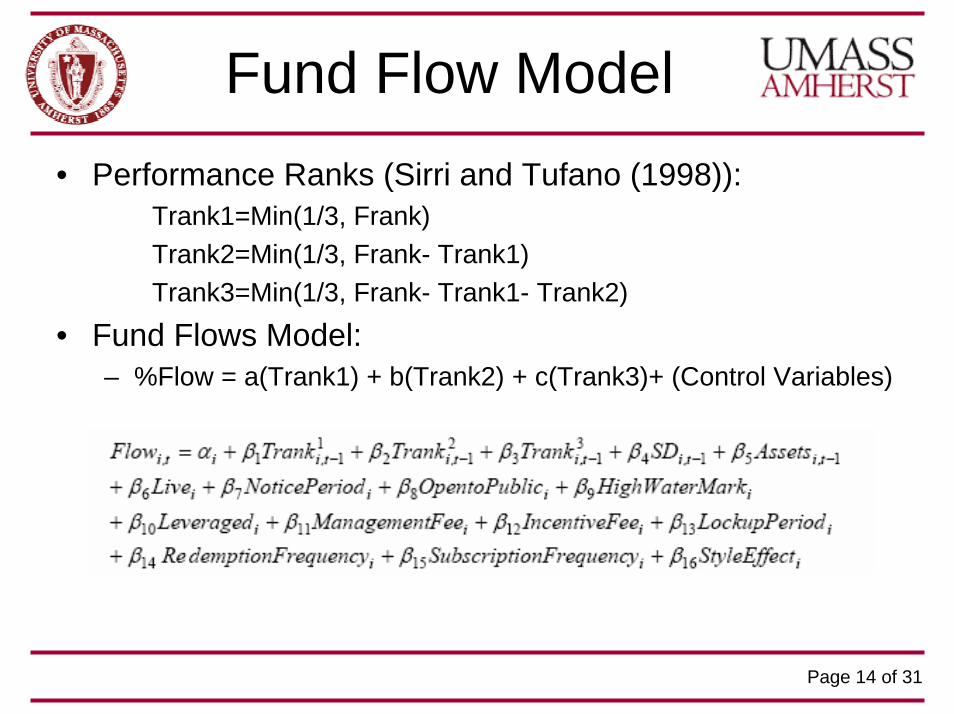
Fund Flow Model• Performance Ranks (Sirri and Tufano (1998)):
Trank1=Min(1/3, Frank)Trank2=Min(1/3, Frank- Trank1)Trank3=Min(1/3, Frank- Trank1- Trank2)
• Fund Flows Model:– %Flow = a(Trank1) + b(Trank2) + c(Trank3)+ (Control Variables)

Page 15 of 31
Asset Illiquidity
• Asset illiquidity measures (Getmansky, Lo, and Makarov (2004)):
1
2,1,0],1,0[
210
221100
=++
=∈++= −−
θθθ
θθθθ
jRRRR
j
tttt
Page 16 of 31
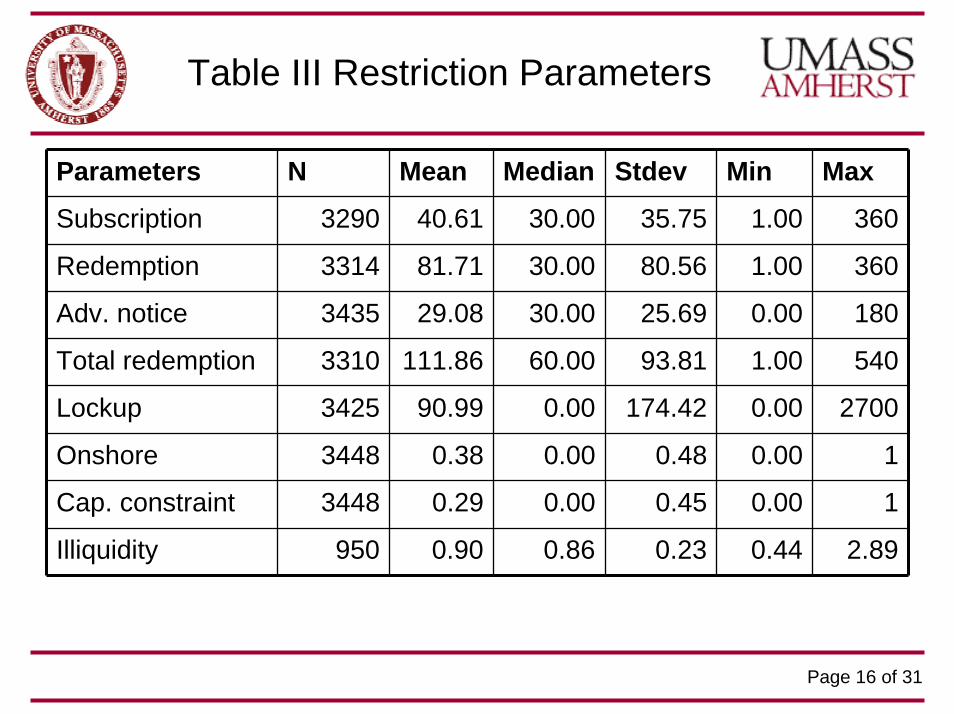
Table III Restriction Parameters
Parameters N Mean Median Stdev Min Max
Subscription 3290 40.61 30.00 35.75 1.00 360
Redemption 3314 81.71 30.00 80.56 1.00 360
Adv. notice 3435 29.08 30.00 25.69 0.00 180
Total redemption 3310 111.86 60.00 93.81 1.00 540
Lockup 3425 90.99 0.00 174.42 0.00 2700
Onshore 3448 0.38 0.00 0.48 0.00 1
Cap. constraint 3448 0.29 0.00 0.45 0.00 1
Illiquidity 950 0.90 0.86 0.23 0.44 2.89
Page 17 of 31
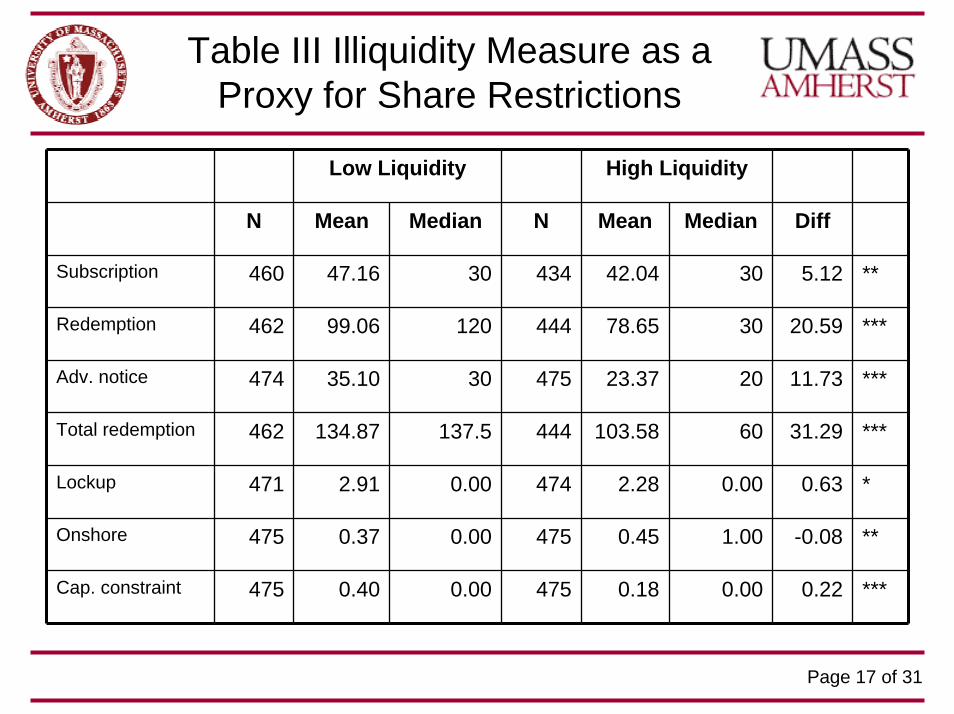
Table III Illiquidity Measure as a Proxy for Share Restrictions
Low Liquidity High Liquidity
N Mean Median N Mean Median Diff
Subscription 460 47.16 30 434 42.04 30 5.12 **
Redemption 462 99.06 120 444 78.65 30 20.59 ***
Adv. notice 474 35.10 30 475 23.37 20 11.73 ***
Total redemption 462 134.87 137.5 444 103.58 60 31.29 ***
Lockup 471 2.91 0.00 474 2.28 0.00 0.63 *
Onshore 475 0.37 0.00 475 0.45 1.00 -0.08 **
Cap. constraint 475 0.40 0.00 475 0.18 0.00 0.22 ***
Page 18 of 31
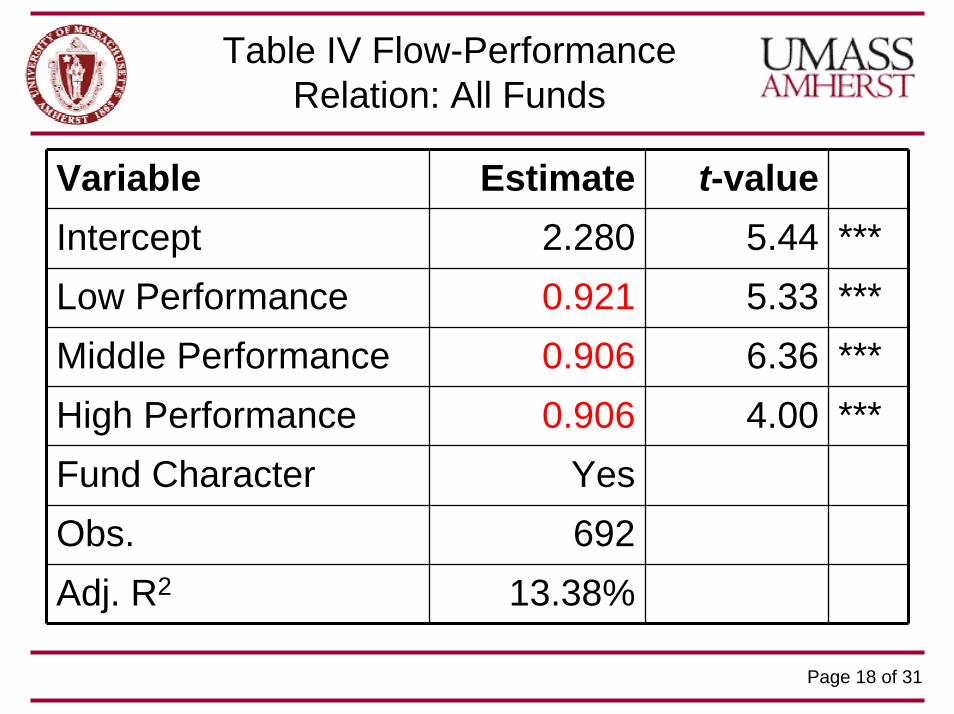
Table IV Flow-Performance Relation: All Funds
Variable Estimate t-valueIntercept 2.280 5.44 ***Low Performance 0.921 5.33 ***Middle Performance 0.906 6.36 ***High Performance 0.906 4.00 ***Fund Character YesObs. 692Adj. R2 13.38%

Page 19 of 31
Table V Flow-Performance and Asset Illiquidity
Variable Estimate With illiquidity
Intercept 2.093 ***Low Performance 0.720 *** 1.258Middle Performance 0.786 *** 0.954High Performance 0.870 *** 0.178Low Perf*Low liquidity 0.538 ***Middle Perf*Low liquidity 0.168High Perf*Low liquidity -0.692 ***Fund Character Yes YesObs. 482Adj. R2 12.7%
Page 20 of 31
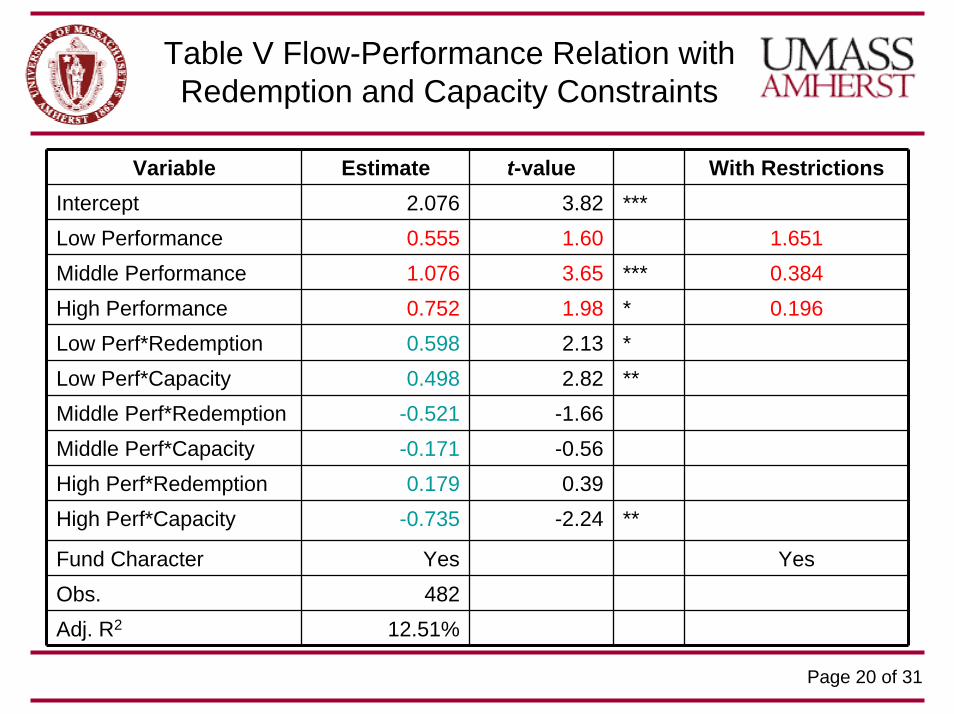
Table V Flow-Performance Relation with Redemption and Capacity Constraints
Variable Estimate t-value With RestrictionsIntercept 2.076 3.82 ***Low Performance 0.555 1.60 1.651Middle Performance 1.076 3.65 *** 0.384High Performance 0.752 1.98 * 0.196Low Perf*Redemption 0.598 2.13 *Low Perf*Capacity 0.498 2.82 **Middle Perf*Redemption -0.521 -1.66Middle Perf*Capacity -0.171 -0.56High Perf*Redemption 0.179 0.39High Perf*Capacity -0.735 -2.24 **
Fund Character Yes YesObs. 482Adj. R2 12.51%

Page 21 of 31
Table V Flow-Performance with All Restrictions
Variable Estimate t-value With Restrictions
Intercept 2.178 3.74 ***Low Performance 0.713 1.75 1.777
Middle Performance 0.891 2.45 ** 0.251
High Performance 1.097 2.77 ** 0.583
Low Perf*Sum Restrictions 1.064 --
Middle Perf*Sum Restrictions -0.640 --
High Perf*Sum Restrictions -0.514 --
Fund Character Yes Yes
Obs. 482
Adj. R2 14.1%
Page 22 of 31
Fund-Flow Relationship
• Convex without restrictions• Concave with restrictions

Page 23 of 31
Effect of Restrictions
Past Fund Performance
% Flow
Investors React toBinding Outflow Restrictions
Investors Do Not Appear to Be Able to ForecastBinding Inflow Restrictions

Page 24 of 31
Table VI Long/Short Equity Hedge
All Live Defunct
Variable Estimate Estimate Estimate
Intercept 3.580 *** 4.346 *** 3.493 **
Low Performance 0.196 -0.743 0.228
Middle Performance 1.251 *** 1.431 *** 0.956 *
High Performance 1.496 ** 1.451 * 1.849 ***
Fund Character Yes Yes Yes
Obs. 274 201 73
Adj. R2 15.3% 15.12% 22.09%
Page 25 of 31
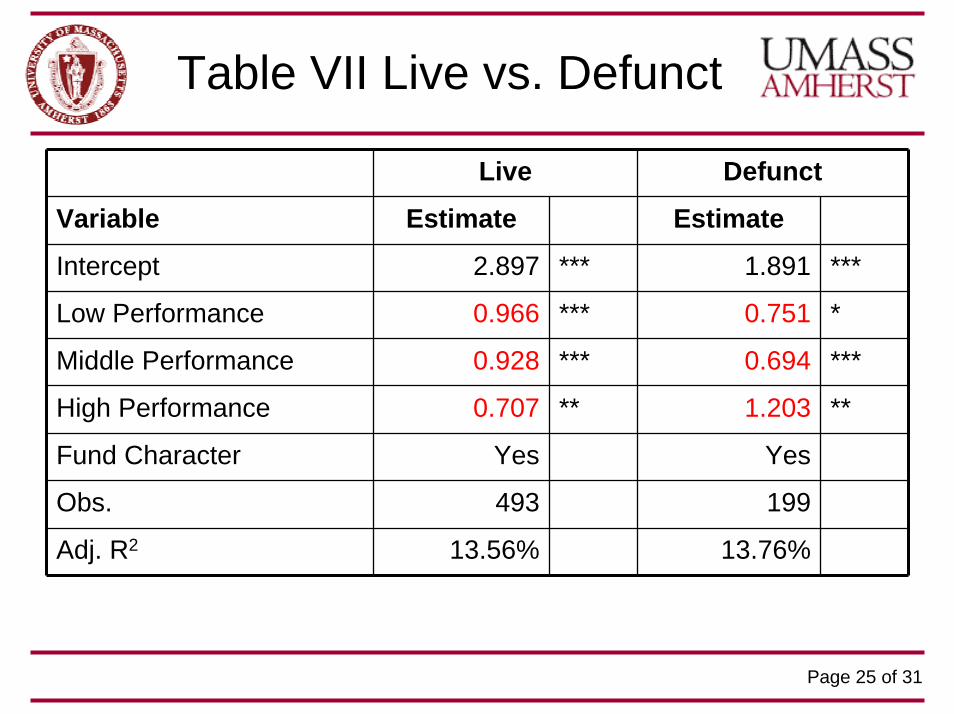
Table VII Live vs. Defunct
Live Defunct
Variable Estimate Estimate
Intercept 2.897 *** 1.891 ***
Low Performance 0.966 *** 0.751 *
Middle Performance 0.928 *** 0.694 ***
High Performance 0.707 ** 1.203 **
Fund Character Yes Yes
Obs. 493 199
Adj. R2 13.56% 13.76%
Page 26 of 31
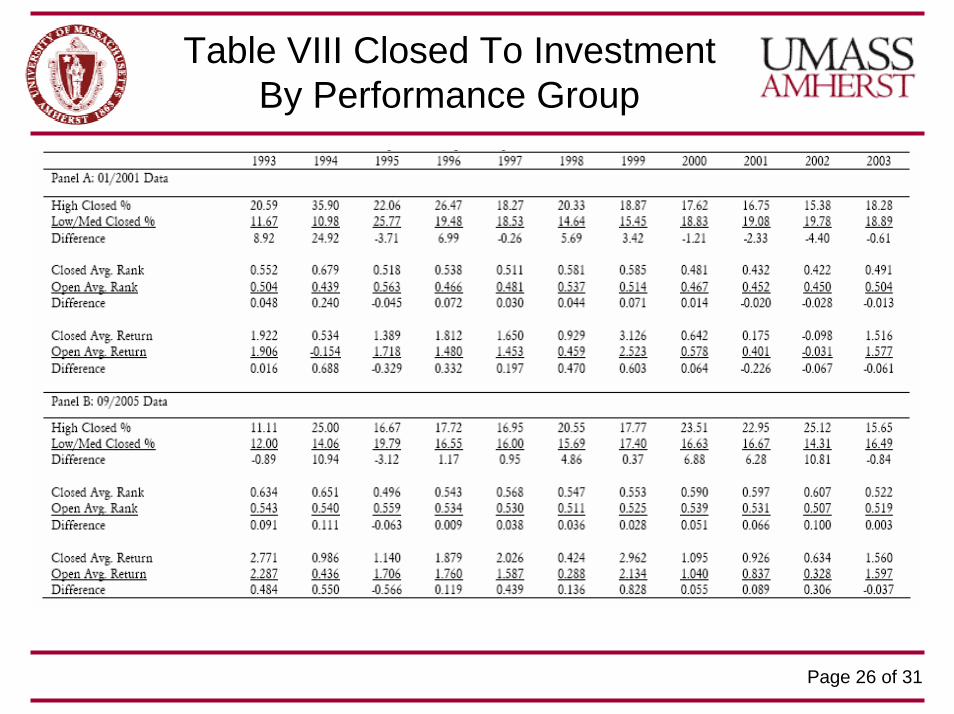
Table VIII Closed To Investment By Performance Group

Page 27 of 31
Table IX Drop Reasons by Performance Groups
Low Middle HighDrop Reasons N % N % N %Closed to new $ 1 0.6 0 0.2 1 0.55Dormant 0 0.15 0 0.09 0 0.07Merged 5 4.62 5 4.67 4 3.81Liquidated 73 52.09 51 52.50 42 46.25No longer reporting 41 28.50 30 30.13 33 35.67Unable to contact 12 8.70 7 7.16 9 8.82Unknown 6 5.33 5 5.25 5 4.83
Page 28 of 31
Live vs. Defunct Funds
• Live vs. Defunct FundsLive funds: concave flow-performance relation due to voluntary closures of good performers (and involuntary closures of poor performers)
Defunct funds: convex flow-performance relation due to different exit reasons:– well-performing funds attract substantial new
investments before closing – poorly-performing funds liquidate
Page 29 of 31
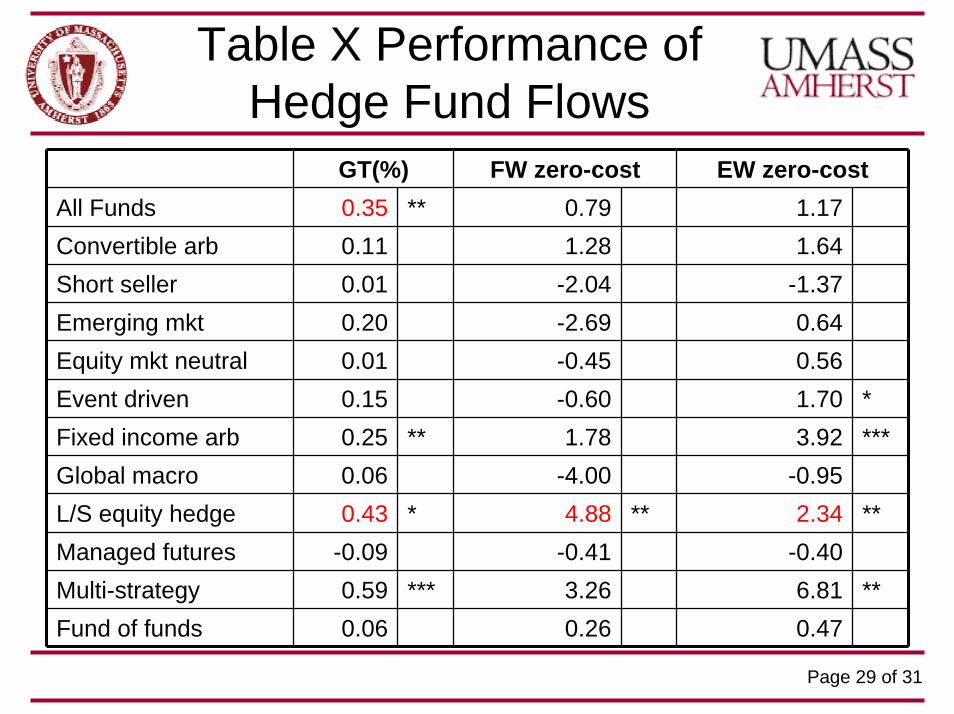
Table X Performance of Hedge Fund Flows
GT(%) FW zero-cost EW zero-costAll Funds 0.35 ** 0.79 1.17Convertible arb 0.11 1.28 1.64Short seller 0.01 -2.04 -1.37Emerging mkt 0.20 -2.69 0.64Equity mkt neutral 0.01 -0.45 0.56Event driven 0.15 -0.60 1.70 *Fixed income arb 0.25 ** 1.78 3.92 ***Global macro 0.06 -4.00 -0.95L/S equity hedge 0.43 * 4.88 ** 2.34 **Managed futures -0.09 -0.41 -0.40Multi-strategy 0.59 *** 3.26 6.81 **Fund of funds 0.06 0.26 0.47

Page 30 of 31
Table XI Smart Money and Share Restrictions
All Funds High Liquidity Low Liquidity
Intercept 1.619 *** 2.079 ** 1.116
Russell 3000 0.060 * 0.098 *** 0.016
LMS -0.019 0.015 -0.042 *
VMG 0.012 0.025 -0.013
UMD 0.037 *** 0.032 ** 0.030 **
Lehman Aggre. Bond 0.062 -0.004 0.057
Credit Spread -0.666 ** -1.018 ** -0.251
Term spread -0.139 * -0.144 * -0.176
ATM Call -0.002 -0.003 * -0.002
MSCI Emerging Stock -0.042 *** -0.052 *** -0.045 ***
MSCI Emerging Debt -0.075 -0.044 0.054
LIBOR -2.389 ** -2.830 ** -1.996
USD -0.055 -0.027 0.022
GOLD -0.022 -0.003 -0.039 **
OIL 0.009 0.013 0.009
Change in VIX 0.010 -0.014 0.036
Adj. R2 24% 27% 14%
Page 31 of 31
ConclusionsStudied investor behavior through hedge fund flowsSensitivity of hedge fund flows to past returns differs from the sensitivity of mutual fund flows to past returnsThe flow performance relation is concave with share restrictions but convex without restrictionsSensitivity of fund flows to past returns greatly depends on Live vs. Graveyard databaseThe shape of the flow-performance curve depends on
restrictionslive or defunct
Strong evidence of the smart money on individual hedge fund level but reduced by share restrictions