investment tracker - canarahsbclife.com
TRANSCRIPT

In linked insurance products, the investment risk in Investment portfolio is borne by the policy holder.
INVESTMENTTRACKERAnnual Newsletter March, 2017
The Linked Insurance Products do not offer any liquidity during the first five years of the contract. The policy holder will not be able to surrender/withdraw the monies invested in Linked Insurance Products completely or partially till the end of the fifth year.

2
From the CIO’s Desk
Unit Linked Equity Fund
Unit Linked Equity II Fund
Unit Linked Growth Fund
Unit Linked Growth II Fund
Unit Linked Growth Plus Fund
Unit Linked Balanced Fund
Unit Linked Balanced II Fund
Unit Linked Balanced Plus Fund
Unit Linked Debt Fund
Unit Linked Debt Plus Fund
Unit Linked Liquid Fund
Unit Linked NAV Guarantee Fund
Unit Linked Pension Growth Fund
Content3
4
68
1012
14
1618
2022
23
25
26
27
Unit Linked India Multicap Fund

3
Fund Return Benchmark Outperformance
Equity 22.5% 18.5% 4.0%
Growth 23.1% 16.7% 6.4%
Balanced 17.1% 14.0% 3.1%
Debt 11.2% 9.8% 1.4%
Liquid 7.2% 6.1% 1.0%
Equity-2 22.8% 18.5% 4.3%
Growth-2 23.5% 16.8% 6.8%
Balanced-2 17.5% 14.1% 3.4%
Growth Plus 22.9% 16.7% 6.1%
Balanced Plus 16.5% 14.0% 2.5%
Debt Plus 10.6% 9.4% 1.2%
bought Rs 53,000 crores (net)(approx) in equities in FY 2016-2017 with almost Rs 30,000 crores(net)(approx) in the month of March 2017 alone. The pleasant surprise has been the domestic institutions being big investors of Rs 30,200 crores (net)(approx) during the said financial year. Post demonetization domestic institutions saw an uptick in equity inflows due to cloudy outlook over real estate and gold as investment avenues.
In the debt markets, the interest rates dropped sharply by 1% to 6.4% in first 10 months of the financial year 2016-17. Please note that a fall in interest rates increases the NAV of your Debt portfolio. This fall in interest rates was largely on account of fall in inflation and demonetization. In February 2017, RBI changed its policy stance from reducing interest rates further to keeping them steady to keep inflation under check. This led to increase in interest rates by 0.3% in last two months . In this entire financial year 2016-17, our debt fund has generated return 11.2% for our policyholders.
US President Trump’s policies of national rebuilding and infrastructure creation are expected to bolster growth in the US leading to an uptick in global growth. This has led to equities, interest rates and commodities moving up in the past 3 months globally, with India being one of the best performing markets. While, the markets in the short term may have moved up faster than expected but we believe that over medium term outlook is quite favorable.
Though macroeconomic indicators are strong but corporate earnings growth still remains weak. Domestic equity markets have rallied significantly largely on back of strong flows. The likely rollout of GST in near future may further delay the process of earnings recovery. Moreover, on the global front, there are uncertainties relating to Trump polices, US Fed rate hike, Brexit impact and increasing commodities/crude prices. On this backdrop, going ahead, for the equity markets to sustain upward momentum, revival of the corporate earnings growth would be of key importance.
After seeing the strong returns generated by markets in recent times it is tempting to cash out of the market linked investments and wait for markets to correct. We would like to advice you that if you are trying to time the market, you need to get your exit correct as well as your re-entry. It’s not easy to go right on both the moves. Trying to time the markets leads to surprises generally and staying invested is the best strategy. To reiterate, time in the market is better than timing the market.
Our investment philosophy is based on disciplined and structured approach of doing research and investing. It includes undiluted focus on fundamental research to identify high quality businesses with clean managements that will create sustainable value for their shareholders. We employ great rigor and effort in identifying good companies and businesses and holding on to those investments for long periods. The objective is to build a portfolio of companies that will grow and become big over time and in the process generate superior returns.
Our policyholders invest their hard earned money with specific objectives of protection and for longer term investment returns. As per our analysis, in the past, favorable returns are generated in the financial markets by systematic, regular and disciplined investing over long periods of time.
Data Sources: The factual information mentioned above pertaining to market performance has been taken from National Stock Exchange (NSE) website, CRISIL Customized debt index, Reserve Bank of India (RBI) NDS-OM, Bloomberg.
Dear PolicyholderFinancial year 2016-17 has been a good year both for Equity and Debt investors. Equity markets generated 18.5% return and debt markets generated 9.8% return during the period. This strong performance is despite a lot of volatility and many significant high impact events globally, which had raised concerns on the investment climate. This gives a lot of confidence and proves the point that we should not be unduly concerned by the short term events and look at investing for the long term. As the financial year 2016-17 ends we felt this is a good time to highlight the performance of your funds. You will be pleased to know that all your funds have delivered returns significantly above benchmark during the year. This highlights our commitment towards generating steady and consistent returns for our policyholders.
The year gone by was a very eventful year with a number of events fuelling significant volatility in both domestic and global markets. Demonetization triumphed over all others and led to significant concerns on profit growth of companies and wiped out bulk of the Nifty returns. However, contrary to expectations, Indian corporates did reasonably well and came out relatively unscathed from the event leading to markets making new highs.
Investors both foreign and domestic were big buyers in the market despite the volatility. Foreign investors (FII)
As on 31st March 2017. Returns for the financial year 2016-17. Please refer funds section for detailed fund performance.
Anurag Jain Chief Investment Officer

4
Benchmark: Nifty 50 NAV as on 31st March 2017: 21.9165Date of Inception: 16th June 2008
The Fund’s primary objective is to have high capital appreciation through investment equities. To maintain liquidity, the Fund will invest in cash and money market instruments.
Unit Linked Equity Fund
2.132.402.513.113.934.887.107.97
12.00
24.33
29.64
0.00
5.00
10.00
15.00
20.00
25.00
30.00
35.00
Industry Sector Exposure
Programming and Broadcasting activities
Manufacture of tobacco products
Electricity, gas, steam and air conditioning supply
Manufacture of chemicals and chemical products
Civil engineering
Manufacture of other non-metallic mineral products
Manufacture of pharmaceuticals, medicinal chemical and botanical
Computer programming, consultancy and related activities
Manufacture of motor vehicles, trailers and semi-trailers
Financial and Insurance activities
Others
Equity Sector Exposure (%)
Risk Profile – HighAsset Allocation Pattern
Equity and Equity Related Instruments 60%-100%
Money Market 0%-40%
14.5%7.0%
22.5%4.7%
13.1%14.3%
12.8%8.5%
8.3%16.8%
9.3%
12.1%6.5%
18.5%3.9%
11.0%12.7%
11.6%7.8%
8.3%14.9%
8.2%
0.0% 5.0% 10.0% 15.0% 20.0% 25.0%
3 M6 M1 Yr2 Yr3 Yr4 Yr5 Yr6 Yr7 Yr8 Yr
Inception
Equity Benchmark
Equity
Fund Performance as on 31st March 2017
Equity Fund benchmark is Nifty 50Past performance is not indicative of future performance.The SFIN for Equity Fund is ULIF00116/06/08EQUITYFUND136.
PORTFOLIO AS ON 31st March 2017 %EQUITY 99.13Maruti Suzuki India LtdIndusInd Bank LtdR*Shares Bank BeESHDFC Bank LtdInfosys LtdYES Bank LtdTata Motors LtdLarsen & Tourbo LtdSun Pharmaceutical Industries LtdICICI Bank LtdKotak Mahindra Mutual Fund Banking PSU ETFHCL Technologies LtdBajaj Finance LtdGAIL (India) LtdITC LtdBosch LtdZee Entertainment Enterprises LtdIndian Oil Corporation LtdHero Motocorp LtdNestle India LtdUltratech Cement LtdSyngene International LtdIndraprastha Gas LtdBharat Petroleum Corp LtdAsian Paints Ltd jh;dkheptdk[pdkjCrompton Greaves Consumer Electricals LtdGlenmark Pharmaceuticals LtdAurobindo Pharma LtdJohnson Controls Hitachi Air Conditioning India LimitedLaurus Labs LtdTata Consultancy Services LtdCapital First LtdHindustan Unilever LtdBharat Electronics LtdManappuram Finance LtdEquitas Holdings LtdIDBI Bank LtdACC LtdThe Ramco Cements LtdAdani Ports & Special Economic Zone LtdIndian Hotels Co LtdMRF LtdJindal Steel & Power Ltd
5.775.054.664.484.354.204.063.933.843.583.082.612.542.512.402.172.131.921.891.881.851.821.811.661.521.241.111.111.101.031.021.010.990.980.980.980.970.960.940.860.810.800.74
INVESTMENT TRACKER MARCH 2017

5
Unit Linked Equity Fund
Hindalco Industries LtdDalmia Bharat LtdL&T Finance Holdings LtdGodrej Consumer Products LtdManganese Ore India LtdVedanta LtdPetronet LNG LtdBirla Corporation LtdBharat Forge LtdGreenply Industries LtdUnited Spirits LtdKajaria Ceramics LtdCL Educate LtdSRF Ltd
0.730.550.540.540.530.520.490.400.390.360.340.190.160.07
Debt and Others 0.87CBLO - 03APR2017Net Current Assets
0.90-0.04
TOTAL 100.00
INVESTMENT TRACKER MARCH 2017

6
The Fund’s primary objective is to have high capital appreciation through investment equities. To maintain liquidity, the Fund will invest in cash and money market instruments.
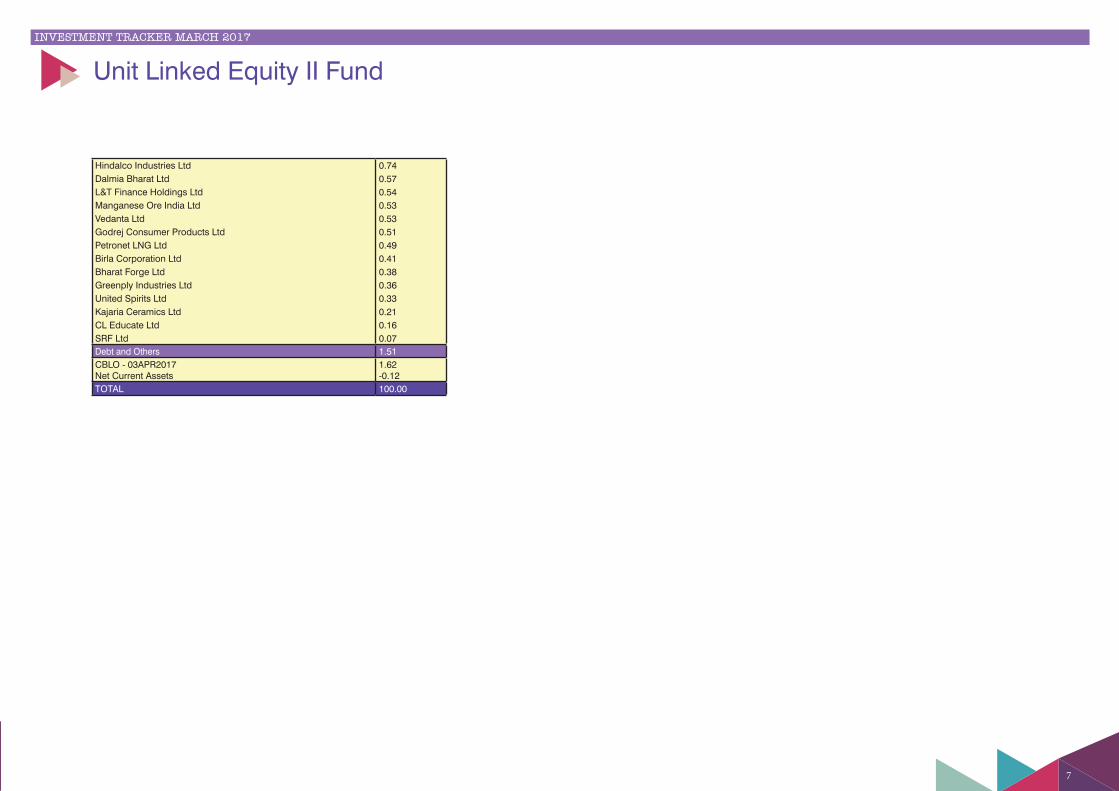
Unit Linked Equity II Fund
Benchmark: Nifty 50 NAV as on 31st March 2017: 17.9897Date of Inception: 7th January 2010
2.112.452.453.093.744.92
7.167.94
12.03
24.37
29.75
0.00
5.00
10.00
15.00
20.00
25.00
30.00
35.00
Industry Sector Exposure
Programming and Broadcasting activities
Electricity, gas, steam and air conditioning supply
Manufacture of tobacco products
Manufacture of chemicals and chemical products
Civil engineering
Manufacture of other non-metallic mineral products
Manufacture of pharmaceuticals, medicinal chemical and botanical
Computer programming, consultancy and related activities
Manufacture of motor vehicles, trailers and semi-trailers
Financial and Insurance activities
Others
Equity Sector Exposure (%)
Risk Profile – HighAsset Allocation Pattern
Equity and Equity Related Instruments 60%-100%Money Market 0%-40%
14.5%
7.1%
22.8%
5.1%
13.6%
14.7%
13.2%
8.9%
8.7%
8.5%
12.1%
6.5%
18.5%
3.9%
11.0%
12.7%
11.6%
7.8%
8.3%
8.0%
0.0% 5.0% 10.0% 15.0% 20.0% 25.0%
3 M
6 M
1 Yr
2 Yr
3 Yr
4 Yr
5 Yr
6 Yr
7 Yr
Inception
Equity II Benchmark
Equity II
Fund Performance as on 31st March 2017 PORTFOLIO AS ON 31st March 2017 %EQUITY 98.49Maruti Suzuki India LtdHDFC Bank LtdIndusInd Bank LtdInfosys LtdYES Bank LtdTata Motors LtdR*Shares Bank BeESSun Pharmaceutical Industries LtdLarsen & Tourbo LtdICICI Bank LtdKotak Mahindra Mutual Fund Banking PSU ETFHCL Technologies LtdBajaj Finance LtdITC LtdGAIL (India) LtdBosch LtdZee Entertainment Enterprises LtdSyngene International LtdIndian Oil Corporation LtdNestle India LtdHero Motocorp LtdUltratech Cement LtdIndraprastha Gas LtdBharat Petroleum Corp LtdAsian Paints LtdCrompton Greaves Consumer Electricals LtdJohnson Controls Hitachi Air Conditioning India LimitedGlenmark Pharmaceuticals LtdAurobindo Pharma LtdLaurus Labs LtdHindustan Unilever LtdTata Consultancy Services LtdIDBI Bank LtdManappuram Finance LtdCapital First LtdBharat Electronics LtdACC LtdEquitas Holdings LtdThe Ramco Cements LtdMRF LtdAdani Ports & Special Economic Zone LtdIndian Hotels Co LtdJindal Steel & Power Ltd
5.744.864.854.354.094.053.923.903.743.613.142.612.552.452.452.242.111.931.931.921.891.831.811.571.531.211.121.121.121.030.990.980.980.980.970.960.960.950.940.900.870.790.75
INVESTMENT TRACKER MARCH 2017
Equity Fund benchmark is Nifty 50Past performance is not indicative of future performance.The SFIN for Equity II Fund is ULIF00607/01/10EQUTYIIFND136.
7
Unit Linked Equity II Fund
Hindalco Industries LtdDalmia Bharat LtdL&T Finance Holdings LtdManganese Ore India LtdVedanta LtdGodrej Consumer Products LtdPetronet LNG LtdBirla Corporation LtdBharat Forge LtdGreenply Industries LtdUnited Spirits LtdKajaria Ceramics LtdCL Educate LtdSRF Ltd
0.740.570.540.530.530.510.490.410.380.360.330.210.160.07
Debt and Others 1.51CBLO - 03APR2017Net Current Assets
1.62-0.12
TOTAL 100.00
INVESTMENT TRACKER MARCH 2017

8
To generate capital appreciation in the long term through equity investments by investing in a diversified portfolio of Small Cap, Mid Cap and Large Cap Companies.
NAV as on 31st March 2017: 11.3055Date of Inception: 15th November 2016 Benchmark : CNX Nifty 100
Unit Linked India Multicap Fund
1.902.133.024.214.815.036.306.64
11.31
23.01
31.62
0.00
5.00
10.00
15.00
20.00
25.00
30.00
35.00
Industry Sector Exposure
Manufacture of tobacco productsElectricity, gas, steam and air conditioning supplyCivil engineeringManufacture of chemicals and chemical productsManufacture of pharmaceuticals, medicinal chemical and botanicalManufacture of other non-metallic mineral productsManufacture of machinery and equipment n.e.c.Computer programming, consultancy and related activitiesManufacture of motor vehicles, trailers and semi-trailersFinancial and Insurance activitiesOthers
Risk profile: High
Equity Sector Exposure (%)
Credit Rating ProfilePARTICULARS ULMEAAA & equivalent*AA & equivalent A & equivalent
100.00%0.00%0.00%
TOTAL 100.00
* Includes Government Securities, SDL,Tbill and CBLO
Asset Allocation PatternEquity and Equity Related Instruments 60% - 100%Money Market 0% - 40%
13.4%
13.1%
12.9%
14.1%
12.0% 12.5% 13.0% 13.5% 14.0% 14.5%
3 M
Inception
India Multicap Benchmark
India Multicap
EQUITY, 97.22%
OTHER NET CURRENT ASSETS, 2.78%
Asset Mix
Fund Performance as on 31st March 2017
All the rated income instruments are AAA/P1 + or equivalent.Past performance is not indicative of future performance.Modified Duration of Debt and Money Market.The SFIN for India Multi-Cap Equity Fund isSFIN: ULIF01816/08/16IMCAPEQFND136.
PORTFOLIO AS ON 31st March 2017 %Statement of Portfolio %Equity 97.22
Maruti Suzuki India LtdIndusInd Bank LtdYES Bank LtdICICI Bank LtdInfosys LtdKotak Banking ETFHDFC Bank LtdSubros LtdKotak Mahindra Mutual Fund Banking PSU ETFLarsen & Tourbo LtdTata Motors LtdBosch LtdBajaj Finance LtdUltratech Cement LtdGAIL (India) LtdHCL Technologies LtdSun Pharmaceutical Industries LtdJohnson Controls Hitachi Air Conditioning India LimitedITC LtdSheela Foam LtdZee Entertainment Enterprises LtdNestle India LtdHero Motocorp LtdIndian Oil Corporation LtdIndraprastha Gas LtdTeam Lease Services LtdEquitas Holdings LtdShree Pushkar Chemicals & Fertilizers LtdAsian Paints LtdBharat Petroleum Corp LtdDalmia Bharat LtdCL Educate LtdThe Ramco Cements LtdMRF LtdAurobindo Pharma LtdHindustan Unilever LtdBharat Electronics LtdIndian Hotels Co LtdJindal Steel & Power LtdGlenmark Pharmaceuticals LtdLaurus Labs LtdTimken India LtdTata Consultancy Services LtdManappuram Finance LtdIDBI Bank LtdHindalco Industries Ltd
5.994.814.714.133.803.593.573.523.093.022.742.592.422.282.131.991.971.921.901.901.891.811.751.741.591.521.501.441.341.321.321.281.241.081.041.031.030.970.950.910.890.860.860.800.740.66
INVESTMENT TRACKER MARCH 2017

9
Unit Linked India Multicap Fund
Adani Ports & Special Economic Zone LtdPetronet LNG LtdVedanta LtdSyngene International LtdSRF LtdGreenply Industries LtdSatin Creditcare Network LtdManganese Ore India LtdKajaria Ceramics Ltd
0.600.500.490.420.400.400.330.270.20
Debt and Others 2.78CBLO - 03APR2017Net Current Assets
7.91-5.13
TOTAL 100.00
INVESTMENT TRACKER MARCH 2017

10
Unit Linked Growth FundThe Fund invests in listed equities and high quality fixed income and money market instruments. The Fund intends to adopt relatively aggressive approach towards bonds and equities with the objective of achieving capital appreciation.
NAV as on 31st March 2017: 22.1306Date of Inception: 16th June 2008 Benchmark: Nifty 50 and CRISIL Composite Bond Fund Index
Asset Allocation PatternEquity and Equity Related Instruments 50%-90%Debt Securities 10%-50%Money Market 0%-40%
Risk Profile – Medium to High
1.661.912.012.863.783.845.525.62
10.06
23.01
39.72
0.00
5.00
10.00
15.00
20.00
25.00
30.00
35.00
40.00
45.00
Industry Sector Exposure
Programming and Broadcasting activitiesElectricity, gas, steam and air conditioning supplyManufacture of tobacco productsCivil engineeringManufacture of machinery and equipment n.e.c.Manufacture of other non-metallic mineral productsManufacture of pharmaceuticals, medicinal chemical and botanicalComputer programming, consultancy and related activitiesManufacture of motor vehicles, trailers and semi-trailersFinancial and Insurance activitiesOthers
Equity Sector Exposure (%)
Credit Rating ProfilePARTICULARS ULGAAA & equivalent*AA & equivalent A & equivalent
100.00%0.00%0.00%
TOTAL 100.00* Includes Government Securities, SDL,Tbill and CBLO
12.4%
6.7%
23.1%
6.6%
13.3%
13.8%
12.6%
9.1%
8.7%
15.6%
9.5%
9.7%
5.7%
16.7%
4.7%
10.7%
11.8%
10.9%
7.8%
8.1%
13.6%
8.1%
0.0% 5.0% 10.0% 15.0% 20.0% 25.0%
3 M6 M1 Yr2 Yr3 Yr4 Yr5 Yr6 Yr7 Yr8 Yr
Inception
Growth Benchmark
Growth
Fund Performance as on 31st March 2017 (%)
11.22%
35.67%53.11%
Debt Maturity profile
Up to 1 year
More than 1 year andupto 7 years
Above 7 years
Debt Maturity Profile
PORTFOLIO AS ON 31st March 2017 %Statement of Portfolio %Equity 82.75
Maruti Suzuki India LtdHDFC Bank LtdYES Bank LtdICICI Bank LtdIndusInd Bank LtdInfosys LtdSun Pharmaceutical Industries LtdLarsen & Tourbo LtdTata Motors LtdKotak Mahindra Mutual Fund Banking PSU ETFSubros LtdBajaj Finance LtdITC LtdBosch LtdGAIL (India) LtdZee Entertainment Enterprises LtdJohnson Controls Hitachi Air Conditioning India LimitedHCL Technologies LtdR*Shares Bank BeESNestle India LtdIndian Oil Corporation LtdHero Motocorp LtdUltratech Cement LtdSyngene International LtdIndraprastha Gas LtdBharat Petroleum Corp LtdAsian Paints LtdManappuram Finance LtdEquitas Holdings LtdMRF LtdIndian Hotels Co LtdAurobindo Pharma LtdTata Consultancy Services LtdLaurus Labs LtdIDBI Bank LtdGlenmark Pharmaceuticals LtdBharat Electronics LtdTeam Lease Services LtdThe Ramco Cements LtdCrompton Greaves Consumer Electricals LtdHindalco Industries LtdACC LtdJindal Steel & Power LtdDalmia Bharat LtdCapital First LtdL&T Finance Holdings Ltd
5.244.664.174.033.623.233.062.862.562.352.142.052.011.961.911.661.641.591.581.551.521.501.451.441.421.231.110.970.930.920.900.890.810.800.800.770.760.740.740.690.630.630.610.550.550.54
Growth Fund benchmark is 80% Nifty 50 and20% CRISIL Composite Bond Fund Index.Modified Duration of Debt and Money Market: 4.85Past performance is not indicative of future performance.The SFIN for Growth Fund is ULIF00216/06/08GROWTHFUND136.
INVESTMENT TRACKER MARCH 2017

11
Unit Linked Growth Fund
Adani Ports & Special Economic Zone LtdManganese Ore India LtdFortis Healthcare LtdGodrej Consumer Products LtdPetronet LNG LtdKotak Mahindra Bank LtdVedanta LtdBharat Forge LtdSatin Creditcare Network LtdBirla Corporation LtdTata Motors Ltd DVRGreenply Industries LtdCL Educate LtdKajaria Ceramics LtdSRF Ltd
0.530.430.430.420.400.390.370.310.310.310.310.300.270.160.06
Debt and Others 17.25
8.97% Govt. of India 6.35% Govt. of India CBLO - 03APR20179.23% Govt. of India9.75% Rural Electrification Corp. Ltd. 9.18% Power Fin Corp. Ltd. NCD 7.61% Govt. of India GSEC 8.17% Govt. of India 10.40% Reliance Ports & Terminals Ltd. NCD 9.00% Power Fin Corp. Ltd. NCD 8.30% Govt. of India 6.97% Govt. of India 7.06% Govt. of India GSEC 10.25% Reliance Gas Transport Infrastructure Ltd 7.80% Govt. of India 8.57% India Infradebt Ltd NCD 7.88% Govt. of India GSEC 8.35% Uttar Pradesh State Dev. Loan SPL 8.83% Govt. of India 8.7% Power Fin Corp. Ltd. NCD 8.30% Govt. of India Net Current Assets
2.772.721.891.300.990.840.740.720.670.670.660.620.590.330.310.260.190.190.190.130.030.44
Total 100.00
INVESTMENT TRACKER MARCH 2017

12
Unit Linked Growth II FundThe Fund invests in listed equities and high quality fixed income and money market instruments. The Fund intends to adopt relatively aggressive approach towards bonds and equities with the objective of achieving capital appreciation.
NAV as on 31st March 2017: 18.6371Date of Inception: 7th January 2010 Benchmark: Nifty 50 and CRISIL Composite Bond Fund Index
1.711.912.032.883.854.115.605.67
10.27
24.20
37.78
0.00
5.00
10.00
15.00
20.00
25.00
30.00
35.00
40.00
Industry Sector Exposure
Programming and Broadcasting activitiesElectricity, gas, steam and air conditioning supplyManufacture of tobacco productsCivil engineeringManufacture of other non-metallic mineral productsManufacture of machinery and equipment n.e.c.Manufacture of pharmaceuticals, medicinal chemical and botanicalComputer programming, consultancy and related activitiesManufacture of motor vehicles, trailers and semi-trailersFinancial and Insurance activitiesOthers
Risk Profile – Medium to HighAsset Allocation Pattern
Equity and Equity Related Instruments 50% - 90%Debt Securities 10% - 50%Money Market 0% - 40%
Equity Sector Exposure (%)
Credit Rating ProfilePARTICULARS ULG-IIAAA & equivalent*AA & equivalent A & equivalent
100.00%0.00%0.00%
TOTAL 100.00
* Includes Government Securities, SDL,Tbill and CBLO
12.5%
6.9%
23.5%
6.9%
13.7%
14.1%
12.9%
9.4%
9.1%
9.0%
9.7%
5.8%
16.8%
4.8%
10.8%
11.8%
11.0%
7.9%
8.2%
7.9%
0.0% 5.0% 10.0% 15.0% 20.0% 25.0%
3 M
6 M
1 Yr
2 Yr
3 Yr
4 Yr
5 Yr
6 Yr
7 Yr
Inception
Growth II Benchmark
Growth II
Fund Performance as on 31st March 2017 (%)
Growth Fund benchmark is 80% Nifty 50 and20% CRISIL Composite Bond Fund Index.Modified Duration of Debt and Money Market: 4.83Past performance is not indicative of future performance.The SFIN for Growth II Fund is ULIF00707/01/10GROWTIIFND136.
23.02%
13.29%63.69%
Debt Maturity profile
Up to 1 year
More than 1 year andupto 7 years
Above 7 years
Debt Maturity Profile
PORTFOLIO AS ON 31st March 2017 %Statement of Portfolio %Equity 83.81
Maruti Suzuki India LtdHDFC Bank LtdYES Bank LtdICICI Bank LtdIndusInd Bank LtdInfosys LtdSun Pharmaceutical Industries LtdLarsen & Tourbo LtdTata Motors LtdSubros LtdKotak Mahindra Mutual Fund Banking PSU ETFBajaj Finance LtdITC LtdBosch LtdGAIL (India) LtdZee Entertainment Enterprises LtdJohnson Controls Hitachi Air Conditioning India LimitedHCL Technologies LtdNestle India LtdHero Motocorp LtdIndian Oil Corporation LtdR*Shares Bank BeESSyngene International LtdUltratech Cement LtdIndraprastha Gas LtdBharat Petroleum Corp LtdAsian Paints LtdManappuram Finance LtdEquitas Holdings LtdMRF LtdIndian Hotels Co LtdAurobindo Pharma LtdTata Consultancy Services LtdIDBI Bank LtdLaurus Labs LtdGlenmark Pharmaceuticals LtdBharat Electronics LtdThe Ramco Cements LtdTeam Lease Services LtdCrompton Greaves Consumer Electricals LtdHindalco Industries LtdACC LtdJindal Steel & Power LtdDalmia Bharat LtdCapital First LtdAdani Ports & Special Economic Zone Ltd
5.284.464.204.193.973.273.112.882.712.472.332.062.031.971.911.711.641.591.561.511.511.461.451.431.421.221.110.990.960.930.900.900.810.800.800.780.770.750.730.690.640.630.600.560.560.55
INVESTMENT TRACKER MARCH 2017

13
Unit Linked Growth II Fund
L&T Finance Holdings LtdManganese Ore India LtdFortis Healthcare LtdGodrej Consumer Products LtdKotak Mahindra Bank LtdPetronet LNG LtdVedanta LtdBirla Corporation LtdBharat Forge LtdSatin Creditcare Network LtdTata Motors Ltd DVRCL Educate LtdGreenply Industries LtdKajaria Ceramics LtdSRF Ltd
0.540.430.430.410.410.400.370.310.310.310.310.270.270.170.06
Debt and Others 16.19
8.30% Govt. of India CBLO - 03APR20179.00% Power Fin Corp. Ltd. NCD 6.97% Govt. of India 6.35% Govt. of India 7.61% Govt. of India GSEC 9.50% Bajaj Finance Ltd. NCD 8.26% Govt. of India7.06% Govt. of India GSEC 9.23% Govt. of India 10.25% Reliance Gas Transport Infrastructure Ltd 8.24% Govt. of India GSEC 8.385% IDFC Infra Finance Ltd NCD8.17% Govt. of India 8.70% Great Eastern Shipping Co Ltd NCD 10.40% Reliance Ports & Terminals Ltd. NCD 8.57% India Infradebt Ltd NCD 8.35% Uttar Pradesh State Dev. Loan SPL 6.90% Govt. of India Oil Bond 8.7% Power Fin Corp. Ltd. NCD 8.13% Govt. of India Net Current Assets
3.222.911.781.050.990.830.750.660.570.440.410.400.380.360.320.240.240.150.110.080.010.31
Total 100.00
INVESTMENT TRACKER MARCH 2017

14
Unit Linked Growth Plus FundThe Fund invests in listed equities and high quality fixed income and money market instruments. The Fund intends to adopt relatively aggressive approach towards bonds and equities with the objective of achieving capital appreciation.
NAV as on 31st March 2017: 16.0037Date of Inception: 13th September 2010 Benchmark: Nifty 50 and CRISIL Composite Bond Fund Index
Risk Profile – Medium to HighAsset Allocation Pattern
Equity and Equity Related Instruments 50% - 90%Debt Securities 10% - 50%Money Market 0% - 40%
1.641.862.012.803.593.785.525.57
9.95
23.86
39.42
0.00
5.00
10.00
15.00
20.00
25.00
30.00
35.00
40.00
45.00
Industry Sector Exposure
Programming and Broadcasting activities
Electricity, gas, steam and air conditioning supply
Manufacture of tobacco products
Civil engineering
Manufacture of machinery and equipment n.e.c.
Manufacture of other non-metallic mineral products
Computer programming, consultancy and related activities
Manufacture of pharmaceuticals, medicinal chemical and botanical
Manufacture of motor vehicles, trailers and semi-trailers
Financial and Insurance activities
Others
Equity Sector Exposure (%)
Credit Rating ProfilePARTICULARS ULGPLUSAAA & equivalent*AA & equivalent A & equivalent
100.00%0.00%0.00%
TOTAL 100.00
* Includes Government Securities, SDL,Tbill and CBLO
12.2%
6.6%
22.9%
6.7%
13.5%
13.9%
12.8%
9.3%
7.4%
9.7%
5.7%
16.7%
4.8%
10.7%
11.8%
10.9%
7.9%
7.5%
0.0% 10.0% 20.0% 30.0%
3 M
6 M
1 Yr
2 Yr
3 Yr
4 Yr
5 Yr
6 Yr
Inception
Growth Plus Benchmark
Growth Plus
Fund Performance as on 31st March 2017 (%)
Growth Fund benchmark is 80% Nifty 50 and20% CRISIL Composite Bond Fund Index.Modified Duration of Debt and Money Market: 4.82Past performance is not indicative of future performance.The SFIN for Growth Plus Fund is ULIF00913/09/10GROWTPLFND136
18.68%
34.98%
46.34%
Up to 1 year
More than 1 year andupto 7 years
Above 7 years
Debt Maturity Profile
PORTFOLIO AS ON 31st March 2017 %Statement of Portfolio %Equity 81.95
Maruti Suzuki India LtdHDFC Bank LtdICICI Bank LtdYES Bank LtdIndusInd Bank LtdInfosys LtdSun Pharmaceutical Industries LtdLarsen & Tourbo LtdTata Motors LtdKotak Mahindra Mutual Fund Banking PSU ETFBajaj Finance LtdSubros LtdITC LtdBosch LtdGAIL (India) LtdZee Entertainment Enterprises LtdJohnson Controls Hitachi Air Conditioning India LimitedHCL Technologies LtdIndian Oil Corporation LtdNestle India LtdHero Motocorp LtdSyngene International LtdIndraprastha Gas LtdUltratech Cement LtdR*Shares Bank BeESBharat Petroleum Corp LtdAsian Paints LtdManappuram Finance LtdEquitas Holdings LtdMRF LtdIndian Hotels Co LtdAurobindo Pharma LtdLaurus Labs LtdGlenmark Pharmaceuticals LtdIDBI Bank LtdTata Consultancy Services LtdBharat Electronics LtdThe Ramco Cements LtdTeam Lease Services LtdCrompton Greaves Consumer Electricals LtdHindalco Industries LtdACC LtdJindal Steel & Power LtdDalmia Bharat LtdCapital First LtdL&T Finance Holdings Ltd
5.204.494.174.133.943.203.112.802.512.422.032.022.011.961.861.641.571.551.521.511.491.481.431.431.311.181.080.990.960.910.880.870.800.780.770.760.760.740.690.650.640.600.600.550.530.52
INVESTMENT TRACKER MARCH 2017

15
Unit Linked Growth Plus Fund
Adani Ports & Special Economic Zone LtdManganese Ore India LtdFortis Healthcare LtdKotak Mahindra Bank LtdPetronet LNG LtdGodrej Consumer Products LtdVedanta LtdSatin Creditcare Network LtdBharat Forge LtdBirla Corporation LtdTata Motors Ltd DVRGreenply Industries LtdCL Educate LtdKajaria Ceramics LtdSRF Ltd
0.510.430.430.410.400.380.370.300.300.300.280.270.270.170.06
Debt and Others 18.05
CBLO - 03APR20176.35% Govt. of India 9.23% Govt. of India 8.83% Govt. of India 7.61% Govt. of India GSEC 8.30% Govt. of India8.17% Govt. of India 9.24% LIC Housing Fin. Ltd. NCD 7.06% Govt. of India GSEC 9.00% Power Fin Corp. Ltd. NCD 8.97% Govt. of India 7.80% Govt. of India 6.84% Govt. of India GSEC 8.60% IDFC Infra Finance Ltd NCD7.80% Govt. of India 8.08% Tata Sons Ltd. NCD 9.50% Bajaj Finance Ltd. NCD 6.97% Govt. of India 10.40% Reliance Ports & Terminals Ltd. NCD 10.25% Reliance Gas Transport Infrastructure Ltd 8.57% India Infradebt Ltd NCD 7.73% Govt. of India GSEC 7.16% Govt. of India 9.75% Rural Electrification Corp. Ltd. 9.61% Power Fin Corp. Ltd. NCD 9.18% Tata Sons Ltd. NCD 8.35% Uttar Pradesh State Dev. Loan SPL 6.90% Govt. of India Oil Bond Net Current Assets
3.042.501.861.511.471.010.710.580.560.550.550.550.370.280.270.270.270.270.200.150.140.140.130.120.060.060.050.030.35
Total 100.00
INVESTMENT TRACKER MARCH 2017

16
Unit Linked Balanced FundThe Fund adopts a relatively balanced approach towards bonds and equities exposure with the objective of achieving capital appreciation with minimal short-term performance volatility.
NAV as on 31st March 2017: 22.5880Date of Inception: 16th June 2008 Benchmark: Nifty 50 and CRISIL Composite Bond Fund Index
Risk Profile – MediumAsset Allocation Pattern
Equity and Equity Related Instruments 30% - 70%Debt Securities 30% - 70%Money Market 0% - 40%
1.191.271.581.701.912.573.624.066.43
21.80
53.86
0.00
10.00
20.00
30.00
40.00
50.00
60.00
Industry Sector Exposure
Manufacture of tobacco productsElectricity, gas, steam and air conditioning supplyManufacture of machinery and equipment n.e.c.Manufacture of chemicals and chemical productsCivil engineeringManufacture of other non-metallic mineral productsManufacture of pharmaceuticals, medicinal chemical and botanicalComputer programming, consultancy and related activitiesManufacture of motor vehicles, trailers and semi-trailersFinancial and Insurance activitiesOthers
Equity Sector Exposure (%)
Credit Rating ProfilePARTICULARS ULBAAA & equivalent*AA & equivalentA & equivalent
99.47%0.53%0.00%
TOTAL 100.00
* Includes Government Securities, SDL,Tbill and CBLO
Balanced Fund benchmark is 50% Nifty 50 and50% CRISIL Customized Bond Fund Index.Modified Duration of Debt and Money Market: 5.10Past performance is not indicative of future performance.The SFIN for Balanced Fund is ULIF00316/06/08BLNCEDFUND136.
7.4%
4.3%
17.1%
6.8%
12.3%
11.8%
11.1%
8.9%
8.5%
12.8%
9.7%
6.2%
4.6%
14.0%
6.0%
10.3%
10.4%
9.9%
8.0%
8.0%
11.6%
7.9%
0.0% 5.0% 10.0% 15.0% 20.0%
3 M6 M1 Yr2 Yr3 Yr4 Yr5 Yr6 Yr7 Yr8 Yr
In…
Balanced Benchmark
Balanced
Fund Performance as on 31st March 2017 (%)
7.4%
4.2%
16.5%
6.5%
12.0%
11.4%
10.9%
8.7%
7.6%
6.2%
4.5%
14.0%
6.0%
10.3%
10.4%
9.9%
7.9%
7.6%
0.0% 5.0% 10.0% 15.0% 20.0%
3 M
6 M
1 Yr
2 Yr
3 Yr
4 Yr
5 Yr
6 Yr
InceptionBalanced Plus
Benchmark
Balanced Plus
14.4%
37.3%
48.3%
Up to 1 year
More than 1 year andupto 7 years
Above 7 years
Debt Maturity Profile
PORTFOLIO AS ON 31st March 2017 %Statement of Portfolio %Equity 54.53
Maruti Suzuki India LtdICICI Bank LtdHDFC Bank LtdYES Bank LtdIndusInd Bank LtdInfosys LtdTata Motors LtdSun Pharmaceutical Industries LtdLarsen & Tourbo LtdHCL Technologies LtdBajaj Finance LtdGAIL (India) LtdBosch LtdITC LtdSyngene International LtdZee Entertainment Enterprises LtdState Bank of IndiaHero Motocorp LtdIndian Oil Corporation LtdNestle India LtdJohnson Controls Hitachi Air Conditioning India LimitedUltratech Cement LtdIndraprastha Gas LtdBharat Petroleum Corp LtdAsian Paints LtdManappuram Finance LtdTeam Lease Services LtdCrompton Greaves Consumer Electricals LtdEquitas Holdings LtdCapital First LtdSubros LtdIDBI Bank LtdAurobindo Pharma LtdGlenmark Pharmaceuticals LtdTata Consultancy Services LtdHindustan Unilever LtdLaurus Labs LtdBharat Electronics LtdFortis Healthcare LtdAdani Ports & Special Economic Zone LtdMRF LtdACC LtdThe Ramco Cements LtdL&T Finance Holdings LtdHindalco Industries Ltd
2.952.852.852.692.632.192.081.911.911.341.281.271.191.191.101.061.010.970.970.970.940.940.890.860.840.790.780.730.700.690.640.630.600.580.530.530.530.490.480.480.480.470.470.460.45
INVESTMENT TRACKER MARCH 2017

17
Unit Linked Balanced Fund
Indian Hotels Co LtdSatin Creditcare Network LtdManganese Ore India LtdJindal Steel & Power LtdDalmia Bharat LtdGodrej Consumer Products LtdCL Educate LtdVedanta LtdPetronet LNG LtdBirla Corporation LtdTata Motors Ltd DVRBharat Forge LtdGreenply Industries LtdUnited Spirits LtdKajaria Ceramics LtdSRF Ltd
0.400.400.390.370.360.290.270.260.250.230.210.200.180.180.100.04
Debt and Others 45.47
9.00% Power Fin Corp. Ltd. NCD 8.83% Govt. of India 9.23% Govt. of India 8.30% Govt. of India CBLO - 03APR20176.35% Govt. of India 6.84% Govt. of India GSEC 9.75% Rural Electrification Corp. Ltd.9.18% Tata Sons Ltd. NCD 8.83% Govt. of India 10.10% HDB Financial Services Ltd. NCD 10.40% Reliance Ports & Terminals Ltd. NCD 10.25% Reliance Gas Transport Infrastructure Ltd 9.24% LIC Housing Fin. Ltd. NCD 7.06% Govt. of India GSEC 8.68% National Cap Reg Plan NCD 8.27% Govt. of India 9.36% Power Fin Corp. Ltd. NCD 7.80% Govt. of India 8.35% Uttar Pradesh State Dev. Loan SPL 8.24% Govt. of India GSEC 9.50% Bajaj Finance Ltd. NCD 9.75% IL&FS Financial Services Ltd NCD 9.61% Power Fin Corp. Ltd. NCD 9.45% Bajaj Finance Ltd. NCD 9.09% Indian Railways Fin. Corp. NCD 8.57% India Infradebt Ltd NCD 8.97% Tata Sons Ltd NCD 7.80% Govt. of India 8.70% Great Eastern Shipping Co Ltd NCD
6.524.253.833.342.882.522.492.211.941.921.841.561.551.231.100.910.590.480.440.350.300.290.280.240.240.160.150.150.150.12
9.80% LIC Housing Fin. Ltd. NCD 8.39% Andhra Pradesh State Dev. Loan 6.90% Govt. of India Oil Bond 10% ICICI Bank Ltd. NCD 8.30% Govt. of India 8.13% Govt. of India Net Current Assets
0.110.090.080.080.030.031.03
Total 100.00
INVESTMENT TRACKER MARCH 2017

18
7.4%
4.5%
17.5%
7.1%
12.5%
12.0%
11.4%
9.1%
8.7%
8.6%
6.3%
4.6%
14.1%
6.1%
10.4%
10.5%
10.0%
8.0%
8.0%
7.8%
0.0% 5.0% 10.0% 15.0% 20.0%
3 M
6 M
1 Yr
2 Yr
3 Yr
4 Yr
5 Yr
6 Yr
7 Yr
Inc…
Balanced II Benchmark
Balanced II
7.4%
4.2%
16.5%
6.5%
12.0%
11.4%
10.9%
8.7%
7.6%
6.2%
4.5%
14.0%
6.0%
10.3%
10.4%
9.9%
7.9%
7.6%
0.0% 5.0% 10.0% 15.0% 20.0%
3 M
6 M
1 Yr
2 Yr
3 Yr
4 Yr
5 Yr
6 Yr
InceptionBalanced Plus
Benchmark
Balanced Plus
Unit Linked Balanced II FundThe Fund adopts a relatively balanced approach towards bonds and equities exposure with the objective of achieving capital appreciation with minimal short-term performance volatility.
NAV as on 31st March 2017: 18.1532Date of Inception: 7th January 2010 Benchmark: Nifty 50 and CRISIL Composite Bond Fund Index
Risk Profile – MediumAsset Allocation Pattern
Equity and Equity Related Instruments 30% - 70%Debt Securities 30% - 70%Money Market 0% - 40%
1.241.431.541.721.892.583.674.056.47
19.22
56.19
0.00
10.00
20.00
30.00
40.00
50.00
60.00
Industry Sector Exposure
Electricity, gas, steam and air conditioning supplyWater TransportManufacture of machinery and equipment n.e.c.Manufacture of chemicals and chemical productsCivil engineeringManufacture of other non-metallic mineral productsManufacture of pharmaceuticals, medicinal chemical and botanicalComputer programming, consultancy and related activitiesManufacture of motor vehicles, trailers and semi-trailersFinancial and Insurance activitiesOthers
Equity Sector Exposure (%)
Credit Rating ProfilePARTICULARS ULB-IIAAA & equivalent*AA & equivalent A & equivalent
100.00%0.00%0.00%
TOTAL 100.00
* Includes Government Securities, SDL,Tbill and CBLO
Fund Performance as on 31st March 2017 (%)
Balanced Fund benchmark is 50% Nifty 50 and50% CRISIL Customized Bond Index.Modified Duration of Debt and Money Market: 4.89Past performance is not Indicative of future performance.The SFIN for Balanced II Fund is ULIF00807/01/10BLNCDIIFND136.
12.6%
38.0%
49.4%
Debt Maturity profile
Up to 1 year
More than 1 year andupto 7 years
Above 7 years
Debt Maturity Profile
PORTFOLIO AS ON 31st March 2017 %Statement of Portfolio %Equity 54.75
Maruti Suzuki India LtdHDFC Bank LtdICICI Bank LtdYES Bank LtdIndusInd Bank LtdInfosys LtdTata Motors LtdSun Pharmaceutical Industries LtdLarsen & Tourbo LtdHCL Technologies LtdBajaj Finance LtdGAIL (India) LtdITC LtdBosch LtdZee Entertainment Enterprises LtdState Bank of IndiaSyngene International LtdHero Motocorp LtdIndian Oil Corporation LtdNestle India LtdUltratech Cement LtdJohnson Controls Hitachi Air Conditioning India LimitedIndraprastha Gas LtdAsian Paints LtdBharat Petroleum Corp LtdManappuram Finance LtdTeam Lease Services LtdIDBI Bank LtdEquitas Holdings LtdCrompton Greaves Consumer Electricals LtdCapital First LtdSubros LtdAurobindo Pharma LtdGlenmark Pharmaceuticals LtdLaurus Labs LtdHindustan Unilever LtdTata Consultancy Services LtdIndian Hotels Co LtdBharat Electronics LtdAdani Ports & Special Economic Zone LtdThe Ramco Cements LtdMRF LtdFortis Healthcare LtdHindalco Industries LtdL&T Finance Holdings LtdACC Ltd
2.972.882.882.712.702.172.081.931.891.351.271.241.221.211.051.011.000.980.970.960.950.920.900.850.820.790.760.720.710.700.690.630.600.600.530.530.530.510.500.490.480.480.470.470.460.45
INVESTMENT TRACKER MARCH 2017

19
Unit Linked Balanced II Fund
Satin Creditcare Network LtdManganese Ore India LtdJindal Steel & Power LtdDalmia Bharat LtdGodrej Consumer Products LtdCL Educate LtdVedanta LtdPetronet LNG LtdBirla Corporation LtdTata Motors Ltd DVRBharat Forge LtdUnited Spirits LtdGreenply Industries LtdKajaria Ceramics LtdSRF Ltd
0.400.390.380.360.290.270.260.250.230.200.190.180.180.100.04
Debt and Others 45.25
8.30% Govt. of India 9.00% Power Fin Corp. Ltd. NCD CBLO - 03APR20176.84% Govt. of India GSEC 8.97% Govt. of India 9.24% LIC Housing Fin. Ltd. NCD 8.70% Great Eastern Shipping Co Ltd NCD 8.15% Govt. of India10.40% Reliance Ports & Terminals Ltd. NCD 8.7% Power Fin Corp. Ltd. NCD 6.35% Govt. of India 7.80% Govt. of India 9.09% Indian Railways Fin. Corp. NCD 9.23% Govt. of India 10.10% HDB Financial Services Ltd. NCD 10.25% Reliance Gas Transport Infrastructure Ltd 9.02% Rural Electrification Corporation Ltd 9.18% Power Fin Corp. Ltd. NCD 8.08% Govt. of India 9.75% Rural Electrification Corp. Ltd. 8.83% Indian Railways Fin. Corp. NCD 8.27% Govt. of India 8.385% IDFC Infra Finance Ltd NCD7.80% Govt. of India 8.26% Govt. of India 9.61% Power Fin Corp. Ltd. NCD 8.68% National Cap Reg Plan NCD 9.45% LIC Housing Finance Ltd NCD 9.36% Power Fin Corp. Ltd. NCD 8.35% Uttar Pradesh State Dev. Loan SPL 9.50% Bajaj Finance Ltd. NCD 9.75% IL&FS Financial Services Ltd NCD
8.013.483.432.932.281.461.431.431.421.311.271.251.191.181.081.030.860.850.850.700.680.580.560.550.540.520.490.430.340.280.270.27
9.18% Tata Sons Ltd. NCD 7.16% Govt. of India 8.57% India Infradebt Ltd NCD 8.97% Tata Sons Ltd NCD 6.90% Govt. of India Oil Bond 6.97% Govt. of India 8.83% Govt. of India 8.13% Govt. of India 8.30% Govt. of India Net Current Assets
0.230.200.140.140.120.110.080.040.031.18
Total 100.00
INVESTMENT TRACKER MARCH 2017

20
1.161.171.201.661.772.523.763.926.17
17.96
58.71
0.00
10.00
20.00
30.00
40.00
50.00
60.00
70.00Industry Sector Exposure
Manufacture of electrical equipment
Manufacture of tobacco products
Electricity, gas, steam and air conditioning supply
Manufacture of chemicals and chemical products
Civil engineering
Manufacture of other non-metallic mineral products
Manufacture of pharmaceuticals, medicinal chemical and botanical
Computer programming, consultancy and related activities
Manufacture of motor vehicles, trailers and semi-trailers
Financial and Insurance activities
Others
The Fund adopts a relatively balanced approach towards bonds and equities exposure with the objective of achieving capital appreciation with minimal short-term performance volatility.
NAV as on 31st March 2017: 16.1249Date of Inception: 13th September 2010 Benchmark: Nifty 50 and CRISIL Composite Bond Fund Index
Unit Linked Balanced Plus Fund
Risk Profile – MediumAsset Allocation Pattern
Equity and Equity Related Instruments 30% - 70%Debt Securities 30% - 70%Money Market 0% - 40%
Equity Sector Exposure (%)
Credit Rating ProfilePARTICULARS ULBPLUSAAA & equivalent*AA & equivalent A & equivalent
100.00%0.00%0.00%
TOTAL 100.00
* Includes Government Securities, SDL,Tbill and CBLO
Balanced Fund benchmark is 50% Nifty 50 and50% CRISIL Customized Bond Index.Modified Duration of Debt and Money Market: 4.83Past performance is not Indicative of future performance.The SFIN for Balanced Plus Fund is ULIF01013/09/10BLNCDPLFND136
7.4%
4.2%
16.5%
6.5%
12.0%
11.4%
10.9%
8.7%
7.6%
6.2%
4.5%
14.0%
6.0%
10.3%
10.4%
9.9%
7.9%
7.6%
0.0% 5.0% 10.0% 15.0% 20.0%
3 M
6 M
1 Yr
2 Yr
3 Yr
4 Yr
5 Yr
6 Yr
Inception
Balanced Plus Benchmark
Balanced Plus
Fund Performance as on 31st March 2017 (%)
Debt Maturity Profile
11.09%
45.92%
42.98%
Up to 1 year
More than 1 year andupto 7 years
Above 7 years
PORTFOLIO AS ON 31st March 2017 %Statement of Portfolio %Equity 52.67
Maruti Suzuki India LtdICICI Bank LtdHDFC Bank LtdYES Bank LtdIndusInd Bank LtdInfosys LtdTata Motors LtdSun Pharmaceutical Industries LtdLarsen & Tourbo LtdHCL Technologies LtdBajaj Finance LtdGAIL (India) LtdBosch LtdITC LtdCrompton Greaves Consumer Electricals LtdZee Entertainment Enterprises LtdState Bank of IndiaSyngene International LtdIndian Oil Corporation LtdNestle India LtdHero Motocorp LtdUltratech Cement LtdIndraprastha Gas LtdJohnson Controls Hitachi Air Conditioning India LimitedAsian Paints LtdManappuram Finance LtdBharat Petroleum Corp LtdEquitas Holdings LtdTeam Lease Services LtdCapital First LtdIDBI Bank LtdGlenmark Pharmaceuticals LtdAurobindo Pharma LtdIndian Hotels Co LtdL&T Finance Holdings LtdHindustan Unilever LtdLaurus Labs LtdTata Consultancy Services LtdBharat Electronics LtdMRF LtdAdani Ports & Special Economic Zone LtdACC LtdThe Ramco Cements LtdHindalco Industries LtdFortis Healthcare LtdSatin Creditcare Network Ltd
2.832.822.802.582.562.151.991.921.771.291.221.201.181.171.161.031.011.000.940.940.930.930.890.870.820.780.770.690.680.660.620.580.580.540.530.510.500.480.470.470.470.460.460.450.430.39
INVESTMENT TRACKER MARCH 2017

21
Unit Linked Balanced Plus Fund
Manganese Ore India LtdJindal Steel & Power LtdDalmia Bharat LtdPetronet LNG LtdGodrej Consumer Products LtdVedanta LtdBirla Corporation LtdBharat Forge LtdGreenply Industries LtdTata Motors Ltd DVRUnited Spirits LtdCL Educate LtdKajaria Ceramics LtdSRF Ltd
0.370.370.350.300.290.260.220.180.180.180.170.150.120.04
Debt and Others 39.90
6.35% Govt. of India CBLO - 03APR20177.61% Govt. of India GSEC 9.23% Govt. of India 8.83% Govt. of India 7.80% Govt. of India 8.27% Govt. of India 10.40% Reliance Ports & Terminals Ltd. NCD 7.16% Govt. of India 8.17% Govt. of India 9.24% LIC Housing Fin. Ltd. NCD 8.83% Indian Railways Fin. Corp. NCD 7.06% Govt. of India GSEC 8.15% Govt. of India 6.84% Govt. of India GSEC 9.09% Indian Railways Fin. Corp. NCD 7.88% Govt. of India GSEC 7.80% Govt. of India 9.00% Power Fin Corp. Ltd. NCD 8.97% Govt. of India 8.08% Tata Sons Ltd. NCD 8.30% Govt. of India 6.97% Govt. of India 8.94% Power Fin Corp. Ltd. NCD8.89% LIC Housing Fin. Ltd. NCD 10.25% Reliance Gas Transport Infrastructure Ltd 7.72% Govt. of India GSEC 9.02% Rural Electrification Corporation Ltd 7.72% Govt. of India GSEC 7.73% Govt. of India GSEC
5.633.953.353.092.281.981.971.931.661.301.191.121.121.111.090.990.900.890.860.760.710.710.660.630.610.510.450.370.360.30
9.25% Rural Electrification Corporation Ltd 8.13% Govt. of India 8.51% India Infradebt Ltd NCD 10.10% HDB Financial Services Ltd. NCD 9.75% Rural Electrification Corp. Ltd. 9.25% Reliance Jio Infocomm Limited NCD 8.385% IDFC Infra Finance Ltd NCD8.10% India Infradebt Ltd NCD Piramal Enterprises Ltd CP 8.70% Great Eastern Shipping Co Ltd NCD 8.35% Uttar Pradesh State Dev. Loan SPL 8.28% Govt. of India 8.39% Andhra Pradesh State Dev. Loan 8.57% India Infradebt Ltd NCD 9.18% Tata Sons Ltd. NCD 8.60% IDFC Infra Finance Ltd NCD8.80% Can Fin Homes Ltd. NCDL&T Infrastructure Finance Co Ltd CP 8.26% Govt. of India 8.30% Govt. of India HDFC CP8.51% Andhra Pradesh State Dev. Loan 9.75% IL&FS Financial Services Ltd NCD 9.27% Power Finance Corp. Ltd. NCD L&T Finance Co Ltd CP 9.61% Power Fin Corp. Ltd. NCD 8.97% Tata Sons Ltd NCD 6.90% Govt. of India Oil Bond 9.36% Power Fin Corp. Ltd. NCD 8.95% Housing Dev. Fin. Corp. Ltd. NCD 8.83% Govt. of India Net Current Assets
0.290.270.250.230.220.200.180.180.170.170.140.140.140.120.120.120.120.110.090.090.090.080.060.060.060.030.030.030.010.010.011.03
Total 100.00
INVESTMENT TRACKER MARCH 2017

22
The Fund invests in a portfolio of high quality bonds and other fixed and floating rate securities issued by the Government, Government agencies and corporate issuers, To maintain liquidity, the Funds invests in the money market instruments.
NAV as on 31st March 2017: 21.5895Date of Inception: 9th July 2008 Benchmark: CRISIL Composite Bond Fund Index
Unit Linked Debt Fund
Risk Profile – Low to MediumAsset Allocation Pattern
Debt Securities 60% - 100%Money Market 0% - 40%
Credit Rating ProfilePARTICULARS ULDAAA & equivalent*AA & equivalent A & equivalent
95.60%4.40%0.00%
TOTAL 100.00
* Includes Government Securities, SDL,Tbill and CBLO
GOVERNMENT SECURITIES,
32.87%
CORPORATE DEBT, 63%
OTHER NET CURRENT ASSETS, 4.44%
Asset Mix
0.2%
2.1%
11.2%
9.1%
11.1%
8.8%
9.2%
8.9%
8.3%
8.1%
9.2%
0.5%
2.8%
9.8%
8.4%
10.0%
8.3%
8.5%
8.3%
7.9%
7.6%
8.0%
0.0% 2.0% 4.0% 6.0% 8.0% 10.0% 12.0%
3 M6 M1 Yr2 Yr3 Yr4 Yr5 Yr6 Yr7 Yr8 Yr
Inception
Debt Benchmark
Debt
Fund Performance as on 31st March 2017 (%)
Debt Fund benchmark is CRISIL Customized Bond Fund Index.
Modified Duration of Debt and Money Market: 5.10Past Performance is not indicative of Future performance.The SFIN for Debt Fund is ULIF00409/07/08INDEBTFUND136.
The SFIN for Debt Fund is ULIF00409/07/08INDEBTFUND136.
12.59%
33.38%54.02%
Up to 1 year
More than 1 year andupto 7 years
Above 7 years
Debt Maturity Profile
PORTFOLIO AS ON 31st March 2017 %Statement of Portfolio %Debt and Others 100.00
9.23% Govt. of India 8.70% Great Eastern Shipping Co Ltd NCD 9.25% Reliance Jio Infocomm Limited NCD 6.35% Govt. of India 8.83% Govt. of India 10.25% Reliance Gas Transport Infrastructure Ltd 7.9% Reliance Ports & Terminals Ltd. NCD 7.06% Govt. of India GSEC 10.10% HDB Financial Services Ltd. NCD 8.51% India Infradebt Ltd NCD 8.9% Reliance Capital Ltd. NCD 9.68% IL & FS Ltd NCD 8.97% Tata Sons Ltd NCD 6.84% Govt. of India GSEC 8.04% Tata Sons Ltd. NCD 7.9% Housing Dev. Fin. Corp. Ltd. NCD 8.385% IDFC Infra Finance Ltd NCD9.75% IL&FS Financial Services Ltd NCD 8.24% Govt. of India 9.50% Bajaj Finance Ltd. NCD 7.80% Govt. of India 8.79% Indian Railways Fin. Corp. NCD 8.32% Housing Dev. Fin. Corp. Ltd. NCD 8.26% Govt. of India 9.3% Housing Dev. Fin. Corp. Ltd. NCD 7.88% Govt. of India GSEC 8.51% Andhra Pradesh State Dev. Loan 9.45% LIC Housing Finance Ltd NCD 8.10% India Infradebt Ltd NCD 8.25% IDFC Infra Finance Ltd NCD10.00% Reliance Capital Ltd. NCD 9.50% Housing Dev. Fin. Corp. Ltd. NCD CBLO - 03APR20177.61% Govt. of India GSEC 9.00% Power Fin Corp. Ltd. NCD 9.36% Power Fin Corp. Ltd. NCD 8.83% Indian Railways Fin. Corp. NCD 8.35% Uttar Pradesh State Dev. Loan SPL 9.61% Power Fin Corp. Ltd. NCD 8.08% Govt. of India 9.02% Rural Electrification Corporation Ltd 10.40% Reliance Ports & Terminals Ltd. NCD 10% ICICI Bank Ltd. NCD 8.30% Govt. of India Net Current Assets
7.347.185.744.814.524.113.803.533.383.193.112.982.932.812.692.662.322.262.001.901.741.661.561.361.321.321.241.211.161.151.141.050.930.890.820.800.710.700.640.590.560.500.160.043.50
Total 100.00
INVESTMENT TRACKER MARCH 2017

23
The Fund invests in a portfolio of high quality bonds and other fixed and floating rate securities issued by the Government, Government agencies and corporate issuers, To maintain liquidity, the Funds invests in the money market instruments.
NAV as on 31st March 2017: 16.6560Date of Inception: 15th September 2010 Benchmark: CRISIL Composite Bond Fund Index
Unit Linked Debt Plus Fund
Risk Profile – Low to MediumAsset Allocation Pattern
Debt Securities 60% - 100%Money Market 0% - 40%
Credit Rating ProfilePARTICULARS ULDPLUSAAA & equivalent*AA & equivalent A & equivalent
95.83%4.17%0.00%
TOTAL 100.00
* Includes Government Securities, SDL,Tbill and CBLO
Asset Mix
GOVERNMENT SECURITIES,
43.68%CORPORATE DEBT, 52%
OTHER NET
CURRENT ASSETS, 3.97%
0.1%
2.0%
10.6%
8.6%
10.5%
8.2%
8.7%
8.3%
8.1%
0.4%
2.6%
9.4%
8.0%
9.6%
7.8%
8.1%
8.1%
7.8%
0.0% 2.0% 4.0% 6.0% 8.0% 10.0% 12.0%
3 M
6 M
1 Yr
2 Yr
3 Yr
4 Yr
5 Yr
6 Yr
Inception
Debt Plus Benchmark
Debt Plus
Fund Performance as on 31st March 2017 (%)
Debt Fund benchmark is CRISIL Customized Bond Fund Index. Modified Duration of Debt and Money Market: 5.06Past Performance is not indicative of Future performance. The SFIN for Debt Plus Fund is ULIF01115/09/10DEBTPLFUND136
5.95%
41.20%52.85%
Up to 1 year
More than 1 year andupto 7 years
Above 7 years
Debt Maturity Profile
PORTFOLIO AS ON 31st March 2017 %Statement of Portfolio %Debt and Others 100.00
9.25% Reliance Jio Infocomm Limited NCD 9.23% Govt. of India 6.35% Govt. of India 8.27% Govt. of India 8.20% Power Grid Corp. Ltd. NCD8.70% Great Eastern Shipping Co Ltd NCD 8.9% Reliance Capital Ltd. NCD 7.06% Govt. of India GSEC 7.61% Govt. of India GSEC 6.84% Govt. of India GSEC 8.60% IDFC Infra Finance Ltd NCD8.65% Power Fin Corp. Ltd. NCD 8.23% Rural Electrification Corporation Ltd 7.9% Reliance Ports & Terminals Ltd. NCD 7.80% Govt. of India 8.83% Govt. of India 8.04% Tata Sons Ltd. NCD 8.385% IDFC Infra Finance Ltd NCD8.15% Govt. of India 8.08% Tata Sons Ltd. NCD 8.25% IDFC Infra Finance Ltd NCD9.00% Power Fin Corp. Ltd. NCD 8.57% India Infradebt Ltd NCD 7.59% Govt. of India 8.65% IL&FS Financial Services Ltd NCD 6.97% Govt. of India 9.25% Rural Electrification Corporation Ltd 8.68% National Cap Reg Plan NCD 9.02% Rural Electrification Corporation Ltd 7.73% Govt. of India GSEC 8.10% India Infradebt Ltd NCD 7.72% Govt. of India GSEC 8.26% Govt. of India 9.27% Power Finance Corp. Ltd. NCD CBLO - 03APR20178.24% Govt. of India GSEC 8.51% India Infradebt Ltd NCD 7.9% Housing Dev. Fin. Corp. Ltd. NCD 8.35% Uttar Pradesh State Dev. Loan SPL 9.68% IL & FS Ltd NCD 8.83% Indian Railways Fin. Corp. NCD 7.72% Govt. of India GSEC 10.25% Reliance Gas Transport Infrastructure Ltd 8.30% Govt. of India 10.00% Reliance Capital Ltd. NCD 9.50% Housing Dev. Fin. Corp. Ltd. NCD
8.477.397.137.085.255.163.633.392.912.592.572.172.132.091.911.711.691.591.531.481.481.471.281.081.071.051.031.031.010.950.850.850.840.830.810.770.660.630.620.580.540.530.450.450.420.41
INVESTMENT TRACKER MARCH 2017

24
10.40% Reliance Ports & Terminals Ltd. NCD 7.80% Govt. of India 9.3% Housing Dev. Fin. Corp. Ltd. NCD 10.10% HDB Financial Services Ltd. NCD 7.88% Govt. of India GSEC 8.79% Indian Railways Fin. Corp. NCD 8.97% Tata Sons Ltd NCD 8.32% Housing Dev. Fin. Corp. Ltd. NCD 9.50% Bajaj Finance Ltd. NCD 9.75% IL&FS Financial Services Ltd NCD L&T Infrastructure Finance Co Ltd CP 9.18% Power Fin Corp. Ltd. NCD 8.83% Govt. of India 9.45% LIC Housing Finance Ltd NCD 8.08% Govt. of India 7.16% Govt. of India 9.61% Power Fin Corp. Ltd. NCD 8.13% Govt. of India Net Current Assets
0.390.320.310.310.290.230.220.210.210.210.200.150.130.110.110.050.020.012.96
Total 100.00
Unit Linked Debt Plus FundINVESTMENT TRACKER MARCH 2017

25
This Fund primarily invests in a portfolio constituted of money market and high quality debt securities.
NAV as on 31st March 2017: 19.4805Date of Inception: 14th July 2008 Benchmark: CRISIL Composite Bond Fund Index
Unit Linked Liquid Fund
Risk Profile – LowAsset Allocation Pattern
Debt Securities 0% - 60%Money Market 40% - 100%
Credit Rating ProfilePARTICULARS ULLAAA & equivalent*AA & equivalent A & equivalent
100.00%0.00%0.00%
TOTAL 100.00
* Includes Government Securities, SDL,Tbill and CBLO
GOVERNMENT SECURITIES,
12.81%
CORPORATE DEBT, 17%
OTHER NET CURRENT ASSETS, 69.87%
Asset Mix
1.5%
3.3%
7.2%
7.5%
7.9%
8.1%
8.3%
8.3%
8.0%
7.8%
7.9%
1.4%
2.8%
6.1%
6.6%
7.1%
7.4%
7.6%
7.7%
7.5%
7.0%
7.2%
0.0% 2.0% 4.0% 6.0% 8.0% 10.0%
3 M
6 M
1 Yr
2 Yr
3 Yr
4 Yr
5 Yr
6 Yr
7 Yr
8 Yr
Inception
Liquid Benchmark
Liquid
Fund Performance as on 31st March 2017 (%)
Liquid Fund benchmark is CRISIL Liquid Fund IndexModified Duration of Debt and Money Market: 0.39Past performance is not indicative of future performanceThe SFIN for Liquid Fund is ULIF00514/07/08LIQUIDFUND136.
100.00%
0.00%0.00%
Up to 1 year
More than 1 year andupto 7 years
Above 7 years
Debt Maturity Profile
PORTFOLIO AS ON 31st March 2017 %Statement of Portfolio %Debt and Others 100.00
8.07% Govt. of India 91 Days Treasury Bill 364 Days Treasury Bill IL & FS Ltd CP L&T Infrastructure Finance Co Ltd CP Piramal Enterprises Ltd CP 9.2% Housing Dev. Fin. Corp. Ltd. NCD 9.57% LIC Housing Fin. Ltd. NCD 8.05% LIC Housing Fin. Ltd. NCD 9.27% Power Finance Corp. Ltd. NCD CBLO - 03APR2017Bajaj Finance Ltd CP Axis Bank CD 7.49% Govt. of India GSEC 364 Days Treasury Bill IL & FS Financial Services Ltd CP L&T Finance Co Ltd CP HDFC CPIL & FS Financial Services Ltd CP 8.25% Bandhan Bank FD Qtly Cmpdg8.25% Bandhan Bank FD Qtly Cmpdg8.25% Bandhan Bank FD Qtly Cmpdg8.25% Bandhan Bank FD Qtly CmpdgNet Current Assets
8.628.548.178.015.965.924.344.334.334.324.284.244.204.194.044.003.392.971.420.850.850.850.801.38
Total 100.00
INVESTMENT TRACKER MARCH 2017

26
The Fund aims to generate long-term capital appreciation from active management of a portfolio of equity and fixed income securities.The allocation between equality and debt is dynamically managed, depending on the prevalent market conditions to safeguard capital appreciation. The use of derivatives is as per approval by IRDAI.
NAV as on 31st March 2017: 16.5538Date of Inception: 15th April 2011
Unit Linked NAV Guarantee Fund
0.920.961.041.111.201.623.053.545.7911.96
68.80
0.00
10.00
20.00
30.00
40.00
50.00
60.00
70.00
80.00
Industry Sector Exposure
Programming and Broadcasting activitiesManufacture of tobacco productsScientific research and developmentElectricity, gas, steam and air conditioning supplyManufacture of other non-metallic mineral productsCivil engineeringManufacture of pharmaceuticals, medicinal chemical and botanicalComputer programming, consultancy and related activitiesManufacture of motor vehicles, trailers and semi-trailersFinancial and Insurance activitiesOthers
Risk Profile – Medium
Equity Sector Exposure (%)
Credit Rating ProfilePARTICULARS UL-NAVGAAA & equivalent*AA & equivalent A & equivalent
100.00%0.00%0.00%
TOTAL 100.00
* Includes Government Securities, SDL,Tbill and CBLO
Asset Allocation PatternEquity 0% - 100%Debt Securities 0% - 100%Money Market 0% - 100%
All rated fixed income instruments are AAA/P1+ or equivalent.Past Performance is not indicative of future performance.Modified Duration of Debt and Money Market: 3.27The SFIN for NAV Guarantee Fund Series 1 is
ULIF01215/04/11NAVGFUNDSI136.
1.45%
98.55%
0.00% Debt Maturity profile
Up to 1 year
More than 1 year andupto 7 years
Above 7 years
Debt Maturity Profile
GOVERNMENT SECURITIES,
60.82%
EQUITY, 36.10%
OTHER NET CURRENT ASSETS, 3.08%
Asset Mix
PORTFOLIO AS ON 31st March 2017 %Statement of Portfolio %Debt and Others 63.90
7.80% Govt. of IndiaCBLO - 03APR2017Net Current Assets
60.820.902.19
Equity 36.10HDFC Bank LtdIndusInd Bank LtdMaruti Suzuki India LtdYES Bank LtdSun Pharmaceutical Industries LtdInfosys LtdTata Motors LtdLarsen & Tourbo LtdKotak Mahindra Bank LtdBajaj Finance LtdHCL Technologies LtdGAIL (India) LtdBosch LtdSyngene International LtdITC LtdZee Entertainment Enterprises LtdBharat Petroleum Corp LtdICICI Bank LtdIndian Oil Corporation LtdIndraprastha Gas LtdUltratech Cement LtdLaurus Labs LtdBharat Electronics LtdGlenmark Pharmaceuticals LtdFortis Healthcare LtdACC LtdTata Consultancy Services LtdIndian Hotels Co LtdNestle India LtdGodrej Consumer Products LtdTata Motors Ltd DVRBharat Forge LtdUnited Spirits LtdMRF Ltd
3.022.742.732.302.021.951.781.621.581.491.151.111.071.040.960.920.860.820.810.790.750.570.530.470.450.450.450.410.350.280.210.190.180.05
Total 100.00
INVESTMENT TRACKER MARCH 2017

27
The Fund invests in listed equities and high quality fixed income and money market instruments. The Fund intends to adopt a relatively aggressive approach towards bonds and equities with the objective of achieving capital appreciation.
NAV as on 31st March 2017: 10.1594Date of Inception: 8th September 2016 Benchmark: Nifty 50 and CRISIL Composite Bond Fund Index
Unit Linked Pension Growth Fund
Risk Profile – Medium to High RiskAsset Allocation Pattern
Equity and Equity Related Instruments 10% - 60%Debt Securities 20% - 100%Money Market 0% - 80%
Asset Mix
Credit Rating ProfilePARTICULARS ULGPAAA & equivalent*AA & equivalent A & equivalent
100.00%0.00%0.00%
TOTAL 100.00
* Includes Government Securities, SDL,Tbill and CBLO
OTHER NET CURRENT ASSETS, 8.55%
GOVERNMENT SECURITIES,
52.83%
EQUITY, 38.61%
Pension Growth Fund benchmark is 40% Nifty 50 and60% Customized Crisil Composite Bond Fund Index.Modified Duration of Debt and Money Market 4.68The SFIN for Pension Growth Fund is ULIF01405/11/15PENSGROFND136.
Fund Performance as on 31st March 2017 (%)
0.2%
1.4%
1.6%
5.0%
4.1%
2.9%
0.0% 1.0% 2.0% 3.0% 4.0% 5.0% 6.0%
3 M
6 M
Inception
ULGP Benchmark
Pension Growth
26.32%
36.49%
37.19%
Debt Maturity profile
Up to 1 year
More than 1 year andupto 7 years
Above 7 years
Debt Maturity Profile
PORTFOLIO AS ON 31st March 2017 %Statement of Portfolio %Debt and Others 61.39
8.27% Govt. of India 7.61% Govt. of India GSEC CBLO - 03APR20179.23% Govt. of India 7.49% Govt. of India GSEC 8.13% Govt. of India 7.72% Govt. of India GSEC Net Current Assets
19.2217.6812.215.494.914.511.02-3.65
Equity 38.61Maruti Suzuki India LtdICICI Bank LtdHDFC Bank LtdYES Bank LtdIndusInd Bank LtdSun Pharmaceutical Industries LtdInfosys LtdTata Motors LtdLarsen & Tourbo LtdHCL Technologies LtdGAIL (India) LtdUltratech Cement LtdBosch LtdITC LtdZee Entertainment Enterprises LtdHero Motocorp LtdBharat Petroleum Corp LtdAsian Paints LtdIndian Oil Corporation LtdAurobindo Pharma LtdTata Consultancy Services LtdHindustan Unilever LtdACC LtdHindalco Industries LtdAdani Ports & Special Economic Zone LtdTata Motors Ltd DVR
3.213.102.942.702.642.402.392.241.981.421.391.381.261.221.101.060.930.890.880.650.590.550.510.490.440.23
Total 100.00
INVESTMENT TRACKER MARCH 2017

28
Disclosures. In linked insurance products, the investment risk in Investment portfolio is borne by the policyholder.. The Linked Insurance Products do not offer any liquidity during the first five years of the contract. The policyholder will not be able to surrender/ withdraw the monies invested in Linked Insurance Products completely or partially till the end of the fifth year.. The various funds offered under this contract are the names of the funds and do not in any way indicate the quality of these plans, their future prospects and returns.. Linked Insurance products are different from the traditional insurance products and are subject to the risk factors.. Past performance of the investment funds do not indicate the future performance of the same. Investors in the Scheme are not being offered any guaranteed/ assured returns.. The premium paid in the Linked Insurance policies are subject to investment risks associated with capital markets and the NAVs of the units may go up or down based on the performance of fund and factors influencing the capital market and the insured is responsible for his/her decisions.. The premium shall be adjusted on the due date even if it has been received in advance.. The premiums and funds are subject to certain charges related to the fund or to the premium paid.. Please know that the associated risks and the applicable charges, from your insurance agent or the intermediary or policy document issued by the insurance company.. For more details on the risk factors, terms and conditions please read the sales brochure carefully before concluding a sale.. The SFIN (Segregated Fund Index Number) for: Equity Fund is ULIF00116/06/08EQUITYFUNDi36, Equity II fund is ULIF00607/0F/10EQUITYIIFND 136, Growth Fund is ULIF00216/06/08GROWTHFUND136, Growth II Fund is ULIF00707/01/10GROWTIIFND136, Growth Plus Fund is ULIF00913/09/10GROWTPLFND136, Balanced Fund is ULIF00316/06/08BALANCED II Fund is ULIF00807/01/10BLNCDIIFND136, Balanced Plus Fund is ULIF01013/09/10BLNCDPLFNDF 36, Debt Fund is ULIF00409/07/08INDEBTFUND 136, Debt Plus Fund is ULIF01115/09/10DEBTPLFUND 136, Liquid Fund is ULIF00514/07/08LIQUIDFUND 136, NAV Guarantee Fund is ULIF01215/04/11NAVGFUNDS1136, Pension Growth Fund is ULIF01405/11/15PENSGROFND 136, Unit Linked India Multicap Fund is ULIF01816/08/16/0816IMCAPEQFND136 & Discontinued Policy Fund is ULIF01319/09/11POLDISCFND136.
Purchase of any Insurance products by a bank’s customer is purely voluntary and is not linked to availment of any other facility from the bank.
BEWARE OF SPURIOUS PHONE CALLS AND FICTITIOUS/FRADULANT OFFERS. IRADI clarifies to public that: IRDAI or its officials do not involve in activities like sale of any kind of insurance or financial products nor invest premiums. IRDAI does not announce any bonus. Public receiving such phone calls are requested to lodge a police complaint along with details of phone call, number.
Trade Logo of Canara HSBC Oriental Bank of Commerce Life Insurance Company Limited (Insurer) is used under license with Canara Bank, HSBC Group Management Services Limited and Oriental Bank of Commerce. The Insurance products are offered and underwritten by Canara HSBC Oriental Bank of Commerce Life Insurance Company Limited.
Canara HSBC Oriental Bank of Commerce Life Insurance Company Limited (IRDAI Regn. No. 136)Registered Office: Unit No. 208, 2 nd Floor, Kanchenjunga Building, 18 Barakhamba Road, New Delhi-110001, India
Corporate Office: 2 nd Floor, Orchid Business Park, Sector-48, Sohna Road, Gurugram-122018, Haryana, India
Corporate Identity No.: U66010DL2007PLC248825
www.canarahsbclife.com 1800-103-0003/1800-180-0003(BSNK/MTNL)
0124-6156600 9779030003 [email protected]
NWL1NJINVAPR17 ENG