investment risk and return under renewable decarbonization of a power market
TRANSCRIPT
This article was downloaded by: [University of West Florida]On: 11 October 2014, At: 07:08Publisher: Taylor & FrancisInforma Ltd Registered in England and Wales Registered Number: 1072954 Registered office:Mortimer House, 37-41 Mortimer Street, London W1T 3JH, UK
Climate PolicyPublication details, including instructions for authors and subscriptioninformation:http://www.tandfonline.com/loi/tcpo20
Investment risk and return under renewabledecarbonization of a power marketJosé I. Muñoz a & Derek W. Bunn ba Universidad de Castilla – La Mancha , E.T.S. de Ingenieros Industriales,13071 , Ciudad Real , Spainb London Business School , Sussex Place, Regent's Park, London , NW1 5SA ,UKPublished online: 31 Jan 2013.
To cite this article: José I. Muñoz & Derek W. Bunn (2013) Investment risk and return under renewabledecarbonization of a power market, Climate Policy, 13:sup01, 87-105, DOI: 10.1080/14693062.2012.750473
To link to this article: http://dx.doi.org/10.1080/14693062.2012.750473
PLEASE SCROLL DOWN FOR ARTICLE
Taylor & Francis makes every effort to ensure the accuracy of all the information (the “Content”)contained in the publications on our platform. However, Taylor & Francis, our agents, and ourlicensors make no representations or warranties whatsoever as to the accuracy, completeness, orsuitability for any purpose of the Content. Any opinions and views expressed in this publicationare the opinions and views of the authors, and are not the views of or endorsed by Taylor &Francis. The accuracy of the Content should not be relied upon and should be independentlyverified with primary sources of information. Taylor and Francis shall not be liable for anylosses, actions, claims, proceedings, demands, costs, expenses, damages, and other liabilitieswhatsoever or howsoever caused arising directly or indirectly in connection with, in relation to orarising out of the use of the Content.
This article may be used for research, teaching, and private study purposes. Any substantialor systematic reproduction, redistribution, reselling, loan, sub-licensing, systematic supply, ordistribution in any form to anyone is expressly forbidden. Terms & Conditions of access and usecan be found at http://www.tandfonline.com/page/terms-and-conditions
Investment risk and return under renewabledecarbonization of a power marketJOSE I. MUNOZ1, DEREK W. BUNN2*
1 Universidad de Castilla – La Mancha, E.T.S. de Ingenieros Industriales, 13071 Ciudad Real, Spain2 London Business School, Sussex Place, Regent’s Park, London NW1 5SA, UK
How does financial performance risk affect investments in low-carbon electricity-generating technologies to achieve climatepolicy targets? A detailed risk simulation of price formation in the Great Britain wholesale power market is used to show that theincreasing replacement of fossil facilities with wind, ceteris paribus, may cause a deterioration of the financial risk–return per-formance metrics for incremental investments. Low-carbon investments appear to be high risk, low return, and as such mayrequire a progressively higher level of support over time than envisaged by the conventional degression trajectories. Theincreasing riskiness of the wholesale market will to some extent offset the benefits of lower capital costs and operational effi-ciencies if investors need to satisfy cautious debt coverage ratios alongside positive expected returns. This increased risk isadditional to the well-known ‘merit order effect’ of low-carbon investments progressively depressing wholesale prices and hencetheir expected investment returns.
Policy relevancePolicy support for renewable technologies such as wind is usually based upon levelized costs and is expected to reduce overtime as capital costs and operational efficiencies improve. However, levelized costs do not take full account of the risk aversionthat investors may have in practice. Expected policy support reductions may be moderated to some extent by the increasedfinancial performance risk that intermittent technologies bring to the power market. The annual risk-return profiles for incrementalinvestments deteriorate for all technologies as wind replaces fossil fuels. This extra risk premium will need to be incorporated intoevaluating policy incentives for new investments in a decarbonizing power market.
Keywords: coal; financing; incentives; investment; risk; wind power
1. Introduction
Governments have introduced a variety of policy interventions and selective support schemes to
reduce carbon emissions from the power sector, and at the same time have maintained policy commit-
ments to liberalized, competitive markets. The interaction of market and policy risks has thus emerged
as an important consideration for investors in the sector. The effects of rapid structural changes, market
reforms, and innovations on the risks and financial performances of both existing and prospective
assets are crucial to market participants and policy makers. Thus, it is now widely recognized that
increased penetration of wind and solar generation has led, and will continue to lead, to substantial
B *Corresponding author. Email: [email protected]
At the time of publication Jose I. Munoz is also member of Instituto de Investigaciones Energeticas UCLM
Vol. 13, No. S01, S87–S105, http://dx.doi.org/10.1080/14693062.2012.750473
B research article
# 2013 Taylor & Francis
Dow
nloa
ded
by [
Uni
vers
ity o
f W
est F
lori
da]
at 0
7:08
11
Oct
ober
201
4
changes in the wholesale market dynamics with greater price volatility and different operational
regimes for existing power plants (e.g. Green & Vasilakos, 2010; Hirth, 2012; Poyry, 2009; Saenz de
Miera, del Rio Gonzalez, & Vizcaıno, 2008; Sensfuß, Ragwitz, & Genoese, 2008). More fundamentally,
with a greater penetration of renewables (and perhaps nuclear), questions are increasingly being asked
regarding the ability of the typical wholesale energy market to deliver attractive returns for investors as
the sector moves to high-capital/low-operating-cost (and also intermittent) technologies. In Britain,
this has motivated substantial proposals for market reform (DECC, 2011a).
A substantial amount of research has examined the various aspects of renewable investment and its
effects on the wholesale power markets, including a declining incremental wind value as decarboniza-
tion progresses (this is due to the ‘merit order’ effect as higher-price-setting plants are pushed out of
normal price-setting; e.g. Gowrisankaran, Reynolds, & Samano, 2011; Hirth, 2012; Obersteiner and
Saguan, 2010; Sensfuß et al., 2008). A key observation has been the increasing divergence between
the expected price that an intermittent producer can achieve and that of a firm producer as a result
of periods when high renewable output depresses prices. This feature is explored in the present
article, but with a specific focus on the risk–return profile for new and existing assets in the power
sector as it undergoes radical decarbonization. Many studies have reported on the relative levelized
costs of various new technologies in the context of incremental investment in existing systems and
within future scenarios. However, as Joskow (2012) argues, levelized costs are not appropriate for
renewable technologies; in particular, these costs generally use average values that do not explicitly
reflect financial performance risks and how those risks may evolve.
Risk (and its impact on investment decisions) has been extensively analysed from a portfolio perspec-
tive (e.g. Awerbuch, 2006) and with respect to the timing, synergy, and operational flexibility of invest-
ments from real options (Fleten & Ringen, 2009; Keppo & Lu, 2003; Reuter, Fuss, Szolgayova, &
Obersteiner, 2012). However, it remains an open question how investment risks and returns may
change over the lifetimes of investments as the wholesale price formation adapts to the low-carbon
structural changes. This is clearly crucial in understanding whether policies aimed at stimulating low-
carbon investment will be as successful as economic analysis might suggest. Thus, it is now becoming
widely recognized – especially following analyses from the real options perspectives (Kettunen, Bunn,
& Blyth, 2011; Yang et al., 2008) – that policy and market risks will tend to induce an extra premium
requirement for investment and also that the risk of financial underperformance (in terms of those oper-
ational cash flows that do not cover financing costs) needs to be considered explicitly as a key risk metric.
Policy models for investment in the power sector rarely provide an explicit treatment of risk. Often it
is assumed that, given a hurdle discount rate for the cost of capital, Net Present Value positive invest-
ments will happen; sometimes the hurdle rates are increased for project risk, but these tend to be ad hoc
suggestions (Redpoint, 2007). With this in mind, while there is clearly an absence of substantial long-
term empirical evidence regarding asset-specific risk for new low-carbon technologies, estimating an
appropriate discount rate is nevertheless commonly attempted. Accordingly, the performances of
renewable technology sector stocks as a whole have been extensively tracked and analysed for excess
returns. However, the indices (e.g. NEX; www.nexindex.com) include a greater number of project
developers and new technology start-ups than long-term operators. This indicates, unsurprisingly,
that renewable energy has high-risk characteristics that are similar to those of technology stocks in
general (Henriques & Sadorsky, 2008). However, it is not likely that this analogy will be applicable to
the operational phase of renewable projects when the utilities generally take ownership.
S88 Munoz and Bunn
CLIMATE POLICY
Dow
nloa
ded
by [
Uni
vers
ity o
f W
est F
lori
da]
at 0
7:08
11
Oct
ober
201
4
The analysis presented here seeks to take into account the way in which renewable energy investors
will carefully examine both financial performance and risk in terms of debt coverage and conventional
returns on investment. Investors will typically submit to potential lenders a detailed financial planning
analysis of the performance of the project over its lifetime, and provide extensive commentary on the
market risks and the possibilities of failing to cover debt repayments from earnings (CPI, 2011). Simi-
larly, ratings agencies look at such ‘coverage’ ratios, which will influence the cost of borrowing
(Moody’s, 2009). Thus, if critical debt coverage ratios are not perceived to be achievable with an accep-
table level of probability, even Net Present Value positive investments will be considered too risky to
advance. This conclusion is consistent with the observations made in CPI (2011) that
investors are particularly concerned with the default risk of their investments. . . Providers of debt
conduct rigorous assessments of project risks. . . and the likelihood of those scenarios. The assessment
of default risk determines whether project debt is investment grade. (CPI, 2011, p. 3)
Furthermore, following practice, this ‘value-at-risk’ screening of investment opportunities is becom-
ing increasingly apparent in models of power investment (Fortin et al., 2008; Kettunen et al., 2011).
The analysis here examines how the annual financial performance of generating assets may change,
as the technology mix is progressively decarbonized. Specifically, a detailed analysis is provided of
the risk–return properties of various new wind investments that they would have had in Great
Britain (GB, i.e. the UK, excluding Northern Ireland1) in 2011 had wind replaced coal.
In Section 2 the fundamental risk simulation model used in the analysis is described and is then
applied to asset returns in the GB wholesale power market as it was in 2011. In Section 3, various evol-
utionary simulations for the risk–return profiles of specific assets are examined as the 2011 target year
wholesale market becomes more deeply decarbonized, with wind gradually replacing coal. In Section 4,
the financial performances of various wind and coal mixes are described and analysed. It is concluded
in Section 5 that the increasing risk of debt coverage falling below a critical level, in conjunction with
the average decline in expected returns on investment, may counteract the expectation that there will
be decreasing policy support for the extensive penetration of key low-carbon technologies. This mod-
erates the generally accepted views that (1) public support for low-carbon investments (which is
initially necessary to stimulate innovation) will decline over time as technology learning brings
down capital costs to ‘grid parity’ and (2) even if capital costs suffer from supply chain escalations in
their early years (as with offshore wind in the UK), the long-term market expectation will be one of
declining costs and associated government support (Greenacre, Gross, & Heptonstall, 2010).
2. Stochastic price risk model
In order to focus upon the annual financial performance risks of assets, particularly with respect to cov-
erage ratios under progressive decarbonization, the analysis developed here uses a target year model.
This allows for a probabilistic simulation of operational and price risks within a year, based upon
empirical data, so that annual operational profit probability distributions can be compared with annui-
tized financing costs. The technology mix in this target year is then varied in order to investigate, ceteris
Investment risk and return S89
CLIMATE POLICY
Dow
nloa
ded
by [
Uni
vers
ity o
f W
est F
lori
da]
at 0
7:08
11
Oct
ober
201
4
paribus, how the risk–return balance is affected as wind gradually replaces coal. The model creates a
range of demand, supply, and commodity risks using Monte Carlo simulations.
The model used is not a forecasting model and it addresses neither long-term uncertainties2 (e.g.
fossil-fuel prices, endogenous learning and investment, changing demand profiles) nor policy risks.
Hence, no position is taken regarding how the relative economics of the various technologies might
evolve in the future, how government interventions might move risks to or from market participants,
nor how companies might adjust their portfolios and market structure to manage risks better.
The benefit of taking a target year approach and looking at intra-year performance risk is that it
avoids speculation about how future prices, investments, and policies may behave. The limitation of
this approach, of course, is that such longer-term risks are additional and require substantial consider-
ation when investment forecasts are undertaken.
Yearly price distributions were computed from the intersection of supply and demand, based upon a
full representation of the 2011 GB wholesale market. All 320 generating plants offering energy into the
market were included, from the very small biomass, onshore and offshore wind facilities to large
nuclear stations. Installed capacities were taken from DECC (2011b). Availabilities and heat rates
were consistent with various sources (Mott MacDonald, 2010; RedPoint, 2007). Hourly demand for
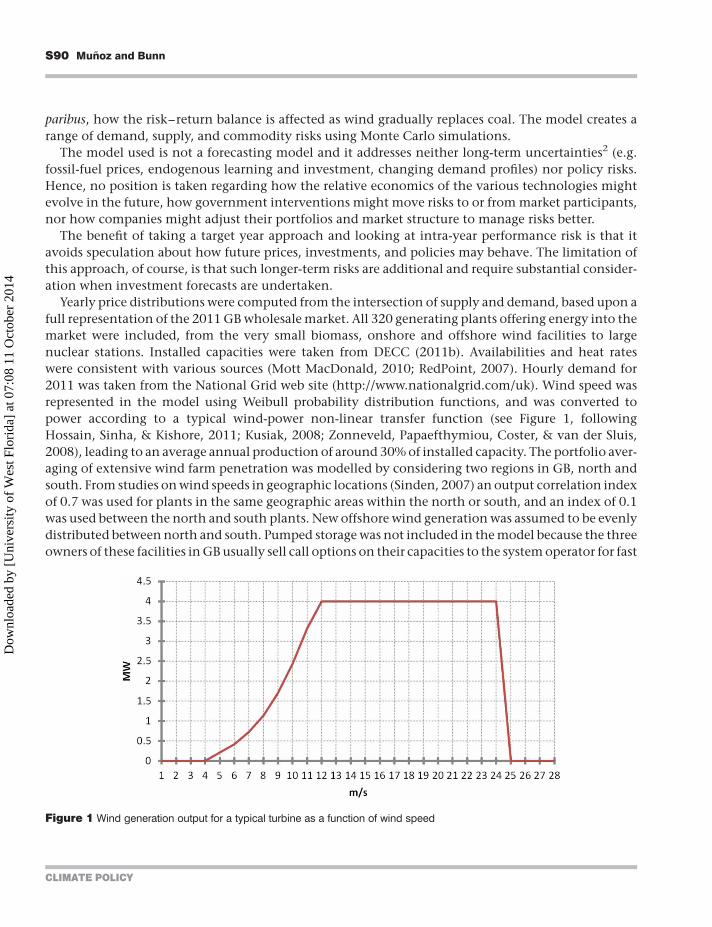
2011 was taken from the National Grid web site (http://www.nationalgrid.com/uk). Wind speed was
represented in the model using Weibull probability distribution functions, and was converted to
power according to a typical wind-power non-linear transfer function (see Figure 1, following
Hossain, Sinha, & Kishore, 2011; Kusiak, 2008; Zonneveld, Papaefthymiou, Coster, & van der Sluis,
2008), leading to an average annual production of around 30% of installed capacity. The portfolio aver-
aging of extensive wind farm penetration was modelled by considering two regions in GB, north and
south. From studies on wind speeds in geographic locations (Sinden, 2007) an output correlation index
of 0.7 was used for plants in the same geographic areas within the north or south, and an index of 0.1
was used between the north and south plants. New offshore wind generation was assumed to be evenly
distributed between north and south. Pumped storage was not included in the model because the three
owners of these facilities in GB usually sell call options on their capacities to the system operator for fast
Figure 1 Wind generation output for a typical turbine as a function of wind speed
S90 Munoz and Bunn
CLIMATE POLICY
Dow
nloa
ded
by [
Uni
vers
ity o
f W
est F
lori
da]
at 0
7:08
11
Oct
ober
201
4
reserve and system balancing services, and so do not engage substantially in the day-ahead wholesale-
market price-setting.
With the economic recession following 2008, average demand and supply for the 2011 were 37.5 and
62 GW, respectively, which implies a relatively over-supplied market compared to previous years. In one
variation, demand was increased by 10% in order to match the supply–demand conditions more closely
to the ‘normal’ conditions envisaged before the recession (when installed capacity decisions were pre-
viously made by the generators). Initially, a competitive fundamental model was analysedon the assump-
tion that generators offer plants at short-run marginal costs (SRMC), which were taken as the heat rate
conversion of coal, gas, and oil for the fossil-fuel technologies. No allowances were made for start-up
costs, but the market price uncertainties in EU carbon allowances and GB Renewable Obligation Certifi-
cates (ROCs3) were included, as they have been empirically estimated around yearly means in recent
years. Transmission constraints do not factor into wholesale market prices, as they are part of the real-
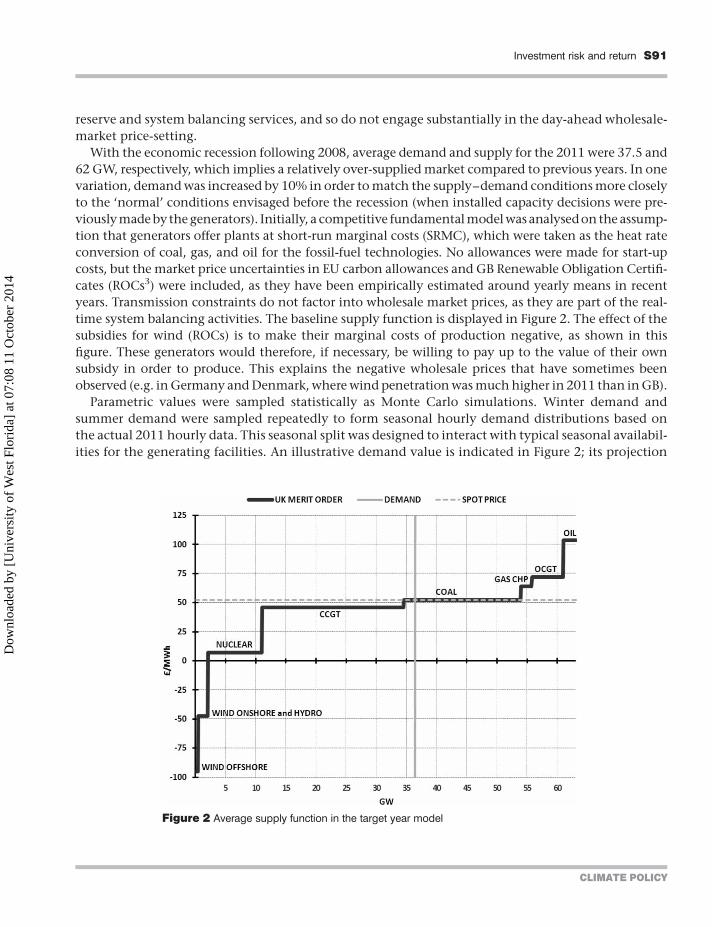
time system balancing activities. The baseline supply function is displayed in Figure 2. The effect of the
subsidies for wind (ROCs) is to make their marginal costs of production negative, as shown in this
figure. These generators would therefore, if necessary, be willing to pay up to the value of their own
subsidy in order to produce. This explains the negative wholesale prices that have sometimes been
observed (e.g. in Germany and Denmark, where wind penetration was much higher in 2011 than in GB).
Parametric values were sampled statistically as Monte Carlo simulations. Winter demand and
summer demand were sampled repeatedly to form seasonal hourly demand distributions based on
the actual 2011 hourly data. This seasonal split was designed to interact with typical seasonal availabil-
ities for the generating facilities. An illustrative demand value is indicated in Figure 2; its projection
Figure 2 Average supply function in the target year model
Investment risk and return S91
CLIMATE POLICY
Dow
nloa
ded
by [
Uni
vers
ity o
f W
est F
lori
da]
at 0
7:08
11
Oct
ober
201
4

through the supply function into an SRMC market clearing price demonstrates the standard price for-
mation process. No demand elasticity was assumed. It is well known that offer prices into competitive
pools or power exchanges are, in practice, often above SRMC, particularly for lower load factor plants.
However, it is appropriate to start with SRMC as a competitive baseline. In fact, mark-ups of about 20%
in the price-setting range of technologies (non-renewables) gave a good calibration of average annual
price from this model to the actual average 2011 power exchange reference price. Figure 3 shows the
actual price distribution for 2011 (and the good fit of a log-logistic distribution), with a mean of
£49.9/MW and standard deviation of £4.9/MW. This is comparable with the 5000 iterations of the
simulation model used, as shown in Figure 4, which has a similar shape and range, a mean of £49.5/
MW and standard deviation of £5.0/MW.
Unplanned outages were simulated according to binomial distributions based upon average avail-
abilities. Fossil-fuel prices were sampled from log-normal distributions with intra-yearly standard devi-
ations and correlations estimated empirically over recent years. As this model is a target year risk
simulation, there was no speculation on diffusion processes for the commodities over the longer
term (which can be set by exogenous experimental variations with different annual mean values).
The base-case assumptions and parameters are shown in Tables 1 and 2.
The model simulates hourly market prices and utilizations for each plant, and returns statistical distri-
butions for the annual profit contributions for each plant in the system. These can also be aggregated by
company ownership. New investment performance was monitored in terms of annual profit contri-
butions, debt coverage ratios, and the probability that the debt coverage ratio falls below 1.2. The debt
coverage ratio is an annual value representing the ratio of annual operational profit contribution to
annuitized capital costs, where the annuitization depends on cost of capital and asset lifetime. A ratio
above 1 indicates that the asset has a positive return, which would be comparable to a Net Present
Value criterion. Following the risk simulation analysis, a probability distribution for this ratio was
Figure 3 Actual hourly price distribution for GB in 2011 (with log-logistic fit)
S92 Munoz and Bunn
CLIMATE POLICY
Dow
nloa
ded
by [
Uni
vers
ity o
f W
est F
lori
da]
at 0
7:08
11
Oct
ober
201
4

obtained. Exceeding a ratio of 1.2 with 95% confidence was taken as an indicative criterion that may be
considered by analysts and ratings agencies to retain an investment grade (CPI, 2011). As a baseline,
100% debt financing of new assets and debt at 8% (pre-tax) were assumed over the life of the project.
Typically, onshore wind assets have been 80% debt-financed in GB, offshore rather less, while com-
bined cycle gas turbine (CCGT)/coal/nuclear have generally been on balance sheet. However, in order
Figure 4 Simulated price distribution with 20% non-renewable mark-ups
Table 1 Fossil fuels, carbon rights, and green credits distributions
Commodity Mean Standard deviation
Oil £70/bl 14
Gas £0.60/thm 12
Coal US$120/tonne 24
Carbon rights (EUAs) £14/tonne 3
Green certificates (ROCs) £50/tonne 3
Notes: EUAs, EU Allowance Unit; ROCs, Renewable Obligation Certificates.
Table 2 Estimated intra-year price correlations of fossil fuels
Correlations Oil Gas Coal
Oil 1 – –
Gas 0.631 1 –
Coal 0.861 0.628 1
Investment risk and return S93
CLIMATE POLICY
Dow
nloa
ded
by [
Uni
vers
ity o
f W
est F
lori
da]
at 0
7:08
11
Oct
ober
201
4
to gain some rather fundamental comparative insights, these baseline assumptions were taken to provide
a reasonable and conservative proxy for the range of financial performance metrics that may be used in
practice (as, for leverage below 100%, higher equity returns than debt will generally be required). In any
particular case, a company’s idiosyncratic tax, leverage, amortization, and corporate circumstances will,
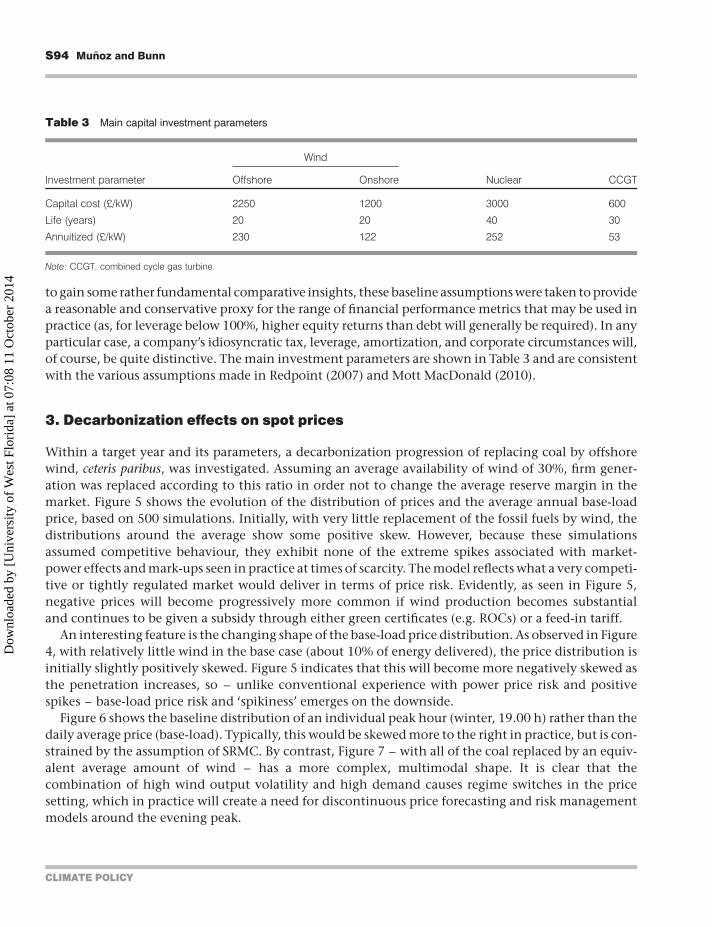
of course, be quite distinctive. The main investment parameters are shown in Table 3 and are consistent
with the various assumptions made in Redpoint (2007) and Mott MacDonald (2010).
3. Decarbonization effects on spot prices
Within a target year and its parameters, a decarbonization progression of replacing coal by offshore
wind, ceteris paribus, was investigated. Assuming an average availability of wind of 30%, firm gener-
ation was replaced according to this ratio in order not to change the average reserve margin in the
market. Figure 5 shows the evolution of the distribution of prices and the average annual base-load
price, based on 500 simulations. Initially, with very little replacement of the fossil fuels by wind, the
distributions around the average show some positive skew. However, because these simulations
assumed competitive behaviour, they exhibit none of the extreme spikes associated with market-
power effects and mark-ups seen in practice at times of scarcity. The model reflects what a very competi-
tive or tightly regulated market would deliver in terms of price risk. Evidently, as seen in Figure 5,
negative prices will become progressively more common if wind production becomes substantial
and continues to be given a subsidy through either green certificates (e.g. ROCs) or a feed-in tariff.
An interesting feature is the changing shape of the base-load price distribution. As observed in Figure
4, with relatively little wind in the base case (about 10% of energy delivered), the price distribution is
initially slightly positively skewed. Figure 5 indicates that this will become more negatively skewed as
the penetration increases, so – unlike conventional experience with power price risk and positive
spikes – base-load price risk and ‘spikiness’ emerges on the downside.
Figure 6 shows the baseline distribution of an individual peak hour (winter, 19.00 h) rather than the
daily average price (base-load). Typically, this would be skewed more to the right in practice, but is con-
strained by the assumption of SRMC. By contrast, Figure 7 – with all of the coal replaced by an equiv-
alent average amount of wind – has a more complex, multimodal shape. It is clear that the
combination of high wind output volatility and high demand causes regime switches in the price
setting, which in practice will create a need for discontinuous price forecasting and risk management
models around the evening peak.
Table 3 Main capital investment parameters
Investment parameter
Wind
Nuclear CCGTOffshore Onshore
Capital cost (£/kW) 2250 1200 3000 600
Life (years) 20 20 40 30
Annuitized (£/kW) 230 122 252 53
Note: CCGT, combined cycle gas turbine.
S94 Munoz and Bunn
CLIMATE POLICY
Dow
nloa
ded
by [
Uni
vers
ity o
f W
est F
lori
da]
at 0
7:08
11
Oct
ober
201
4

Figure 8 shows the outage rates in TWh per year. Starting from a highly over-supplied initial con-
dition, significant outage rates do not materialize until about 50% (13 GW) of the coal has been
replaced, at which point it increases steeply. It is important to remember that the analysis here used
Figure 5 Competitive prices with wind gradually replacing coalNote: In the simulations, the inner dark bands are 5% and 95% limits and the outerlighter bands are max and min values.
Figure 6 Baseline distribution for winter evening peak (19.00 h)
Investment risk and return S95
CLIMATE POLICY
Dow
nloa
ded
by [
Uni
vers
ity o
f W
est F
lori
da]
at 0
7:08
11
Oct
ober
201
4
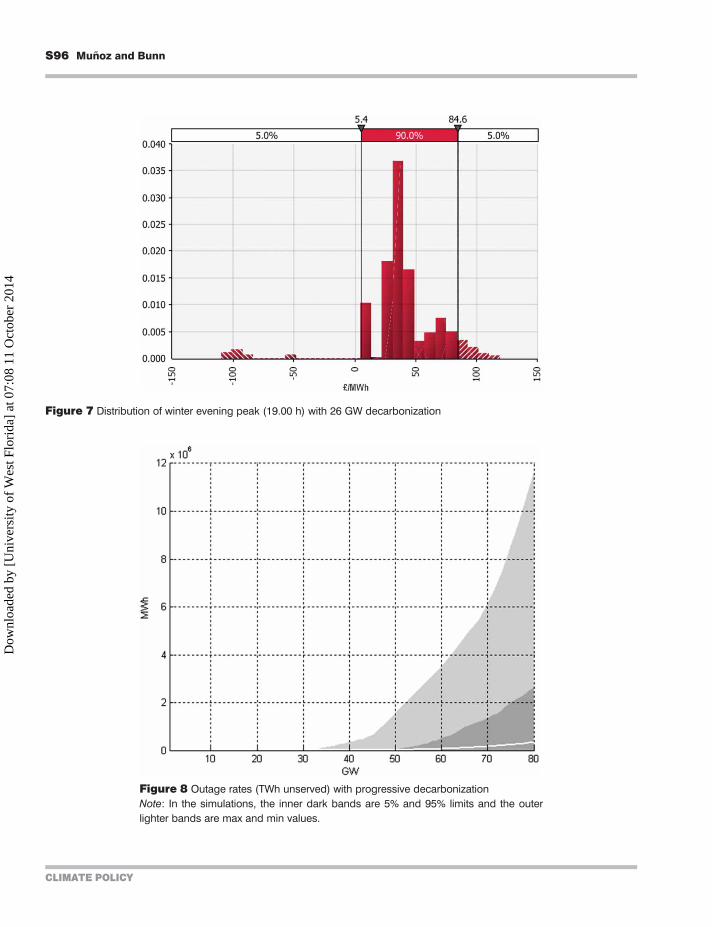
Figure 8 Outage rates (TWh unserved) with progressive decarbonizationNote: In the simulations, the inner dark bands are 5% and 95% limits and the outerlighter bands are max and min values.
Figure 7 Distribution of winter evening peak (19.00 h) with 26 GW decarbonization
S96 Munoz and Bunn
CLIMATE POLICY
Dow
nloa
ded
by [
Uni
vers
ity o
f W
est F
lori
da]
at 0
7:08
11
Oct
ober
201
4
a target year simulation based upon 2011, in which there was a historically large capacity margin. The
result is not meant to have forecasting implications other than indicating how the progressive replace-
ment of firm coal by intermittent wind preserves the same derated capacity margin, by eroding
reliability itself. However, the result is consistent with the short-term resource adequacy assessments
by the National Grid (NG, 2011). In the longer term, the National Grid forecasts higher expected
unserved energy levels due to anticipated lower derated capacity margins by 2015.
4. Simulated financial performances
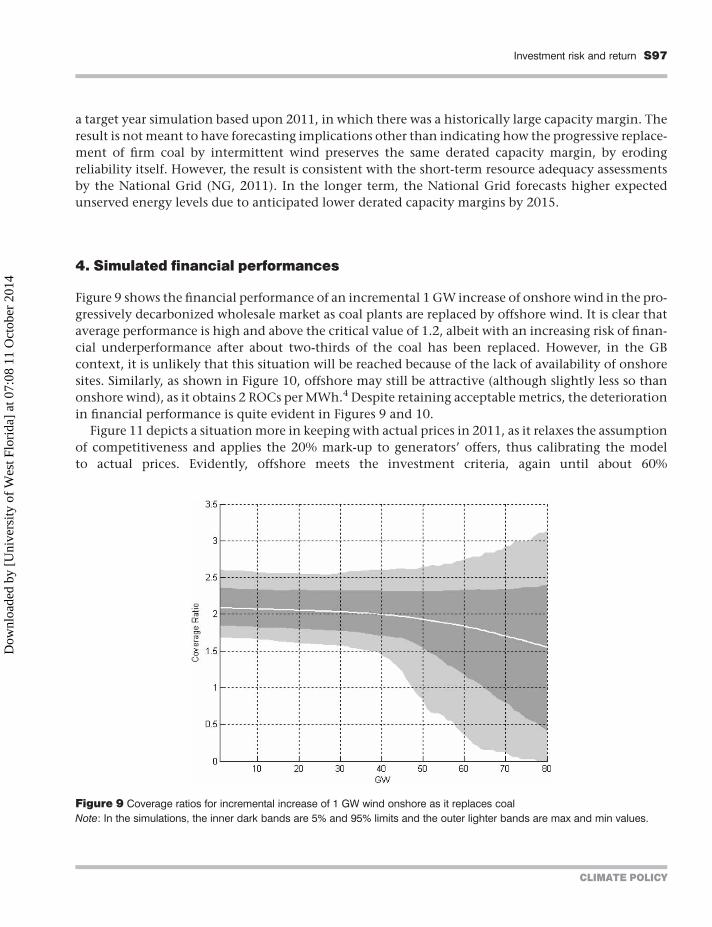
Figure 9 shows the financial performance of an incremental 1 GW increase of onshore wind in the pro-
gressively decarbonized wholesale market as coal plants are replaced by offshore wind. It is clear that
average performance is high and above the critical value of 1.2, albeit with an increasing risk of finan-
cial underperformance after about two-thirds of the coal has been replaced. However, in the GB
context, it is unlikely that this situation will be reached because of the lack of availability of onshore
sites. Similarly, as shown in Figure 10, offshore may still be attractive (although slightly less so than
onshore wind), as it obtains 2 ROCs per MWh.4 Despite retaining acceptable metrics, the deterioration
in financial performance is quite evident in Figures 9 and 10.
Figure 11 depicts a situation more in keeping with actual prices in 2011, as it relaxes the assumption
of competitiveness and applies the 20% mark-up to generators’ offers, thus calibrating the model
to actual prices. Evidently, offshore meets the investment criteria, again until about 60%
Figure 9 Coverage ratios for incremental increase of 1 GW wind onshore as it replaces coalNote: In the simulations, the inner dark bands are 5% and 95% limits and the outer lighter bands are max and min values.
Investment risk and return S97
CLIMATE POLICY
Dow
nloa
ded
by [
Uni
vers
ity o
f W
est F
lori
da]
at 0
7:08
11
Oct
ober
201
4
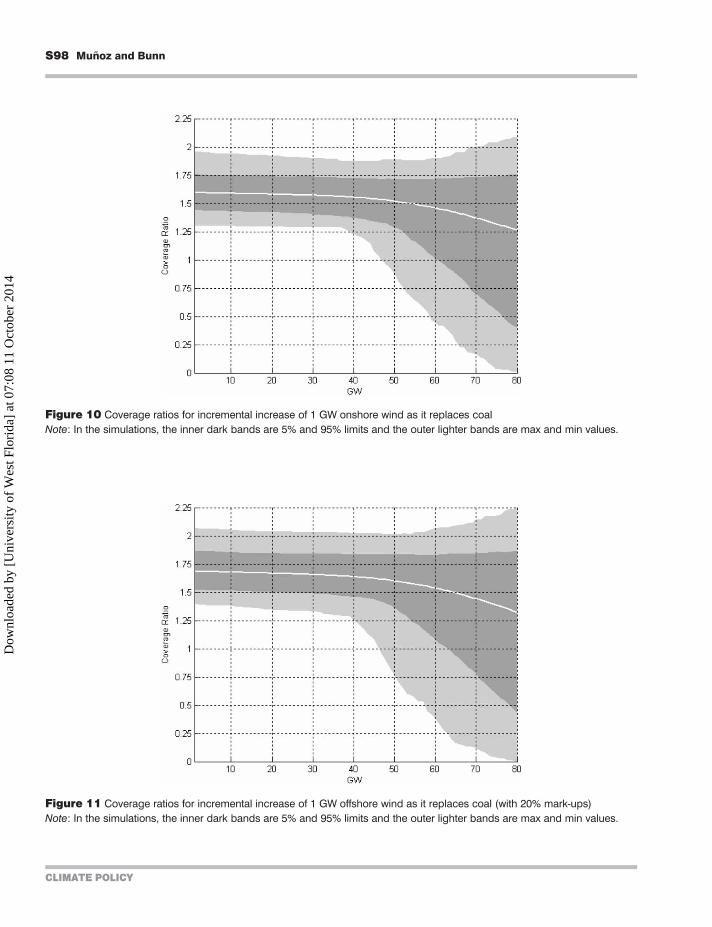
Figure 10 Coverage ratios for incremental increase of 1 GW onshore wind as it replaces coalNote: In the simulations, the inner dark bands are 5% and 95% limits and the outer lighter bands are max and min values.
Figure 11 Coverage ratios for incremental increase of 1 GW offshore wind as it replaces coal (with 20% mark-ups)Note: In the simulations, the inner dark bands are 5% and 95% limits and the outer lighter bands are max and min values.
S98 Munoz and Bunn
CLIMATE POLICY
Dow
nloa
ded
by [
Uni
vers
ity o
f W
est F
lori
da]
at 0
7:08
11
Oct
ober
201
4
decarbonization, and this is consistent with the observed progress of actual active GB offshore invest-
ments in 2011–2012.
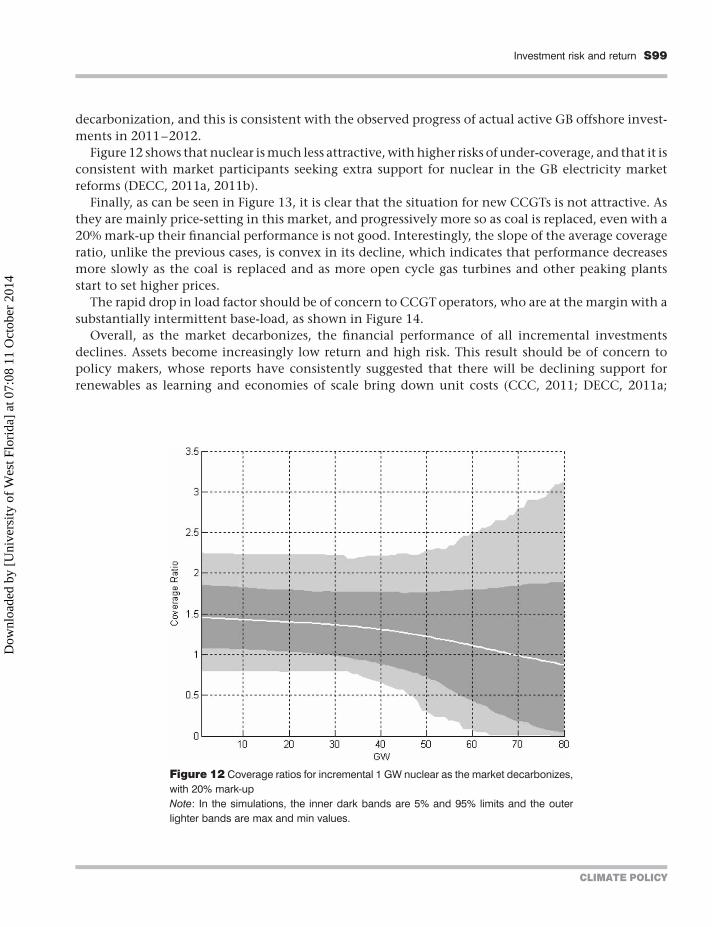
Figure 12 shows that nuclear is much less attractive, with higher risks of under-coverage, and that it is
consistent with market participants seeking extra support for nuclear in the GB electricity market
reforms (DECC, 2011a, 2011b).
Finally, as can be seen in Figure 13, it is clear that the situation for new CCGTs is not attractive. As
they are mainly price-setting in this market, and progressively more so as coal is replaced, even with a
20% mark-up their financial performance is not good. Interestingly, the slope of the average coverage
ratio, unlike the previous cases, is convex in its decline, which indicates that performance decreases
more slowly as the coal is replaced and as more open cycle gas turbines and other peaking plants
start to set higher prices.
The rapid drop in load factor should be of concern to CCGT operators, who are at the margin with a
substantially intermittent base-load, as shown in Figure 14.
Overall, as the market decarbonizes, the financial performance of all incremental investments
declines. Assets become increasingly low return and high risk. This result should be of concern to
policy makers, whose reports have consistently suggested that there will be declining support for
renewables as learning and economies of scale bring down unit costs (CCC, 2011; DECC, 2011a;
Figure 12 Coverage ratios for incremental 1 GW nuclear as the market decarbonizes,with 20% mark-upNote: In the simulations, the inner dark bands are 5% and 95% limits and the outerlighter bands are max and min values.
Investment risk and return S99
CLIMATE POLICY
Dow
nloa
ded
by [
Uni
vers
ity o
f W
est F
lori
da]
at 0
7:08
11
Oct
ober
201
4

Figure 13 Coverage ratios for incremental 1 GW CCGT as the market decarbonizes, with 20% mark-upNote: In the simulations, the inner dark bands are 5% and 95% limits and the outer lighter bands are max and min values.
Figure 14 Working hours for an average CCGT as the target year decarbonizesNote: In the simulations, the inner dark bands are 5% and 95% limits and the outer lighter bands are max and min values.
S100 Munoz and Bunn
CLIMATE POLICY
Dow
nloa
ded
by [
Uni
vers
ity o
f W
est F
lori
da]
at 0
7:08
11
Oct
ober
201
4
EC, 2011; Eurelectric, 2009; RenewableUK, 2011). This adverse risk–return progression will to some
extent counterbalance the expectation of declining support.
Evidently, with further support – e.g. in terms of higher carbon prices, green certificates, feed-in
tariffs, contracts for differences, capacity payments – investment can be motivated with stable
expected returns and constant risk. However, the analysis suggests that there is an increasing need
for policy support as decarbonization progresses, if indeed decarbonization is to be achieved while
retaining competitive prices. Although the fundamental model, as described above, may appear unrea-
listic with its presumption of competitive prices, it is not plausible to assume (if considerable subsidies
and other forms of support are introduced into the market) that market participants will be allowed to
exercise substantial market power by raising prices as well.
However, in the base case, a 20% mark-up gave good calibration to the real data. This exercise of
market power in the real market was apparently feasible (and tolerated by the regulator), even with
an over-supplied market and a relatively (by international standards) un-concentrated generating
sector (Herfindahl–Hirschman Index around 900). Mark-ups on the mid merit and peaking technol-
ogies will increase the average returns pro rata, to the extent that they remain price-setting.
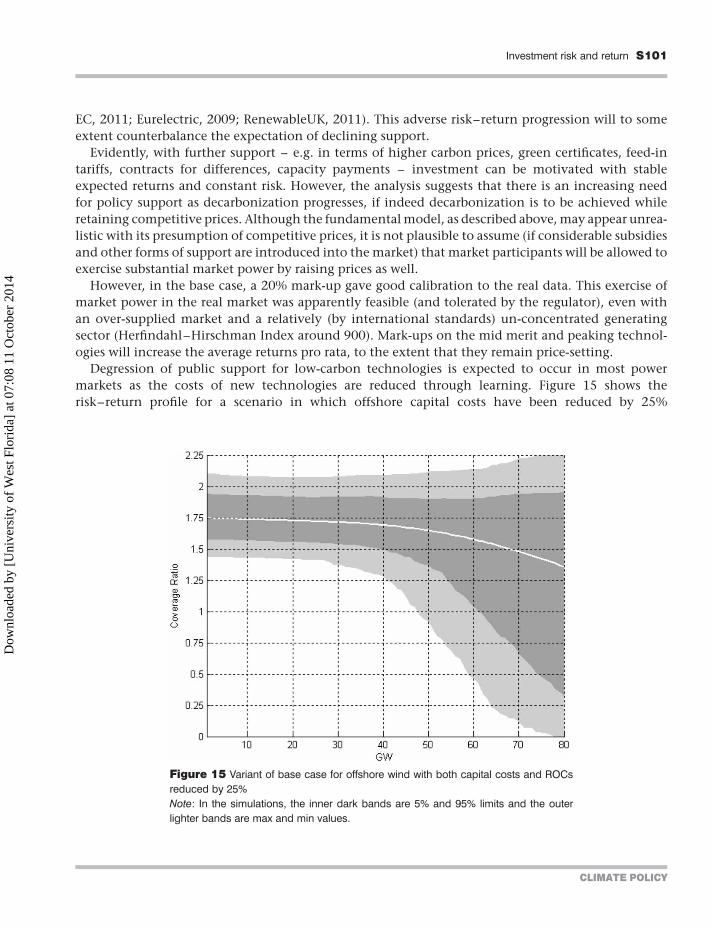
Degression of public support for low-carbon technologies is expected to occur in most power
markets as the costs of new technologies are reduced through learning. Figure 15 shows the
risk–return profile for a scenario in which offshore capital costs have been reduced by 25%
Figure 15 Variant of base case for offshore wind with both capital costs and ROCsreduced by 25%Note: In the simulations, the inner dark bands are 5% and 95% limits and the outerlighter bands are max and min values.
Investment risk and return S101
CLIMATE POLICY
Dow
nloa
ded
by [
Uni
vers
ity o
f W
est F
lori
da]
at 0
7:08
11
Oct
ober
201
4

(to £1687/kW) and ROCs have been reduced accordingly (to 1.5). A similar pattern emerges in Figure 15
as in Figure 10. Of course, to reach 25% reductions in both capital costs and subsidies, a substantial
number of installations would be needed. If this were to amount to a replacement of about 20 GW
of the 26 GW of coal with an equivalent derated amount of wind (i.e. 60 GW), before such learning
economics materialized the risk–return profile for the incremental wind investment would be as unat-
tractive at 60 GW in Figure 14 as in Figure 10. Thus, if degression of policy support simply follows
capital costs as the market decarbonizes, the attractiveness of financial performance in terms of
risk–return of marginal investments at a constant level will not be maintained.
5. Conclusion
Decarbonization of a wholesale power market, such as that in Great Britain, appears to be associated,
ceteris paribus, with a greater progressive deterioration in the financial risk–return profile of new and
existing assets than has been envisaged in the various pathways studies. Policy analysis is generally
based upon a careful evaluation of levelized costs for different technologies, which leads to an analysis
of the support that might be needed to incentivize the adoption of these technologies by investors.
However, the market and other risks that affect the financial performance of new assets have rarely
been explicitly taken into account in such a way that lenders and ratings agencies may evaluate
their prospects.
Using a detailed price formation model of the GB market, which was based upon fundamentals and
calibrated to 2011 data, risk and return was estimated through Monte Carlo simulations of all key par-
ameters, and it was shown that investors have a reduced propensity to engage in incremental invest-
ments. Although the specific parametric assumptions of market simulations such as those used in
this study are always subject to cautious interpretation, the underlying fundamentals identified here
clearly indicate that particular investments in the near and longer terms face a deteriorating risk–
return profile over their asset lives if decarbonization progresses as deeply as policy targets have so
far envisaged. The results reported here suggest that it is inevitable that this trend will lead to require-
ments for higher centrally administered support if capital costs and other parameters remain constant.
It is an open question whether this deteriorating trend with increased renewable penetration can be
mitigated or even reversed through the expected capital expenditure reductions of new technology
learning. The specification of the risk simulation, target year model used here is, on balance, a cautious
one. Essentially, it focuses upon the intra-year risk in operational profit contribution, relative to annui-
tized financing cost. On the one hand, the model does not allow speculation regarding how the average
parameter values used for the intra-year simulations will evolve over time. For gas and carbon, in par-
ticular, the stochastic evolution of these mean values will in practice add a lot more risk to the financial
evaluation over the lifetimes of the new assets. On the other hand, an interpretation based upon the
coverage ratio risk for an individual year may be too restrictive. Although companies may be averse
to the risk of presenting inferior annual performance, even ratings agencies tend to take a three- to
five-year view of corporate performance. Finally, although the financial performance analyses were
based upon full debt financing for analytical convenience, with lower levels of gearing, considerations
of return on equity will be just as crucial to investors in the long run, and usually at higher levels of
return than the cost of debt. Evidently, the high level of project risk indicated in this analysis has
S102 Munoz and Bunn
CLIMATE POLICY
Dow
nloa
ded
by [
Uni
vers
ity o
f W
est F
lori
da]
at 0
7:08
11
Oct
ober
201
4
implications for the type of investor who may be attracted to such projects. From a market structure
perspective, large incumbent portfolio generators with strong retail markets will be better placed
than small new-entrant independent power producers. Market concentration appears both necessary
(to achieve long-run marginal costs) and inevitable (given the increasing risks). If the markets become
more concentrated as a result of these increased risk management needs, then climate and regulatory
policy makers will face increasingly inter-related and serious challenges to incentivize sufficient low-
carbon investment, preserve energy security, and mitigate the abuse of market power.
An extra ingredient that affects the pathway to decarbonization, and which has not so far received
significant attention, has been identified. In practice, endogenous interventions will emerge if energy
policies and market performances do not remain attractive to both governments and market partici-
pants. The target year analysis, which holds all parameters constant except for the replacement of
coal by wind, has been useful in isolating the debt coverage risk effect, but has not provided insights
into the rational consequences of the identified risks. Governments may take on more of the funda-
mental risks, so as to make renewable investments more attractive. Markets may become less volatile
through increased interconnections with neighbouring markets, more storage, and greater demand-
side engagement. Evidently, policy will evolve, infrastructures may change radically, and corporate
strategies will adapt. There are numerous pathways studies that have explored such scenarios. In
this article, we have suggested that financial investment risk should become a more important ingre-
dient in their evaluations. According to scenarios, the markets could become more or less risky.
Acknowledgement
The authors would like to acknowledge the support of UKERC (UK Energy Research Centre, London)
and EPRI (Electric Power Research Institute, California) in this research.
Notes
1. Northern Ireland is a separate market and is fully integrated with that of the Republic of Ireland.
2. Such longer-term uncertainties substantially affect investment analyses, but are invariably evaluated using scen-
arios and sensitivity analysis rather than probabilistic simulations. Essentially, these uncertainties set the mean
values for each year. The target year risk simulations analysed here are calibrated to intra-year variations around
such mean values.
3. Onshore earned 1 ROC per MWh, and offshore earned 2 ROC per MWh.
4. By contrast, one variation with 1.5 ROCS/MWh, as in 2010, showed unattractive financial performance on these
metrics after approximately 10% decarbonization. This is consistent with the reasons why the offshore ROCs
were increased from 1.5 to 2 in 2011.
References
Awerbuch, S. (2006). Portfolio-based electricity generation planning: Policy implications for renewables and energy
security. Mitigation and Adaptation Strategies for Global Change, 11, 693–710.
CCC. (2011). Renewable energy review. London: Author. Retrieved from http://www.theccc.org.uk/reports/
renewable-energy-review
Investment risk and return S103
CLIMATE POLICY
Dow
nloa
ded
by [
Uni
vers
ity o
f W
est F
lori
da]
at 0
7:08
11
Oct
ober
201
4
CPI. (2011). The impacts of policy on the financing of renewable projects: A case study analysis. San Francisco, CA: Author.
Retrieved from http://climatepolicyinitiative.org/publication/the-impacts-of-policy-on-the-financing-of-
renewable-projects-a-case-study-analysis/
DECC. (2011a). Electricity market reform (EMR) White paper. London: Department of Energy and Climate Change, UK
Government. Retrieved from http://www.decc.gov.uk/en/content/cms/legislation/white_papers/emr_wp_
2011/emr_wp_2011.aspx
DECC. (2011b). Electricity. In Digest of United Kingdom energy statistics (pp. 117–158). London: National Statistics.
Retrieved from http://www.decc.gov.uk/assets/decc/11/stats/publications/dukes/2307-dukes-2011-chapter-5-
electricity.pdf
EC. (2011). Energy roadmap 2050. COM (2011) 885/2. Brussels: Author.
Eurelectric. (2009). Power choices (Report). Brussels: Author.
Fleten, S.-E., & Ringen, G. (2009). New renewable electricity capacity under uncertainty: The potential in Norway.
Journal of Energy Markets, 2, 71–88.
Fortin, I., Fuss, S., Hlouskova, J., Khaborov, N., Obersteiner, M., & Szolgayova, J. (2008). An integrated CVaR and real
options approach to investments in the power sector. Journal of Energy Markets, 1, 61–86.
Gowrisankaran, G., Reynolds, S. S., & Samano, M. (2011). Intermittency and the value of renewable energy (Working
Paper No. 17086). Cambridge, MA: National Bureau of Economic Research. Retrieved from www.nber.org/
papers/w17086.pdf
Green, R., & Vasilakos, N. (2010). Market behaviour with large amounts of intermittent generation. Energy Policy,
38, 3211–3220.
Greenacre, P., Gross, R., & Heptonstall, P. (2010). Great expectations: The cost of offshore wind in UK waters – Under-
standing the past and predicting the future. London: UK Energy Research Centre.
Henriques, I., & Sadorsky, P. (2008). Oil prices and the stock prices of alternative energy companies. Energy
Economics, 30, 998–1010.
Hirth, L. (2012). The market value of variable renewables. (Working Paper 15.2012). Milan: Fondazione Eni Enrico
Mattei. Retrieved from http://www.feem.it/userfiles/attach/201239103124NDL2012-015.pdf
Hossain, J., Sinha, V., & Kishore, V. V. N. (2011). A GIS based assessment of potential for windfarms in India.
Renewable Energy, 36, 3257–3267.
Joskow, P. (2012). Comparing the costs of intermittent and despatchable electrcity generation technologies. Amer-
ican Economic Review, 100, 238–241.
Kettunen, J., Bunn, D. W., & Blyth, W. (2011). Investment propensities under carbon policy uncertainty. The Energy
Journal, 32, 77–118.
Keppo, J., & Lu, H. (2003). Real options and a large producer: The case of electricity markets. Energy Economics, 25,
459–472.
Kusiak, A. (2008). Energy output [Lecture Notes]. Iowa City, IA: Intelligent Systems Laboratory, University of Iowa.
Retrieved from http://css.engineering.uiowa.edu/~ie_155/Lecture/Energy_Output.pdf
Moody’s. (2009). Unregulated utilities and power companies. (Report). Moody’s. Retrieved from www.moodys.com
Mott MacDonald. (2010). UK electricity generation costs update. Brighton: Mott MacDonald. Retrieved from http://
www.decc.gov.uk/assets/decc/statistics/projections/71-uk-electricity-generation-costs-update-.pdf
National Grid. (2011). 2011 National Electricity Transmission System (NETS) seven year statement. Retrieved from
http://www.nationalgrid.com/uk/Electricity/SYS/
Obersteiner, C., & Saguan, M. (2010). Parameters influencing the market value of wind power – A
model-based analysis of the Central European Power market. European Transactions on Electrical Power, 21,
1856–1868.
Poyry. (2009). Impact of intermittency: How wind variability could change the shape of the British and the Irish electricity
markets (Summary Report). Oxford: Poyry Energy.
Redpoint. (2007). Dynamics of GB electricity generation investment. London: Redpoint Energy.
RenewableUK. (2011). Offshore wind. Retrieved from www.renewableUK.com
S104 Munoz and Bunn
CLIMATE POLICY
Dow
nloa
ded
by [
Uni
vers
ity o
f W
est F
lori
da]
at 0
7:08
11
Oct
ober
201
4
Reuter, W. H., Fuss, S., Szolgayova, J., & Obersteiner, M. (2012). Investment in wind power and pumped storage in a
real options model. Renewable and Sustainable Energy Reviews, 16, 2242–2248.
Saenz de Miera, G., del Rıo Gonzalez, P., & Vizcaıno, I. (2008). Analysing the impact of renewable electricity support
schemes on power prices: The case of wind electricity in Spain. Energy Policy, 36, 3345–3359.
Sensfuß, F., Ragwitz, M., & Genoese, M. (2008). The merit-order effect: A detailed analysis of the price effect of
renewable electricity generation on spot market prices in Germany. Energy Policy, 36, 3076–3084.
Sinden, G. (2007). Characteristics of the UK wind resource: Long term patterns and relationship to electricity
demand. Energy Policy, 35, 112–127.
Yang, M., Blyth, W., Bunn, D. W., Bradley, R., Clarke, C., & Wilson, T. (2008). Evaluating power investment options
with uncertainty in climate policy. Energy Economics, 30, 1933–1950.
Zonneveld, P., Papaefthymiou, G., Coster, E., & van der Sluis, L. (2008). Calculation of grid losses with the aid of
stochastic modeling of wind turbines and loads. In 16th Power Systems Computation Conference 2008 (Vol. 2,
pp. 1295–1302). Glasgow: Curran Associates.
Investment risk and return S105
CLIMATE POLICY
Dow
nloa
ded
by [
Uni
vers
ity o
f W
est F
lori
da]
at 0
7:08
11
Oct
ober
201
4