investment process & performance
DESCRIPTION
ÂTRANSCRIPT
1Tanglewood Wealth Management, Inc. | February 2015
Asset Allocations and Model Portfolios 3
Historical Risk/ Rewards 4-5
Benchmarks and Horserace Charts 6-7
Investment Selections 8
Faceoff Charts 9
Track Record 10-11
Disclosure Statement Backcover
Copyright 2015 by Tanglewood Wealth Management, Inc. Rights of reproduction and distribution are reserve to the publisher.
Investment Process and Performance
The Performance You Want … the Security You Need

Tanglewood Wealth Management, Inc. | February 2015

Tanglewood Wealth Management, Inc. | February 2015 3
Asset Allocation: Model Portfolios
Moderate Portfolio
At the formation of Tanglewood in 1979, the investment world’s watchword for controlling risks was “diversification.” Although fine as a concept, it lacked any rigor or common definition.
That began to change with Gary Brinson’s report in The Financial Analysts Journal (July/August 1986). In it, he described the results of a study of institutional accounts over the prior 20 years. His ground breaking insight was that approximately 90% of their investment results over that 20 year period was from their percentage holdings in the various asset classes (types of investments) versus their individual security selection. “Asset allocation,” he discovered, was the prime driver of both risk and reward in portfolios.
Unlike simply diversifying, an unquantifiable approach, asset allocations can be structured, measured and compared. It cannot be over emphasized that the selection of asset classes and the proportions decided upon are the primary determinant of any portfolio’s performance.
Between 1988 and 1990, Tanglewood thoroughly researched the history of both asset classes and asset allocations. The result of our studies led to the development of our Model Portfolios. This became the basic structure of our investing process on January 1, 1991. Originally, four different model portfolios were developed that
best represented four different investor profiles. • Conservative – high long-term return
consistent with 1⁄4 of stock market risk.•Moderate – high long-term term return
consistent with 1⁄2 of stock market risk.•Growth – high long-term term return
consistent with 2⁄3 of stock market risk.•All Equity – high long-term term return
consistent with full stock market risk.We are extremely proud of the fact that all four of our original asset allocations (with only one minor change in 2010) have met both their risk and return objectives over the past 25 years. This can be seen in updated copies of our Historical Risk/Reward Charts. (See Moderate Risk/Reward Chart on page 5.)
There are significant advantages to investing with the structure of one of our Model Portfolios:
• Predictability of risk relative to the markets.
•Quantifiable long-term return projections relative to either inflation or riskless securities (Treasury bills).
•Definable levels of income over a full retirement.
•A discipline that can be adhered to in changing circumstances and market conditions.
Normal Asset Class Weightings
US Stocks 27%
Bonds 40%
Cash 8%
Gold 5%Real Estate 3%
Int’l Stocks (Developed & Emerging
Markets) 17%
Tanglewood Wealth Management, Inc. | February 2015 4
Historical Risk/Reward ChartTM
Moderate Portfolio*
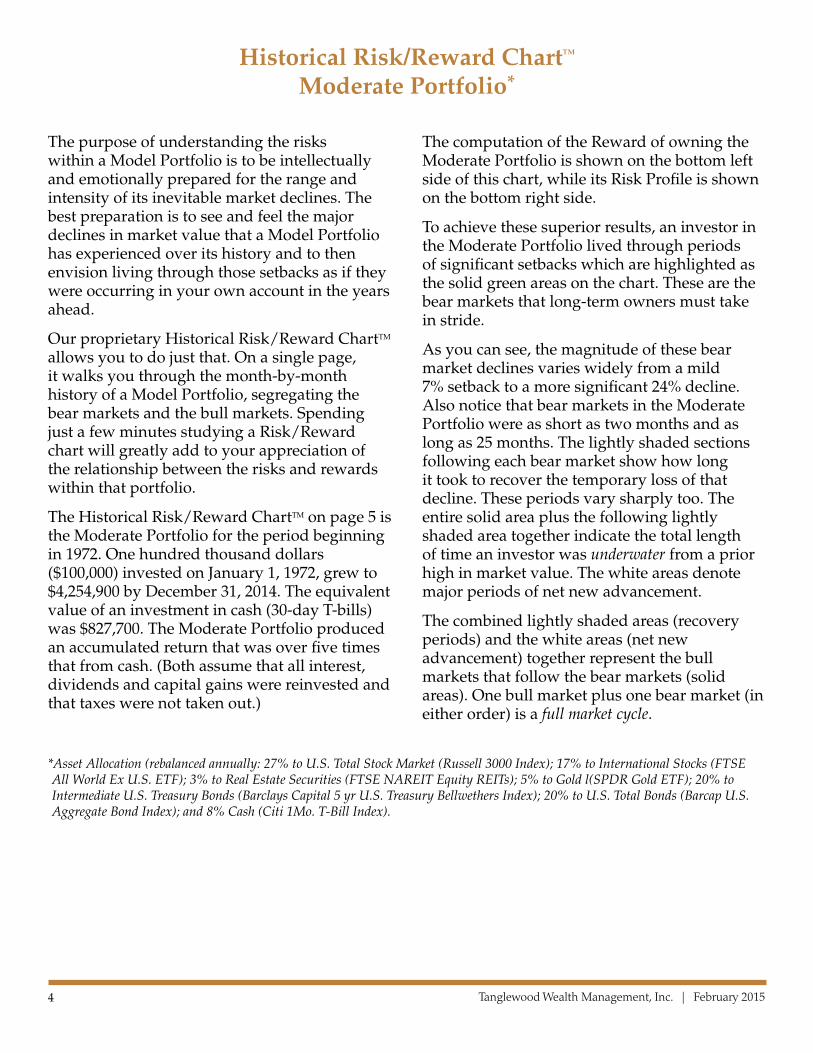
The purpose of understanding the risks within a Model Portfolio is to be intellectually and emotionally prepared for the range and intensity of its inevitable market declines. The best preparation is to see and feel the major declines in market value that a Model Portfolio has experienced over its history and to then envision living through those setbacks as if they were occurring in your own account in the years ahead.
Our proprietary Historical Risk/Reward ChartTM allows you to do just that. On a single page, it walks you through the month-by-month history of a Model Portfolio, segregating the bear markets and the bull markets. Spending just a few minutes studying a Risk/Reward chart will greatly add to your appreciation of the relationship between the risks and rewards within that portfolio.
The Historical Risk/Reward ChartTM on page 5 is the Moderate Portfolio for the period beginning in 1972. One hundred thousand dollars ($100,000) invested on January 1, 1972, grew to $4,254,900 by December 31, 2014. The equivalent value of an investment in cash (30-day T-bills) was $827,700. The Moderate Portfolio produced an accumulated return that was over five times that from cash. (Both assume that all interest, dividends and capital gains were reinvested and that taxes were not taken out.)
The computation of the Reward of owning the Moderate Portfolio is shown on the bottom left side of this chart, while its Risk Profile is shown on the bottom right side.
To achieve these superior results, an investor in the Moderate Portfolio lived through periods of significant setbacks which are highlighted as the solid green areas on the chart. These are the bear markets that long-term owners must take in stride.
As you can see, the magnitude of these bear market declines varies widely from a mild 7% setback to a more significant 24% decline. Also notice that bear markets in the Moderate Portfolio were as short as two months and as long as 25 months. The lightly shaded sections following each bear market show how long it took to recover the temporary loss of that decline. These periods vary sharply too. The entire solid area plus the following lightly shaded area together indicate the total length of time an investor was underwater from a prior high in market value. The white areas denote major periods of net new advancement.
The combined lightly shaded areas (recovery periods) and the white areas (net new advancement) together represent the bull markets that follow the bear markets (solid areas). One bull market plus one bear market (in either order) is a full market cycle.
*Asset Allocation (rebalanced annually: 27% to U.S. Total Stock Market (Russell 3000 Index); 17% to International Stocks (FTSE All World Ex U.S. ETF); 3% to Real Estate Securities (FTSE NAREIT Equity REITs); 5% to Gold l(SPDR Gold ETF); 20% to Intermediate U.S. Treasury Bonds (Barclays Capital 5 yr U.S. Treasury Bellwethers Index); 20% to U.S. Total Bonds (Barcap U.S. Aggregate Bond Index); and 8% Cash (Citi 1Mo. T-Bill Index).

Tanglewood Wealth Management, Inc. | February 2015 5
Historical Risk/Reward ChartTM
Tanglewood Moderate PortfolioGrowth of $100,000 (12/31/71-12/31/14)
↑ ↓ Up or Down Month Cyclical Declines Recovery (to pre-decline level) Net New Advancement
REWARD RISK PROFILE
Average Annual Return (1972-2014) 9.1% Average Bear Market Decline <12.0%>Riskless Return (T-bills) < 5.0%> Worst Bear Market Decline <24.0%>AVERAGE ANNUAL REWARD OF 4.1% $100,000 invested in U.S. Treasury bills over this MODERATE BENCHMARK PORTFOLIO time period grew to $827,700.
+107% 64 mo.
+250% 89 mo.
+38% 32 mo.
+158% 93 mo.
+30% 24 mo.
+11% 12 mo.
<19%> 21 mo.
<8%> 2 mo.
<7%> 2 mo.
<12%> 25 mo.
<14%> 3 mo.
<8%> 2 mo.
Historical Risk/Reward ChartModerate Benchmark Portfolio*
Growth of $100,000 — (12/31/71 – 12/31/13)
+67% 61 mo.
<8%> 5 mo.
<24%> 16 mo.
$4,254,900
$3,223,400$3,489,300
$2,333,100
Year Jan Feb Mar Apr May Jun Jul Aug Sep Oct Nov Dec AnnualReturns
1972 $100,000 ↑ ↑ ↑ ↑ ↑ ↓ ↑ ↑ $111,400 11.4%1973 -6.91974 $90.600 ↑ ↑ ↓ -8.31975 ↑ ↑ ↑ ↑ ↑ ↑ ↓ ↓ ↓ ↑ ↑ ↑ 24.71976 ↑ ↑ ↑ ↑ ↓ ↑ ↑ ↑ ↑ ↓ ↑ ↑ 19.51977 ↓ → ↑ ↑ → ↑ ↓ ↓ ↑ ↑ 3.61978 ↓ ↑ ↑ ↑ ↑ ↑ ↑ ↑ ↑ ↓ ↑ ↑ 9.81979 ↑ ↓ ↑ ↑ ↑ ↑ ↑ ↑ ↑ ↓ ↑ ↑ 13.81980 $187,300 ↑ ↑ ↑ ↑ ↓ ↑ ↑ ↑ ↓ 16.71981 ↓ ↓ ↑ ↓ ↑ ↓ ↓ ↓ $20↓000 ↑ ↑ ↓ 3.51982 ↓ ↓ ↓ ↑ ↓ ↓ ↑ ↑ ↑ ↑ ↑ ↑ 20.31983 ↑ ↑ ↑ ↑ ↑ ↑ ↓ ↑ ↑ ↓ ↑ ↑ 15.11984 ↑ ↓ ↑ ↓ ↓ ↑ ↑ ↑ ↑ ↑ 9.51985 ↑ ↓ ↑ ↑ ↑ ↑ ↑ ↑ ↓ ↑ ↑ ↑ 27.71986 ↑ ↑ ↑ ↑ ↑ ↑ ↓ ↑ ↓ ↑ ↑ ↓ 20.31987 ↑ ↑ ↑ ↓ ↑ ↑ ↑ $603,700 $519,700 ↑ 4.21988 ↑ ↑ ↑ ↑ ↓ ↑ ↓ ↓ ↑ ↑ ↓ ↑ 13.11989 ↑ ↓ ↑ ↑ ↑ ↓ ↑ ↓ ↑ ↑ 17.51990 ↓ ↓ ↓ ↓ ↑ ↑ $719,000 ↑ ↑ ↑ -1.41991 ↑ ↑ ↑ ↑ ↑ ↓ ↑ ↑ ↑ ↑ ↓ ↑ 21.31992 ↓ ↑ ↓ ↑ ↑ ↓ ↑ ↑ ↑ ↓ ↑ ↑ 5.61993 ↑ ↑ ↑ ↑ ↑ ↑ ↑ ↑ ↑ ↑ ↓ ↑ 12.81994 ↑ ↓ ↓ ↑ ↑ ↑ ↓ ↑ ↓ ↑ -0.21995 ↑ ↑ ↑ ↑ ↑ ↑ ↑ ↑ ↑ ↓ ↑ ↑ 21.81996 ↑ ↑ ↑ ↑ ↑ → ↓ ↑ ↑ ↑ ↑ ↓ 10.81997 ↑ → ↓ ↑ ↑ ↑ ↑ ↓ ↑ ↓ ↑ ↑ 15.41998 ↑ ↑ ↑ ↑ ↓ $1,711,400 ↑ ↑ ↑ ↑ 13.91999 ↑ ↓ ↑ ↑ ↓ ↓ ↓ ↑ ↑ ↑ 9.92000 ↓ ↑ ↑ ↓ ↓ ↑ ↓ $2,067,000 1.82001 -2.22002 $1,825,900 ↑ ↑ ↓ -4.22003 ↓ ↓ ↑ ↑ ↑ ↑ ↑ ↑ ↑ ↑ ↑ ↑ 18.32004 ↑ ↑ ↑ ↓ ↑ ↑ ↓ ↑ ↑ ↑ ↑ ↑ 8.92005 ↓ ↑ ↓ ↓ ↑ ↑ ↑ ↓ ↑ ↑ 4.52006 ↑ ↑ ↑ ↑ ↓ ↑ ↑ ↑ ↑ ↑ ↑ ↑ 11.32007 ↑ ↑ ↑ ↑ ↑ ↓ ↓ ↑ ↑ $3,050,300 7.22008 -13.52009 ↑ ↑ ↑ ↓ ↑ ↑ ↑ ↓ ↑ ↑ 14.42010 ↓ ↑ ↑ ↑ ↓ ↓ ↑ ↓ ↑ ↑ ↓ ↑ 11.42011 ↑ ↑ ↑ ↑ ↓ ↓ 2.12012 ↑ ↑ ↑ ↑ ↓ ↑ ↑ ↑ ↑ ↓ ↑ ↑ 9.82013 ↑ ↑ ↑ ↑ ↓ ↓ ↑ ↓ ↑ ↑ ↑ ↑ 9.22014 ↓ ↑ ↓ ↑ ↑ ↑ ↓ ↑ ↓ ↑ ↑ 5.2%
Total Return: Includes dividends, interest and capital gains reinvested Standard Deviation: 9.1

Tanglewood Wealth Management, Inc. | February 2015 6
Benchmarks and the Horserace
The best measurement of each Model Portfolio’s risks and returns is its Benchmark. A benchmark simply utilizes the most appropriate index to represent each asset class within the Model Portfolio’s asset allocation and then adds those index returns to get a total return. (Purely replicating a benchmark with index funds will almost always ensure underperformance due to fund fees and expenses.)
Benchmarks offer multiple advantages:•They are simple to construct and follow.•They track the Model Portfolios closely.• They represent the full reward as well as the
full risk of each Model Portfolio.
Horserace. This is a term that we use to make a point about the performance race. We picture investing as a long, never ending horse race. Every asset class, every sector, every investment style (growth, value, etc.) is in the race. At any particular point in time, some will be leading, others will be in the pack and still others lagging. However, as the race goes on, the leadership will change. Leaders become laggards and vice versa. Nothing leads forever! (See Horserace Chart on the following page.) This ever changing investment environment is what makes a stable asset allocation process so vital as a basic structure.
At Tanglewood, our Benchmarks serve as a guide. Over the long-term, we want to deliver the full reward (or more) of each Model Portfolio’s Benchmark (after fees and costs). However, we also want to deliver that return with less volatility.
The only way we can accomplish those goals is to cautiously adjust our portfolios in ways we feel enhance the risk/reward characteristics of our portfolios versus their Benchmark. Depending on market conditions, this could take one or more forms:
• Overweighting asset classes perceived as attractive. (horserace leaders and future leaders)
• Underweighting asset classes that appear unattractive. (laggards and tired leaders)
• Accenting sectors that have unusually appealing attributes.
• Choosing superior mutual fund managers with desirable traits. (See page 8.)
However, we never stray too far from Benchmark weightings and characteristics. At the end of the day, we want to deliver the long-term assurances of our Model Portfolios. This is our fundamental objective.
It is important to understand that we will not “beat the benchmark” every quarter or even every year. There are times when we do not deem it responsible to accept the full risk of the Benchmark even if it means potentially sacrificing some current returns. Other times, we will accept more risk than the Benchmark, when we see the potential for higher returns with little additional risk.

Tanglewood Wealth Management, Inc. | February 2015 7
Horserace Chart Ranking of Investment Asset Classes from Best to Worst Over the Years

Tanglewood Wealth Management, Inc. | February 2015 8
Investment Selections
Whereas asset allocation provides the structure (and discipline) of our portfolios and the “horserace” provides strategy, the final step is to make specific selections among the many various investments to implement or fill out our portfolios.
Asset allocation, by its nature, necessitates broad ownership of the securities within each asset class to insure capturing its risk and reward characteristics. Therefore, we utilize investment funds (mutual funds, index funds and ETFs) to provide broad diversification within each asset class.
Index Funds and ETFs. These are two distinctly different funding vehicles but with the same general goal – passive, low cost investing. “Passive” means investing in a predefined investment mix with no active management. The investment mix may be that of an entire asset class (Total U.S. Stock Market) or a sector of the market (Health Care, Utilities, etc.). Such funds are available at very low cost.
The difference between index funds and ETFs is that index funds can only be bought and sold at the close of the market each day, while ETFs trade continuously throughout the trading day. Index funds tend to track the underlying index a bit more accurately than a similar ETF, while ETFs are in general slightly more tax efficient.
Managed Mutual Funds. Actively managed mutual funds also invest widely within their intended asset classes. Managed mutual funds offer the expertise of a manager to select the
securities within an asset class that meets his/her criteria for optimal risk/reward characteristics.
Since 1960, actively managed U.S. equity funds as a whole have performed slightly better than the total U.S. stock market index before fees, slightly worse after fees. There have been years during that period where managed funds (Ex: 2000 – 2002) well outperformed index funds and years where index funds well outperformed active management (Ex: 2012-2014).
Tanglewood Selections. We build out our asset allocation portfolios with both index funds and actively managed funds. Index funds and ETFs serve as an anchor for each asset class, capturing the asset class return at very low cost. As of the beginning of 2015, between 25% to 35% of each asset class is indexed. This leaves less room for any material underperformance.
With actively managed mutual funds, we concentrate on those proven managers who have well outperformed over their entire tenure. From this group we currently employ those who we feel offer the best combination of risk and reward (individually and as a group) in the current market environment. In the 1990s this meant “growth” managers, in the early 2000s it was “value” managers and in the mid 2000s it was emerging markets/commodity oriented managers. Since the beginning of the financial crisis, we have leaned heavily on “defensive winners” who perform especially well in bearish environments.

Tanglewood Wealth Management, Inc. | February 2015 9
Evaluating Active Managers: Face-Off Charts
When evaluating actively managed mutual funds, one must look for those funds that have consistently added value to the index returns of the asset class within which they invest. The key word is consistently.
The bottom line is simply this: funds cannot be considered “superior” until they have
proven their ability to outperform their relevant benchmark over at least one full market cycle (one bull market plus one bear market). The more full cycles of continuous outperformance by a manager, the more confidence you can develop in their ability to keep delivering superior long-term performance. Two examples follow.
Face-Off: FPA Crescent vs Russell 3000 (July 1998-Dec 2014)
Face-Off: First Eagle Overseas vs FTSE All World Ex US (Nov 1994-Dec 2014)
FPA Crescent Fund Russell 3000 (Total US Stock Mkt)
Bull & Bear Market Periods Performance Performance
Mar 2009 4 Dec 2014* Recovery & Bull Market 124% 224%
Nov 2007 4 Feb 2009 Financial Crisis Bear Market -25% -51%
Oct 2002 4 Oct 2007 Recovery & Bull Market 96% 116%
Sep 2000 4 Sep 2002 Dot Com Crash Bear Market 34% -44%
Sep 1998 4 Aug 2000 Recovery & Bull Market 8% 67%
Jul 1998 4 Aug 1998 Asian Flu Bear Market -14% -17%
July 1998 4 Dec 2014 Total Gain 310% 164%
Annualized Gain 8.9% 6.1%
First Eagle Overseas FTSE All World Ex US
Bull & Bear Market Periods Performance Performance
Mar 2009 4 Dec 2014* Recovery & Bull Market 95% 121%
Nov 2007 4 Feb 2009 Financial Crisis Bear Market -32% -57%
Oct 2002 4 Oct 2007 Recovery & Bull Market 208% 248%
Jan 2000 4 Sep 2002 Dot Com Crash Bear Market 14% -45%
Oct 1998 4 Dec 1999 Recovery & Bull Market 43% 60%
May 1998 4 Sep 1998 Asian Flu Bear Market -15% -16%
Dec 1997 4 Apr 1998 Recovery & Bull Market 12% 15%
Aug 1997 4 Nov 1997 Asian Flu 1 Bear Market -8% -12%
Mar 1995 4 July 1997 Recovery & Bull Market 47% 40%
Nov 1994 4 Feb 1995 Interest Rates Rise Bear Market -4% -9%
Nov 1994 4 Dec 2014 Total Gain 721% 213%
Annualized Gain 11% 5.8%
Bull market periods Bear market periods Note percentage gains are compounded returns.
FPA Crescent is an actively managed domestic equity mutual fund we have owned in our portfolios since the 1990s. It has delivered outstanding performance relative to the total U.S. Stock Market (Russell 3000 Index) over that period with its 8.9% average annual return vs. the index’s 6.1%. Yet in this bull market, as in the two prior ones, it has lagged the index. We refer to this type of fund as a Defensive Winner.
First Eagle Overseas is an actively managed international equity mutual fund we have owned since its inception (prior to that we owned its sister global fund). Basically the same comments made about FPA Crescent apply to this fund. It has been a major long-term outperformer, but has underperformed in this (and prior) bull market periods.
(We have a Face Off Chart for each of our managed mutual funds. Please contact our office to request a full set.)

Tanglewood Wealth Management, Inc. | February 2015 10
Track Record
Tanglewood has a track record that is audited back to January 1, 1999 (our audit period). It covers not only our four original Model Portfolios but also two additions that were added after 1991: Moderately Conservative and Moderate Growth.
We are proud of the fact that we have met our primary goal over that period – higher returns (net of fees). These are verified in our full audit reports which are available on request. (See Disclosures on the backcover.)
Along with virtually every other investment manager, we have not outperformed our benchmarks in every period. The three year period ending 12/31/14 is such a period. In that three year period we slightly underperformed our benchmarks, as we chose to take less than fully invested risks. Our risk aversion was in the form of leaning heavily on “Defensive Winners” such as those shown on page 9.
Note: There are a host of reasons why we chose to be very defensive in that period, including: the very weak economic recovery; poor U.S. political leadership; the manipulation of money (QE programs), artificially low interest rates; the potential for major disruption in both Europe and China; and more. In other words, an unprecedented and uncertain investment environment.
Our underperformance in the 2012-2014 period may have felt worse than it was because of the
outstanding performance of one particularly visible asset class — U.S. stocks. All globally diversified asset allocations — not just ours — appeared to deliver relatively low returns in that period. Asset allocations will always perform worse than the best performing single asset class, but that period was unusual by how wide the gap was between U.S. Stocks and most other asset classes.
•On the other hand, U.S. stocks produced a very different relative performance for the full audit period.
•Comparing the well-known S&P 500 Index of U.S. stocks to Tanglewood’s net results, we find that $1,000,000 invested in each provided the following results over that period: • S&P 500 Index
(total return) grew to $2,256,406 • TWM Conservative composite $2,336,363•TWM Moderate composite $2,509,145•TWM Growth composite $2,772,806•TWM All Equity composite $2,935,628
At least in this period, even our slowest turtle (Conservative Portfolios) beat the hare. This will obviously not always be the case. Yet, over much longer time periods, our Growth Benchmark has performed in line with the S&P 500 with only 2⁄3 the risk.
Tanglewood Wealth Management, Inc. | February 2015 11
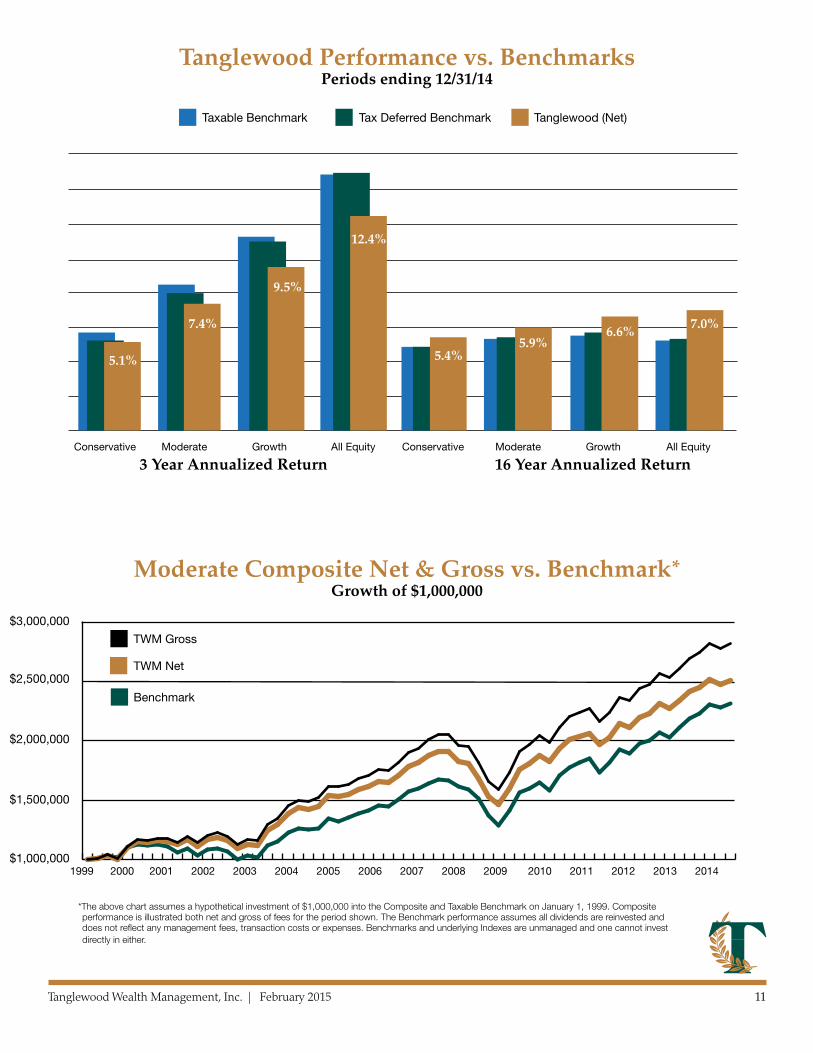
Tanglewood Performance vs. BenchmarksPeriods ending 12/31/14
Conservative Moderate Growth All Equity Conservative Moderate Growth All Equity
3 Year Annualized Return 16 Year Annualized Return
5.1%
7.4%
9.5%
12.4%
5.4%5.9%
6.6%7.0%
Taxable Benchmark Tax Deferred Benchmark Tanglewood (Net)
1.0
1.5
2.0
2.5
3.0
Moderate Composite Net & Gross vs. Benchmark*Growth of $1,000,000
TWM Gross
TWM Net
Benchmark
$3,000,000
1999 2000 2001 2002 2003 2004 2005 2006 2007 2008 2009 2010 2011 2012 2013 2014
$2,500,000
$2,000,000
$1,500,000
$1,000,000
*The above chart assumes a hypothetical investment of $1,000,000 into the Composite and Taxable Benchmark on January 1, 1999. Composite performance is illustrated both net and gross of fees for the period shown. The Benchmark performance assumes all dividends are reinvested and does not reflect any management fees, transaction costs or expenses. Benchmarks and underlying Indexes are unmanaged and one cannot invest directly in either.

1400 Post Oak Blvd., Suite 550, Houston, TX 77056713-840-8880 FAX 713-622-7307 www.tanglewoodwealth.com
Past Performance is not an indication of future results.
The Average Annual Return found under “Reward” on the Moderate Risk Reward Chart (page 5) represents the annualized growth rate of the benchmark portfolio for the time period shown with all interest, dividends and capital gains reinvested.
The Cumulative values found throughout the Risk/Reward Chart and in December of the final year represent the ending market value at the end of the period. Asset classes are rebalanced on January 1 of each year back to their original stated benchmark weightings. Benchmark returns are for illustrative purposes only and do not represent actual Tanglewood Wealth Management, Inc. performance. Underlying Index returns do not reflect any management fees, transaction costs or expenses. Indexes are unmanaged and one cannot invest directly in an index.
On January 1, 2011, the benchmark allocations and index representations were updated to better-reflect the current investment environment while maintaining the desired risk/reward characteristics. The current benchmark allocations are shown below. Benchmark allocations prior to January 1, 2011 are available upon request.
Benchmarks for Tanglewood Investment PoliciesBenchmark Allocations Asset Class
Index Representation
Conservative
ModeratelyConservative
Moderate
Moderate Growth
Growth
All Equity
Cash Citigroup 1 Month US Treasury Bill Index 16% 12% 8% 6% 4% 1%
Bonds(Taxable/Non-Taxable Accounts)
Barclays Capital US Aggregate Bond IndexBarclays Capital US Treasury Bellweather 5 yr IndexVanguard Inter Term Tax Exempt Fund (VWITX)
10% / 20%
15% / 30%
25% / 0%
10% / 20%
12.5% / 25%
22.5% / 0%
10% / 20%
10% / 20%
20% / 0%
11.5% / 23%
5% / 10%
16.5% / 0%
12.5% / 25%
0% / 0%
12.5% / 0%
NA
Gold SPDR Gold Trust ETF (GLD) 5% 5% 5% 5% 5% 5%
Real Estate FTSE NAREIT Equity REIT Index 2% 2% 3% 3% 4% 5%
U.S. Stocks Russell 3000 Index 16.5% 22% 27% 32% 38% 54%
Int’l Stocks Vanguard FTSE All World ex US ETF (VEU) 10.5% 14% 17% 21% 24% 35%
Tanglewood returns represent the composite of those accounts managed pursuant to the indicated investment policy and having a market value of at least $250,000. To request a complete list and description of Tanglewood’s composites and/or a presentation that adheres to the GIPS® standards, call or write Tanglewood.
Tanglewood performance is reported after the deduction of all transaction costs, any Schwab fees/commissions and actual Tanglewood investment management fees. All income is reinvested and the U.S. Dollar is the currency used to express performance. Deviation of composite performance relative to its benchmark is due to Tanglewood’s strategy of overweighting or underweighting various asset classes and the selection of mutual fund managers within each asset class.
The accumulations provided on page 10 & 11 assume a hypothetical initial investment of $1,000,000 into each composite on January 1, 1999. Benchmark portfolios are rebalanced annually. Benchmark Returns and their underlying components include the reinvestment of all dividends and capital gain distributions (total return).
The information and performance figures included in this report are based upon data obtained from public sources believed to be reliable; however, Tanglewood Wealth Management, Inc. does not guarantee the completeness or accuracy thereof.
Due to various factors, including changing market conditions and/or applicable laws, the content may no longer be reflective of current opinions or positions. Moreover, you should not assume that any discussion or information contained in this material serves as the receipt of, or as a substitute for, personalized investment advice from Tanglewood Wealth Management. To the extent that a reader has any questions regarding the applicability of any specific issue discussed herein to his/her individual situation, he/she is encouraged to consult with their professional advisor. A copy of Tanglewood Wealth Management’s current written disclosure statement discussing our advisory services and fees is available for review upon request.