investment performance analysis
TRANSCRIPT

Investment Performance AnalysisCommissioners of the Land Office,State of Oklahoma
Period Ended: March 31, 2018

Capital Markets Review As of March 31, 2018
Economic Indicators Mar-18 Dec-17 Mar-17 Mar-15 20 Yr1.68 ▲ 1.33 0.82 0.06 2.072.23 ▲ 0.85 2.06 1.46 N/A2.06 ▲ 1.98 1.98 1.78 N/A2.4 ▲ 2.1 2.4 -0.1 2.24.1 ─ 4.1 4.5 5.5 5.92.9 ▲ 2.6 2.0 3.8 2.2
59.3 ─ 59.3 56.6 51.8 52.586.37 ▼ 87.47 93.96 92.06 86.5964.9 ▲ 60.4 50.6 47.6 58.1
1,326 ▲ 1,303 1,249 1,184 843
Market Performance (%) CYTD 1 Yr 5 Yr 10 Yr-0.76 13.99 13.31 9.49-0.08 11.79 11.47 9.84-1.53 14.80 6.50 2.740.24 23.49 11.10 6.481.42 24.93 4.99 3.02
-1.46 1.20 1.82 3.630.35 1.11 0.34 0.342.20 8.07 11.43 5.11
-7.48 -3.64 6.13 6.220.57 5.86 3.44 1.58
-0.40 3.71 -8.32 -7.71
Russell 2000MSCI EAFE (Net)MSCI EAFE SC (Net)MSCI Emg Mkts (Net)Bloomberg US Agg Bond
Key Economic Indicators
Treasury Yield Curve (%)
Key Economic IndicatorsThe quarter began with a substantial global equity market rally in January. Drivers of the rally included improving global economic fundamentals, continuation of generally accommodative monetary policies among global central banks, and continued corporate earnings growth. The market rally reversed sharply in February in response to an uptick in inflation expectations, a repricing of the yield curve, and a dramatic spike in equity market volatility. The quarter ended with developed equity markets in negative territory, US duration sensitive assets down moderately, and global bond markets maintaining slight gains in part due to a weakening US Dollar. The Federal Open Market Committee set the federal funds target range at 1.50% to 1.75%, an increase of 0.25%, and maintained guidance for two additional rate increases in 2018. US economic data continued to generally indicate a robust economic expansion. Non-farm payroll growth averaged in excess of 200,000 job gains per month while Purchasing Manager’s data for both the US manufacturing and non-manufacturing sectors indicated continued expansion.
First Quarter Economic Environment
UnemploymentRate (%)
Since 1948
CPI Year-over-Year (% change)
Since 1914
US Govt Debt (% of GDP)Since 1940
VIX Index(Volatility)Since 1990
Consumer ConfidenceSince 1967
Unemployment Rate (%)
Federal Funds Rate (%)Breakeven Infl. - 1 Yr (%)Breakeven Infl. - 10 Yr (%)CPI YoY (Headline) (%)
Real GDP YoY (%)
USD Total Wtd IdxWTI Crude Oil per Barrel ($)Gold Spot per Oz ($)
S&P 500 (Cap Wtd)
PMI - Manufacturing
0.57-0.40
BofA ML 3 Mo US T-BillNCREIF ODCE (Gross)Wilshire US REITHFRI FOF CompBloomberg Cmdty (TR)
1.42-1.460.352.20
-7.48
QTD-0.76-0.08-1.530.24
0.00
0.50
1.00
1.50
2.00
2.50
3.00
3.50
3M 6M 1Y 3Y 5Y 7Y 10Y 20Y 30Y
Mar-18 Dec-17 Mar-17 Mar-16 Mar-15
0
2
4
6
8
10
12
20
40
60
80
100
120
0
10
20
30
40
50
60
70
20
40
60
80
100
120
140
160
-20-15-10-505
1015202530
2.4
Treasury data courtesy of the US Department of the Treasury. Economic data courtesy of Bloomberg Professional Service.Breakeven Inflation does not have 20 years of history; therefore, its 20-year average is shown as N/A.
Page 1 of 47

US Equity Review As of March 31, 2018
Broad MarketDespite strong returns in January, US equity markets faltered during the final two months of the quarter, delivering mixed results across market cap and style. The S&P 500 Index’s return of -0.76% marks the first negative quarter for the index since Q3 2015. Declines were relatively widespread, with nine of eleven sectors producing negative returns.
Market CapIncreased global macroeconomic uncertainty indirectly favored small cap stocks, which tend to be more domestically-focused, providing greater insulation from global headwinds.
Style and SectorGrowth stocks led value stocks for the quarter as the Russell 1000 Growth Index outperformed its value counterpart by 4.25% for the quarter. Technology stocks led all other sectors posting 3.53% with consumer discretionary following close behind with 3.09% for the quarter.
Style and Capitalization Market Performance (%)
S&P 500 Index Sector Performance (%)
First Quarter Review
Valuations
US Large-Cap Equity
R1000 12M P/ESince 1995
US Small-Cap Equity
R2000 12M P/ESince 1995
US Large-Cap Value Equity
R1000V 12M P/ESince 1995
US Large-Cap Growth Equity
R1000G 12M P/ESince 1995
US Large-Cap Equity
Shiller S&P 10Y P/ESince 1900
18.63
21.25
5.13
6.95
11.79
13.98
13.99
13.81
2.30
1.42
-2.64
-2.83
-0.08
-0.69
-0.76
-0.64
-10 0 10 20 30
R 2000 Growth
R 1000 Growth
R 2000 Value
R 1000 Value
R 2000
R 1000
S&P 500
R 3000 QTD
1 Yr
1.89
-4.86
10.54
27.68
13.95
11.27
1.69
18.04
-0.16
-0.89
16.91
-3.30
-7.48
-5.52
3.53
-1.56
-1.22
-5.02
-0.95
-5.88
-7.12
3.09
-20 -5 10 25 40
UtilitiesTeleCom
Materials
Information TechIndustrials
Health Care
Real EstateFinancials
Energy
Cons Staples
Cons Discretion QTD
1 Yr
0
5
10
15
20
25
30
35
10
15
20
25
30
20
40
60
80
100
10
15
20
25
10
20
30
40
50
Valuation data courtesy of Bloomberg Professional Service and Robert J. Shiller, Irrational Exuberance, Second Edition.P/E metrics shown represent the 5th through 95th percentiles to minimize the effect of outliers.
Page 2 of 47

Non-US Equity Review As of March 31, 2018
Developed IntlEquity
MSCI EAFE12M P/E
Since 1995
Intl EquityMSCI ACW x US
12M P/ESince 1995
MSCI Style and Capitalization Market Performance (%)
MSCI Region Performance (%)
EmergingMarkets Equity
MSCI EM12M P/E
Since 1995
Developed Intl Growth Equity
MSCI EAFE Grth12M P/E
Since 1995
Developed Intl Value Equity
MSCI EAFE Val12M P/E
Since 1995
First Quarter Review
Valuations
Developed MarketsDeveloped international markets lagged during the quarter, ending with negative returns and underperforming their domestic counterparts. Market movements were affected by headlines related to global trade negotiations, however there were also significant political events within developed international markets.
Emerging MarketsEmerging markets outperformed domestic and developed international for both the quarter and the trailing one year period. MSCI Emerging Markets Index outpaced the MSCI EAFE Index by 295 basis points during the quarter.
Market Cap & StyleDeveloped international growth stocks continued to outperform value stocks, while small cap stocks outperformed large cap stocks, ending the quarter in slightly positive territory. Contrary to the rest of the world, emerging market value outperformed growth.
24.93
15.78
14.49
23.49
17.51
12.19
14.80
16.53
1.42
-0.68
-1.98
0.24
-1.04
-2.03
-1.53
-1.18
-10 0 10 20 30
Emg Mkts
Pacific
Europe
EAFE SC
EAFE Growth
EAFE Value
EAFE
ACW Ex US QTD
1 Yr
24.93
4.91
19.64
8.43
-8.42
11.91
15.51
1.42
-7.35
0.83
-3.73
-5.30
-3.88
-1.25
-15 -5 5 15 25 35
Emg Mkts
Canada
Japan
Pacific ex Japan
Middle East
United Kingdom
Europe Ex UK QTD1 Yr
0
20
40
60
80
100
0
10
20
30
40
0
10
20
30
40
50
60
0
10
20
30
40
50
0
10
20
30
40
50
Valuation data courtesy of Bloomberg Professional Service.P/E metrics shown represent the 5th through 95th percentiles to minimize the effect of outliers.All returns are shown net of foreign taxes on dividends.
Page 3 of 47

Fixed Income Review As of March 31, 2018
Fixed Income Performance (%)Broad MarketTreasury yields increased across all maturities leading to negative returns across rate-sensitive fixed income indices. The Bloomberg Barclays US Aggregate Bond Index posted a return of -1.46% during the quarter. Longer duration bonds were hit the hardest with the Bloomberg Barclays US Long Government/Credit Index returning -3.58%.
Credit MarketInvestment grade and high yield credit spreads widened modestly, ending a nine-quarter streak of spread tightening. Emerging Market DebtNon-US dollar denominated emerging market debt was the best performing sub-asset class within fixed income over the quarter, returning 4.44%. In contrast, hard currency and corporate emerging market debt ended the quarter with negative returns after four consecutive quarters of posting positive returns.
First Quarter Review
Valuations
US Aggregate Bonds
Bloomberg US Agg SpreadsSince 2000
US Corporate Bonds
Bloomberg US Corp Spreads
Since 1989
US CreditBonds
Bloomberg US Credit Spreads
Since 2000
US Treasury Bonds10-Yr US Treasury
YieldsSince 1953
US High-Yield Bonds
Bloomberg US Corp:HY Spreads
Since 2000
12.99
3.34
8.49
6.98
4.64
3.78
0.62
0.77
0.75
2.70
1.33
0.92
0.43
1.20
4.44
-1.78
2.50
1.37
1.58
-0.86
-0.39
-1.19
-0.53
-2.32
-1.20
-0.79
-1.18
-1.46
-10 0 10 20
JPM GBI-EM Glbl Dvf'd (USD)(Unhedged)
JPM Emg Mkts Bond Global
FTSE Wrld Gov't Bond
Bloomberg Global Agg Bond
CS Leveraged Loan
Bloomberg US Corp: Hi Yld
Bloomberg US ABS
Bloomberg US MBS
Bloomberg US Agcy
Bloomberg US Corp: Credit
Bloomberg US CMBS Inv Grade
Bloomberg US Trsy: US TIPS
Bloomberg US Trsy
Bloomberg US Agg QTD
1 Yr
0
2
4
6
8
10
12
14
0.0
0.2
0.4
0.6
0.8
1.0
1.2
0.0
0.5
1.0
1.5
2.0
2.5
3.0
0.0
0.5
1.0
1.5
2.0
2.5
3.0
3.5
0123456789
10
Valuation data courtesy of Bloomberg Professional Service.Valuations shown represent the 5th through 95th percentiles to minimize the effect of outliers.
Page 4 of 47

Alternatives Review As of March 31, 2018
General Market - Diversified Inflation Strategies (DIS)DIS managers posted weak returns despite increases in market-based measures of future inflation and heightened press attention about the potential for further acceleration of inflationary pressure. Market expectations of future inflation also increased modestly from 1.98% to 2.06% based on 10 Year Treasury breakevens. Managers with greater exposure to floating rate credit-sensitive fixed income and foreign currency performed toward the top of the peer group. Managers with significant MLP exposure within global listed infrastructure allocations lagged by the widest margins.
General Market - Real EstateThe Core private real estate index, NCREIF-ODCE, returned 2.2% during Q1, comprised of 1.0% income and 1.2% appreciation. Investors in publicly traded real estate significantly underperformed their private market counterparts during the quarter as measured by Wilshire US REIT Index return of -7.48%.
General Market - Hedge FundsHedge funds produced modestly positive returns during the first quarter of 2018, though heightened levels of market volatility created significant dispersion across strategies. FoHFs that outperformed benefitted from manager selection within the discretionary macro space, where several managers correctly bet on rising interest rates and produced near double digit returns or higher during the quarter. Managers within the multi-strategy space produced negative returns on average according to HFR, but the firms RVK tracks closely were modestly positive during the quarter, producing average returns near 1%.
General Market - Global Tactical Asset Allocation (GTAA)GTAA managers provided modestly positive performance and for the most part, tended to outperform traditional asset classes. Globally-oriented managers that rely on fundamental, value-based investment processes have continued to allocate to various exposures in emerging markets, which they believe to be undervalued.
First Quarter Review - Absolute Return
HFRI Hedge Fund Performance (%)
First Quarter Review - Real Assets
Real Asset Performance (%)
5.60
3.68
5.18
3.17
1.02
4.18
0.00
4.47
9.70
4.81
5.86
1.83
0.26
0.15
0.30
-1.25
0.58
0.00
0.83
0.59
0.64
0.57
-20 -10 0 10 20
Credit ArbMerger Arb
Event DrivenRelative Value
MacroDistressedShort Bias
Mkt Neutral EqEquity Hedge
Conv ArbitrageHFRI FOF QTD
1 Yr
0.92
-20.07
17.21
3.71
-3.64
7.12
8.07
-0.79
-11.12
-1.65
-0.40
-7.48
1.70
2.20
-30 -20 -10 0 10 20 30
Bloomberg US Trsy: US TIPS
Alerian MLP
S&P Glbl Nat. Res. (TR)
Bloomberg Cmdty (TR)
Wilshire US REIT
NCREIF Property
NCREIF ODCE (Gross) QTD
1 Yr
Page 5 of 47

2004 2005 2006 2007 2008 2009 2010 2011 2012 2013 2014 2015 2016 2017 YTD
Best33.16 34.00 35.97 39.38 8.44 78.51 28.60 22.49 20.00 38.82 31.78 15.02 21.31 37.28 2.20
31.45 26.19 32.18 16.23 5.24 58.21 26.85 15.99 18.23 32.39 19.31 9.59 17.13 33.01 1.42
25.55 21.39 26.34 15.97 2.06 46.78 22.04 13.56 17.59 29.30 13.69 4.23 11.96 25.03 0.57
20.25 21.36 19.31 11.63 -2.35 31.78 18.88 9.24 17.32 22.78 12.50 1.38 11.77 21.83 0.35
18.33 13.82 18.37 11.17 -10.01 28.60 16.83 7.84 16.35 13.94 5.97 0.55 11.19 14.65 0.24
13.06 13.54 16.32 10.25 -21.37 27.17 16.36 4.98 16.00 8.96 4.89 0.05 8.77 10.71 -0.08
11.14 7.49 15.79 6.97 -26.16 26.46 15.12 2.11 15.81 7.44 3.64 -0.27 7.24 7.77 -0.40
10.88 5.34 11.86 6.60 -33.79 18.91 15.06 0.10 10.94 1.86 3.37 -0.81 6.67 7.62 -0.76
9.15 4.91 10.39 5.49 -35.65 11.47 10.16 -4.18 8.78 0.07 2.45 -1.44 4.68 7.50 -0.79
8.56 4.55 4.85 5.00 -37.00 11.41 7.75 -5.72 6.98 -2.02 0.04 -3.30 2.65 4.18 -0.86
8.46 3.07 4.34 1.87 -39.20 5.93 6.54 -12.14 4.79 -2.60 -2.19 -4.41 2.18 3.54 -1.46
6.86 2.84 2.72 1.45 -43.38 1.92 6.31 -13.32 4.21 -8.61 -4.90 -4.47 1.00 3.01 -1.53
4.34 2.74 2.07 -1.57 -47.01 0.21 5.70 -15.94 0.11 -8.83 -4.95 -14.92 0.51 1.70 -3.58
Worst1.33 2.43 0.49 -17.55 -53.33 -29.76 0.13 -18.42 -1.06 -9.52 -17.01 -24.66 0.33 0.86 -7.48
S&P 500 -US Large
Cap
R 2000 -US Small
Cap
MSCI EAFE(Net) - Int'l
Dev.
MSCI EAFESC (Net) -
Int'l SC
MSCI EM(Net) - Int'lEmg Mkts
BloombrgUS Agg
Bond - FI
BloombrgUS Corp:
Hi Yield - FI
BloombrgUS Trsy:US TIPS -
FI
BloombrgUS
Gov/Credit:Lng - FI
NCREIFODCE
(Gross) -Real Estate
WilshireUS REIT -
REITs
HFRI FOFCompIndex -
ARS
BloombrgCmdty (TR)- Commod.
ICEBofAML 3Mo T-Bill -
Cash Equiv
Annual Asset Class Performance As of March 31, 2018
NCREIF ODCE (Gross) performance is reported quarterly.
Page 6 of 47

Asset Allocation & Performance Asset Allocation & Performance
Schedule of Investable Assets
Allocation
MarketValue ($)
%
Perf. (%)
QTD
Total Fund Composite 2,338,732,770 100.00 -2.06
Domestic Equity Composite 524,281,998 22.42 -2.14
Robeco BPAM Premium Eq (SA) 89,710,802 3.84 -0.33AJO Large Cap Value (SA) 77,878,952 3.33 -2.53DePrince, Race & Zollo LCV (SA) 35,690 0.00 N/AVanguard Hi Dv Yld;Inv (VHDYX) 107,046,976 4.58 -2.82BlackRock R 1000 Index Fund (CF) 127,137,495 5.44 -0.70Silvercrest Small Cap Value (SA) 122,472,083 5.24 -4.65
MLPs Composite 173,242,481 7.41 -9.43
Harvest Fund Advisors MLP (SA) 85,857,151 3.67 -9.22Tortoise Capital Advisors MLP (SA) 87,385,330 3.74 -9.64
International Equity Composite 259,741,895 11.11 -0.47
Vanguard Tot I Stk;Ins + (VTPSX) 259,741,895 11.11 -0.43
Allocation
MarketValue ($)
%
Perf.(%)
QTD
Total Fixed Income Composite 1,318,557,343 56.38 -0.98
Dodge & Cox Fixed Income (SA) 224,155,062 9.58 -0.84Cutwater Core Plus Select Income (SA) 136,268,875 5.83 -1.51Guggenheim (BBB) (SA) 128,622,492 5.50 -1.95JPMorgan MBS (SA) 218,757,949 9.35 -0.50Guggenheim CMBS (SA) 101,052,062 4.32 0.31Allianz Global Investors US High Yield (SA) 123,014,978 5.26 -1.06Fort Washington High Yield (SA) 124,884,322 5.34 -0.96Cohen & Steers Preferreds (SA) 217,050,337 9.28 -1.50Oklahoma Treasurer's Cash Pool 44,609,052 1.91 0.44Bank of Oklahoma Cash 142,215 0.01 0.37
REITs Composite 62,909,054 2.69 -7.46
CenterSquare US REIT Total Return Comp (SA) 62,909,054 2.69 -7.46
Periods EndingBeginning
Market Value ($)Net
Cash Flow ($)Gain/Loss ($)
EndingMarket Value ($)
% Return Unit Value
CYTD 2,402,513,307 -14,661,101 -49,119,437 2,338,732,770 -2.06 97.94
Commissioners of the Land Office, State of OklahomaAsset Allocation, Performance & Schedule of Investable Assets
As of March 31, 2018
Allocations shown may not sum up to 100% exactly due to rounding. Performance shown is gross of fees. Market value shown for DePrince, Race & Zollo LCV (SA) represents residual assets from liquidation.
Page 7 of 47

Asset Allocation vs. Target Allocation Asset Allocation vs. Target Allocation Differences
Asset Allocation vs. All Master Trust - Total Fund
Market Value($)
Allocation(%)
Target(%)
Large Cap US Equity 401,809,914 17.18 16.00Small/Mid Cap US Equity 122,472,083 5.24 5.00MLPs 173,242,481 7.41 10.00International Equity 259,741,895 11.11 10.00Domestic Fixed Income 808,856,439 34.59 36.00High Yield 247,899,300 10.60 11.00Preferreds 217,050,337 9.28 9.00REITs 62,909,054 2.69 3.00Cash Equivalent 44,751,266 1.91 0.00Total Fund 2,338,732,770 100.00 100.00
US Equity Intl. Equity US Fixed Income Intl. Fixed Income Alternative Inv. Real Estate Cash
Total Fund Composite 29.82 (56) 11.11 (82) 54.47 (16) 0.00 0.00 2.69 (86) 1.91 (39)
Median 31.45 19.52 27.67 4.74 13.69 5.70 1.35
Population 2,381 2,248 2,432 830 1,233 1,082 1,965
Commissioners of the Land Office, State of OklahomaTotal Fund Composite vs. All Master Trust - Total FundAsset Allocation vs. Target and Plan Sponsor Peer Group
As of March 31, 2018
Allocations shown may not sum up to 100% exactly due to rounding. Robeco Boston Partners Premium Equity (SA) is included in the Large Cap US Equity composite market value. Domestic Fixed Income consists of Dodge & Cox Fixed Income (SA), Cutwater Core Plus Select Income (SA), Guggenheim (BBB) (SA), JPMorgan MBS (SA), and Guggenheim CMBS (SA). MLPs are included in the US Equity segment allocation.
Page 8 of 47

Asset Allocation by Theme Thematic Analysis - July 1, 1999 to March 31, 2018
Asset Allocation by Liquidity Correlation Matrix - 10 Years
Cap
italiz
atio
n
A B C D
A 1.00B 0.56 1.00C -0.36 -0.24 1.00D 0.46 0.86 -0.02 1.00
A = HFRI EH: Eq Mkt Neut Index (Alpha)B = MSCI ACW Index (USD) (Gross) (Capital Appreciation)C = Bloomberg US Gov't Bond Index (Capital Preservation)D = Real Return Custom Index (Inflation)
RVK Liquidity Rating 76
Commissioners of the Land Office, State of OklahomaTotal Fund - Thematic and Liquidity Analysis
As of March 31, 2018
Asset Allocation by Theme is based on dedicated manager allocations; as such, thematic allocations are approximations. The RVK Liquidity Rating is calculated using beginning of month investment weights applied to each corresponding asset class liquidity rating. Please see the Glossary for additional information regarding liquidity, thematic, and custom index descriptions.
Page 9 of 47

Commissioners of the Land Office, State of Oklahoma As of February 28, 2018
Total Fund Composite Yield 0.32 0.60 3.97 4.06 3.99 4.10 4.01 4.23 3.96 4.35 01/01/2008
Total Fund Composite Yield ($) $7,858,441 $14,545,031 $93,693,635 $91,761,315 $88,824,142 $86,992,871 $93,496,051 $91,765,916 $89,220,342
The Total Fund Composite Yield is calculated by dividing the total manager income distributed by the average period market value.
Yield is arithmetically annualized for periods greater than one year. Yield shown is on a trailing basis as of the end of the prior month.
Inception
Date2016
Total Fund Composite Yield - Trailing Periods
Yield %
2015Since
InceptionMTD CYTD
1
Year
3
Years
5
Years
7
Years2017
Page 10 of 47

QTD CYTD1
Year3
Years5
Years7
Years10
YearsSinceIncep.
InceptionDate
Total Fund Composite -2.13 -2.13 4.03 3.63 4.99 5.61 6.27 6.86 12/01/1995
Target Allocation Index -2.26 -2.26 3.40 3.31 4.70 5.46 5.67 6.77Difference 0.13 0.13 0.63 0.32 0.29 0.15 0.60 0.09
Total Fund Composite -2.13 -2.13 4.03 3.63 4.99 5.61 6.27 6.86 12/01/1995
Actual Allocation Index -2.54 -2.54 2.81 3.06 4.60 5.30 5.53 N/ADifference 0.41 0.41 1.22 0.57 0.39 0.31 0.74 N/A
Domestic Equity Composite -2.22 -2.22 10.46 9.12 11.82 11.03 9.02 8.93 12/01/1995
Russell 3000 Index -0.64 -0.64 13.81 10.22 13.03 12.39 9.62 8.93Difference -1.58 -1.58 -3.35 -1.10 -1.21 -1.36 -0.60 0.00
MLPs Composite -9.59 -9.59 -17.46 -9.62 N/A N/A N/A -5.56 03/01/2014
MLP Custom Index -10.91 -10.91 -19.07 -10.95 -4.34 1.13 6.54 -7.34Difference 1.32 1.32 1.61 1.33 N/A N/A N/A 1.78
International Equity Composite -0.49 -0.49 17.01 6.91 7.16 4.35 3.62 3.39 05/01/2007
Vanguard Spl Tot Int'l Stock Index -1.14 -1.14 16.73 6.78 6.39 4.62 2.84 2.30Difference 0.65 0.65 0.28 0.13 0.77 -0.27 0.78 1.09
Total Fixed Income Composite -1.04 -1.04 3.32 3.23 3.78 4.86 6.30 6.60 07/01/1999
Bloomberg US Unv Bond Index -1.41 -1.41 1.52 1.73 2.19 3.31 4.01 5.12Difference 0.37 0.37 1.80 1.50 1.59 1.55 2.29 1.48
REITs Composite -7.59 -7.59 -2.76 2.04 7.19 8.86 N/A 8.52 08/01/2008
FTSE NAREIT Eq REITs Index (TR) -8.20 -8.20 -4.51 1.08 5.92 8.18 6.37 6.78Difference 0.61 0.61 1.75 0.96 1.27 0.68 N/A 1.74
Commissioners of the Land Office, State of OklahomaComparative Performance (Net of Fees) - Trailing Periods
As of March 31, 2018
RVK began monitoring the assets of Commissioners of the Land Office, State of Oklahoma as of July 1, 2005. Prior historical data was provided by the previous consultant. Performance shown is net of fees. Indices show N/A for since inception returns when the fund contains more history than the corresponding benchmark. Please see the Addendum for custom index definitions.
Page 11 of 47

2017 2016 2015 2014 2013 2012 2011 2010 2009 2008
Total Fund Composite 9.56 9.79 -3.72 6.04 10.19 12.30 2.00 13.86 29.12 -20.54
Target Allocation Index 9.25 9.35 -4.01 6.60 9.07 11.64 2.88 12.58 25.41 -20.81Difference 0.31 0.44 0.29 -0.56 1.12 0.66 -0.88 1.28 3.71 0.27
Total Fund Composite 9.56 9.79 -3.72 6.04 10.19 12.30 2.00 13.86 29.12 -20.54
Actual Allocation Index 8.44 10.10 -4.57 6.63 9.81 11.51 2.17 12.42 26.18 -21.58Difference 1.12 -0.31 0.85 -0.59 0.38 0.79 -0.17 1.44 2.94 1.04
Domestic Equity Composite 16.66 18.93 -2.33 8.86 35.67 16.04 -1.96 17.42 30.69 -36.91
Russell 3000 Index 21.13 12.74 0.48 12.56 33.55 16.42 1.03 16.93 28.34 -37.31Difference -4.47 6.19 -2.81 -3.70 2.12 -0.38 -2.99 0.49 2.35 0.40
MLPs Composite -4.51 16.90 -28.45 N/A N/A N/A N/A N/A N/A N/A
MLP Custom Index -5.79 22.73 -33.50 7.89 29.96 5.19 14.10 36.44 78.35 -38.03Difference 1.28 -5.83 5.05 N/A N/A N/A N/A N/A N/A N/A
International Equity Composite 27.52 4.78 -4.16 -5.66 21.30 14.93 -18.14 15.56 31.93 -36.31
Vanguard Spl Tot Int'l Stock Index 27.41 4.72 -4.29 -3.39 15.76 17.04 -14.31 10.69 40.44 -45.52Difference 0.11 0.06 0.13 -2.27 5.54 -2.11 -3.83 4.87 -8.51 9.21
Total Fixed Income Composite 6.45 6.27 0.38 6.11 2.62 10.55 5.66 11.92 28.10 -10.42
Bloomberg US Unv Bond Index 4.09 3.91 0.43 5.56 -1.35 5.53 7.40 7.16 8.60 2.38Difference 2.36 2.36 -0.05 0.55 3.97 5.02 -1.74 4.76 19.50 -12.80
REITs Composite 6.27 8.20 4.96 31.98 3.20 17.11 9.36 29.81 37.24 N/A
FTSE NAREIT Eq REITs Index (TR) 5.23 8.52 3.20 30.14 2.47 18.06 8.29 27.94 28.01 -37.74Difference 1.04 -0.32 1.76 1.84 0.73 -0.95 1.07 1.87 9.23 N/A
Commissioners of the Land Office, State of OklahomaComparative Performance (Net of Fees) - Calendar Years
As of March 31, 2018
RVK began monitoring the assets of Commissioners of the Land Office, State of Oklahoma as of July 1, 2005. Prior historical data was provided by the previous consultant. Performance shown is net of fees. Please see the Addendum for custom index definitions.
Page 12 of 47

Plan Sponsor Scattergram - 7 Years Up/Down Markets - 7 Years
Plan Sponsor Peer Group Analysis - Multi Statistics (Beta vs. S&P 500)
ReturnStandardDeviation
Total Fund Composite 5.97 5.95Target Allocation Index 5.46 5.99Actual Allocation Index 5.30 5.90Median 7.31 7.06
7Years
7Years
7Years
7Years
7Years
Total Fund Composite 5.95 (79) 0.96 (63) 5.72 (83) 3.61 (74) 0.49 (75)Target Allocation Index 5.99 (78) 0.88 (79) 5.24 (89) 3.62 (74) 0.49 (75)Actual Allocation Index 5.90 (79) 0.86 (80) 5.09 (91) 3.60 (75) 0.48 (76)
Median 7.06 1.02 7.07 4.21 0.60
Population 1,803 1,803 1,803 1,803 1,803
Commissioners of the Land Office, State of OklahomaTotal Fund Composite vs. All Master Trust - Total Fund
As of March 31, 2018
Performance shown is gross of fees. Calculation is based on monthly periodicity. Parentheses contain percentile ranks.
Page 13 of 47
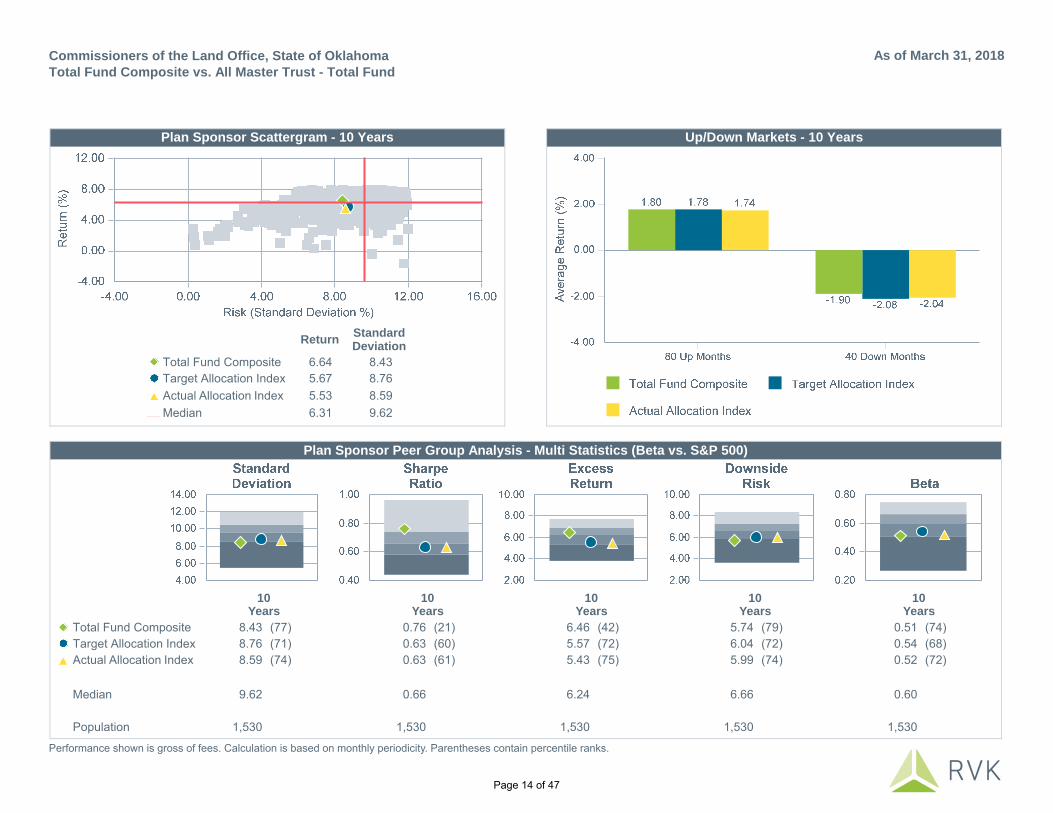
Plan Sponsor Scattergram - 10 Years Up/Down Markets - 10 Years
Plan Sponsor Peer Group Analysis - Multi Statistics (Beta vs. S&P 500)
ReturnStandardDeviation
Total Fund Composite 6.64 8.43Target Allocation Index 5.67 8.76Actual Allocation Index 5.53 8.59Median 6.31 9.62
10Years
10Years
10Years
10Years
10Years
Total Fund Composite 8.43 (77) 0.76 (21) 6.46 (42) 5.74 (79) 0.51 (74)Target Allocation Index 8.76 (71) 0.63 (60) 5.57 (72) 6.04 (72) 0.54 (68)Actual Allocation Index 8.59 (74) 0.63 (61) 5.43 (75) 5.99 (74) 0.52 (72)
Median 9.62 0.66 6.24 6.66 0.60
Population 1,530 1,530 1,530 1,530 1,530
Commissioners of the Land Office, State of OklahomaTotal Fund Composite vs. All Master Trust - Total Fund
As of March 31, 2018
Performance shown is gross of fees. Calculation is based on monthly periodicity. Parentheses contain percentile ranks.
Page 14 of 47

QTD CYTD1
Year3
Years5
Years7
Years10
YearsSinceIncep.
InceptionDate
Total Fund Composite -2.06 -2.06 4.33 3.95 5.34 5.97 6.64 7.07 12/01/1995
Target Allocation Index -2.26 -2.26 3.40 3.31 4.70 5.46 5.67 6.77Difference 0.20 0.20 0.93 0.64 0.64 0.51 0.97 0.30
All Master Trust - Total Fund Median -0.49 -0.49 9.89 6.04 7.38 7.31 6.31 7.54Rank 93 93 95 90 87 82 36 73
Total Fund Composite -2.06 -2.06 4.33 3.95 5.34 5.97 6.64 7.07 12/01/1995
Actual Allocation Index -2.54 -2.54 2.81 3.06 4.60 5.30 5.53 N/ADifference 0.48 0.48 1.52 0.89 0.74 0.67 1.11 N/A
Domestic Equity Composite -2.14 -2.14 10.82 9.49 12.21 11.47 9.50 9.21 12/01/1995
Russell 3000 Index -0.64 -0.64 13.81 10.22 13.03 12.39 9.62 8.93Difference -1.50 -1.50 -2.99 -0.73 -0.82 -0.92 -0.12 0.28
All Master Trust-US Equity Segment Median -0.40 -0.40 13.85 9.93 12.61 11.86 9.41 8.97Rank 95 95 87 60 61 62 48 38
MLPs Composite -9.43 -9.43 -16.88 -8.99 N/A N/A N/A -4.91 03/01/2014
MLP Custom Index -10.91 -10.91 -19.07 -10.95 -4.34 1.13 6.54 -7.34Difference 1.48 1.48 2.19 1.96 N/A N/A N/A 2.43
International Equity Composite -0.47 -0.47 17.10 7.01 7.45 4.71 4.06 3.83 05/01/2007
Vanguard Spl Tot Int'l Stock Index -1.14 -1.14 16.73 6.78 6.39 4.62 2.84 2.30Difference 0.67 0.67 0.37 0.23 1.06 0.09 1.22 1.53
All Master Trust-Intl. Equity Segment Median -0.41 -0.41 17.64 7.29 7.33 5.99 4.26 3.52Rank 54 54 58 57 46 85 54 40
Total Fixed Income Composite -0.98 -0.98 3.58 3.49 4.04 5.12 6.58 6.78 07/01/1999
Bloomberg US Unv Bond Index -1.41 -1.41 1.52 1.73 2.19 3.31 4.01 5.12Difference 0.43 0.43 2.06 1.76 1.85 1.81 2.57 1.66
All Master Trust-US Fixed Income Segment Median -1.08 -1.08 2.11 2.06 2.47 3.70 4.57 5.39Rank 43 43 30 9 21 26 20 17
REITs Composite -7.46 -7.46 -2.23 2.58 7.76 9.45 N/A 9.08 08/01/2008
FTSE NAREIT Eq REITs Index (TR) -8.20 -8.20 -4.51 1.08 5.92 8.18 6.37 6.78Difference 0.74 0.74 2.28 1.50 1.84 1.27 N/A 2.30
Commissioners of the Land Office, State of OklahomaComparative Performance (Gross of Fees) - Trailing Periods
As of March 31, 2018
RVK began monitoring the assets of Commissioners of the Land Office, State of Oklahoma as of July 1, 2005. Prior historical data was provided by the previous consultant. Performance shown is gross of fees. Please see the Addendum for custom index definitions.
Page 15 of 47

2017 2016 2015 2014 2013 2012 2011 2010 2009 2008
Total Fund Composite 9.88 10.12 -3.38 6.44 10.57 12.73 2.38 14.24 29.49 -20.23
Target Allocation Index 9.25 9.35 -4.01 6.60 9.07 11.64 2.88 12.58 25.41 -20.81Difference 0.63 0.77 0.63 -0.16 1.50 1.09 -0.50 1.66 4.08 0.58
All Master Trust - Total Fund Median 15.21 7.25 -0.53 6.26 15.26 12.48 0.48 12.59 19.86 -24.56Rank 89 6 94 47 79 45 27 21 4 23
Total Fund Composite 9.88 10.12 -3.38 6.44 10.57 12.73 2.38 14.24 29.49 -20.23
Actual Allocation Index 8.44 10.10 -4.57 6.63 9.81 11.51 2.17 12.42 26.18 -21.58Difference 1.44 0.02 1.19 -0.19 0.76 1.22 0.21 1.82 3.31 1.35
Domestic Equity Composite 17.05 19.35 -1.97 9.26 36.12 16.64 -1.44 18.05 31.32 -36.53
Russell 3000 Index 21.13 12.74 0.48 12.56 33.55 16.42 1.03 16.93 28.34 -37.31Difference -4.08 6.61 -2.45 -3.30 2.57 0.22 -2.47 1.12 2.98 0.78
All Master Trust-US Equity Segment Median 20.63 12.39 0.23 11.08 33.35 16.59 0.10 17.79 29.38 -37.99Rank 88 3 82 77 19 48 76 45 30 28
MLPs Composite -3.85 17.70 -27.94 N/A N/A N/A N/A N/A N/A N/A
MLP Custom Index -5.79 22.73 -33.50 7.89 29.96 5.19 14.10 36.44 78.35 -38.03Difference 1.94 -5.03 5.56 N/A N/A N/A N/A N/A N/A N/A
International Equity Composite 27.61 4.85 -3.91 -5.16 21.95 15.46 -17.65 16.23 32.67 -35.88
Vanguard Spl Tot Int'l Stock Index 27.41 4.72 -4.29 -3.39 15.76 17.04 -14.31 10.69 40.44 -45.52Difference 0.20 0.13 0.38 -1.77 6.19 -1.58 -3.34 5.54 -7.77 9.64
All Master Trust-Intl. Equity Segment Median 28.11 4.35 -2.94 -2.31 18.65 18.34 -12.59 12.71 36.15 -44.47Rank 57 42 63 95 25 90 100 16 71 6
Total Fixed Income Composite 6.71 6.53 0.63 6.38 2.89 10.83 5.94 12.20 28.45 -10.17
Bloomberg US Unv Bond Index 4.09 3.91 0.43 5.56 -1.35 5.53 7.40 7.16 8.60 2.38Difference 2.62 2.62 0.20 0.82 4.24 5.30 -1.46 5.04 19.85 -12.55
All Master Trust-US Fixed Income Segment Median 4.78 4.18 -0.01 6.01 -1.81 7.78 7.86 8.69 11.65 -2.21Rank 29 27 30 43 5 13 77 10 1 95
REITs Composite 6.84 8.78 5.52 32.68 3.76 17.72 10.04 30.45 37.75 N/A
FTSE NAREIT Eq REITs Index (TR) 5.23 8.52 3.20 30.14 2.47 18.06 8.29 27.94 28.01 -37.74Difference 1.61 0.26 2.32 2.54 1.29 -0.34 1.75 2.51 9.74 N/A
Commissioners of the Land Office, State of OklahomaComparative Performance (Gross of Fees) - Calendar Years
As of March 31, 2018
RVK began monitoring the assets of Commissioners of the Land Office, State of Oklahoma as of July 1, 2005. Prior historical data was provided by the previous consultant. Performance shown is gross of fees. Please see the Addendum for custom index definitions.
Page 16 of 47

Performance Attribution
SAA: -2.26 % TAA: 0.17% SS: -0.44 % MS: 0.41%
Commissioners of the Land Office, State of OklahomaTotal Fund Attribution - IDP
Quarter To Date Ending March 31, 2018
Performance shown is net of fees. Calculation is based on monthly periodicity. See Glossary for additional information regarding the Total Fund Attribution - IDP calculation.
Page 17 of 47

Plan Sponsor Scattergram - 10 Years Up/Down Markets - 10 Years
Plan Sponsor Peer Group Analysis - Multi Statistics (Beta vs. S&P 500)
ReturnStandardDeviation
Domestic Equity Composite 9.50 16.69Russell 3000 Index 9.62 15.48Median 9.41 15.71
10Years
10Years
10Years
10Years
10Years
Domestic Equity Composite 16.69 (12) 0.61 (64) 10.19 (44) 11.38 (21) 1.09 (9)Russell 3000 Index 15.48 (60) 0.65 (41) 10.11 (45) 10.68 (61) 1.03 (48)
Median 15.71 0.64 9.93 10.85 1.02
Population 161 161 161 161 161
Commissioners of the Land Office, State of OklahomaDomestic Equity Composite vs. All Master Trust-US Equity Segment
As of March 31, 2018
Performance shown is gross of fees. Calculation is based on monthly periodicity. Parentheses contain percentile ranks.
Page 18 of 47

Top Ten Equity Holdings
PortfolioWeight
(%)
BenchmarkWeight
(%)
ActiveWeight
(%)
QuarterlyReturn
(%)
Microsoft Corp 2.44 2.53 -0.09 7.19JPMorgan Chase & Co 2.15 1.40 0.75 3.36Johnson & Johnson 1.84 1.28 0.56 -7.70Exxon Mobil Corp 1.38 1.17 0.21 -9.89Pfizer Inc 1.29 0.78 0.51 -1.11Bank of America Corp 1.22 1.06 0.16 1.98Cisco Systems Inc 1.05 0.79 0.26 12.82Merck & Co Inc. 1.00 0.55 0.45 -2.35PepsiCo Inc 0.93 0.58 0.35 -8.30Verizon Communications Inc 0.89 0.73 0.16 -8.62
% of Portfolio 14.19 10.87 3.32
Portfolio Characteristics
Portfolio Benchmark
Wtd. Avg. Mkt. Cap ($M) 108,867 163,882Median Mkt. Cap ($M) 7,667 1,702Price/Earnings Ratio 19.81 21.16Price/Book Ratio 2.65 3.225 Yr. EPS Growth Rate (%) 10.61 14.27Current Yield (%) 2.01 1.87Beta (5 Years, Monthly) 1.07 1.00Number of Securities 1,215 2,958
Distribution of Market Capitalization (%) Sector Weights (%)
Commissioners of the Land Office, State of OklahomaDomestic Equity Composite vs. Russell 3000 IndexPortfolio Characteristics
As of March 31, 2018
Page 19 of 47

Top Ten Equity Holdings
PortfolioWeight
(%)
BenchmarkWeight
(%)
ActiveWeight
(%)
QuarterlyReturn
(%)
Enterprise Products Partners LP 11.46 12.08 -0.62 -6.27Plains All American Pipeline LP 7.69 5.91 1.78 8.24Williams Partners LP 7.45 5.06 2.39 -9.92Energy Transfer Partners LP 7.17 8.67 -1.50 -6.81MPLX LP 7.06 5.85 1.21 -5.30Energy Transfer Equity LP 6.89 7.08 -0.19 -16.22Magellan Midstream Partners LP 4.93 7.55 -2.62 -16.64ONEOK Inc. 4.78 0.00 4.78 7.85Andeavor Logistics LP 4.67 2.45 2.22 -1.11EQT Midstream Partners LP 3.30 2.14 1.16 -18.14
% of Portfolio 65.40 56.79 8.61
Portfolio Characteristics
Portfolio Benchmark
Wtd. Avg. Mkt. Cap ($M) 18,479 16,329Median Mkt. Cap ($M) 3,929 1,504Price/Earnings Ratio 19.28 18.17Price/Book Ratio 2.35 2.285 Yr. EPS Growth Rate (%) 0.45 0.14Current Yield (%) 7.87 8.81Beta (3 Years, Monthly) 0.93 1.00Number of Securities 50 87
Distribution of Market Capitalization (%) Sector Weights (%)
Commissioners of the Land Office, State of OklahomaMLPs Composite vs. MLP Custom IndexPortfolio Characteristics
As of March 31, 2018
The MLP Custom Index consists of 50% S&P MLP Index (TR) and 50% Tortoise MLP Index (TR).
Page 20 of 47

Peer Group Scattergram - 10 Years Up/Down Markets - 10 Years
Peer Group Analysis - Multi Statistics
ReturnStandardDeviation
International Equity Composite 4.06 17.60Vanguard Spl Tot Int'l Stock Index 2.84 18.67Median 4.26 18.18
10Years
10Years
10Years
10Years
10Years
10Years
International Equity Composite 0.30 (52) 3.67 (43) 0.27 (61) 12.46 (67) 98.54 (50) 93.69 (46)Vanguard Spl Tot Int'l Stock Index 0.23 (87) 0.00 (100) N/A 13.46 (30) 100.00 (35) 100.00 (13)
Median 0.30 3.43 0.39 12.93 98.51 92.64
Population 129 129 129 129 129 129
Commissioners of the Land Office, State of OklahomaInternational Equity Composite vs. All Master Trust-Intl. Equity Segment
As of March 31, 2018
Performance shown is gross of fees. Calculation is based on monthly periodicity. Parentheses contain percentile ranks.
Page 21 of 47

Top Ten Equity Holdings
PortfolioWeight
(%)
BenchmarkWeight
(%)
ActiveWeight
(%)
QuarterlyReturn
(%)
Tencent Holdings LTD 1.16 1.16 0.00 0.48Nestle SA, Cham Und Vevey 0.99 0.99 0.00 -7.77Samsung Electronics Co Ltd 0.88 0.88 0.00 -1.95Taiwan Semiconductor Mfg 0.79 0.82 -0.03 9.61HSBC Holdings PLC 0.75 0.75 0.00 -8.12Novartis AG 0.71 0.71 0.00 -0.66Toyota Motor Corp 0.67 0.67 0.00 1.96Roche Holding AG 0.64 0.64 0.00 -5.74Alibaba Group Holding Ltd 0.59 0.60 -0.01 6.44Royal Dutch Shell PLC 0.58 0.58 0.00 -5.17
% of Portfolio 7.76 7.80 -0.04
Portfolio Characteristics
Portfolio Benchmark
Wtd. Avg. Mkt. Cap ($M) 56,737 56,797Median Mkt. Cap ($M) 1,808 1,813Price/Earnings Ratio 14.40 14.40Price/Book Ratio 2.13 2.135 Yr. EPS Growth Rate (%) 10.75 10.83Current Yield (%) 2.98 2.98Beta (5 Years, Monthly) 0.94 1.00Number of Securities 6,303 5,990
Distribution of Market Capitalization (%) Region Weights (%)
Commissioners of the Land Office, State of OklahomaInternational Equity Composite vs. Vanguard Spl Tot Int'l Stock IndexPortfolio Characteristics
As of March 31, 2018
Page 22 of 47

Plan Sponsor Scattergram - 10 Years Up/Down Markets - 10 Years
Plan Sponsor Peer Group Analysis - Multi Statistics (Beta vs. S&P 500)
ReturnStandardDeviation
Total Fixed Income Composite 6.58 5.15Bloomberg US Unv Bond Index 4.01 3.32Median 4.57 4.11
10Years
10Years
10Years
10Years
10Years
Total Fixed Income Composite 5.15 (33) 1.19 (19) 6.18 (21) 3.21 (31) 0.23 (2)Bloomberg US Unv Bond Index 3.32 (78) 1.09 (34) 3.65 (67) 1.95 (76) 0.05 (63)
Median 4.11 0.97 4.22 2.37 0.08
Population 154 154 154 154 154
Commissioners of the Land Office, State of OklahomaTotal Fixed Income Composite vs. All Master Trust-US Fixed Income Segment
As of March 31, 2018
Performance shown is gross of fees. Calculation is based on monthly periodicity. Parentheses contain percentile ranks.
Page 23 of 47

Portfolio Characteristics
Portfolio Benchmark
Avg. Maturity 8.45 8.19Avg. Quality Baa1 N/AYield To Maturity (%) 4.47 3.46Coupon Rate (%) 4.89 3.43Current Yield (%) 4.67 0.20
Sector Distribution (%)
Commissioners of the Land Office, State of OklahomaTotal Fixed Income Composite vs. Bloomberg US Unv Bond IndexPortfolio Characteristics
As of March 31, 2018
Total Fixed Income Composite sector allocations reflect the market value weighted average of the composite's underlying manager allocations excluding the Bank of Oklahoma Cash and Oklahoma Treasurer's Cash Pool.
Page 24 of 47

Comparative Performance
Historical Statistics - 7 Years Actual Correlation - 7 Years
QTD CYTD1
Year3
Years5
Years7
Years2017 2016 2015 2014
SinceIncep.
InceptionDate
REITs Composite -7.46 -7.46 -2.23 2.58 7.76 9.45 6.84 8.78 5.52 32.68 9.08 08/01/2008
FTSE NAREIT Eq REITs Index (TR) -8.20 -8.20 -4.51 1.08 5.92 8.18 5.23 8.52 3.20 30.14 6.78Difference 0.74 0.74 2.28 1.50 1.84 1.27 1.61 0.26 2.32 2.54 2.30
REITs CompositeFTSE NAREIT EqREITs Index (TR)
S&P 500 Index (CapWtd)
Bloomberg US AggBond Index
Standard Deviation 15.05 15.07 10.94 2.79Sharpe Ratio 0.66 0.58 1.13 0.95Downside Risk 9.06 9.31 6.11 1.64Excess Return 9.92 8.75 12.35 2.66
ActualCorrelation
FTSE NAREIT Eq REITs Index (TR) 1.00S&P 500 Index (Cap Wtd) 0.55Russell 2000 Index 0.53MSCI EAFE Index (USD) (Net) 0.51MSCI Emg Mkts Index (USD) (Net) 0.50Bloomberg US Agg Bond Index 0.45Bloomberg US Trsy US TIPS Index 0.44Wilshire US REIT Index 1.00HFN FOF Multi-Strat Index (Net) 0.35Bloomberg Cmdty Index (TR) 0.21ICE BofAML 3 Mo US T-Bill Index -0.07Consumer Price Index -0.11
Commissioners of the Land Office, State of OklahomaREITs Composite
As of March 31, 2018
Performance shown is gross of fees. Calculation is based on monthly periodicity.
Page 25 of 47

QTD CYTD1
Year3
Years5
Years7
Years10
YearsSinceIncep.
InceptionDate
Robeco BPAM Premium Eq (SA) -0.47 -0.47 12.11 10.29 13.86 12.75 11.99 12.08 01/01/1996
Russell 3000 Val Custom Index -2.82 -2.82 6.81 7.87 10.71 10.87 8.39 10.22Difference 2.35 2.35 5.30 2.42 3.15 1.88 3.60 1.86
AJO Large Cap Value (SA) -2.61 -2.61 10.50 6.19 10.57 10.99 8.27 6.99 10/01/2000
Russell 1000 Val Custom Index -2.83 -2.83 6.95 7.88 10.78 11.00 7.78 5.68Difference 0.22 0.22 3.55 -1.69 -0.21 -0.01 0.49 1.31
Vanguard Hi Dv Yld;Inv (VHDYX) -2.85 -2.85 9.41 N/A N/A N/A N/A 12.65 10/01/2016
FTSE Hi Div Yld Index -2.81 -2.81 9.56 10.06 11.95 12.78 9.21 12.82Difference -0.04 -0.04 -0.15 N/A N/A N/A N/A -0.17
BlackRock R 1000 Index Fund (CF) -0.71 -0.71 13.88 10.32 13.09 N/A N/A 13.09 04/01/2013
Russell 1000 Index -0.69 -0.69 13.98 10.39 13.17 12.57 9.61 13.17Difference -0.02 -0.02 -0.10 -0.07 -0.08 N/A N/A -0.08
Silvercrest Small Cap Value (SA) -4.77 -4.77 6.25 8.45 11.42 10.74 11.70 10.96 06/01/2002
Russell 2000 Val Index -2.64 -2.64 5.13 7.87 9.96 9.42 8.61 8.41Difference -2.13 -2.13 1.12 0.58 1.46 1.32 3.09 2.55
Harvest Fund Advisors MLP (SA) -9.40 -9.40 -17.81 -9.94 N/A N/A N/A -5.23 03/01/2014
S&P MLP Index (TR) -10.73 -10.73 -18.72 -11.68 -4.92 0.70 6.18 -7.95Difference 1.33 1.33 0.91 1.74 N/A N/A N/A 2.72
Tortoise Capital Advisors MLP (SA) -9.79 -9.79 -16.95 -8.88 N/A N/A N/A -6.95 05/01/2014
Tortoise MLP Index (TR) -11.10 -11.10 -19.43 -10.23 -3.77 1.55 6.90 -8.40Difference 1.31 1.31 2.48 1.35 N/A N/A N/A 1.45
Vanguard Tot I Stk;Ins + (VTPSX) -0.45 -0.45 17.11 N/A N/A N/A N/A 5.37 05/01/2015
Vanguard Spl Tot Int'l Stock Index -1.14 -1.14 16.73 6.78 6.39 4.62 2.84 5.15Difference 0.69 0.69 0.38 N/A N/A N/A N/A 0.22
Dodge & Cox Fixed Income (SA) -0.88 -0.88 2.21 2.12 2.76 3.71 4.91 6.11 08/01/1996
Bloomberg US Agg Bond Index -1.46 -1.46 1.20 1.20 1.82 2.92 3.63 5.19Difference 0.58 0.58 1.01 0.92 0.94 0.79 1.28 0.92
Cutwater Core Plus Select Income (SA) -1.57 -1.57 4.25 3.14 N/A N/A N/A 4.58 12/01/2013
Bloomberg US Crdt Index -2.13 -2.13 2.59 2.16 2.83 4.36 5.15 3.65Difference 0.56 0.56 1.66 0.98 N/A N/A N/A 0.93
Commissioners of the Land Office, State of OklahomaComparative Performance (Net of Fees) - Trailing Periods
As of March 31, 2018
RVK began monitoring the assets of Commissioners of the Land Office, State of Oklahoma as of July 1, 2005. Prior historical data was provided by the previous consultant. Performance shown is net of fees. Please see the Addendum for custom index definitions.
Page 26 of 47

Commissioners of the Land Office, State of OklahomaComparative Performance (Net of Fees) - Trailing Periods
As of March 31, 2018
QTD CYTD1
Year3
Years5
Years7
Years10
YearsSinceIncep.
InceptionDate
Guggenheim (BBB) (SA) -2.02 -2.02 3.95 N/A N/A N/A N/A 4.28 05/01/2016
Bloomberg US Corp Inv Grade Index -2.32 -2.32 2.70 2.30 3.02 4.55 5.42 2.40Difference 0.30 0.30 1.25 N/A N/A N/A N/A 1.88
JPMorgan MBS (SA) -0.55 -0.55 1.45 1.46 1.99 2.96 N/A 3.22 07/01/2010
Bloomberg US MBS Index -1.19 -1.19 0.77 1.12 1.80 2.44 3.46 2.40Difference 0.64 0.64 0.68 0.34 0.19 0.52 N/A 0.82
Guggenheim CMBS (SA) 0.24 0.24 3.76 3.22 3.15 4.65 N/A 5.59 07/01/2010
Bloomberg US CMBS Inv Grade Aaa Index -1.35 -1.35 0.93 1.46 2.03 3.09 4.23 3.52Difference 1.59 1.59 2.83 1.76 1.12 1.56 N/A 2.07
Allianz Global Investors US High Yield (SA) -1.16 -1.16 2.63 3.32 3.48 5.02 7.09 7.30 07/01/2001
ICE BofAML US Hi Yld Master II Index -0.91 -0.91 3.69 5.18 5.01 6.22 8.12 7.76Difference -0.25 -0.25 -1.06 -1.86 -1.53 -1.20 -1.03 -0.46
ICE BofAML US Hi Yld BB-B Cnst Index -1.11 -1.11 3.43 4.74 4.85 6.09 7.44 7.29Difference -0.05 -0.05 -0.80 -1.42 -1.37 -1.07 -0.35 0.01
Fort Washington High Yield (SA) -1.03 -1.03 3.75 N/A N/A N/A N/A 4.26 07/01/2015
ICE BofAML US Cash Pay Hi Yld Index -0.94 -0.94 3.67 5.17 4.98 6.20 8.04 5.66Difference -0.09 -0.09 0.08 N/A N/A N/A N/A -1.40
ICE BofAML US Hi Yld BB-B Cnst Index -1.11 -1.11 3.43 4.74 4.85 6.09 7.44 5.17Difference 0.08 0.08 0.32 N/A N/A N/A N/A -0.91
Cohen & Steers Preferreds (SA) -1.57 -1.57 5.54 6.08 6.97 8.54 9.09 7.65 04/01/2007
50% ICE BofAML All Cap/50% ICE BofAML Fxd Pref Idx -1.40 -1.40 4.06 4.45 5.23 6.35 5.86 4.49Difference -0.17 -0.17 1.48 1.63 1.74 2.19 3.23 3.16
CenterSquare US REIT Total Return Composite (SA) -7.59 -7.59 -2.69 2.06 7.21 8.82 N/A 8.47 08/01/2008
FTSE NAREIT Eq REITs Index (TR) -8.20 -8.20 -4.51 1.08 5.92 8.18 6.37 6.78Difference 0.61 0.61 1.82 0.98 1.29 0.64 N/A 1.69
Oklahoma Treasurer's Cash Pool 0.44 0.44 1.75 1.76 1.81 1.99 N/A 2.02 12/01/2010
ICE BofAML 3 Mo US T-Bill Index 0.35 0.35 1.11 0.53 0.34 0.27 0.34 0.26Difference 0.09 0.09 0.64 1.23 1.47 1.72 N/A 1.76
Bank of Oklahoma Cash 0.32 0.32 1.04 0.52 0.33 0.25 0.36 1.28 07/01/2002
ICE BofAML 3 Mo US T-Bill Index 0.35 0.35 1.11 0.53 0.34 0.27 0.34 1.29Difference -0.03 -0.03 -0.07 -0.01 -0.01 -0.02 0.02 -0.01
RVK began monitoring the assets of Commissioners of the Land Office, State of Oklahoma as of July 1, 2005. Prior historical data was provided by the previous consultant. Performance shown is net of fees. Please see the Addendum for custom index definitions.
Page 27 of 47

2017 2016 2015 2014 2013 2012 2011 2010 2009 2008
Robeco BPAM Premium Eq (SA) 18.44 15.11 0.87 12.47 40.01 15.87 -1.73 14.31 32.45 -23.93
Russell 3000 Val Custom Index 13.19 18.40 -4.13 12.70 32.69 17.55 -0.10 16.23 19.76 -33.02Difference 5.25 -3.29 5.00 -0.23 7.32 -1.68 -1.63 -1.92 12.69 9.09
AJO Large Cap Value (SA) 15.78 9.62 -0.47 9.89 38.00 17.26 2.15 15.17 15.68 -33.86
Russell 1000 Val Custom Index 13.66 17.34 -3.83 13.45 32.53 17.51 0.39 15.51 19.69 -36.85Difference 2.12 -7.72 3.36 -3.56 5.47 -0.25 1.76 -0.34 -4.01 2.99
Vanguard Hi Dv Yld;Inv (VHDYX) 16.37 N/A N/A N/A N/A N/A N/A N/A N/A N/A
FTSE Hi Div Yld Index 16.51 16.96 0.39 13.58 30.34 12.75 10.65 14.36 17.74 -32.32Difference -0.14 N/A N/A N/A N/A N/A N/A N/A N/A N/A
BlackRock R 1000 Index Fund (CF) 21.57 11.99 0.88 13.14 N/A N/A N/A N/A N/A N/A
Russell 1000 Index 21.69 12.05 0.92 13.24 33.11 16.42 1.50 16.10 28.43 -37.60Difference -0.12 -0.06 -0.04 -0.10 N/A N/A N/A N/A N/A N/A
Silvercrest Small Cap Value (SA) 11.60 29.26 -2.82 5.01 37.79 15.14 0.15 25.34 22.90 -15.26
Russell 2000 Val Index 7.84 31.74 -7.47 4.22 34.52 18.05 -5.50 24.50 20.58 -28.92Difference 3.76 -2.48 4.65 0.79 3.27 -2.91 5.65 0.84 2.32 13.66
Harvest Fund Advisors MLP (SA) -5.49 19.22 -30.04 N/A N/A N/A N/A N/A N/A N/A
S&P MLP Index (TR) -5.58 21.95 -35.07 7.66 29.75 4.95 14.47 35.17 78.79 -37.46Difference 0.09 -2.73 5.03 N/A N/A N/A N/A N/A N/A N/A
Tortoise Capital Advisors MLP (SA) -3.30 14.65 -25.97 N/A N/A N/A N/A N/A N/A N/A
Tortoise MLP Index (TR) -6.00 23.50 -31.90 8.12 30.16 5.43 13.73 37.71 77.91 -38.61Difference 2.70 -8.85 5.93 N/A N/A N/A N/A N/A N/A N/A
Vanguard Tot I Stk;Ins + (VTPSX) 27.57 4.72 N/A N/A N/A N/A N/A N/A N/A N/A
Vanguard Spl Tot Int'l Stock Index 27.41 4.72 -4.29 -3.39 15.76 17.04 -14.31 10.69 40.44 -45.52Difference 0.16 0.00 N/A N/A N/A N/A N/A N/A N/A N/A
Dodge & Cox Fixed Income (SA) 4.23 4.67 -0.03 5.95 0.64 7.85 5.08 7.47 14.68 1.41
Bloomberg US Agg Bond Index 3.54 2.65 0.55 5.97 -2.02 4.21 7.84 6.54 5.93 5.24Difference 0.69 2.02 -0.58 -0.02 2.66 3.64 -2.76 0.93 8.75 -3.83
Cutwater Core Plus Select Income (SA) 7.72 7.54 -1.62 8.18 N/A N/A N/A N/A N/A N/A
Bloomberg US Crdt Index 6.18 5.63 -0.77 7.53 -2.01 9.37 8.35 8.47 16.04 -3.08Difference 1.54 1.91 -0.85 0.65 N/A N/A N/A N/A N/A N/A
Commissioners of the Land Office, State of OklahomaComparative Performance (Net of Fees) - Calendar Years
As of March 31, 2018
RVK began monitoring the assets of Commissioners of the Land Office, State of Oklahoma as of July 1, 2005. Prior historical data was provided by the previous consultant. Performance shown is net of fees. Please see the Addendum for custom index definitions.
Page 28 of 47

Commissioners of the Land Office, State of OklahomaComparative Performance (Net of Fees) - Calendar Years
As of March 31, 2018
2017 2016 2015 2014 2013 2012 2011 2010 2009 2008
Guggenheim (BBB) (SA) 8.26 N/A N/A N/A N/A N/A N/A N/A N/A N/A
Bloomberg US Corp Inv Grade Index 6.42 6.11 -0.68 7.46 -1.53 9.82 8.15 9.00 18.68 -4.94Difference 1.84 N/A N/A N/A N/A N/A N/A N/A N/A N/A
JPMorgan MBS (SA) 2.67 2.06 1.75 5.32 -0.64 5.95 5.64 N/A N/A N/A
Bloomberg US MBS Index 2.47 1.67 1.51 6.08 -1.41 2.59 6.23 5.37 5.89 8.34Difference 0.20 0.39 0.24 -0.76 0.77 3.36 -0.59 N/A N/A N/A
Guggenheim CMBS (SA) 5.30 3.85 1.80 5.72 0.70 10.93 6.95 N/A N/A N/A
Bloomberg US CMBS Inv Grade Aaa Index 3.11 3.40 1.22 4.29 -0.56 6.85 6.02 14.62 27.17 -18.71Difference 2.19 0.45 0.58 1.43 1.26 4.08 0.93 N/A N/A N/A
Allianz Global Investors US High Yield (SA) 5.94 12.86 -4.61 0.43 8.03 12.55 6.40 14.09 45.30 -19.71
ICE BofAML US Hi Yld Master II Index 7.48 17.49 -4.64 2.50 7.42 15.58 4.38 15.19 57.51 -26.39Difference -1.54 -4.63 0.03 -2.07 0.61 -3.03 2.02 -1.10 -12.21 6.68
ICE BofAML US Hi Yld BB-B Cnst Index 6.98 14.72 -2.79 3.49 6.31 14.58 5.40 14.26 46.06 -23.31Difference -1.04 -1.86 -1.82 -3.06 1.72 -2.03 1.00 -0.17 -0.76 3.60
Fort Washington High Yield (SA) 7.33 12.72 N/A N/A N/A N/A N/A N/A N/A N/A
ICE BofAML US Cash Pay Hi Yld Index 7.48 17.34 -4.55 2.44 7.38 15.44 4.50 15.24 56.28 -26.21Difference -0.15 -4.62 N/A N/A N/A N/A N/A N/A N/A N/A
ICE BofAML US Hi Yld BB-B Cnst Index 6.98 14.72 -2.79 3.49 6.31 14.58 5.40 14.26 46.06 -23.31Difference 0.35 -2.00 N/A N/A N/A N/A N/A N/A N/A N/A
Cohen & Steers Preferreds (SA) 11.76 5.20 7.05 13.61 2.88 22.69 3.96 17.11 47.06 -24.70
50% ICE BofAML All Cap/50% ICE BofAML Fxd Pref Idx 10.10 3.76 4.18 12.15 0.58 17.47 2.27 15.64 33.20 -28.01Difference 1.66 1.44 2.87 1.46 2.30 5.22 1.69 1.47 13.86 3.31
CenterSquare US REIT Total Return Composite (SA) 6.34 8.20 4.96 31.98 3.20 17.11 9.07 30.12 36.78 N/A
FTSE NAREIT Eq REITs Index (TR) 5.23 8.52 3.20 30.14 2.47 18.06 8.29 27.94 28.01 -37.74Difference 1.11 -0.32 1.76 1.84 0.73 -0.95 0.78 2.18 8.77 N/A
Oklahoma Treasurer's Cash Pool 1.73 1.77 1.77 1.82 2.01 2.32 2.73 N/A N/A N/A
ICE BofAML 3 Mo US T-Bill Index 0.86 0.33 0.05 0.04 0.07 0.11 0.10 0.13 0.21 2.06Difference 0.87 1.44 1.72 1.78 1.94 2.21 2.63 N/A N/A N/A
Bank of Oklahoma Cash 0.83 0.31 0.12 0.03 0.05 0.08 0.04 0.10 0.13 2.47
ICE BofAML 3 Mo US T-Bill Index 0.86 0.33 0.05 0.04 0.07 0.11 0.10 0.13 0.21 2.06Difference -0.03 -0.02 0.07 -0.01 -0.02 -0.03 -0.06 -0.03 -0.08 0.41
RVK began monitoring the assets of Commissioners of the Land Office, State of Oklahoma as of July 1, 2005. Prior historical data was provided by the previous consultant. Performance shown is net of fees. Please see the Addendum for custom index definitions.
Page 29 of 47

Page 30 of 47

Peer Group Scattergram - 10 Years Up/Down Markets - 10 Years
Peer Group Analysis - Multi Statistics - 10 Years (Excess Return vs. Risk Free)
Sector Weights (%)
Performance
Portfolio Characteristics and Dist. of Market Cap (%)
QTD1
Year3
Years5
Years7
Years10
Years2017 2016 2015 2014 2013
Manager -0.33 12.76 10.94 14.54 13.45 12.70 19.12 15.79 1.47 13.15 40.90
Benchmark -2.82 6.81 7.87 10.71 10.87 8.39 13.19 18.40 -4.13 12.70 32.69Difference 2.49 5.95 3.07 3.83 2.58 4.31 5.93 -2.61 5.60 0.45 8.21
Peer Group Median -1.80 9.85 8.62 11.33 11.04 9.54 16.49 16.69 -3.42 10.10 34.71Rank 20 24 14 8 13 5 23 56 10 17 14
Population 66 65 62 58 51 42 67 71 72 75 74
ReturnStandardDeviation
Manager 12.70 15.85Benchmark 8.39 16.99Median 9.54 18.05
5.00
8.00
11.00
14.00
17.00
DownsideRisk
Manager 12.91 (6) 3.85 (82) 1.00 (1) 0.82 (7) 10.02 (83)Benchmark 9.07 (81) 0.00 (100) N/A 0.56 (73) 11.31 (62)
Median 10.14 5.27 0.22 0.61 11.57
Portfolio Benchmark
Wtd. Avg. Mkt. Cap ($M) 95,365 113,171Median Mkt. Cap ($M) 22,817 1,495Price/Earnings Ratio 18.13 17.04Price/Book Ratio 2.44 2.095 Yr. EPS Growth Rate (%) 10.26 8.28Current Yield (%) 1.69 2.46Beta (5 Years, Monthly) 1.06 1.00Number of Securities 128 2,109Active Share 72.86 N/A
Robeco BPAM Premium Eq (SA)
IM U.S. All Cap Value Equity (SA+CF)
As of March 31, 2018
Peer Group:Benchmark: Russell 3000 Val Custom IndexManager:
Performance shown is gross of fees and client specific. Calculation is based on monthly periodicity. Parentheses contain percentile ranks. Please see the Addendum for custom index defintions.
Page 31 of 47

Peer Group Scattergram - 10 Years Up/Down Markets - 10 Years
Peer Group Analysis - Multi Statistics - 10 Years (Excess Return vs. Risk Free)
Sector Weights (%)
Performance
Portfolio Characteristics and Dist. of Market Cap (%)
QTD1
Year3
Years5
Years7
Years10
Years2017 2016 2015 2014 2013
Manager -2.53 10.83 6.51 10.90 11.32 8.69 16.12 9.95 -0.17 10.22 38.42
Benchmark -2.83 6.95 7.88 10.78 11.00 7.78 13.66 17.34 -3.83 13.45 32.53Difference 0.30 3.88 -1.37 0.12 0.32 0.91 2.46 -7.39 3.66 -3.23 5.89
Peer Group Median -1.95 10.53 8.88 11.99 11.70 9.03 17.22 14.58 -2.25 12.24 34.27Rank 67 47 89 73 62 62 66 84 30 76 23
Population 307 307 302 291 278 251 329 361 379 404 406
ReturnStandardDeviation
Manager 8.69 15.33Benchmark 7.78 15.84Median 9.02 15.68
6.00
8.00
10.00
12.00
14.00
16.00
DownsideRisk
Manager 9.22 (64) 3.35 (75) 0.23 (57) 0.60 (54) 10.67 (53)Benchmark 8.46 (81) 0.00 (100) N/A 0.53 (80) 11.20 (38)
Median 9.62 4.38 0.29 0.61 10.71
Portfolio Benchmark
Wtd. Avg. Mkt. Cap ($M) 84,470 122,119Median Mkt. Cap ($M) 8,840 9,447Price/Earnings Ratio 15.85 16.99Price/Book Ratio 2.40 2.135 Yr. EPS Growth Rate (%) 12.72 8.42Current Yield (%) 2.13 2.51Beta (5 Years, Monthly) 1.08 1.00Number of Securities 143 711Active Share 73.42 N/A
AJO Large Cap Value (SA)
IM U.S. Large Cap Value Equity (SA+CF)
As of March 31, 2018
Peer Group:Benchmark: Russell 1000 Val Custom IndexManager:
Performance shown is gross of fees and client specific. Calculation is based on monthly periodicity. Parentheses contain percentile ranks. Please see the Addendum for custom index defintions.
Page 32 of 47

Peer Group Scattergram - 10 Years Up/Down Markets - 10 Years
Peer Group Analysis - Multi Statistics - 10 Years (Excess Return vs. Risk Free)
Sector Weights (%)
Performance
Portfolio Characteristics and Dist. of Market Cap (%)
QTD1
Year3
Years5
Years7
Years10
Years2017 2016 2015 2014 2013
Manager -2.86 9.40 9.90 11.79 12.60 9.01 16.37 16.75 0.30 13.38 30.13
Benchmark -2.81 9.56 10.06 11.95 12.78 9.21 16.51 16.96 0.39 13.58 30.34Difference -0.05 -0.16 -0.16 -0.16 -0.18 -0.20 -0.14 -0.21 -0.09 -0.20 -0.21
Peer Group Median -2.38 9.26 7.70 9.78 9.86 7.86 16.06 13.79 -3.15 10.06 28.74Rank 68 49 12 7 2 14 46 23 12 10 31
Population 564 534 458 376 287 232 540 540 521 503 434
ReturnStandardDeviation
Manager 9.01 14.55Benchmark 9.21 14.56Median 7.86 14.22
6.00
8.00
10.00
12.00
14.00
DownsideRisk
Manager 9.40 (13) 0.09 (100) -2.22 (100) 0.64 (26) 10.12 (42)Benchmark 9.59 (8) 0.00 (100) N/A 0.66 (22) 10.11 (42)
Median 8.29 5.08 -0.25 0.58 9.86
Portfolio Benchmark
Wtd. Avg. Mkt. Cap ($M) 176,364 176,376Median Mkt. Cap ($M) 5,800 5,931Price/Earnings Ratio 19.29 19.29Price/Book Ratio 2.88 2.885 Yr. EPS Growth Rate (%) 3.06 3.06Current Yield (%) 3.14 3.14Beta (5 Years, Monthly) 1.00 1.00Number of Securities 382 378Active Share 0.08 N/A
Vanguard Hi Dv Yld;Inv (VHDYX)
IM Equity Income (MF)
As of March 31, 2018
Peer Group:Benchmark: FTSE Hi Div Yld IndexManager:
Performance shown is net of fees and product specific. Calculation is based on monthly periodicity. Parentheses contain percentile ranks.
Page 33 of 47

Peer Group Scattergram - 7 Years Up/Down Markets - 7 Years
Peer Group Analysis - Multi Statistics - 7 Years (Excess Return vs. Risk Free)
Sector Weights (%)
Performance
Portfolio Characteristics and Dist. of Market Cap (%)
QTD1
Year3
Years5
Years7
Years10
Years2017 2016 2015 2014 2013
Manager -0.71 13.93 10.37 13.15 12.56 N/A 21.65 12.04 0.93 13.23 33.09
Benchmark -0.69 13.98 10.39 13.17 12.57 9.61 21.69 12.05 0.92 13.24 33.11Difference -0.02 -0.05 -0.02 -0.02 -0.01 N/A -0.04 -0.01 0.01 -0.01 -0.02
Peer Group Median -0.44 14.02 10.23 13.32 12.73 9.75 21.82 10.50 1.39 13.43 32.98Rank 60 53 45 56 57 N/A 52 30 56 53 50
Population 248 247 243 233 217 194 269 297 315 337 355
ReturnStandardDeviation
Manager 12.56 11.05Benchmark 12.57 11.05Median 12.73 11.27
2.00
4.00
6.00
8.00
10.00
DownsideRisk
Manager 12.24 (58) 0.02 (100) -0.61 (90) 1.10 (53) 6.27 (52)Benchmark 12.25 (58) 0.00 (100) N/A 1.10 (53) 6.27 (52)
Median 12.40 2.62 0.08 1.11 6.30
Portfolio Benchmark
Wtd. Avg. Mkt. Cap ($M) 177,309 177,282Median Mkt. Cap ($M) 10,414 10,406Price/Earnings Ratio 21.22 21.23Price/Book Ratio 3.28 3.285 Yr. EPS Growth Rate (%) 14.45 14.45Current Yield (%) 1.92 1.92Beta (5 Years, Monthly) 1.00 1.00Number of Securities 973 975Active Share 0.26 N/A
BlackRock Russell 1000 Index NL (CF)
IM U.S. Large Cap Core Equity (SA+CF)
As of March 31, 2018
Peer Group:Benchmark: Russell 1000 IndexManager:
Performance shown is gross of fees and product specific. Calculation is based on monthly periodicity. Parentheses contain percentile ranks.
Page 34 of 47

Peer Group Scattergram - 10 Years Up/Down Markets - 10 Years
Peer Group Analysis - Multi Statistics - 10 Years (Excess Return vs. Risk Free)
Sector Weights (%)
Performance
Portfolio Characteristics and Dist. of Market Cap (%)
QTD1
Year3
Years5
Years7
Years10
Years2017 2016 2015 2014 2013
Manager -4.65 6.81 9.03 12.01 11.32 12.31 12.18 29.95 -2.29 5.59 38.53
Benchmark -2.64 5.13 7.87 9.96 9.42 8.61 7.84 31.74 -7.47 4.22 34.52Difference -2.01 1.68 1.16 2.05 1.90 3.70 4.34 -1.79 5.18 1.37 4.01
Peer Group Median -1.78 8.37 8.71 11.68 11.11 10.74 11.60 26.10 -4.27 5.66 38.07Rank 95 67 46 43 43 18 46 28 31 51 48
Population 207 207 200 192 182 167 220 231 240 252 254
ReturnStandardDeviation
Manager 12.31 18.29Benchmark 8.61 20.10Median 10.74 19.96
10.00
12.00
14.00
16.00
18.00
DownsideRisk
Manager 13.07 (25) 4.80 (68) 0.64 (19) 0.70 (14) 11.77 (83)Benchmark 9.97 (92) 0.00 (100) N/A 0.50 (89) 13.70 (30)
Median 12.03 5.82 0.37 0.61 13.06
Portfolio Benchmark
Wtd. Avg. Mkt. Cap ($M) 2,692 2,045Median Mkt. Cap ($M) 2,427 742Price/Earnings Ratio 24.28 17.69Price/Book Ratio 2.32 1.735 Yr. EPS Growth Rate (%) 12.74 6.25Current Yield (%) 1.26 1.94Beta (5 Years, Monthly) 1.02 1.00Number of Securities 60 1,398Active Share 94.16 N/A
Silvercrest Small Cap Value (SA)
IM U.S. Small Cap Value Equity (SA+CF)
As of March 31, 2018
Peer Group:Benchmark: Russell 2000 Val IndexManager:
Performance shown is gross of fees and client specific. Calculation is based on monthly periodicity. Parentheses contain percentile ranks.
Page 35 of 47

Historical Statistics - 10 Years
Performance
Portfolio Characteristics
Historical Statistics - 10 Years
Distribution of Market Capitalization (%)
QTD1
Year3
Years5
Years7
Years10
Years2017 2016 2015 2014 2013
Manager -9.22 -17.18 -9.26 -0.79 5.80 10.40 -4.78 20.10 -29.50 17.04 36.03
Benchmark -10.73 -18.72 -11.68 -4.92 0.70 6.18 -5.58 21.95 -35.07 7.66 29.75Difference 1.51 1.54 2.42 4.13 5.10 4.22 0.80 -1.85 5.57 9.38 6.28
0.00
3.00
6.00
9.00
12.00
15.00
18.00
21.00
24.00
0.90
4.16
0.000.60 0.39
18.8519.85
Manager Benchmark
Standard Deviation 18.85 19.85Sharpe Ratio 0.60 0.39Tracking Error 4.16 0.00Info Ratio 0.90 N/A
0.00
15.00
30.00
45.00
60.00
75.00
90.00
105.00
120.00
135.00
84.99
100.00101.32 100.00
12.51 13.60
Manager Benchmark
Downside Risk 12.51 13.60Up Mkt Capture 101.32 100.00Down Mkt Capture 84.99 100.00
Portfolio Benchmark
Wtd. Avg. Mkt. Cap ($M) 19,535 18,225Median Mkt. Cap ($M) 3,140 2,541Price/Earnings Ratio 20.06 18.19Price/Book Ratio 2.14 2.305 Yr. EPS Growth Rate (%) -5.33 -0.92Current Yield (%) 8.40 8.70Beta (3 Years, Monthly) 0.94 1.00Number of Securities 46 63
Manager Benchmark
0.00
15.00
30.00
45.00
60.00
$25 Bil - $75 Bil
$15 Bil - $25 Bil
$2 Bil - $15 Bil
$0 - $2 Bil
26.22 23.57
39.76
10.45
28.1034.21
25.54
12.16
Harvest Fund Advisors MLP (SA) As of March 31, 2018S&P MLP Index (TR)
Manager:
Benchmark:
Performance shown is gross of fees and is product specific manager performance prior to 03/01/2014. Calculations are based on monthly periodicity.
Page 36 of 47

Historical Statistics - 10 Years
Performance
Portfolio Characteristics
Historical Statistics - 10 Years
Distribution of Market Capitalization (%)
QTD1
Year3
Years5
Years7
Years10
Years2017 2016 2015 2014 2013
Manager -9.64 -16.42 -8.30 -0.20 5.46 9.94 -2.69 15.36 -25.49 15.03 37.48
Benchmark -11.10 -19.43 -10.23 -3.77 1.55 6.90 -6.00 23.50 -31.90 8.12 30.16Difference 1.46 3.01 1.93 3.57 3.91 3.04 3.31 -8.14 6.41 6.91 7.32
Manager Benchmark
Standard Deviation 18.89 19.80Sharpe Ratio 0.58 0.42Tracking Error 3.65 0.00Info Ratio 0.72 N/A
Manager Benchmark
Downside Risk 12.63 13.46Up Mkt Capture 100.41 100.00Down Mkt Capture 88.45 100.00
Portfolio Benchmark
Wtd. Avg. Mkt. Cap ($M) 17,433 14,433Median Mkt. Cap ($M) 7,251 1,501Price/Earnings Ratio 18.60 18.15Price/Book Ratio 2.53 2.265 Yr. EPS Growth Rate (%) 5.65 1.20Current Yield (%) 7.36 8.91Beta (3 Years, Monthly) 0.93 1.00Number of Securities 27 76
Manager Benchmark
0.00
15.00
30.00
45.00
60.00
$25 Bil - $75 Bil
$15 Bil - $25 Bil
$2 Bil - $15 Bil
$0 - $2 Bil
19.76 23.07
42.57
14.6024.16 24.77
48.61
2.46
Tortoise Capital Advisors MLP (SA) As of March 31, 2018Tortoise MLP Index (TR)
Manager:
Benchmark:
Performance shown is gross of fees and is product specific manager performance prior to 05/01/2014. Calculations are based on monthly periodicity.
Page 37 of 47

Peer Group Scattergram - 10 Years Up/Down Markets - 10 Years
Peer Group Analysis - Multi Statistics - 10 Years (Excess Return vs. Risk Free)
Region Weights (%)
Performance
Portfolio Characteristics and Dist. of Market Cap (%)
QTD1
Year3
Years5
Years7
Years10
Years2017 2016 2015 2014 2013
Manager -0.45 17.11 6.97 6.45 4.72 2.86 27.57 4.73 -4.22 -4.13 15.19
Benchmark -1.14 16.73 6.78 6.39 4.62 2.84 27.41 4.72 -4.29 -3.39 15.76Difference 0.69 0.38 0.19 0.06 0.10 0.02 0.16 0.01 0.07 -0.74 -0.57
Peer Group Median -0.17 17.85 6.58 6.54 5.25 3.09 28.31 0.88 -1.26 -4.55 17.74Rank 60 59 40 52 63 56 55 17 69 44 65
Population 474 474 387 347 309 233 476 482 417 396 375
ReturnStandardDeviation
Manager 2.86 19.07Benchmark 2.84 18.67Median 3.09 18.68
10.00
12.00
14.00
16.00
DownsideRisk
Manager 4.35 (53) 2.30 (100) 0.04 (50) 0.23 (56) 13.65 (49)Benchmark 4.25 (57) 0.00 (100) N/A 0.23 (57) 13.46 (51)
Median 4.43 4.34 0.04 0.24 13.54
Portfolio Benchmark
Wtd. Avg. Mkt. Cap ($M) 56,737 56,797Median Mkt. Cap ($M) 1,808 1,813Price/Earnings Ratio 14.40 14.40Price/Book Ratio 2.13 2.135 Yr. EPS Growth Rate (%) 10.75 10.83Current Yield (%) 2.98 2.98Beta (5 Years, Monthly) 0.97 1.00Number of Securities 6,303 5,990Active Share 1.58 N/A
Vanguard Tot I Stk;Ins + (VTPSX)
IM All ACWI Ex US (MF)
As of March 31, 2018
Peer Group:Benchmark: Vanguard Spl Tot Int'l Stock IndexManager:
Performance shown is net of fees and product specific. Calculation is based on monthly periodicity. Parentheses contain percentile ranks. Benchmark consists of Tot Int'l Comp Index (an asset-weighted blend of stocks in the MSCI Eur Index (USD) (Net), MSCI Pac Index (USD) (Net), and MSCI Emg Mkts Index (USD) (Net)) through 08/31/2006; MSCI EAFE + Emg Mkts Index (USD) (Net) through 12/15/2010; MSCI ACW Ex US IM Index (USD) (Net) through 06/02/2013; and FTSE Gbl All Cap Ex US Index (USD) (Net) thereafter.
Page 38 of 47

Peer Group Scattergram - 10 Years Up/Down Markets - 10 Years
Peer Group Analysis - Multi Statistics - 10 Years (Excess Return vs. Risk Free)
Sector Distribution (%)
Performance
Portfolio Characteristics
QTD1
Year3
Years5
Years7
Years10
Years2017 2016 2015 2014 2013
Manager -0.84 2.38 2.29 2.92 3.87 5.08 4.40 4.84 0.13 6.12 0.80
Benchmark -1.46 1.20 1.20 1.82 2.92 3.63 3.54 2.65 0.55 5.97 -2.02Difference 0.62 1.18 1.09 1.10 0.95 1.45 0.86 2.19 -0.42 0.15 2.82
Peer Group Median -1.32 1.89 1.89 2.39 3.68 4.61 4.32 3.73 0.63 6.16 -1.14Rank 12 26 27 22 37 28 48 26 75 53 13
Population 296 296 289 283 274 252 323 346 360 386 406
ReturnStandardDeviation
Manager 5.08 3.25Benchmark 3.63 3.26Median 4.61 3.55
Manager 4.68 (30) 2.04 (38) 0.68 (35) 1.41 (6) 1.64 (91)Benchmark 3.28 (93) 0.00 (100) N/A 1.00 (75) 1.78 (76)
Median 4.24 1.57 0.59 1.12 2.02
Portfolio Benchmark
Effective Duration 4.30 6.08Spread Duration 5.02 6.25Avg. Maturity 7.13 8.42Avg. Quality Aa3 Aa1/Aa2Yield To Maturity (%) 3.32 3.12Coupon Rate (%) 3.94 3.08Current Yield (%) 3.62 N/AHoldings Count 265 9,868
Dodge & Cox Fixed Income (SA)
IM U.S. Broad Market Fixed Income (SA+CF)
As of March 31, 2018
Peer Group:Benchmark: Bloomberg US Agg Bond IndexManager:
Performance shown is gross of fees and client specific. Calculation is based on monthly periodicity.
Page 39 of 47

Peer Group Scattergram - 10 Years Up/Down Markets - 10 Years
Peer Group Analysis - Multi Statistics - 10 Years (Excess Return vs. Risk Free)
Sector Distribution (%)
Performance
Portfolio Characteristics
QTD1
Year3
Years5
Years7
Years10
Years2017 2016 2015 2014 2013
Manager -1.51 4.48 3.36 4.13 5.97 7.72 7.96 7.78 -1.40 8.42 1.14
Benchmark -2.13 2.59 2.16 2.83 4.36 5.15 6.18 5.63 -0.77 7.53 -2.01Difference 0.62 1.89 1.20 1.30 1.61 2.57 1.78 2.15 -0.63 0.89 3.15
Peer Group Median -1.21 2.28 2.24 2.67 3.99 5.10 4.85 4.72 0.27 6.19 -0.49Rank 87 4 12 7 4 1 5 14 87 3 19
Population 140 140 139 136 132 115 154 160 166 176 183
ReturnStandardDeviation
Manager 7.72 6.42Benchmark 5.15 5.52Median 5.10 3.93
Manager 7.33 (2) 2.42 (87) 1.03 (1) 1.13 (56) 3.84 (16)Benchmark 4.84 (45) 0.00 (100) N/A 0.87 (87) 3.50 (20)
Median 4.72 2.95 -0.04 1.17 2.31
Portfolio Benchmark
Effective Duration 6.90 7.22Spread Duration 7.36 7.26Avg. Maturity 11.45 10.72Avg. Quality Baa1 A2/A3Yield To Maturity (%) 4.14 3.69Coupon Rate (%) 4.93 3.85Current Yield (%) 4.55 N/AHoldings Count 158 6,357
Cutwater Core Plus Select Income (SA)
IM U.S. Broad Market Core+ Fixed Income (SA+CF)
As of March 31, 2018
Peer Group:Benchmark: Bloomberg US Crdt IndexManager:
Performance shown is gross of fees and is product specific manager performance prior to 12/01/2013. Calculation is based on monthly periodicity.
Page 40 of 47
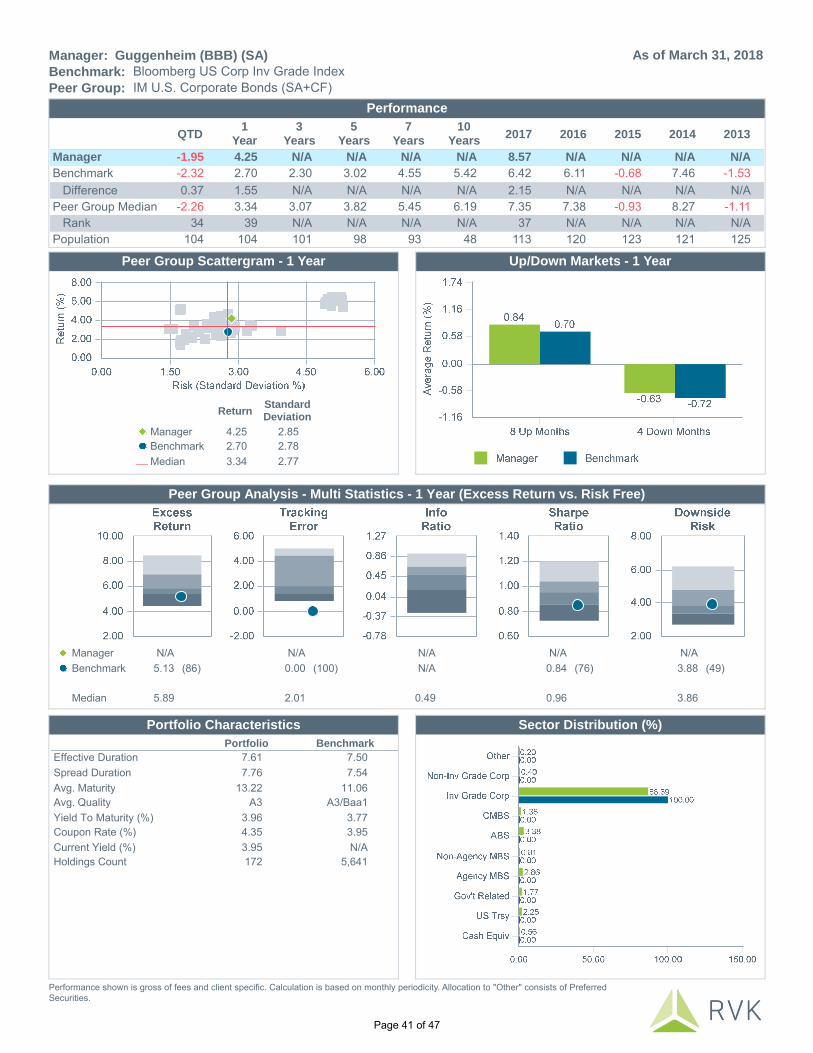
Peer Group Scattergram - 1 Year Up/Down Markets - 1 Year
Peer Group Analysis - Multi Statistics - 1 Year (Excess Return vs. Risk Free)
Sector Distribution (%)
Performance
Portfolio Characteristics
QTD1
Year3
Years5
Years7
Years10
Years2017 2016 2015 2014 2013
Manager -1.95 4.25 N/A N/A N/A N/A 8.57 N/A N/A N/A N/A
Benchmark -2.32 2.70 2.30 3.02 4.55 5.42 6.42 6.11 -0.68 7.46 -1.53Difference 0.37 1.55 N/A N/A N/A N/A 2.15 N/A N/A N/A N/A
Peer Group Median -2.26 3.34 3.07 3.82 5.45 6.19 7.35 7.38 -0.93 8.27 -1.11Rank 34 39 N/A N/A N/A N/A 37 N/A N/A N/A N/A
Population 104 104 101 98 93 48 113 120 123 121 125
ReturnStandardDeviation
Manager 4.25 2.85Benchmark 2.70 2.78Median 3.34 2.77
Manager N/A N/A N/A N/A N/ABenchmark 5.13 (86) 0.00 (100) N/A 0.84 (76) 3.88 (49)
Median 5.89 2.01 0.49 0.96 3.86
Portfolio Benchmark
Effective Duration 7.61 7.50Spread Duration 7.76 7.54Avg. Maturity 13.22 11.06Avg. Quality A3 A3/Baa1Yield To Maturity (%) 3.96 3.77Coupon Rate (%) 4.35 3.95Current Yield (%) 3.95 N/AHoldings Count 172 5,641
Guggenheim (BBB) (SA)
IM U.S. Corporate Bonds (SA+CF)
As of March 31, 2018
Peer Group:Benchmark: Bloomberg US Corp Inv Grade IndexManager:
Performance shown is gross of fees and client specific. Calculation is based on monthly periodicity. Allocation to "Other" consists of Preferred Securities.
Page 41 of 47

Peer Group Scattergram - 10 Years Up/Down Markets - 10 Years
Peer Group Analysis - Multi Statistics - 10 Years (Excess Return vs. Risk Free)
Sector Distribution (%)
Performance
Portfolio Characteristics
QTD1
Year3
Years5
Years7
Years10
Years2017 2016 2015 2014 2013
Manager -0.50 1.64 1.66 2.19 3.15 4.71 2.86 2.26 1.94 5.52 -0.45
Benchmark -1.19 0.77 1.12 1.80 2.44 3.46 2.47 1.67 1.51 6.08 -1.41Difference 0.69 0.87 0.54 0.39 0.71 1.25 0.39 0.59 0.43 -0.56 0.96
Peer Group Median -0.78 1.71 1.78 2.42 3.27 4.03 3.73 2.38 1.69 6.46 -0.76Rank 43 52 56 56 60 38 64 53 40 72 46
Population 47 47 47 45 44 31 53 56 59 58 62
ReturnStandardDeviation
Manager 4.71 2.64Benchmark 3.46 2.49Median 4.03 2.61
Manager 4.29 (41) 1.77 (56) 0.67 (33) 1.89 (13) 0.94 (91)Benchmark 3.10 (82) 0.00 (100) N/A 1.25 (77) 1.22 (70)
Median 3.73 1.83 0.46 1.44 1.30
Portfolio Benchmark
Effective Duration 4.37 5.05Spread Duration 4.66 5.59Avg. Maturity 5.94 7.43Avg. Quality Aa1 AaaYield To Maturity (%) 3.23 3.30Coupon Rate (%) 3.59 3.53Current Yield (%) 3.61 N/AHoldings Count 531 313
JPMorgan MBS (SA)
IM U.S. Mortgage Backed Bonds (SA+CF)
As of March 31, 2018
Peer Group:Benchmark: Bloomberg US MBS IndexManager:
Performance shown is gross of fees and is product specific manager performance prior to 07/01/2010. Calculation is based on monthly periodicity.
Page 42 of 47

Historical Statistics - 10 Years
Performance
Portfolio Characteristics
Historical Statistics - 10 Years
Sector Distribution (%)
QTD1
Year3
Years5
Years7
Years10
Years2017 2016 2015 2014 2013
Manager 0.31 4.07 3.53 3.46 4.95 5.94 5.61 4.16 2.11 6.03 1.00
Benchmark -1.35 0.93 1.46 2.03 3.09 4.23 3.11 3.40 1.22 4.29 -0.56Difference 1.66 3.14 2.07 1.43 1.86 1.71 2.50 0.76 0.89 1.74 1.56
Manager Benchmark
Standard Deviation 6.68 9.89Sharpe Ratio 0.84 0.43Tracking Error 6.85 0.00Info Ratio 0.20 N/A
Manager Benchmark
Downside Risk 4.68 6.72Up Mkt Capture 95.46 100.00Down Mkt Capture 68.76 100.00
Portfolio Benchmark
Effective Duration 3.76 5.17Modified Duration 4.91 5.09Spread Duration 5.03 5.17Convexity 0.47 3.56Avg. Maturity 17.69 5.79Avg. Quality Aa2 AaaYield To Maturity (%) 3.72 3.20Coupon Rate (%) 3.71 3.24Yield To Worst (%) 3.72 3.20Current Yield (%) 3.72 N/AHoldings Count 73 1,816
Cash E
quiv
US Trsy
ABSCMBS
Guggenheim CMBS (SA) As of March 31, 2018Bloomberg US CMBS Inv Grade: Aaa Index
Manager:
Benchmark:
Performance shown is gross of fees and is product specific manager performance prior to 07/01/2010. Calculations are based on monthly periodicity.
Page 43 of 47

Peer Group Scattergram - 10 Years Up/Down Markets - 10 Years
Peer Group Analysis - Multi Statistics - 10 Years (Excess Return vs. Risk Free)
Sector Distribution (%)
Performance
Portfolio Characteristics
QTD1
Year3
Years5
Years7
Years10
Years2017 2016 2015 2014 2013
Manager -1.06 3.04 3.76 3.92 5.47 7.54 6.38 13.35 -4.20 0.87 8.51
Benchmark -0.91 3.69 5.18 5.01 6.22 8.12 7.48 17.49 -4.64 2.50 7.42Difference -0.15 -0.65 -1.42 -1.09 -0.75 -0.58 -1.10 -4.14 0.44 -1.63 1.09
Peer Group Median -0.54 4.19 4.86 4.91 6.16 7.89 7.58 14.10 -2.15 2.61 7.57Rank 79 84 84 86 82 71 78 61 80 86 29
Population 152 152 146 133 115 94 174 193 198 203 200
ReturnStandardDeviation
Manager 7.54 9.06Benchmark 8.12 10.47Median 7.89 8.96
Manager 7.37 (68) 2.34 (71) -0.29 (78) 0.81 (65) 6.14 (50)Benchmark 8.06 (35) 0.00 (100) N/A 0.77 (81) 7.23 (16)
Median 7.68 2.63 -0.11 0.86 6.14
Portfolio Benchmark
Effective Duration 4.30 4.22Spread Duration N/A 4.03Avg. Maturity 6.30 6.26Avg. Quality B1 B1Yield To Maturity (%) 6.20 6.56Coupon Rate (%) 6.30 6.33Current Yield (%) 6.26 6.34Holdings Count 157 1,876
Allianz Global Investors US High Yield (SA)
IM U.S. High Yield Bonds (SA+CF)
As of March 31, 2018
Peer Group:Benchmark: ICE BofAML US Hi Yld Master II IndexManager:
Performance shown is gross of fees and client specific. Calculation is based on monthly periodicity.
Page 44 of 47

Peer Group Scattergram - 10 Years Up/Down Markets - 10 Years
Peer Group Analysis - Multi Statistics - 10 Years (Excess Return vs. Risk Free)
Sector Distribution (%)
Performance
Portfolio Characteristics
QTD1
Year3
Years5
Years7
Years10
Years2017 2016 2015 2014 2013
Manager -0.96 4.05 4.29 4.39 5.86 7.93 7.64 13.05 -3.05 2.50 6.26
Benchmark -0.94 3.67 5.17 4.98 6.20 8.04 7.48 17.34 -4.55 2.44 7.38Difference -0.02 0.38 -0.88 -0.59 -0.34 -0.11 0.16 -4.29 1.50 0.06 -1.12
Peer Group Median -0.54 4.19 4.86 4.91 6.16 7.89 7.58 14.10 -2.15 2.61 7.57Rank 71 55 72 74 70 49 48 64 59 52 82
Population 152 152 146 133 115 94 174 193 198 203 200
ReturnStandardDeviation
Manager 7.93 8.74Benchmark 8.04 10.39Median 7.89 8.96
Manager 7.71 (50) 2.51 (53) -0.11 (54) 0.88 (43) 5.91 (60)Benchmark 7.97 (37) 0.00 (100) N/A 0.76 (82) 7.19 (18)
Median 7.68 2.58 -0.09 0.86 6.14
Portfolio Benchmark
Effective Duration 3.23 4.23Spread Duration 3.29 4.04Avg. Maturity 5.72 6.28Avg. Quality Ba3 B1Yield To Maturity (%) 5.72 6.54Coupon Rate (%) 5.97 6.31Current Yield (%) 5.92 6.32Holdings Count 273 1,856
Fort Washington High Yield (SA)
IM U.S. High Yield Bonds (SA+CF)
As of March 31, 2018
Peer Group:Benchmark: ICE BofAML US Cash Pay Hi Yld IndexManager:
Performance shown is gross of fees and is product specific manager performance prior to 07/01/2015. Calculation is based on monthly periodicity.
Page 45 of 47

Historical Statistics - 10 Years
Performance
Portfolio Characteristics
Historical Statistics - 10 Years
Sector Distribution (%)
QTD1
Year3
Years5
Years7
Years10
Years2017 2016 2015 2014 2013
Manager -1.50 5.83 6.38 7.28 8.86 9.42 12.08 5.50 7.36 13.95 3.19
Benchmark -1.40 4.06 4.45 5.23 6.35 5.86 10.10 3.76 4.18 12.15 0.58Difference -0.10 1.77 1.93 2.05 2.51 3.56 1.98 1.74 3.18 1.80 2.61
Manager Benchmark
Standard Deviation 12.50 12.87Sharpe Ratio 0.75 0.48Tracking Error 2.92 0.00Info Ratio 1.12 N/A
Manager Benchmark
Downside Risk 8.23 9.28Up Mkt Capture 115.15 100.00Down Mkt Capture 89.77 100.00
Portfolio Benchmark
Modified Duration 5.20 5.70Avg. Maturity 6.09 19.12Avg. Quality Baa3 Baa2Yield To Maturity (%) 6.09 5.63Coupon Rate (%) 6.63 6.12Current Yield (%) 6.16 5.75Holdings Count 156 271
Cash
OTC Hyb
rid Pref
erred
s
Excha
nge-T
raded
Preferr
eds
Cohen & Steers Preferreds (SA) As of March 31, 201850% ICE BofA ML All Cap Sec/50% ICE BofA ML Fxd Rt Pref Index
Manager:
Benchmark:
Performance shown is gross of fees and client specific. Calculations are based on monthly periodicity.
Page 46 of 47

Peer Group Scattergram - 10 Years
Performance
Peer Group Analysis - Multi Statistics - 10 Years
Up/Down Markets - 10 Years
Portfolio Characteristics and Dist. of Market Cap
QTD1
Year3
Years5
Years7
Years10
Years2017 2016 2015 2014 2013
Manager -7.46 -2.17 2.60 7.78 9.41 8.61 6.91 8.78 5.52 32.68 3.76
Benchmark -8.20 -4.51 1.08 5.92 8.18 6.37 5.23 8.52 3.20 30.14 2.47Difference 0.74 2.34 1.52 1.86 1.23 2.24 1.68 0.26 2.32 2.54 1.29
Peer Group Median -6.69 -1.55 2.08 7.21 9.01 7.41 6.35 6.95 4.70 31.57 2.68Rank 73 58 38 24 27 20 39 32 32 31 27
Population 46 46 46 44 43 40 50 54 58 57 57
Ret
urn
(%)
ReturnStandardDeviation
Manager 8.61 24.55Primary Benchmark 6.37 24.85Median 7.41 24.51
6.00
8.00
10.00
12.00
14.00
ExcessReturn
Manager 11.09 (15) 1.54 (94) 1.30 (2) 0.45 (23) 17.09 (54)Primary Benchmark 9.08 (79) 0.00 (100) N/A 0.37 (81) 17.66 (26)
Median 9.88 2.74 0.37 0.40 17.23
Portfolio Benchmark
Wtd. Avg. Mkt. Cap ($M) 15,313 15,317Median Mkt. Cap ($M) 6,893 2,834Price/Earnings Ratio 25.40 28.35Price/Book Ratio 2.26 2.225 Yr. EPS Growth Rate (%) 17.24 14.45Current Yield (%) 3.99 4.56Beta (5 Years, Monthly) 1.00 1.00Number of Securities 54 159
CenterSquare US REIT Total Return Composite (SA)
IM U.S. REIT (SA+CF)
As of March 31, 2018FTSE NAREIT Eq REITs TR Index
Manager:
Benchmark:
Peer Group:
Performance shown is gross of fees and is product specific manager performance prior to 08/01/2008. Calculations are based on monthly periodicity. Parenthesis contain percentile ranks.
Page 47 of 47