investment portfolios - ppivalet.ca · page 37 investment portfolios wealthbar offers 12...
TRANSCRIPT
Page 37
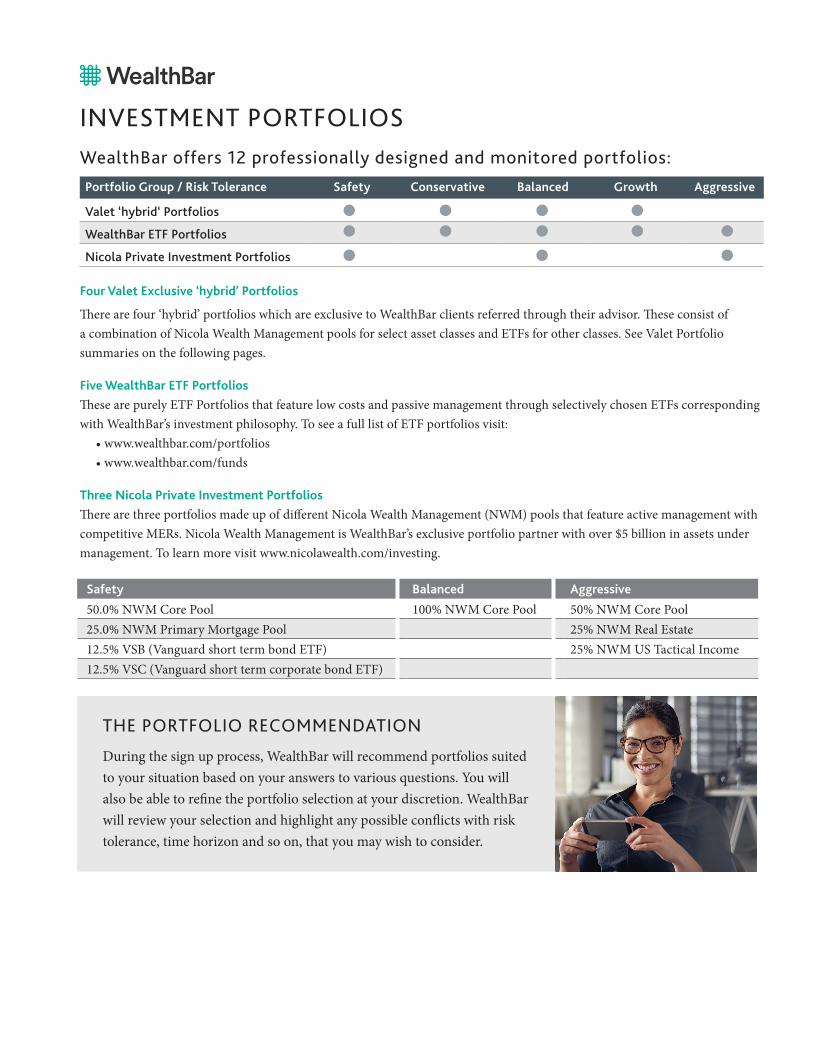
INVESTMENT PORTFOLIOS
WealthBar offers 12 professionally designed and monitored portfolios:
Four Valet Exclusive ‘hybrid’ Portfolios
There are four ‘hybrid’ portfolios which are exclusive to WealthBar clients referred through their advisor. These consist of a combination of Nicola Wealth Management pools for select asset classes and ETFs for other classes. See Valet Portfolio summaries on the following pages.
Five WealthBar ETF PortfoliosThese are purely ETF Portfolios that feature low costs and passive management through selectively chosen ETFs corresponding with WealthBar’s investment philosophy. To see a full list of ETF portfolios visit:
• www.wealthbar.com/portfolios• www.wealthbar.com/funds
Three Nicola Private Investment PortfoliosThere are three portfolios made up of different Nicola Wealth Management (NWM) pools that feature active management with competitive MERs. Nicola Wealth Management is WealthBar’s exclusive portfolio partner with over $5 billion in assets under management. To learn more visit www.nicolawealth.com/investing.
Portfolio Group / Risk Tolerance Safety Conservative Balanced Growth Aggressive
Valet ‘hybrid‘ Portfolios
WealthBar ETF Portfolios
Nicola Private Investment Portfolios
Safety Balanced Aggressive
50.0% NWM Core Pool 100% NWM Core Pool 50% NWM Core Pool25.0% NWM Primary Mortgage Pool 25% NWM Real Estate12.5% VSB (Vanguard short term bond ETF) 25% NWM US Tactical Income12.5% VSC (Vanguard short term corporate bond ETF)
THE PORTFOLIO RECOMMENDATION
During the sign up process, WealthBar will recommend portfolios suited to your situation based on your answers to various questions. You will also be able to refine the portfolio selection at your discretion. WealthBar will review your selection and highlight any possible conflicts with risk tolerance, time horizon and so on, that you may wish to consider.
Page 38
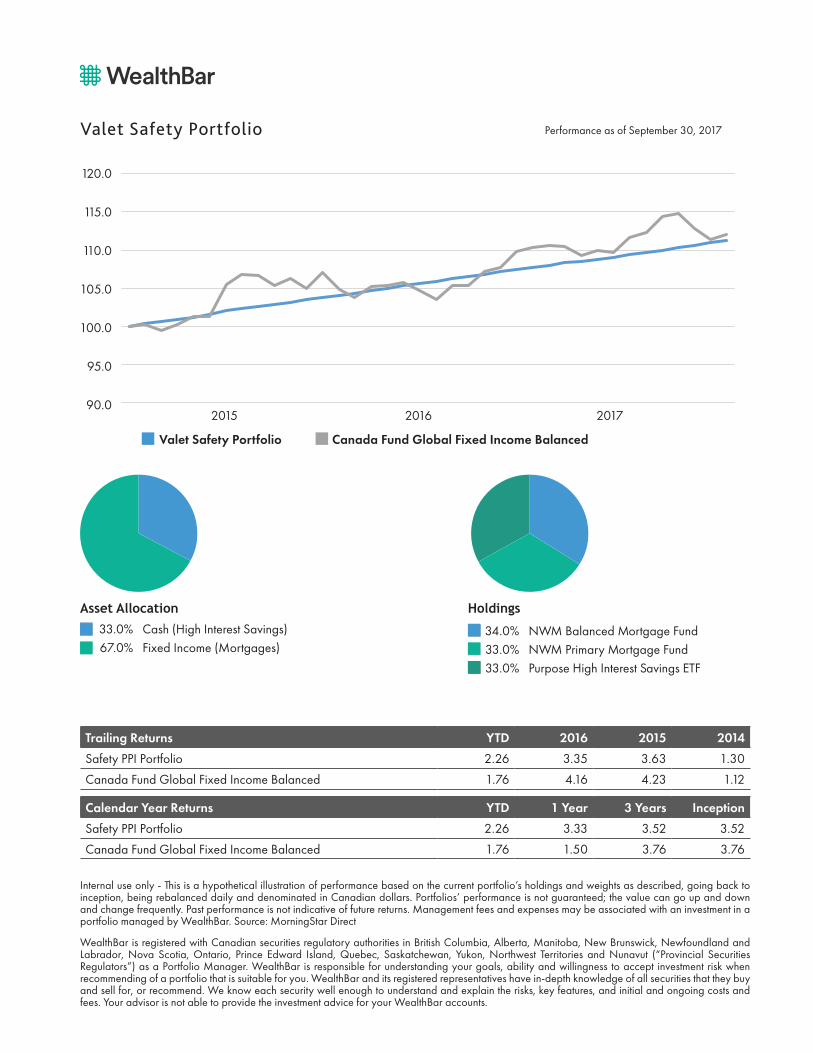
Trailing Returns YTD 2016 2015 2014
Safety PPI Portfolio 2.26 3.35 3.63 1.30
Canada Fund Global Fixed Income Balanced 1.76 4.16 4.23 1.12
Calendar Year Returns YTD 1 Year 3 Years Inception
Safety PPI Portfolio 2.26 3.33 3.52 3.52
Canada Fund Global Fixed Income Balanced 1.76 1.50 3.76 3.76
Valet Safety Portfolio
33.0% Cash (High Interest Savings) 67.0% Fixed Income (Mortgages)
Asset Allocation Holdings
34.0% NWM Balanced Mortgage Fund 33.0% NWM Primary Mortgage Fund 33.0% Purpose High Interest Savings ETF
90.0
95.0
100.0
105.0
110.0
115.0
120.0
8/20
/201
48/
31/2
014
9/30
/201
410
/31/
2014
11/3
0/20
1412
/31/
2014
1/31
/201
52/
28/2
015
3/31
/201
54/
30/2
015
5/31
/201
56/
30/2
015
7/31
/201
58/
31/2
015
9/30
/201
510
/31/
2015
11/3
0/20
1512
/31/
2015
1/31
/201
62/
29/2
016
3/31
/201
64/
30/2
016
5/31
/201
66/
30/2
016
7/31
/201
68/
31/2
016
9/30
/201
610
/31/
2016
11/3
0/20
1612
/31/
2016
1/31
/201
72/
28/2
017
3/31
/201
74/
30/2
017
5/31
/201
76/
30/2
017
7/31
/201
78/
31/2
017
Safety & Conserva�ve PPI Por�olio
PPI Safety Canada Fund Global Fixed Income Balanced
90.0
95.0
100.0
105.0
110.0
115.0
120.0
8/20
/201
48/
31/2
014
9/30
/201
410
/31/
2014
11/3
0/20
1412
/31/
2014
1/31
/201
52/
28/2
015
3/31
/201
54/
30/2
015
5/31
/201
56/
30/2
015
7/31
/201
58/
31/2
015
9/30
/201
510
/31/
2015
11/3
0/20
1512
/31/
2015
1/31
/201
62/
29/2
016
3/31
/201
64/
30/2
016
5/31
/201
66/
30/2
016
7/31
/201
68/
31/2
016
9/30
/201
610
/31/
2016
11/3
0/20
1612
/31/
2016
1/31
/201
72/
28/2
017
3/31
/201
74/
30/2
017
5/31
/201
76/
30/2
017
7/31
/201
78/
31/2
017
Safety & Conserva�ve PPI Por�olio
PPI Conserva�ve Canada Fund Global Fixed Income Balanced
95.0
100.0
105.0
110.0
115.0
120.0
125.0
Chart Title
PPI Balanced Canada Fund Global Neutral Balanced
95.0
100.0
105.0
110.0
115.0
120.0
125.0
130.0
135.0
Chart Title
PPI Growth Canada Fund Global Equity Balanced
2015
120.0
115.0
110.0
105.0
100.0
95.0
90.02016 2017
Valet Safety Portfolio Canada Fund Global Fixed Income Balanced
Performance as of September 30, 2017
Internal use only - This is a hypothetical illustration of performance based on the current portfolio’s holdings and weights as described, going back to inception, being rebalanced daily and denominated in Canadian dollars. Portfolios’ performance is not guaranteed; the value can go up and down and change frequently. Past performance is not indicative of future returns. Management fees and expenses may be associated with an investment in a portfolio managed by WealthBar. Source: MorningStar Direct
WealthBar is registered with Canadian securities regulatory authorities in British Columbia, Alberta, Manitoba, New Brunswick, Newfoundland and Labrador, Nova Scotia, Ontario, Prince Edward Island, Quebec, Saskatchewan, Yukon, Northwest Territories and Nunavut (“Provincial Securities Regulators”) as a Portfolio Manager. WealthBar is responsible for understanding your goals, ability and willingness to accept investment risk when recommending of a portfolio that is suitable for you. WealthBar and its registered representatives have in-depth knowledge of all securities that they buy and sell for, or recommend. We know each security well enough to understand and explain the risks, key features, and initial and ongoing costs and fees. Your advisor is not able to provide the investment advice for your WealthBar accounts.
Page 39
Trailing Returns YTD 2016 2015 2014
Conservative PPI Portfolio 2.88 5.12 4.51 1.63
Canada Fund Global Fixed Income Balanced 1.76 4.16 4.23 1.12
Calendar Year Returns YTD 1 Year 3 Years Inception
Conservative PPI Portfolio 2.88 5.51 4.73 4.73
Canada Fund Global Fixed Income Balanced 1.76 1.50 3.76 3.76
Valet Conservative Portfolio
90.0
95.0
100.0
105.0
110.0
115.0
120.0
8/20
/201
48/
31/2
014
9/30
/201
410
/31/
2014
11/3
0/20
1412
/31/
2014
1/31
/201
52/
28/2
015
3/31
/201
54/
30/2
015
5/31
/201
56/
30/2
015
7/31
/201
58/
31/2
015
9/30
/201
510
/31/
2015
11/3
0/20
1512
/31/
2015
1/31
/201
62/
29/2
016
3/31
/201
64/
30/2
016
5/31
/201
66/
30/2
016
7/31
/201
68/
31/2
016
9/30
/201
610
/31/
2016
11/3
0/20
1612
/31/
2016
1/31
/201
72/
28/2
017
3/31
/201
74/
30/2
017
5/31
/201
76/
30/2
017
7/31
/201
78/
31/2
017
Safety & Conserva�ve PPI Por�olio
PPI Safety Canada Fund Global Fixed Income Balanced
90.0
95.0
100.0
105.0
110.0
115.0
120.0
8/20
/201
48/
31/2
014
9/30
/201
410
/31/
2014
11/3
0/20
1412
/31/
2014
1/31
/201
52/
28/2
015
3/31
/201
54/
30/2
015
5/31
/201
56/
30/2
015
7/31
/201
58/
31/2
015
9/30
/201
510
/31/
2015
11/3
0/20
1512
/31/
2015
1/31
/201
62/
29/2
016
3/31
/201
64/
30/2
016
5/31
/201
66/
30/2
016
7/31
/201
68/
31/2
016
9/30
/201
610
/31/
2016
11/3
0/20
1612
/31/
2016
1/31
/201
72/
28/2
017
3/31
/201
74/
30/2
017
5/31
/201
76/
30/2
017
7/31
/201
78/
31/2
017
Safety & Conserva�ve PPI Por�olio
PPI Conserva�ve Canada Fund Global Fixed Income Balanced
95.0
100.0
105.0
110.0
115.0
120.0
125.0
Chart Title
PPI Balanced Canada Fund Global Neutral Balanced
95.0
100.0
105.0
110.0
115.0
120.0
125.0
130.0
135.0
Chart Title
PPI Growth Canada Fund Global Equity Balanced
2015
120.0
115.0
110.0
105.0
100.0
95.02016 2017
Valet Conservative Portfolio Canada Fund Global Fixed Income Balanced
7.5% BMO Laddered Preferred Share ETF 12.5% Horizons S&P 500 ETF 7.5% Horizons S&P/TSX 60 ETF 10.0% iShares Core MSCI EAFE IMI ETF 5.0% NWM Balanced Mortgage Fund 15.0% NWM Primary Mortgage Fund 7.5% NWM Real Estate Fund 35.0% Vanguard Canadian Short-Term Bond ETF
Holdings 35.0% Government Bonds 7.5% Canada Equity 10.0% International Equity 20.0% Fixed Income 7.5% Income Strategies 7.5% Real Estate 12.5% US Equity
Asset Allocation
Performance as of September 30, 2017
Internal use only - This is a hypothetical illustration of performance based on the current portfolio’s holdings and weights as described, going back to inception, being rebalanced daily and denominated in Canadian dollars. Portfolios’ performance is not guaranteed; the value can go up and down and change frequently. Past performance is not indicative of future returns. Management fees and expenses may be associated with an investment in a portfolio managed by WealthBar. Source: MorningStar Direct
WealthBar is registered with Canadian securities regulatory authorities in British Columbia, Alberta, Manitoba, New Brunswick, Newfoundland and Labrador, Nova Scotia, Ontario, Prince Edward Island, Quebec, Saskatchewan, Yukon, Northwest Territories and Nunavut (“Provincial Securities Regulators”) as a Portfolio Manager. WealthBar is responsible for understanding your goals, ability and willingness to accept investment risk when recommending of a portfolio that is suitable for you. WealthBar and its registered representatives have in-depth knowledge of all securities that they buy and sell for, or recommend. We know each security well enough to understand and explain the risks, key features, and initial and ongoing costs and fees. Your advisor is not able to provide the investment advice for your WealthBar accounts.
Page 40
Valet Balanced Portfolio
90.0
95.0
100.0
105.0
110.0
115.0
120.0
8/20
/201
48/
31/2
014
9/30
/201
410
/31/
2014
11/3
0/20
1412
/31/
2014
1/31
/201
52/
28/2
015
3/31
/201
54/
30/2
015
5/31
/201
56/
30/2
015
7/31
/201
58/
31/2
015
9/30
/201
510
/31/
2015
11/3
0/20
1512
/31/
2015
1/31
/201
62/
29/2
016
3/31
/201
64/
30/2
016
5/31
/201
66/
30/2
016
7/31
/201
68/
31/2
016
9/30
/201
610
/31/
2016
11/3
0/20
1612
/31/
2016
1/31
/201
72/
28/2
017
3/31
/201
74/
30/2
017
5/31
/201
76/
30/2
017
7/31
/201
78/
31/2
017
Safety & Conserva�ve PPI Por�olio
PPI Safety Canada Fund Global Fixed Income Balanced
90.0
95.0
100.0
105.0
110.0
115.0
120.0
8/20
/201
48/
31/2
014
9/30
/201
410
/31/
2014
11/3
0/20
1412
/31/
2014
1/31
/201
52/
28/2
015
3/31
/201
54/
30/2
015
5/31
/201
56/
30/2
015
7/31
/201
58/
31/2
015
9/30
/201
510
/31/
2015
11/3
0/20
1512
/31/
2015
1/31
/201
62/
29/2
016
3/31
/201
64/
30/2
016
5/31
/201
66/
30/2
016
7/31
/201
68/
31/2
016
9/30
/201
610
/31/
2016
11/3
0/20
1612
/31/
2016
1/31
/201
72/
28/2
017
3/31
/201
74/
30/2
017
5/31
/201
76/
30/2
017
7/31
/201
78/
31/2
017
Safety & Conserva�ve PPI Por�olio
PPI Conserva�ve Canada Fund Global Fixed Income Balanced
95.0
100.0
105.0
110.0
115.0
120.0
125.0
Chart Title
PPI Balanced Canada Fund Global Neutral Balanced
95.0
100.0
105.0
110.0
115.0
120.0
125.0
130.0
135.0
Chart Title
PPI Growth Canada Fund Global Equity Balanced
2015
125.0
120.0
115.0
110.0
105.0
100.0
95.02016 2017
Valet Balanced Portfolio Canada Fund Global Fixed Income Balanced
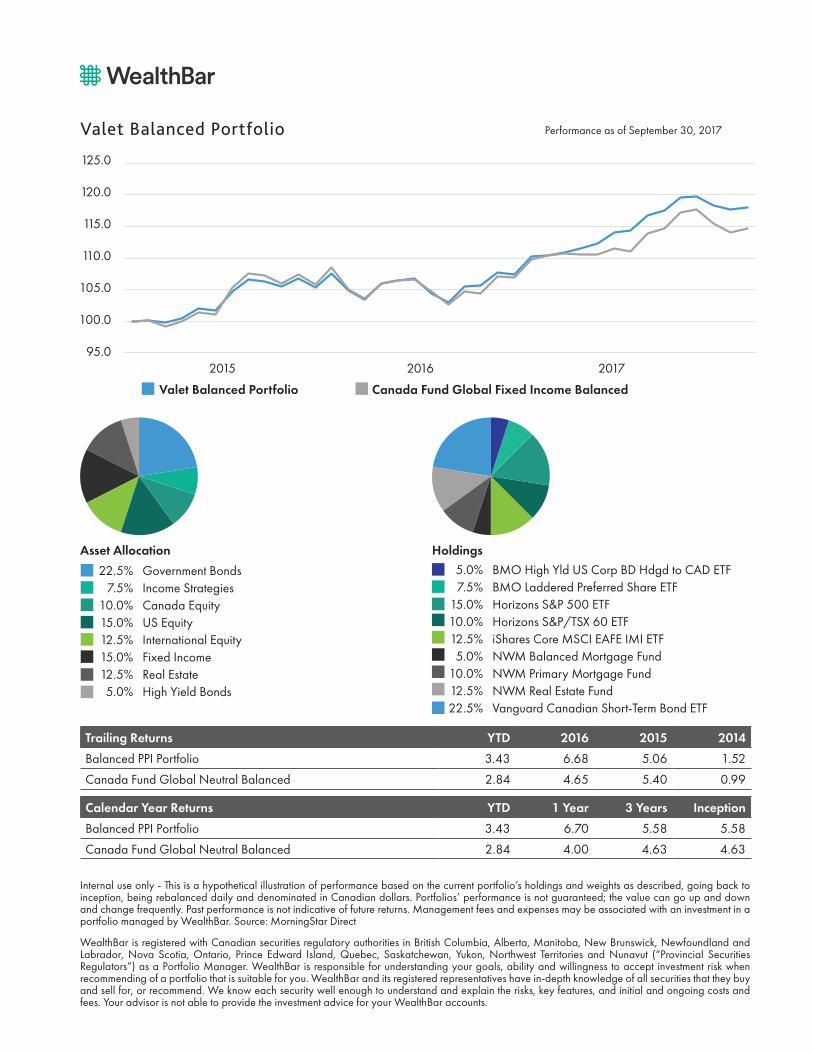
Trailing Returns YTD 2016 2015 2014
Balanced PPI Portfolio 3.43 6.68 5.06 1.52
Canada Fund Global Neutral Balanced 2.84 4.65 5.40 0.99
Calendar Year Returns YTD 1 Year 3 Years Inception
Balanced PPI Portfolio 3.43 6.70 5.58 5.58
Canada Fund Global Neutral Balanced 2.84 4.00 4.63 4.63
5.0% BMO High Yld US Corp BD Hdgd to CAD ETF 7.5% BMO Laddered Preferred Share ETF 15.0% Horizons S&P 500 ETF 10.0% Horizons S&P/TSX 60 ETF 12.5% iShares Core MSCI EAFE IMI ETF 5.0% NWM Balanced Mortgage Fund 10.0% NWM Primary Mortgage Fund 12.5% NWM Real Estate Fund 22.5% Vanguard Canadian Short-Term Bond ETF
Holdings 22.5% Government Bonds 7.5% Income Strategies 10.0% Canada Equity 15.0% US Equity 12.5% International Equity 15.0% Fixed Income 12.5% Real Estate 5.0% High Yield Bonds
Asset Allocation
Performance as of September 30, 2017
Internal use only - This is a hypothetical illustration of performance based on the current portfolio’s holdings and weights as described, going back to inception, being rebalanced daily and denominated in Canadian dollars. Portfolios’ performance is not guaranteed; the value can go up and down and change frequently. Past performance is not indicative of future returns. Management fees and expenses may be associated with an investment in a portfolio managed by WealthBar. Source: MorningStar Direct
WealthBar is registered with Canadian securities regulatory authorities in British Columbia, Alberta, Manitoba, New Brunswick, Newfoundland and Labrador, Nova Scotia, Ontario, Prince Edward Island, Quebec, Saskatchewan, Yukon, Northwest Territories and Nunavut (“Provincial Securities Regulators”) as a Portfolio Manager. WealthBar is responsible for understanding your goals, ability and willingness to accept investment risk when recommending of a portfolio that is suitable for you. WealthBar and its registered representatives have in-depth knowledge of all securities that they buy and sell for, or recommend. We know each security well enough to understand and explain the risks, key features, and initial and ongoing costs and fees. Your advisor is not able to provide the investment advice for your WealthBar accounts.
Page 41
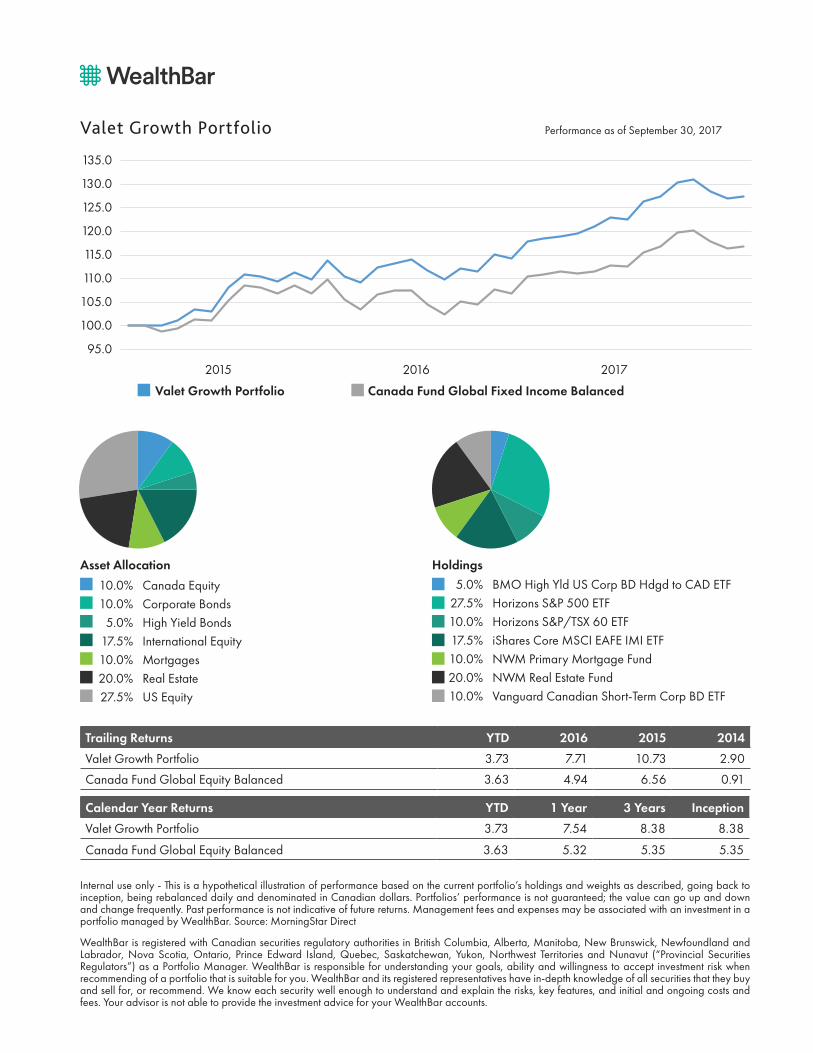
Valet Growth Portfolio
90.0
95.0
100.0
105.0
110.0
115.0
120.0
8/20
/201
48/
31/2
014
9/30
/201
410
/31/
2014
11/3
0/20
1412
/31/
2014
1/31
/201
52/
28/2
015
3/31
/201
54/
30/2
015
5/31
/201
56/
30/2
015
7/31
/201
58/
31/2
015
9/30
/201
510
/31/
2015
11/3
0/20
1512
/31/
2015
1/31
/201
62/
29/2
016
3/31
/201
64/
30/2
016
5/31
/201
66/
30/2
016
7/31
/201
68/
31/2
016
9/30
/201
610
/31/
2016
11/3
0/20
1612
/31/
2016
1/31
/201
72/
28/2
017
3/31
/201
74/
30/2
017
5/31
/201
76/
30/2
017
7/31
/201
78/
31/2
017
Safety & Conserva�ve PPI Por�olio
PPI Safety Canada Fund Global Fixed Income Balanced
90.0
95.0
100.0
105.0
110.0
115.0
120.0
8/20
/201
48/
31/2
014
9/30
/201
410
/31/
2014
11/3
0/20
1412
/31/
2014
1/31
/201
52/
28/2
015
3/31
/201
54/
30/2
015
5/31
/201
56/
30/2
015
7/31
/201
58/
31/2
015
9/30
/201
510
/31/
2015
11/3
0/20
1512
/31/
2015
1/31
/201
62/
29/2
016
3/31
/201
64/
30/2
016
5/31
/201
66/
30/2
016
7/31
/201
68/
31/2
016
9/30
/201
610
/31/
2016
11/3
0/20
1612
/31/
2016
1/31
/201
72/
28/2
017
3/31
/201
74/
30/2
017
5/31
/201
76/
30/2
017
7/31
/201
78/
31/2
017
Safety & Conserva�ve PPI Por�olio
PPI Conserva�ve Canada Fund Global Fixed Income Balanced
95.0
100.0
105.0
110.0
115.0
120.0
125.0
Chart Title
PPI Balanced Canada Fund Global Neutral Balanced
95.0
100.0
105.0
110.0
115.0
120.0
125.0
130.0
135.0
Chart Title
PPI Growth Canada Fund Global Equity Balanced
2015
135.0
130.0
125.0
120.0
115.0
110.0
105.0
100.0
95.0
2016 2017
Valet Growth Portfolio Canada Fund Global Fixed Income Balanced
Trailing Returns YTD 2016 2015 2014
Valet Growth Portfolio 3.73 7.71 10.73 2.90
Canada Fund Global Equity Balanced 3.63 4.94 6.56 0.91
Calendar Year Returns YTD 1 Year 3 Years Inception
Valet Growth Portfolio 3.73 7.54 8.38 8.38
Canada Fund Global Equity Balanced 3.63 5.32 5.35 5.35
10.0% Canada Equity 10.0% Corporate Bonds 5.0% High Yield Bonds 17.5% International Equity 10.0% Mortgages 20.0% Real Estate 27.5% US Equity
5.0% BMO High Yld US Corp BD Hdgd to CAD ETF 27.5% Horizons S&P 500 ETF 10.0% Horizons S&P/TSX 60 ETF 17.5% iShares Core MSCI EAFE IMI ETF 10.0% NWM Primary Mortgage Fund 20.0% NWM Real Estate Fund 10.0% Vanguard Canadian Short-Term Corp BD ETF
HoldingsAsset Allocation
Performance as of September 30, 2017
Internal use only - This is a hypothetical illustration of performance based on the current portfolio’s holdings and weights as described, going back to inception, being rebalanced daily and denominated in Canadian dollars. Portfolios’ performance is not guaranteed; the value can go up and down and change frequently. Past performance is not indicative of future returns. Management fees and expenses may be associated with an investment in a portfolio managed by WealthBar. Source: MorningStar Direct
WealthBar is registered with Canadian securities regulatory authorities in British Columbia, Alberta, Manitoba, New Brunswick, Newfoundland and Labrador, Nova Scotia, Ontario, Prince Edward Island, Quebec, Saskatchewan, Yukon, Northwest Territories and Nunavut (“Provincial Securities Regulators”) as a Portfolio Manager. WealthBar is responsible for understanding your goals, ability and willingness to accept investment risk when recommending of a portfolio that is suitable for you. WealthBar and its registered representatives have in-depth knowledge of all securities that they buy and sell for, or recommend. We know each security well enough to understand and explain the risks, key features, and initial and ongoing costs and fees. Your advisor is not able to provide the investment advice for your WealthBar accounts.