investment opportunities in thailand - boi : the board ... australia_aug2014_43398.pdf ·...
TRANSCRIPT

Investment Opportunities in Thailand
Ms. Duangjai Asawachintachit
Deputy Secretary General
Thailand Board of Investment (BOI)
Australia, August 2014

• Why Thailand
• Sectors of Opportunity
• Investment Policies and BOI
Services
Presentation Outline

At the Center of Southeast Asia: Thailand is the World’s
• 17th largest manufacturer
• 23rd largest industrial output
• 24th biggest economy by purchasing power
• 28th biggest exporter (as % of total world goods)
ASEAN’s 2nd Largest Economy

UNCTAD’s Survey
Top Ten Prospective Host Economies for 2013-2015
Country Rank
China 1
USA 2
India 3
Indonesia 4
Brazil 5
Germany 6
Mexico 7
Thailand 8
UK 9
Japan 10
Source: UNCTAD Investment Prospect Survey, based on 159 company responses

2013 Country Manufacturing Competitiveness Index
Rankings
Source: 2013 Global Manufacturing Competitiveness Index by Deloitte Touche Tohmatsu Ltd. and the U.S. Council on
Competitiveness as of April , 2013
* ( ) = rankings

The World Bank RanksThailand among the easiest
places to do Business inAsia and 18th in the World
Source: Doing Business 2014, October 2013

Economic Projections 2014f
Economic Projections 2012 20132014f
Ave. Range
Real GDP 6.5 2.9 2.6 2.1-3.1
Export of goods & services
(percent y-o-y)3.1 4.2 4.4 3.4-5.4
Import of goods & services
(percent y-o-y)8.8 2.3 3.8 2.8-4.8
Current account (billion US dollar)
% of GDP
-1.5
-0.4
-2.8
-0.6
4.7
1.1
3.7-5.7
0.8-1.4
Inflation (percent y-o-y) 3.0 2.2 2.5 2.0-3.0
Core inflation (percent y-o-y) 2.1 1.0 1.5 1.0-2.0
Unemployment (percent) 0.7 0.7 0.7 0.6-0.8
Source: Fiscal Policy Office, as of May 26, 2014

Source: UNCTAD and IMF as of April, 2014
8
Thailand: the Crossroads of ASEAN
GDP US$ 2.3 trillion(A$2.5 trillion)
Population 616 million
Foreign Direct
Investment
US$111 billion
(A$119 bn)
GDP Growth 5.7% (2011)
6.4% (2012)
5.2% (2013)
4.9% (2014)
ASEAN’s GDP to double
to US$4.7 trillion (A$5
trillion) in 2020
10 Countries, One Single Market in 2015
Note:US$1=Bt32.45, A$1=Bt30.26 in Q2, 2014

Expanding Regional Integration
AEC
(ASEAN Economic Community)
616 million population
(9% of world population)
GDP: US$2.5 trillion
(A$2.7 trillion)
(2% of world’s GDP)
RCEP(Regional Comprehensive
Economic Partnership)
(ASEAN + China, Japan, Korea, India, Australia & NZ)
3.3 billion population
(50% of world population)
GDP: US$17.1 trillion
(18.3 trillion)
(27% of world’s GDP)
FLAGSHIP OF ASEAN
- Emerging regional architecture
- A new generation FTA
- A high ambition agreement
THE BIGGEST FTA
- Market size (16 countries)
- Regional supply chain
- FDI (intra-extra region)Source: RCEP Seminar by DTN as of April 30, 2013
Note:US$1=Bt32.45, A$1=Bt30.26 in Q2, 2014

Map is not drawn to actual size
USA
ASEAN-MERCOSUR
Thai-EU
ASEAN-EU
Thai-EFTA
ASEAN-GCC
ASEAN-India
Thai-India
BIMSTEC
ASEAN-China
ASEAN-Japan
Thai-Japan
ASEAN AEC
Thai-Australia
ASEAN-CER
Thai-New
Zealand
Suspended
Under
Study
Ongoing
Negotiations
FTAs
in Force
RCEP
TPP
ASEAN-Korea
Thailand’s FTAs
Pending
Mandate

Ping Thong Industrial Estate
Hemaraj Land and Development PLC
Amata Industrial Estate
Gateway CityIndustrial Estate
Asia Industrial Estate
Padaeng Industrial Estate
Map Ta Phut Industrial Estate
Laem Chabang Industrial Estate
Wellgrow Industrial Estate
Golf Course
International School& University
Hospital
304 Industrial Park
Rojana Industrial Park
Map of basic infrastructure sites and industrial parks in and around Bangkok

Five Targets for Infrastructure Development in
Transportation
-To revamp the provincial rail network
-To improve public transport systems to ease traffic
congestion in Bangkok
-To boost the capacity of highways to connect with
production bases in rural areas and neighboring countries
-To improve the efficiency of water and air transport
systems.

Infrastructure Development Projects for 2015-2022
All proposed projects are to be prioritized.
Likely projects include
Dual track rail
Construction of broadwalk along the Chaopraya
River
Expansion of skytrain, MRT
Expansion of airports in border provinces
Improvements of river portsand dredging of
waterways
Improvements of highways connecting
neighboring countries
Source: Thai PBS, June 13, 2014

Phase 1 Route (Bidding in 2013) Distance (km) Status
(2010-14) Chachoengsao- Klong Sib
Kao-Kaeng Koi
106
Under
EIA
proposal
Lopburi-Nakornsawan 118
Mabkabal-Jira (Korat) 132
Jira-Khon Kaen 185
Nakorn Pathom- Hua Hin 165
Prachuab Kirikan -
Chumporn
167
Total 873
Strategic Agenda: Modal Shift(8)
Double Track for
Railways-total
3,145 Km.
Phase 2 Route Distance (km)
(2015-29) Kang Koy – Bua Yai 220
Jira-Ubon Ratchathani 309
Kong Kaen- Nongkhai 172
Nakorn Sawan-Tapanhin 69
Hua Hin - Prachuabkirikhan 89
Chumporn-Surat Thani 166
Total 1,025
Phase 3 RouteDistance
(km)
(2020-25) Tapanhin-Chiang Mai 427
Surat Thani-Padangbesa 339
Klong 19-Kabin Buri 76
Hat Yai-Sugaikolok 214
Thungsong-Kantrang 93
Krabin Buri-Klongluk 98
Total 1,247Source: OTP, Ministry of Transport, as of Apr 24, 2014
Double Track Railway Project (1/2)

Phase 1 (78 km)
Phase 2 (106 km)
รถไฟทางคูใ่นปัจจบุัน
Current railway for goods transportation
Chachoengsao-Sriracha-Laem Chabang
(already started commercial operation since Jan 12, 2012)
Speed up the project to support particularly in Eastern Seaboard area with a total distance of 184 km.
Chachoengsao=Klongsibkao-Kang Khoi
(Preparation for bidding)
Double Track Railway Project (2/2)
Source: Office of transport and traffic policy and planning, Ministr of Transport as of Apr 24, 2014

Mass Rapid Transit Master Plan (2010-2029)
Source Ministry of Transport, as of Feb 2011

2014 2013
4 5 Singapore
7 3 Tokyo
14 13 Seoul
66 57 Yangon
88 66 Bangkok
115 111 Kuala Lumpur
119 71 Jakarta
131 134 Hanoi
169 177 Phnom Penh
Source: Mercer Cost of Living 2014
(Ranking out of total 211 cities)
Bangkok (88) drops 22
places from last year
Thailand: Low Cost of Living

Low Corporate Income Tax 2013
Source: KPMG ASEAN Tax Guide, as of 2013

Thailand’s New Personal Income Tax Scheme
Income Taxed amount Tax rate
Old New
0-150,000 150,000 Exempted Exempted
150,001-300,000 150,000 10% 5%
300,001-500,000 200,000 10% 10%
500,001-750,000 250,000 20% 15%
750,001-1,000,000 250,000 20% 20%
1,000,001-2,000,000 1,000,000 30% 25%
2,000,001-4,000,000 2,000,000 30% 30%
More than 4,000,000 - 37% 35%
Note: The new tax rate will be applied for 2013 tax calendar year onwards.
Source: http://www.rd.go.th/publish/fileadmin/download/taxrate_pit2556.pdf as of Jan 2014

Construction Costs
Description M2 Costs (THB) M2 Costs
(A$1=30.26THB)
Industrial Building
Standard Low Rise Factory 15,000 -19,000 $496 - $628
Electrical Power Systems 5400 $178
Office (Construction)
High Quality 28,000 - 33,000 $925 - $1,091
Medium Quality 23,000 - 28,000 $760 - $925
*Includes transformer, Main DB and Sub DB for general factory & office electrics only.
Excludes production equipment/machinery power.
**Includes cost of communal air conditioning, general electrics and sanitary.
Source: Tractus Asia/updated May 2014

0.5 0.30.6
0.20.0
0.6
9.8
6.3
1.2
2.2
3.0
8.6
0
2
4
6
8
10
Total Japan EU USA S.Korea China
A$
Bil
lio
n
2013 (Jan-Jul) 2014 (Jan-Jul)
Foreign Direct Investment Applications
-12.4%
Source: BOI, as of Aug 19, 2014 Note:A$1=Bt30.26 in Q2, 2014

Australia

Trend of Australian Applications
208
1830
109 107 110
147
80
35
428
23 31
1514
11
22
25
22
16
18
22
25
23
19
0
100
200
300
400
500
2003 2004 2005 2006 2007 2008 2009 2010 2011 2012 2013 2014
(Jan-
Jul)
A$
Mil
lio
n
0
5
10
15
20
25
30
No
. of
Pro
ject
s
Value
No.of Projects
Source: BOI, as of Aug 19, 2014 Note:A$1=Bt30.26 in Q2, 2014

Sector Projects A$ Million
Agriculture 15 91.3
Minerals and Ceramics 3 176.7
Light Industry 17 31.5
Auto and Metal Processing 44 130.5
Electrical and Electronics 23 22.1
Petrochemicals, Chemicals 13 55.5
Services and Infrastructure 30 346.0
TOTAL 145 853.7
Australian Investment Applications
Totals by Sector: 2008 – 2014 (Jan-Jul)
Source: BOI, as of Aug 19, 2014 Note:A$1=Bt30.26 in Q2, 2014

Sample of Australian Investment in Thailand

Trade Summary between Thailand/Australia
3.27
4.20
5.46
6.76
8.70
9.65 9.82
7.97
9.9710.33
4.53
2.94
4.32 4.32 4.37
5.68
4.35
6.25
8.00
5.62 5.56
2.91
6.2
8.59.8
11.1
14.4 14.0
16.1 16.0 15.6 15.9
7.4
0
3
6
9
12
20042005
20062007
20082009
20102011
20122013
2014 (Jan-Jun)
A$ B
illi
on
0
5
10
15
20
A$ B
illi
on
Export
Import
Total
Source: MOC, as of Aug 19, 2014 Note:A$1=Bt30.26 in Q2, 2014

Principal Thai Exports to Australia
Description 2011 2012 20132013
(Jan-Jun)
2014
(Jan-Jun)
%
Change
YOY
Motor cars, parts and accessories 2,570.9 3,807.0 4,416.3 2,300.3 1,967.3 -14.47
Polymers of ethylene, propylene,
etc in primary forms328.1 344.8 420.2 199.8 201.8 1.03
Iron and steel and their products 268.8 658.9 840.7 514.5 191.1 -62.85
Air conditioning machine and
parts thereof364.9 393.5 388.8 154.0 167.0 8.41
Prepared or preserved fish,
crustaceans, molluscs in airtight 301.9 352.7 326.7 150.6 153.6 2.00
Others 4,130.9 4,416.7 3,938.9 1,771.5 1,844.5 4.12
Total 7,965.6 9,973.7 10,331.5 5,090.6 4,525.3 -11.10
Unit: A$ million
Source: MOC, as of Aug 19, 2014 Note:A$1=Bt30.26 in Q2, 2014
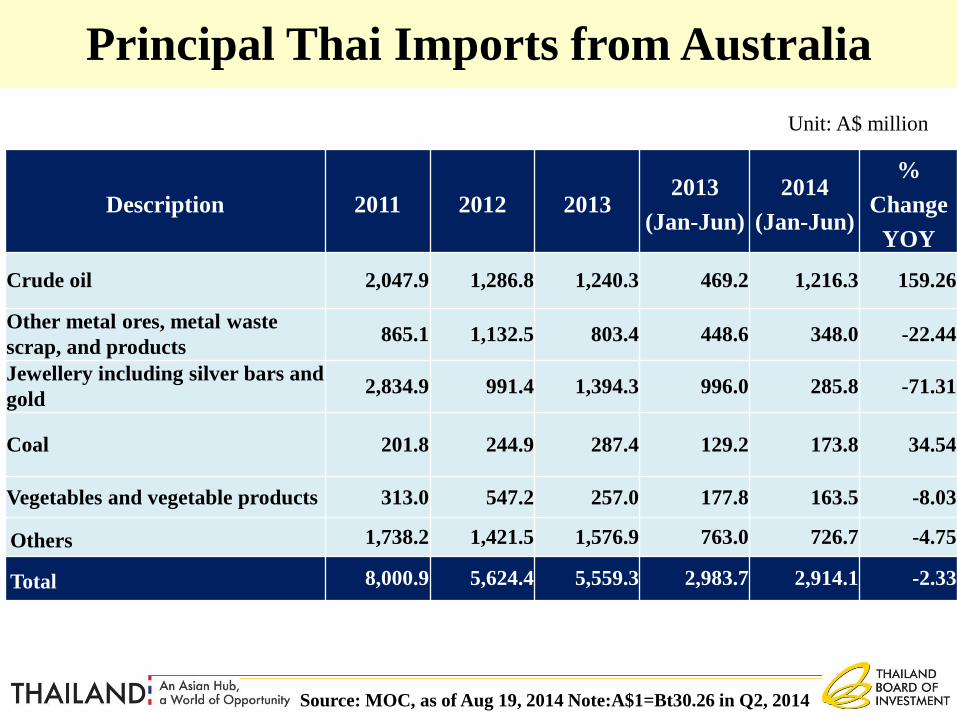
Principal Thai Imports from Australia
Description 2011 2012 20132013
(Jan-Jun)
2014
(Jan-Jun)
%
Change
YOY
Crude oil 2,047.9 1,286.8 1,240.3 469.2 1,216.3 159.26
Other metal ores, metal waste
scrap, and products865.1 1,132.5 803.4 448.6 348.0 -22.44
Jewellery including silver bars and
gold2,834.9 991.4 1,394.3 996.0 285.8 -71.31
Coal 201.8 244.9 287.4 129.2 173.8 34.54
Vegetables and vegetable products 313.0 547.2 257.0 177.8 163.5 -8.03
Others 1,738.2 1,421.5 1,576.9 763.0 726.7 -4.75
Total 8,000.9 5,624.4 5,559.3 2,983.7 2,914.1 -2.33
Unit: A$ million
Source: MOC, as of Aug 19, 2014 Note:A$1=Bt30.26 in Q2, 2014

• Why Thailand
• Sectors of Opportunities
• Investment Policies and BOI
Service
Presentation Outline

Sectors of Opportunity
Target Industries
Agriculture and food processing
Automotive
Machinery
Mold & Die
Target Industries
Biotechnology
Alternative energy
E&E

Renewable Energy Sector
Natural: Solar, Hydro, Wind
Crop: Sugar Cane, Cassava, Palm
Waste: Agricultural Waste, Industrial Waste, Municipal Waste
Source: National Food Institute 2012

Thailand’s Energy Policy
1
• Enhancing energy related industries & business to be next generation value-creator.
2• Securing country’s energy supply.
3• Pricing energy right.
4• Up-scaling RE mix to 25% in 10 years.
5
• Targeting energy intensity reduction by 25% (based on 2010 level) within 20 years.
Source: DEDE (Renewable Energy Asia 2012), as of Sept 12, 2012.

Growing Opportunities: Renewable & Alternative Energy
Abundant Agricultural
Raw Materials
Sufficient and Improved
Infrastructure
The Most Optimal Location for Business and
Living Condition
High Level of Local Technical
Expertise and an Established
Legislative Framework for the
Renewable Sector
As of July 22, 2014

Thailand’s solar target (AEDP2012-2021) highest among ASEAN countries.
Highest growth rate among all renewable energy.
Strong investor’s interest-more opportunities for market expansion.
Thailand’s Solar Capacity(as of Dec 2013)
868.97
4.25
389.13
529.64
410
310
85
Proposed Accepted
(waiting to signPPAs)
PPA signed
(not yetconnected)
Connected and
selling to thegrid
Solar Installed Capacity (MW)
VSPP SPP
Source: Seminar on Renewable Energy Technology Implementation in Thailand
Experience Transfer from Europe by EPPO & ERC as of December 2013
Total Projects:
SPP: 7 (436 MW)
VSPP: 458 (1,791.98 MW)

“Adder” : Feed-in PremiumsType of renewable energy (July 2010-Present)
Adder
(B/kWh)
VSPP SPP
Special
adder *
(B/kWh)
Supporting
period
(Year)
Biomass- Installed capacity <= 1 MW
- Installed capacity > 1 MW
0.50
0.30
Bidding 1.00
1.00
7
7
Biogas (all categories of production sources)- Installed capacity <= 1 MW
- Installed capacity > 1 MW 0.50
0.30Bidding 1.00
1.00
7
7
Waste (community waste, not hazardous industrial
waste, and inorganic waste)- AD &b LFG
- Thermal Process
2.50
3.50
2.50
3.50
1.00
1.00
7
7
Wind power- Installed capacity <= 50 kW
- Installed capacity > 50 kW
4.50
3.50 3.50
1.50
1.50
10
10
Mini and micro hydropower- capacity 50-200 kW
- capacity < 50 kW
0.80
1.50
-No- 1.00
1.00
7
7
Solar Cell 6.5 1.50 10
* Note : Special Adders for
- Facilities in 3 Southernmost provinces
and 4 districts in Songkhla
- Diesel-Gen. replacement on PEA system
Source: EEF Annual Seminar by DEDE as of Aug 19, 2013
Note: 4 districts in Songkhla province including Chana, Thepha, Saba Yoi, and Nathawi

New Subsidized Rates for Solar PV Rooftop &
Community-based Projects
Solar PV Rooftop (200 MW) CapacityFeed-in-Tariff (25 yrs.)
Bt/kWh
Residential project (100 MW) < 10 kW 6.96 (A$0.23)
Commercial building
(100 MW)
Small 10-250 kW 6.55(A$0.22)
Medium/
Large250-1,000 kW 6.16(A$0.20)
Capacity target
• 200 MW
Responsible unit
• Energy Regulatory Commission (ERC)
Action
• Rooftop system has to be installed by 2014
Source: Recent Developments and a Future of Thailand’s Renewable Energy as of Aug 14, 2013 Note:A$1=Bt30.26 in Q2, 2014

New Subsidized Rates for Solar PV Rooftop &
Community-based Projects
Community Solar Owned System Promotion (800 MW)
Subsidies period (years) Feed-in-Tariff Bt/kWhCommunity revenue prospect
(Bt million)
1-3 9.75 (A$0.32) 2.04 (A$67,413)
4-10 6.50 (A$0.21) 1.97 (A$65,100)
11-25 4.50 (A$0.15) 3.97 (A$131,191)
Revenue total 7.95 (A$262,713)
Capacity target
• 800 MW
Subsidy
• FIT rates will be awarded to 800 MW worth of “ground-mounted community owned solar who can allocate 1 MW per local sub district.
Action
• The community-owned PV plants must be installed by 2014.
Source: Recent Developments and a Future of Thailand’s Renewable Energy as of Aug 14, 2013 Note:A$1=Bt30.26 in Q2, 2014

Alternative Energy Development Plan (AEDP) 2012-2021
Renewable Energy ( 13,924 MW)
Solar power 3,000 MW
Wind power 1,800 MW
Hydro power 324 MW
MSW 400 MW
Biomass 4,800 MW
Biogas 3,600 MW
New forms of RE (3 MW)
Geothermal energy 1 MW
Wave and Tides 2 MW
AEDP 2012-2021, targeting to replace 25% of total fossil-fuel
consumption with RE at the end of 2021.
Source: Ministry of Energy, as of Aug 19, 2013

Source: www.dede.go.th as of June 20, 2014
Note: Traditional renewable energy consists of fuel wood, charcoal, paddy husk, and agricultural waste using in residential
and industrial households.

1.18 Manufacture of alcohol or
fuel from agricultural products,
including scrap, garbage and/or waste
4.2.3 Manufacture of energy-conserving
machinery or equipment or machinery
which uses alternative energy
4.15 Manufacture of fuel cells
Renewable
Energy
Renewable Energy: Eligible Activities
7.1.1 Production of electricity or steam
power using alternative energy such as
energy from agricultural materials, biogas
and wind energy
5.5.10 Manufacture of solar cells and raw
materials for solar cells
Source: BOI Announcement No.2/2553, April 23, 2010

Automotive Industry“Thailand: Automotive Hub of Asia”
9th largest automobile producer in the world in 2013
14 assemblers with a combined production of more than 2,000,000 in 2012
High Local content of up to 90%
Target of 3 million units in 2017

World’s Automotive Production 2013
(Units of production)
Source: OICA as of March, 2014
World’s Production: 87.24 Million (+3.6%)
Thailand : 2.53 Million (+4.3%)
#9 in World’s Automotive Production
#1 in ASEAN for Automotive Production
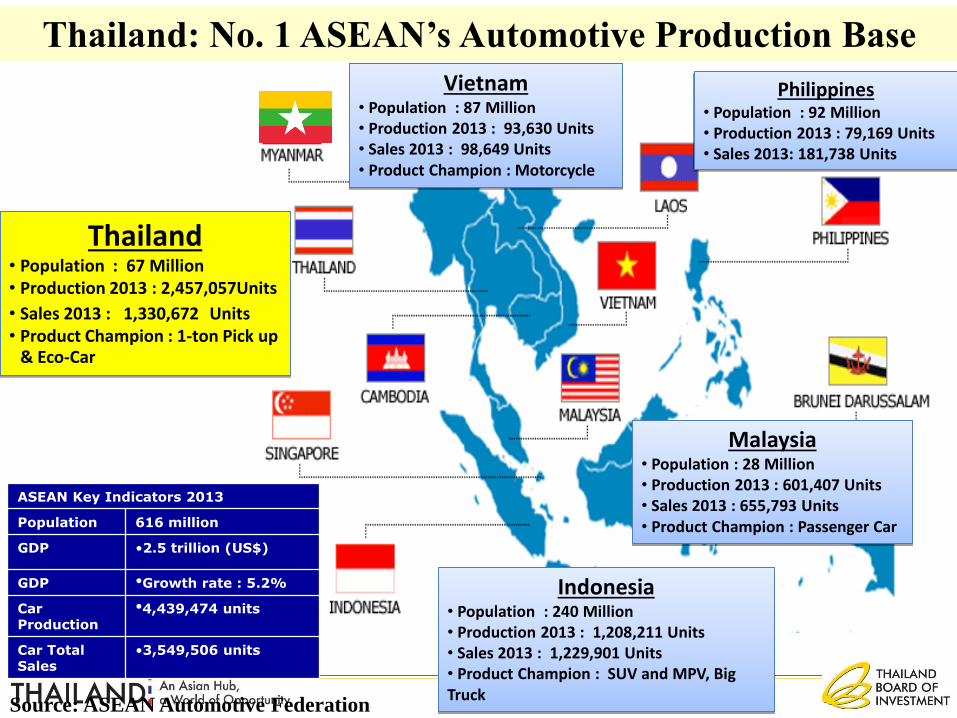
Thailand• Population : 67 Million• Production 2013 : 2,457,057Units
• Sales 2013 : 1,330,672 Units• Product Champion : 1-ton Pick up
& Eco-Car
Indonesia• Population : 240 Million• Production 2013 : 1,208,211 Units• Sales 2013 : 1,229,901 Units• Product Champion : SUV and MPV, Big Truck
Philippines• Population : 92 Million• Production 2013 : 79,169 Units• Sales 2013: 181,738 Units
Vietnam• Population : 87 Million• Production 2013 : 93,630 Units• Sales 2013 : 98,649 Units• Product Champion : Motorcycle
Malaysia• Population : 28 Million • Production 2013 : 601,407 Units• Sales 2013 : 655,793 Units• Product Champion : Passenger Car
Thailand: No. 1 ASEAN’s Automotive Production Base
ASEAN Key Indicators 2013
Population 616 million
GDP •2.5 trillion (US$)
GDP •Growth rate : 5.2%
Car Production
•4,439,474 units
Car Total Sales
•3,549,506 units
Source: ASEAN Automotive Federation

Thai Automotive Cluster and Supply Chain Structure
Tier 2 & 3Tier 1Manufacturer
Parts Manufacturers 450,000 persons
Supporting Industries 100,000 persons
Passenger &Pick-up
(17 companies, 23 factories)
Motorcycle (8 companies,
8 factories)
SME
(1,700 companies)
Stamping, plastics, rubber,
machining, casting, forging,
function, electrical,
trimmingEngines ,Drivetrains, Steering, Suspension,
Brake Wheel, Tire, Bodyworks, Interiors, Electronics and Elec Systems
Vehicle Parts (386 companies)
Motorcycle Parts (201 companies)
Vehicle & Motorcycle Parts (122 companies)
*Vehicles100,000 persons
•Dealer, •Service center
200,000 persons
• Distribution (W/H)
• Finance
• Testing
• Consulting
• Logistic
• Banking/Leasing
Associations / InstitutesUniversities /
Technical Colleges Government
Upstream Industry
Steel, Plastic, Rubber, Electronics, Glass,
Textile, Leather, Chemical, Oil, Coating and Gulvanize
Policy & Supporting Body
Service Industry
SUPPORTING INDUSTRYMACHINERY, EQUIPMENT&DEVICE, MOLD & DIE, JIG & FIXTURE

50. GKN Driveline
52. Goodyear56. Grupo Antolin58. Bayer59. TI Automotive65. Draexlmaier67. American Axle73. Rieter Auto.84. F-Tech86. Hayes Lammerz93. 3M
2. Denso4. Aisin Seiki13. Yazaki15. Sumitomo16. Toyota Boshoku18. Calsonic Kansei19. JTEKT20. Hitachi28. Toyoda Gosei33. NTN34. NSK35. Mitsubishi39. NHK Spring40. Koito41. TS Tech43. Takata
46. Bridgestone
49. Tokai Rika
57. Showa
61. Mitsuba
66. Asahi Glass
72. Stanley
74. Akebono Brake
82. Sanden
84. F-Tech
92. Alpine
94. Pioneer
98. Omron
Japanese Global Suppliers
28/29 Companies 29/71 Companies
Other Global Suppliers
1. Robert Bosch3. Continental6. Faurecia7. Johnson Control8. ZF
11. TRW12. Delphi14. Lear17. BASF 21. Valeo22. Visteon23. Autoliv25. Mahle27. Dana31. BorgWarner36. Teneco44. Federal-Mogul47. Michelin
Top 100 Global Suppliers Active in Thailand’s Automotive Industry

BOI Incentives for Automotive Makers
Manufacture of passenger carsCondition:
• The actual production must not be less than 100,000 units/year in any year during
the first five years of operation.
• All production must be based on the same platform approved by the Board.
• The total investment during the first 5 years of corporate income tax exemption
must not be less than 15 billion baht, excluding cost of land and working capital.
• An investment plan for parts production and a plan for parts utilization must be
submitted and approved by the Board.
Rights and benefits:
• Exemption of import duties on machinery regardless of zone.
• 5-year exemption of corporate income tax regardless of zone.
• Other rights and benefits shall be granted according to BOI Announcement
No.1/2543 dated Aug 1, 2000.
Source: A Guide to BOI Investment as of Nov 24,2011

1. Manufacture of vehicle parts (General parts)
Incentives
• Exemption of corporate income tax (Cap)
Zone 1 - 3 years (In Industrial Estate)
Zone 2 - 3 years (Outside IE) / 7 years
(In Industrial Estate)
Zone 3 - 8 years
• Exemption of import duties on machinery
• Exemption of import duties on raw materials for production of exports
BOI Incentives for Automotive Parts (1/2)

BOI Incentives for Automotive Parts (2/2)
2. Manufacture of vehicle parts (Hi-tech parts)
Classified as Priority activity
Incentives
- 8-yr ExemptionAll Zones
- Machinery Import duty Exemption
- Raw Material Import duty Exemption for Export
ABS
Substrate for catalytic converters
Electronic fuel injection systems
Automobile transmission
Battery for electric-powered vehicles
Traction motor for automobile such as hybrid or fuel cell cars
Electronic Stability Control(ESC)
Regenerative Braking System
Electric air conditioning system for automobile
Rubber tires for vehicles
Aircraft tread tires
Electronic parts for vehicles

60
Thai Automotive Industry Milestones
1st Milestone1 million units
Rank 15th
2nd Milestone2.45 million units
Rank Top 10
“Thailand is a global green
automotive production base with strong domestic supply
chains which create high value added for the country”
3rd Milestone
3 million units
Source: The Thai Automotive Industry Association (TAIA)

Thailand ICT Sector
Source: IMC Institute 2014 and National Broadcasting and Telecommunications Commission (NBTC) as of June 24, 2014
Internet Users: 23.86 million, a 35.8% penetration rate(2013)
Broadband Subscribers: 5.1 million homes (Q1, 2014)
Facebook Users: 26 millions (2013)
Mobile Subscribers: 96.4 million (including Post-Paid and Pre-paid in Q1, 2014)
Mobile Penetration: 144.36% (Q1, 2014)

Attractive Investment Incentives
• The BOI has classified software development as a priority activitythat is crucial to the country’s development.
• Software development ventures are eligible for the maximumincentives offered by the BOI regardless of location, irrespectiveof the BOI zone in which they choose to locate.
• Priority activity incentives include:
– A maximum corporate income tax exemption of 8 years withno cap on the amount exempted;
• Import duty exemptions on machinery;
• The possibility of 100 percent foreign ownership;
• The option to bring in foreign experts.
– The BOI also offers many other zone-based incentives,including
• Double deduction from taxable income of utility andtransport
costs for up to 10 years in Zone 3.

Agro-business Sector
World’s # 1 Cassava Exports
World’s # 2 Sugar Exports
World’s # 3 Fishery Exports
World’s # 6 Rice & Grains Exports

BOI Incentives1.11.8 Manufacture or preservation of ready-to-eat or semi-ready-to-eat
food is classified as a priority activity of special importance and
benefits to the country.
Conditions:
– Products must use modern technology, production process, tools
and equipment and inspection (current or innovative technology)*.
Rights and benefits:
– Exemption of import duty on machinery for all zones.
– Eight-year corporate income tax exemption for all zones with no
cap.
– Other relevant location-based incentives.
* Ref. BOI Announcement No.Por1/2553-Scope of Products under the Investment Promotion Activity Category 1.11.8 Manufacture or
Preservation of Ready-to-Eat or Semi Ready-to-Eat Food.

• Why Thailand
• Investment Statistics
• Investment Policies and BOI
Services
Presentation Outline

BOI ZONING AND INCENTIVES

BOI Zoning and Incentives
Zone: 1 2 3
Incentives: Lower Higher
Import Duty Privileges
Outside I.E Inside I.E
Zone 1 50% Reduction 50% Reduction
Zone 2 50% Reduction Exempt
Zone 3 Exempt Exempt
Corporate Income
TaxOutside I.E Inside I.E
Zone 1 No Privilege 3 years
Zone 2 3 years 7 years
Zone 3 8 years 8 years

BOI’s Liberal Investment Regime & Attractive Investment Incentives
Policy
100% foreign ownership
No local content requirements
No export requirements
No restriction on foreign currency
Tax
Import duty exemptions/ reductions on machinery & raw materials
Corporate Income Tax/ Exemption for 3 to 8 years
50% reduction of corporate income tax for up to 5 years
Double deduction on utility costs
Deductions for qualifying infrastructure costs
Non-Tax
Land ownership rights
Work permit & visa facilitation
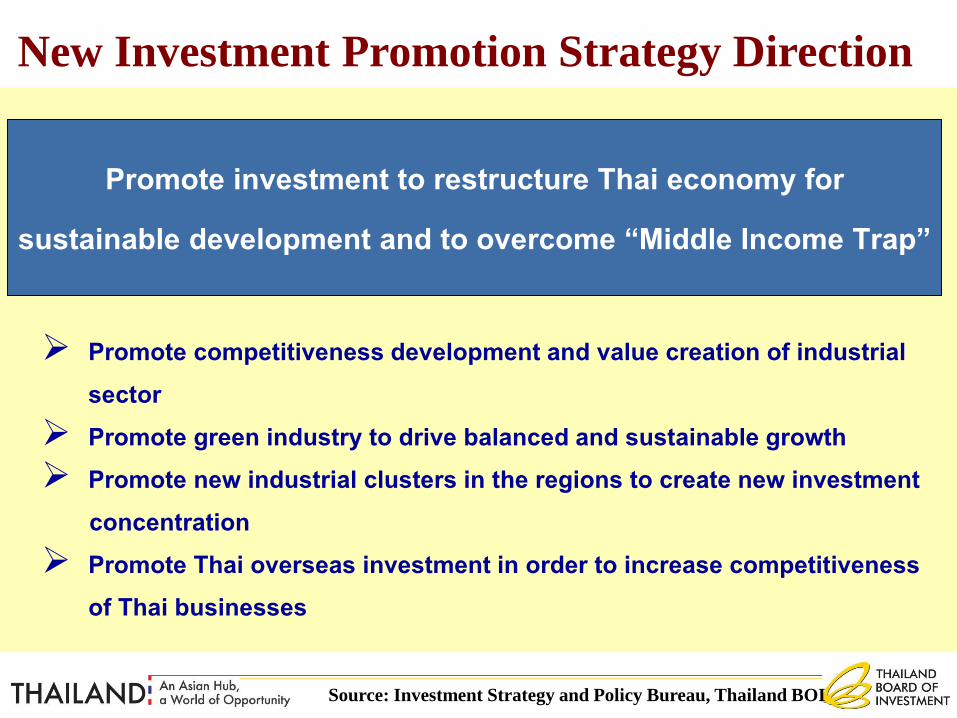
Promote investment to restructure Thai economy forsustainable development and to overcome “Middle Income Trap”
Promote competitiveness development and value creation of industrial sector
Promote green industry to drive balanced and sustainable growth Promote new industrial clusters in the regions to create new investment
concentration Promote Thai overseas investment in order to increase competitiveness
of Thai businesses
New Investment Promotion Strategy Direction
Source: Investment Strategy and Policy Bureau, Thailand BOI

Driving Skill, Technology and Innovation Investment
through Investment Incentives
Incentives: Additional 1-3 years of tax holidays
Criteria: Investments and expenditures on
• Research and development or design
• Advanced technology training
• Funding educational and research institutions
• Contribution to S&T Development Fund

BOI Unit for Industrial Linkage
Development (BUILD)
20+ years of service

91Overseas offices
Country desks
1-Stop for visas & work permits:work permits in 3 hours
Interaction with other govt. agencies
on behalf of investors
Industrial Subcontracting Services
Vendors meet customers program
(BUILD Unit)
Investment Matchmaking Program
ASEAN Supporting Industry Database
BOI SUPPORT SERVICES

92
18th Floor, Chamchuri Square Building
319 Phayathai Road, Pathumwan
Domestic Call: 0 2209 1100, Inter. Call: (66 2) 209 1100
Email: [email protected]
More Convenience,
less time,
more efficiency!

Thank you