investment opportunities and policies in thailand board of... · investment opportunities and...
TRANSCRIPT
Investment Opportunities and Policies in Thailand
February 2016
Mr. Chokedee Kaewsang,
Deputy Secretary General
Office of the Board of Investment 1
2
2 Thailand as the ASEAN Hub
3 Cattle and Food Industry
1 Thailand at a Glance
4 Investment Incentives and BOI Services
Contents
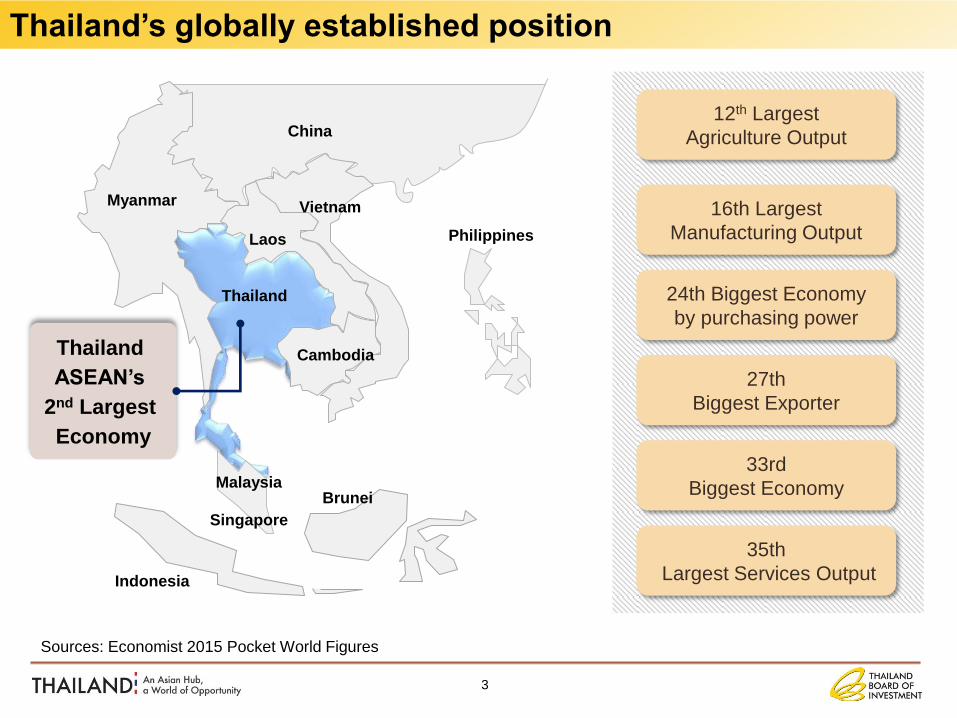
Sources: Economist 2015 Pocket World Figures
Vietnam
Cambodia
Thailand
Myanmar
China
Laos Philippines
Malaysia
Singapore
Indonesia
Thailand
ASEAN’s
2nd Largest
Economy
12th Largest
Agriculture Output
16th Largest
Manufacturing Output
24th Biggest Economy
by purchasing power
27th
Biggest Exporter
33rd
Biggest Economy
35th
Largest Services Output
Brunei
3
Thailand’s globally established position

4
Sources: World Bank, NESDB, Ministry of Commerce, Exchange rate (BOT, Feb 1 2016): 1 AUD = 25.59 THB
1 GDP AUD 528 billion, (per capita) AUD 8,111
Growth 3.5-4.5%
Thailand
2 Total Export Value AUD 318 billion
3 Population 68 million,
97% literacy rate
4 Taxation
• Corporate: 20%
• Withholding: 5%
• VAT: 7%
Economic Overview
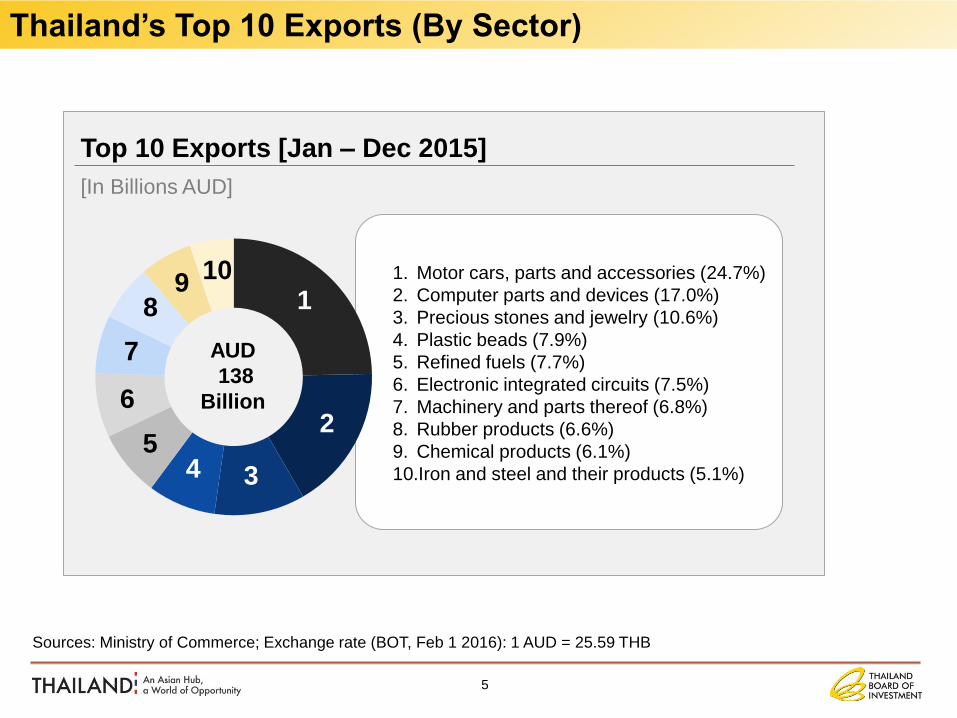
Top 10 Exports [Jan – Dec 2015]
1. Motor cars, parts and accessories (24.7%)
2. Computer parts and devices (17.0%)
3. Precious stones and jewelry (10.6%)
4. Plastic beads (7.9%)
5. Refined fuels (7.7%)
6. Electronic integrated circuits (7.5%)
7. Machinery and parts thereof (6.8%)
8. Rubber products (6.6%)
9. Chemical products (6.1%)
10.Iron and steel and their products (5.1%)
AUD
138
Billion
1
2
3 4 5
6
7
8 9
10
Sources: Ministry of Commerce; Exchange rate (BOT, Feb 1 2016): 1 AUD = 25.59 THB
Thailand’s Top 10 Exports (By Sector)
[In Billions AUD]
5
Sources: BOI; Exchange rate (BOT, Feb 1 2016): 1 AUD = 25.59 THB
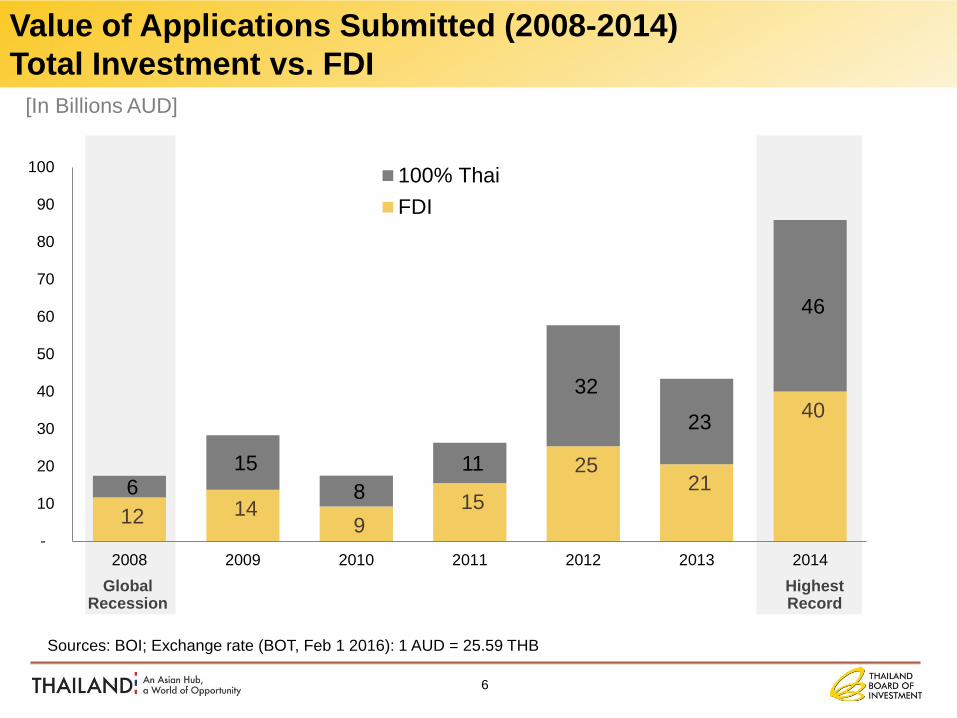
[In Billions AUD]
Global Recession
Highest Record
12 14 9
15
25 21
40
6 15
8
11
32
23
46
-
10
20
30
40
50
60
70
80
90
100
2008 2009 2010 2011 2012 2013 2014
100% Thai
FDI
6
Value of Applications Submitted (2008-2014)
Total Investment vs. FDI
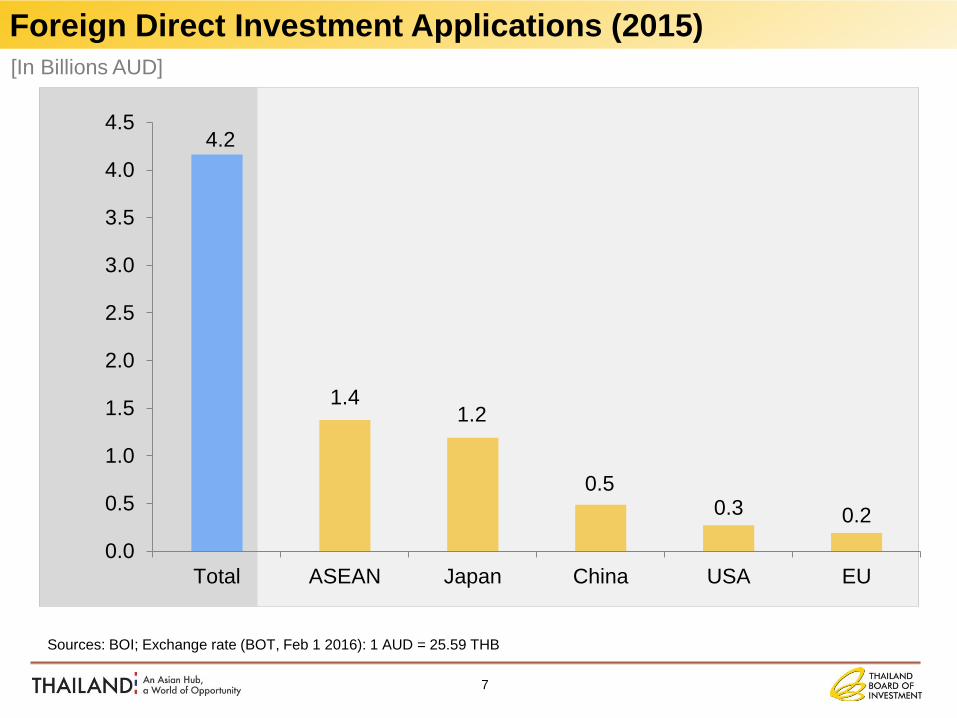
4.2
1.4 1.2
0.5 0.3 0.2
0.0
0.5
1.0
1.5
2.0
2.5
3.0
3.5
4.0
4.5
Total ASEAN Japan China USA EU
[In Billions AUD]
7
Sources: BOI; Exchange rate (BOT, Feb 1 2016): 1 AUD = 25.59 THB
Foreign Direct Investment Applications (2015)
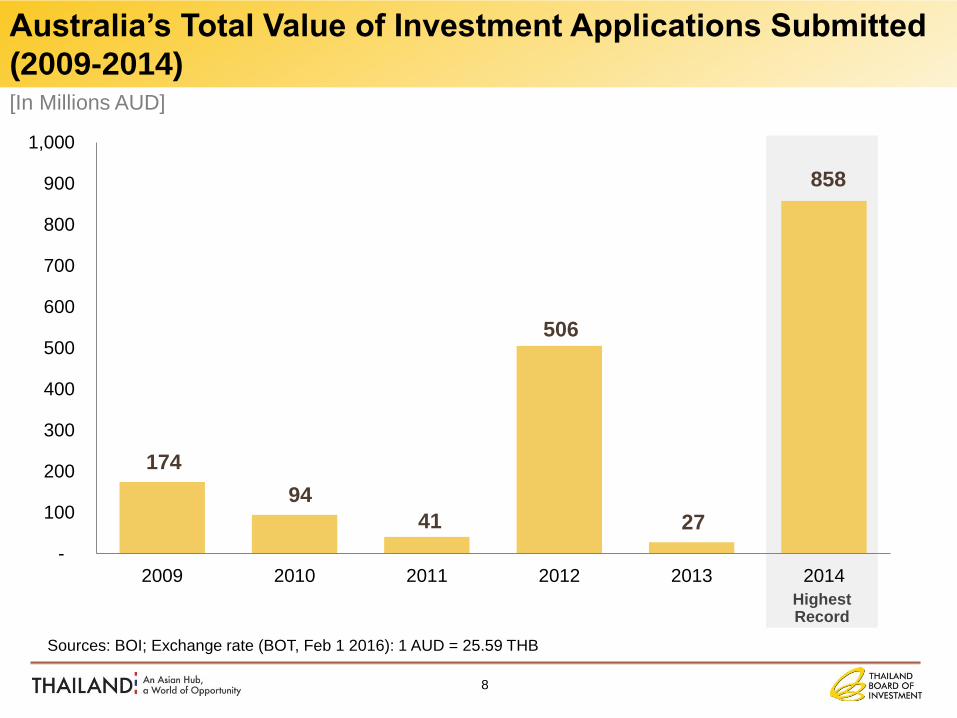
Sources: BOI; Exchange rate (BOT, Feb 1 2016): 1 AUD = 25.59 THB
[In Millions AUD]
Highest Record
174
94
41
506
27
858
-
100
200
300
400
500
600
700
800
900
1,000
2009 2010 2011 2012 2013 2014
8
Australia’s Total Value of Investment Applications Submitted
(2009-2014)
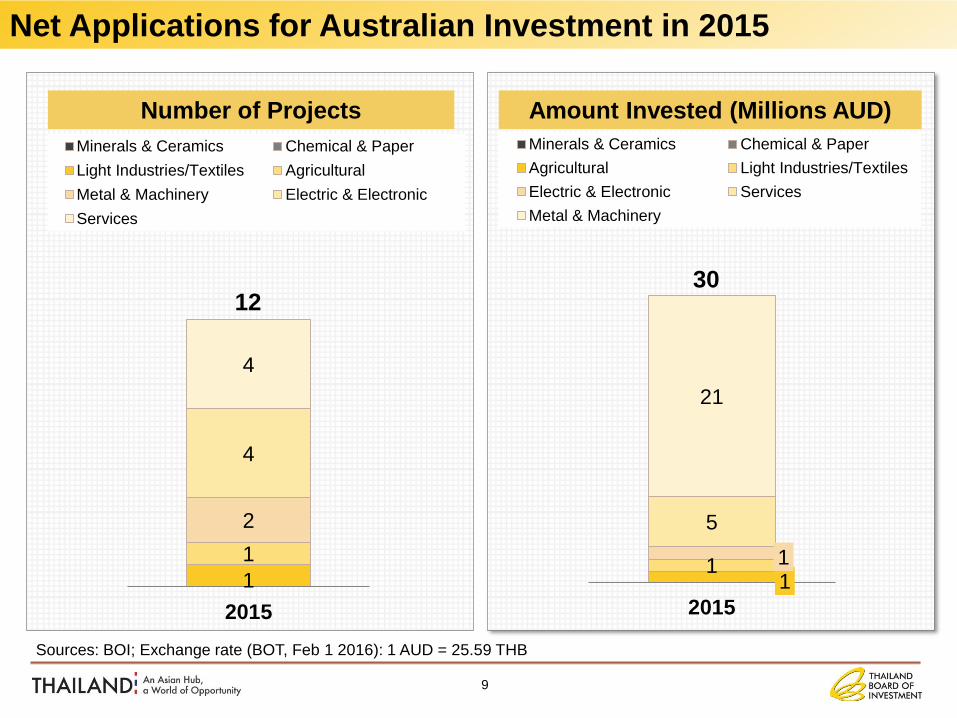
Number of Projects
1
1
2
4
4
2015
Minerals & Ceramics Chemical & Paper
Light Industries/Textiles Agricultural
Metal & Machinery Electric & Electronic
Services
Amount Invested (Millions AUD)
1 1 1
5
21
2015
Minerals & Ceramics Chemical & Paper
Agricultural Light Industries/Textiles
Electric & Electronic Services
Metal & Machinery
Sources: BOI; Exchange rate (BOT, Feb 1 2016): 1 AUD = 25.59 THB
12 30
9
Net Applications for Australian Investment in 2015
10
2 Thailand as the ASEAN Hub
3 Cattle and Food Industry
1 Thailand at a Glance
4 Investment Incentives and BOI Services
Contents
11
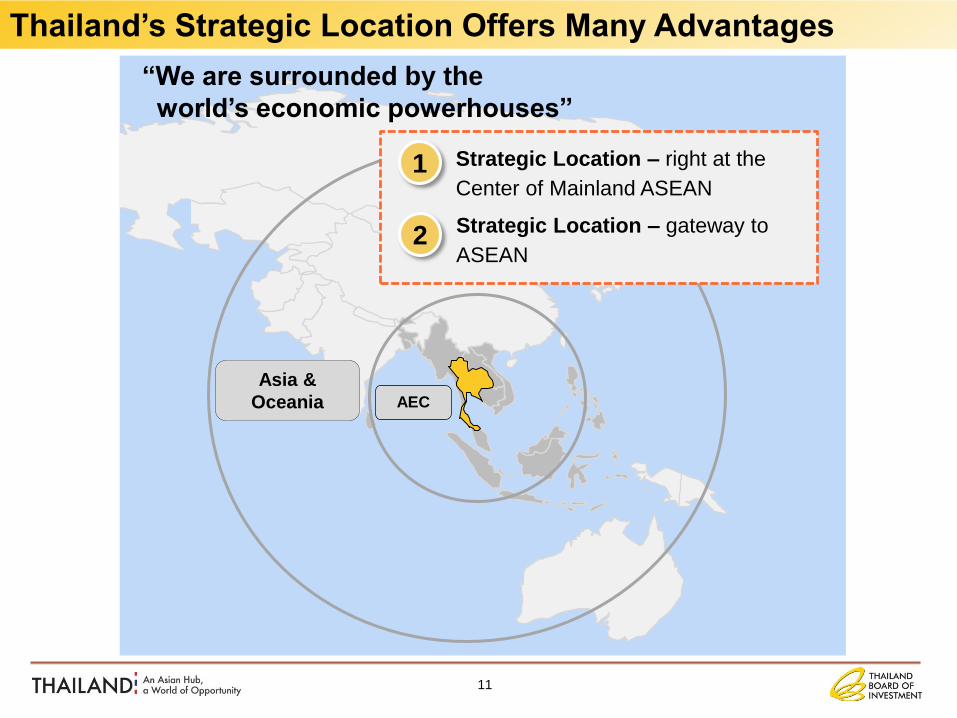
AEC
Asia &
Oceania
“We are surrounded by the
world’s economic powerhouses”
1 Strategic Location – right at the
Center of Mainland ASEAN
2 Strategic Location – gateway to
ASEAN
Thailand’s Strategic Location Offers Many Advantages
12
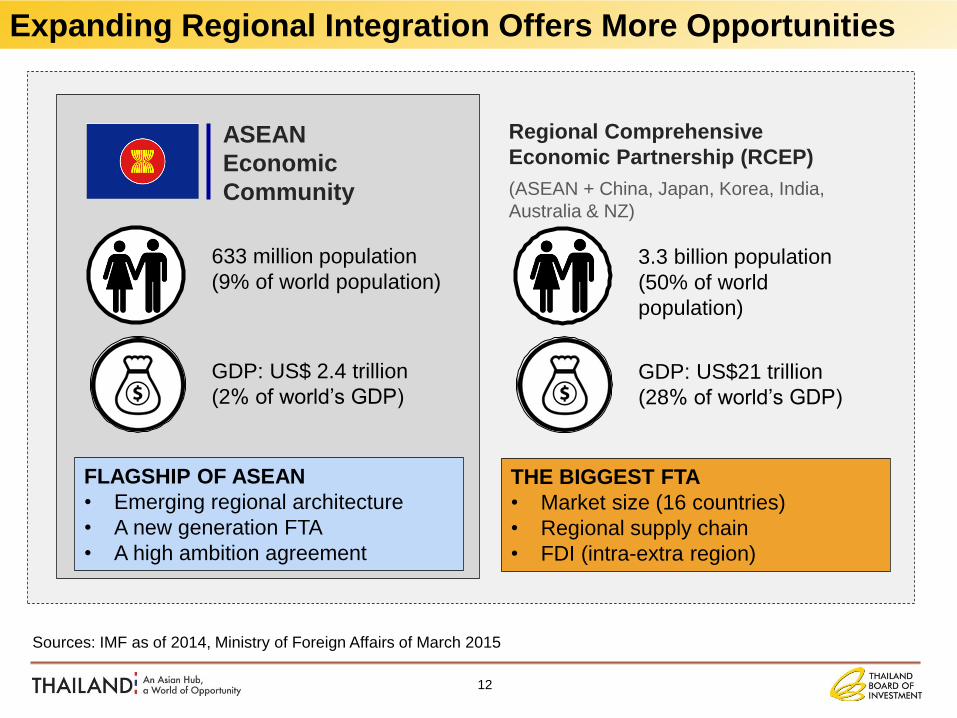
Sources: IMF as of 2014, Ministry of Foreign Affairs of March 2015
ASEAN
Economic
Community
633 million population
(9% of world population)
GDP: US$ 2.4 trillion
(2% of world’s GDP)
FLAGSHIP OF ASEAN
• Emerging regional architecture
• A new generation FTA
• A high ambition agreement
Regional Comprehensive
Economic Partnership (RCEP)
(ASEAN + China, Japan, Korea, India,
Australia & NZ)
3.3 billion population
(50% of world
population)
GDP: US$21 trillion
(28% of world’s GDP)
THE BIGGEST FTA
• Market size (16 countries)
• Regional supply chain
• FDI (intra-extra region)
Expanding Regional Integration Offers More Opportunities
13
2 Thailand as the ASEAN Hub
3 Cattle and Food Industry
1 Thailand at a Glance
4 Investment Incentives and BOI Services
Contents
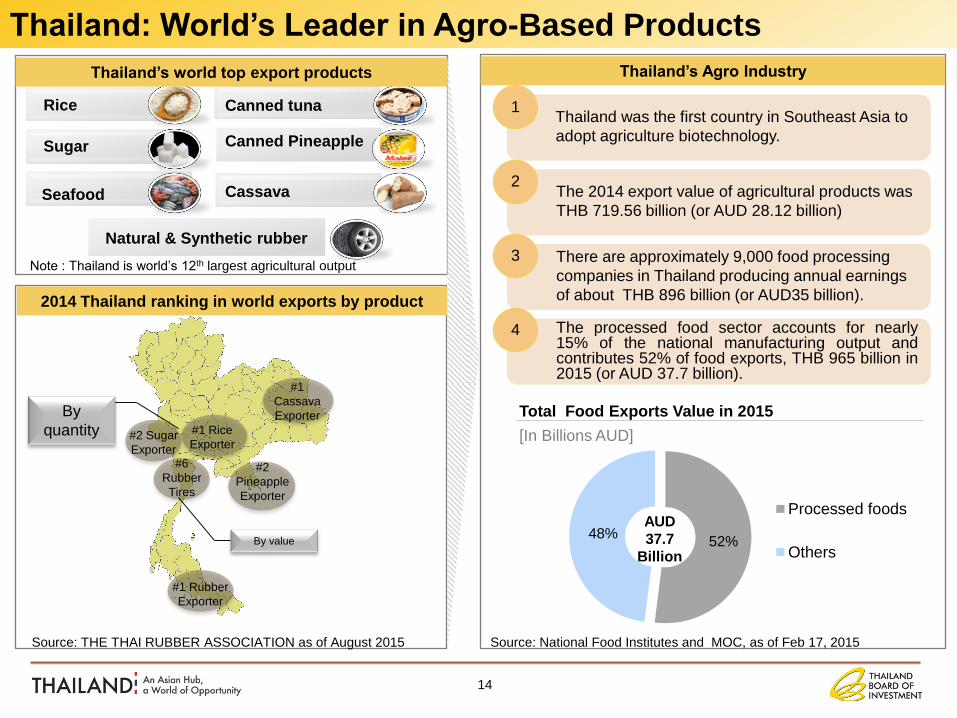
2014 Thailand ranking in world exports by product
#1
Cassava
Exporter
#1 Rubber
Exporter
#1 Rice
Exporter
#2
Pineapple
Exporter
#2 Sugar
Exporter #6
Rubber
Tires
Note : Thailand is world’s 12th largest agricultural output
Sugar
Seafood
Canned tuna
Canned Pineapple
Cassava
Natural & Synthetic rubber
Rice
Thailand’s world top export products
Thailand was the first country in Southeast Asia to
adopt agriculture biotechnology.
The 2014 export value of agricultural products was
THB 719.56 billion (or AUD 28.12 billion)
There are approximately 9,000 food processing
companies in Thailand producing annual earnings
of about THB 896 billion (or AUD35 billion).
52% 48%
Processed foods
Others
1
3
2
The processed food sector accounts for nearly 15% of the national manufacturing output and contributes 52% of food exports, THB 965 billion in 2015 (or AUD 37.7 billion).
4
[In Billions AUD]
Total Food Exports Value in 2015
Thailand’s Agro Industry
AUD
37.7
Billion
Source: National Food Institutes and MOC, as of Feb 17, 2015 Source: THE THAI RUBBER ASSOCIATION as of August 2015
By
quantity
By value
14
Thailand: World’s Leader in Agro-Based Products
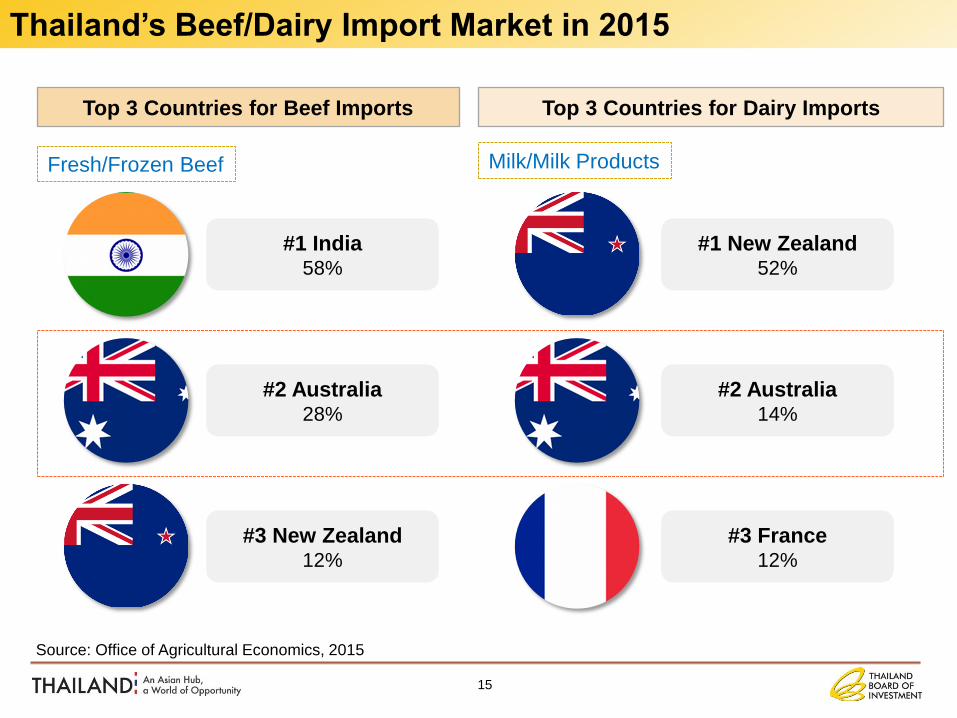
Fresh/Frozen Beef
15
Top 3 Countries for Beef Imports Top 3 Countries for Dairy Imports
Thailand’s Beef/Dairy Import Market in 2015
Source: Office of Agricultural Economics, 2015
Milk/Milk Products
#1 India 58%
#2 Australia 28%
#3 New Zealand 12%
#1 New Zealand 52%
#2 Australia 14%
#3 France 12%
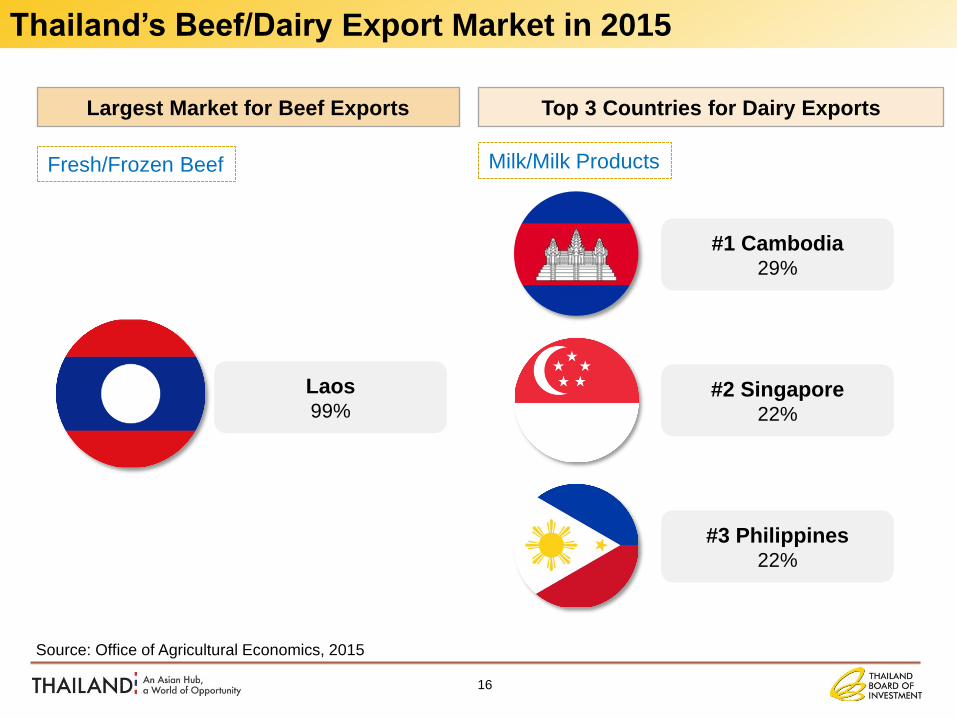
Fresh/Frozen Beef
16
Largest Market for Beef Exports Top 3 Countries for Dairy Exports
Thailand’s Beef/Dairy Export Market in 2015
Source: Office of Agricultural Economics, 2015
Milk/Milk Products
#1 Cambodia 29%
#2 Singapore 22%
#3 Philippines 22%
Laos 99%
17
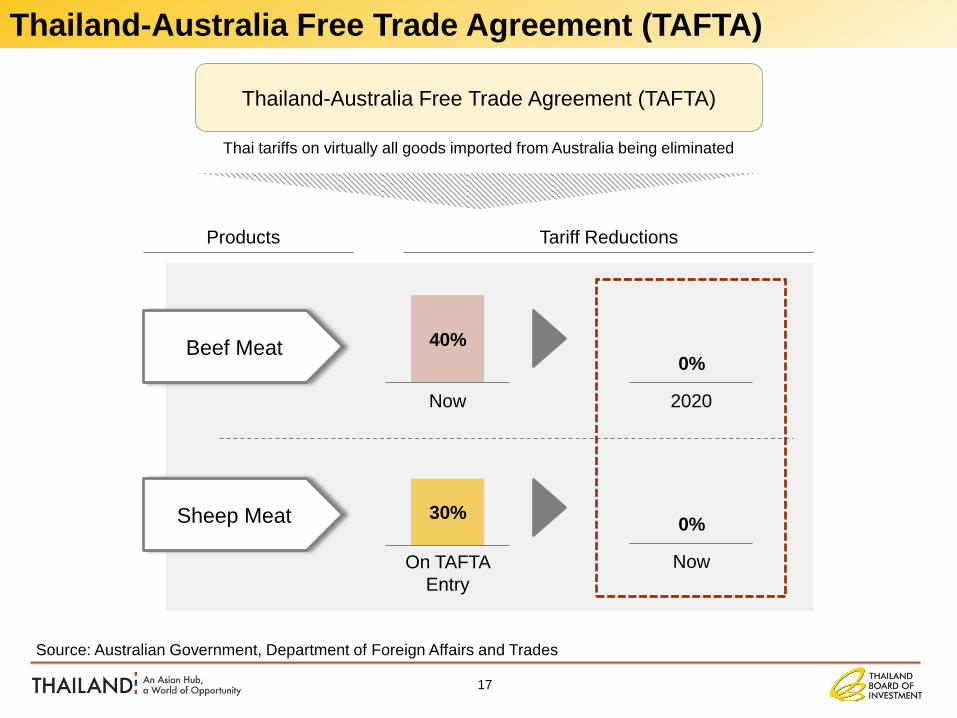
Source: Australian Government, Department of Foreign Affairs and Trades
Thailand-Australia Free Trade Agreement (TAFTA)
Thai tariffs on virtually all goods imported from Australia being eliminated
40%
Now
Beef Meat
2020
0%
Sheep Meat 30%
On TAFTA
Entry
Now
0%
Products Tariff Reductions
Thailand-Australia Free Trade Agreement (TAFTA)

Thailand’s Investment Sector in the Cattle Industry
Source: National Food Institutes, BOI
Slaughtering
Animal Propagation/Husbandry
ex: Beef cattle farming/ Dairy Farming
Plant/Animal Bleeding
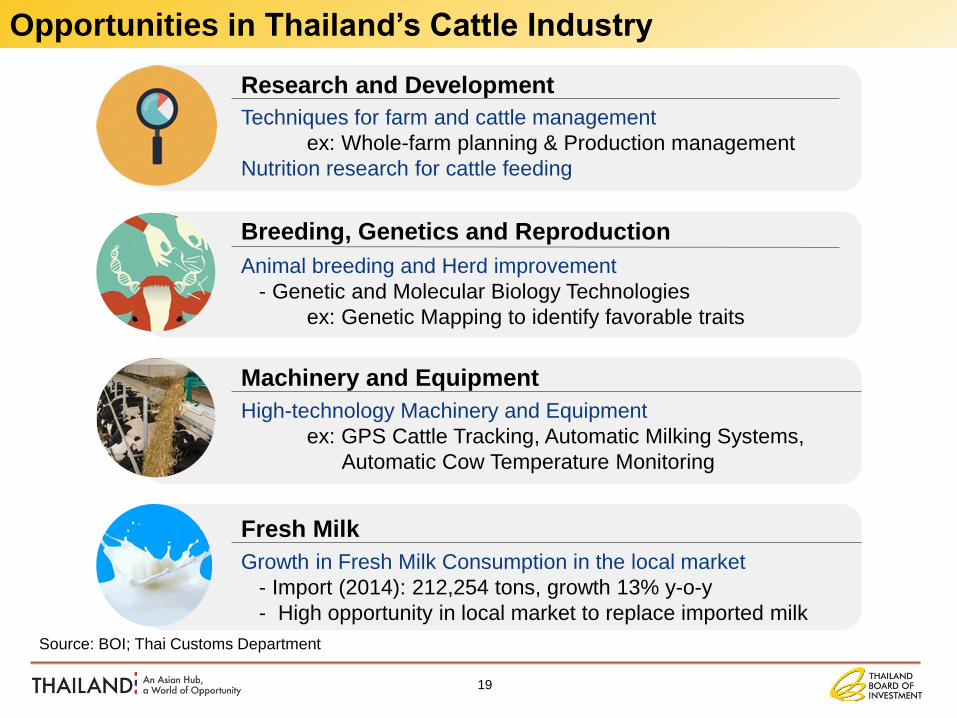
Opportunities in Thailand’s Cattle Industry
Source: BOI; Thai Customs Department
Breeding, Genetics and Reproduction
Animal breeding and Herd improvement
- Genetic and Molecular Biology Technologies
ex: Genetic Mapping to identify favorable traits
Research and Development
Techniques for farm and cattle management
ex: Whole-farm planning & Production management
Nutrition research for cattle feeding
Machinery and Equipment
High-technology Machinery and Equipment
ex: GPS Cattle Tracking, Automatic Milking Systems,
Automatic Cow Temperature Monitoring
Fresh Milk
Growth in Fresh Milk Consumption in the local market
- Import (2014): 212,254 tons, growth 13% y-o-y
- High opportunity in local market to replace imported milk
19
20
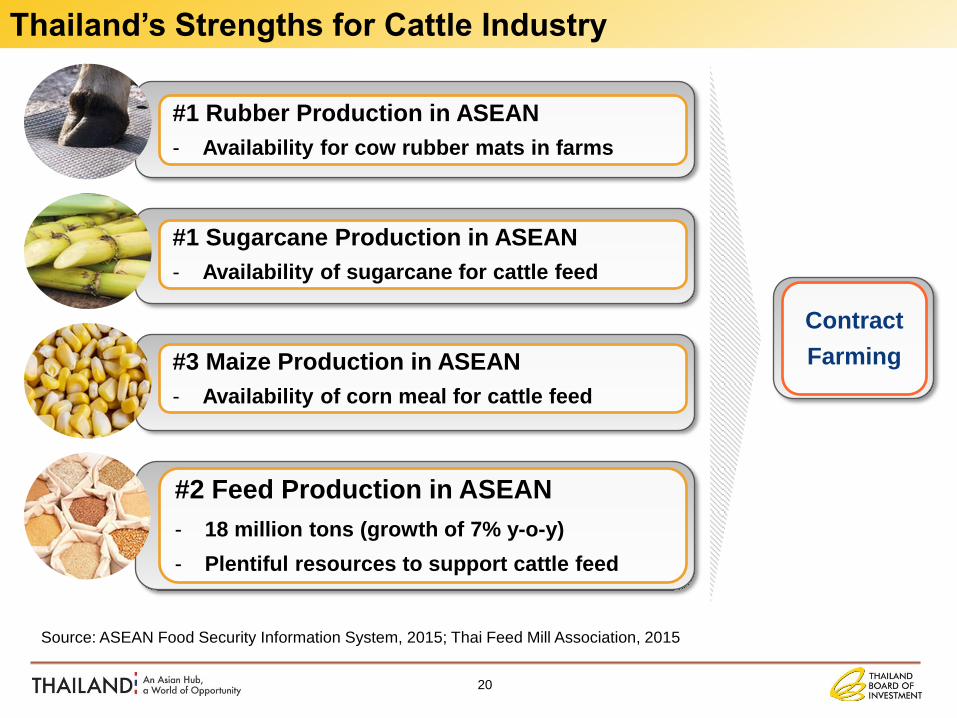
Thailand’s Strengths for Cattle Industry
Source: ASEAN Food Security Information System, 2015; Thai Feed Mill Association, 2015
#3 Maize Production in ASEAN
- Availability of corn meal for cattle feed
#1 Sugarcane Production in ASEAN
- Availability of sugarcane for cattle feed
#1 Rubber Production in ASEAN
- Availability for cow rubber mats in farms
Contract
Farming
#2 Feed Production in ASEAN
- 18 million tons (growth of 7% y-o-y)
- Plentiful resources to support cattle feed
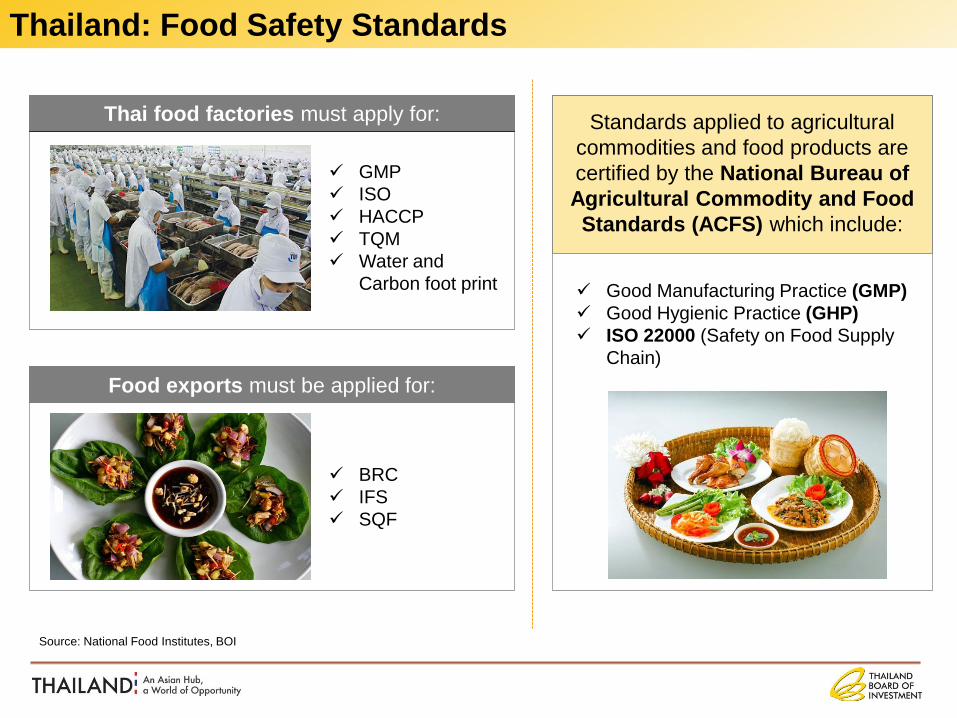
Thailand: Food Safety Standards
Source: National Food Institutes, BOI
Thai food factories must apply for:
GMP
ISO
HACCP
TQM
Water and
Carbon foot print
Food exports must be applied for:
BRC
IFS
SQF
Standards applied to agricultural
commodities and food products are
certified by the National Bureau of
Agricultural Commodity and Food
Standards (ACFS) which include:
Good Manufacturing Practice (GMP)
Good Hygienic Practice (GHP)
ISO 22000 (Safety on Food Supply
Chain)
22
2 Thailand as the ASEAN Hub
3 Cattle and Food Industry
1 Thailand at a Glance
4 Investment Incentives and BOI Services
Contents
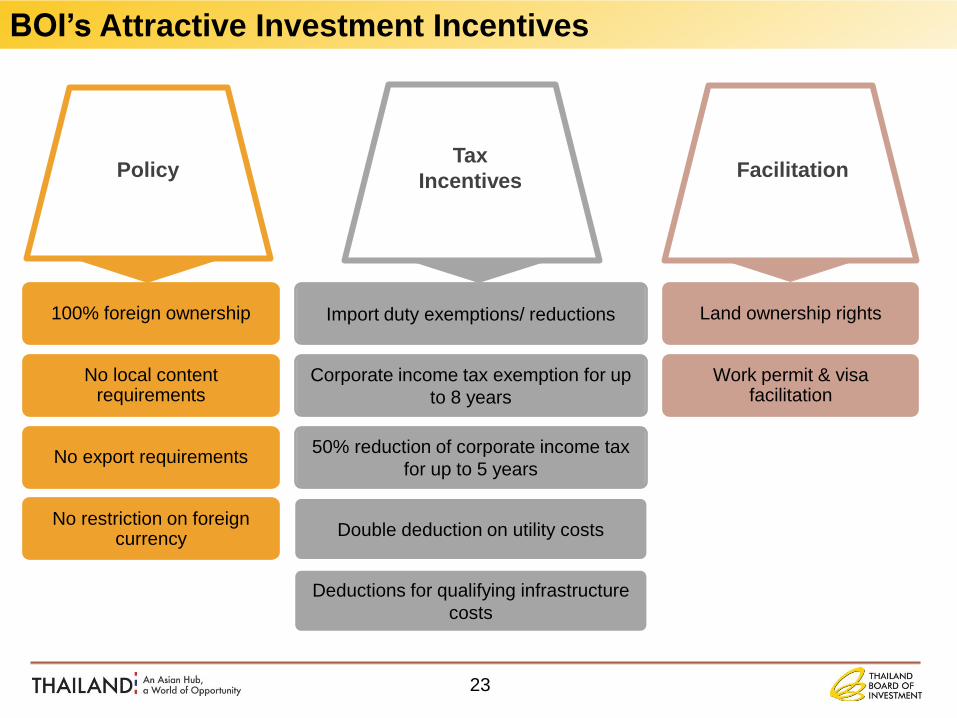
Policy Tax
Incentives Facilitation
100% foreign ownership
No local content requirements
No export requirements
No restriction on foreign currency
Import duty exemptions/ reductions
Corporate income tax exemption for up
to 8 years
50% reduction of corporate income tax
for up to 5 years
Double deduction on utility costs
Deductions for qualifying infrastructure
costs
Land ownership rights
Work permit & visa facilitation
23
BOI’s Attractive Investment Incentives
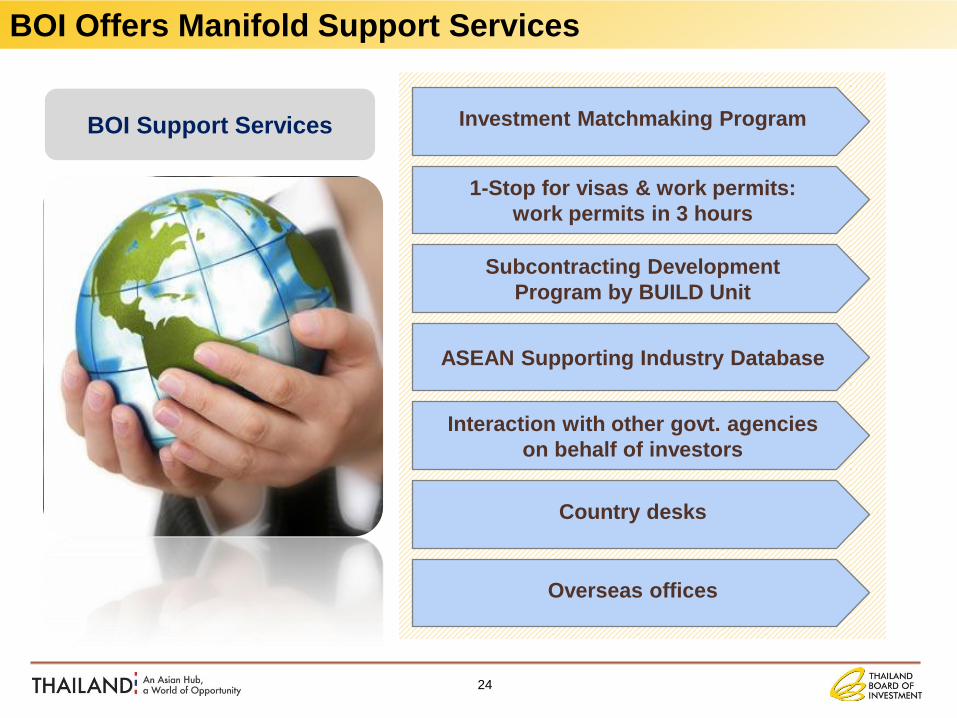
BOI Support Services Investment Matchmaking Program
1-Stop for visas & work permits:
work permits in 3 hours
Subcontracting Development
Program by BUILD Unit
ASEAN Supporting Industry Database
Interaction with other govt. agencies
on behalf of investors
Country desks
Overseas offices
24
BOI Offers Manifold Support Services
25
THAILAND
HEADQUARTER
BEIJING
FRANKFURT
GUANGZHOU
LOS ANGELES
MUMBAI
NEW YORK
OSAKA
TOKYO PARIS
SEOUL
SHANGHAI
STOCKHOLM
TAIPEI
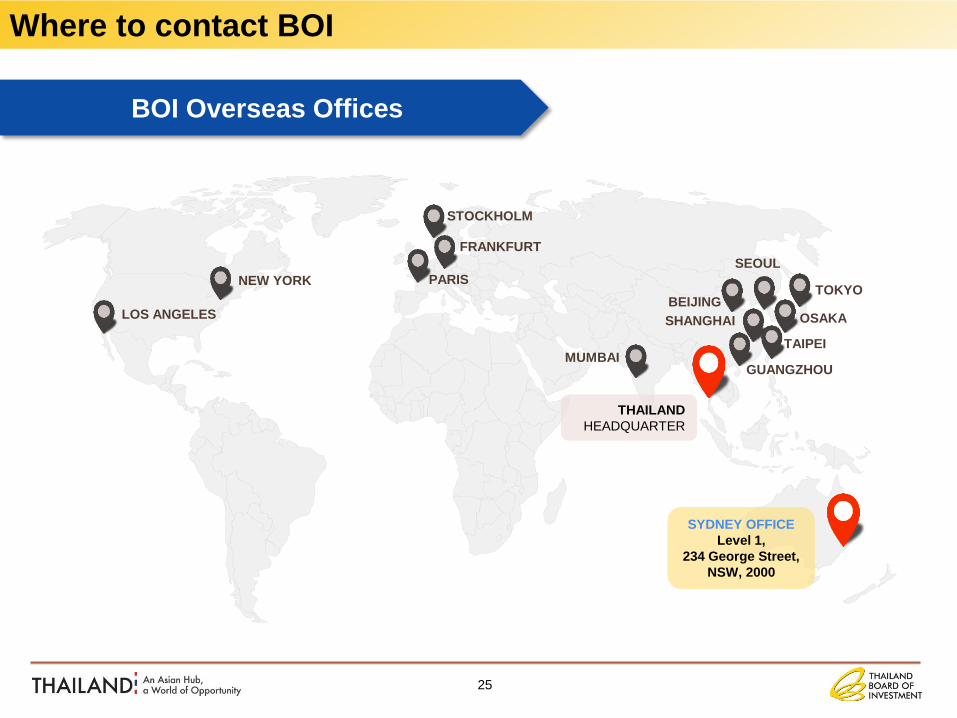
BOI Overseas Offices
Where to contact BOI
SYDNEY OFFICE
Level 1,
234 George Street,
NSW, 2000

Annex
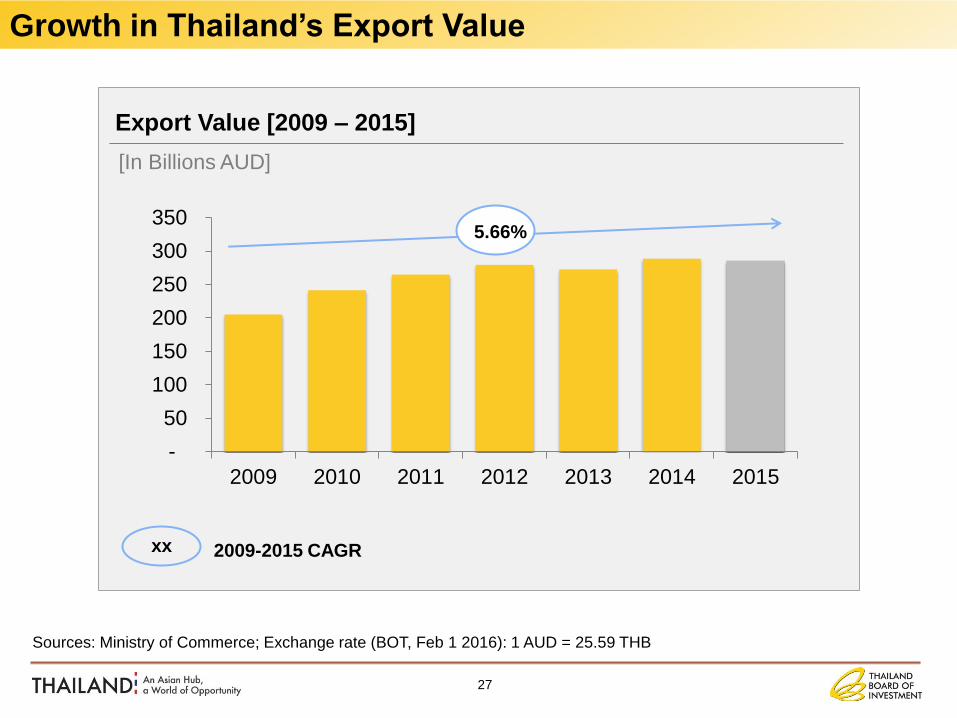
Sources: Ministry of Commerce; Exchange rate (BOT, Feb 1 2016): 1 AUD = 25.59 THB
Export Value [2009 – 2015]
-
50
100
150
200
250
300
350
2009 2010 2011 2012 2013 2014 2015
5.66%
xx 2009-2015 CAGR
27
Growth in Thailand’s Export Value
[In Billions AUD]
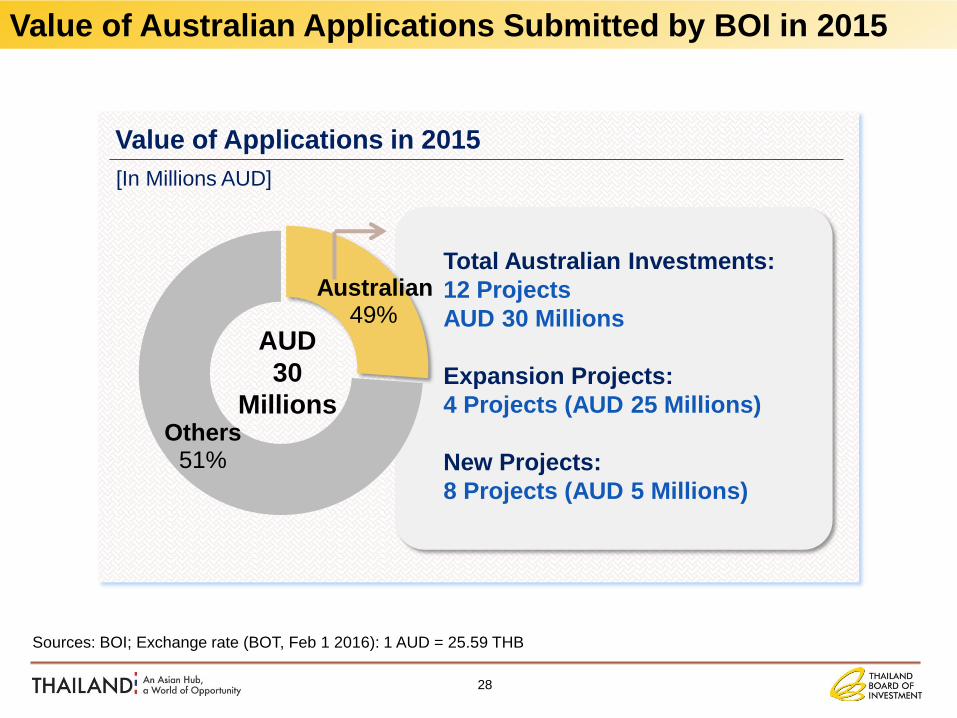
Value of Applications in 2015 [In Millions AUD]
Sources: BOI; Exchange rate (BOT, Feb 1 2016): 1 AUD = 25.59 THB
49%
Others 51%
AUD
30
Millions
28
Value of Australian Applications Submitted by BOI in 2015
Total Australian Investments:
12 Projects
AUD 30 Millions
Expansion Projects:
4 Projects (AUD 25 Millions)
New Projects:
8 Projects (AUD 5 Millions)
Australian
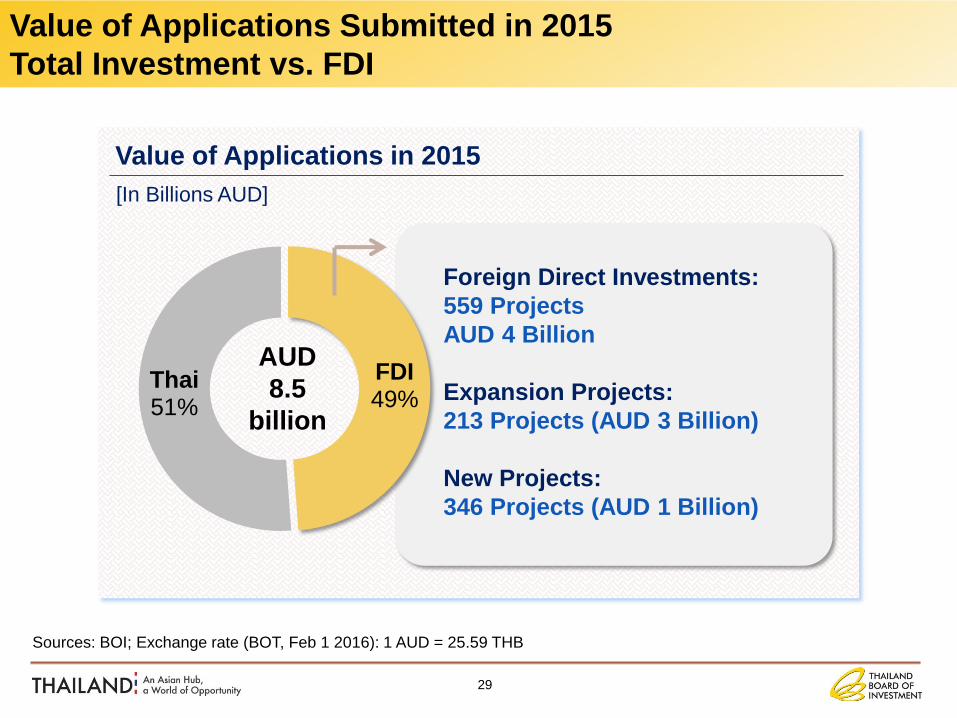
Value of Applications in 2015 [In Billions AUD]
Sources: BOI; Exchange rate (BOT, Feb 1 2016): 1 AUD = 25.59 THB
FDI 49%
Thai 51%
AUD
8.5
billion
29
Value of Applications Submitted in 2015
Total Investment vs. FDI
Foreign Direct Investments:
559 Projects
AUD 4 Billion
Expansion Projects:
213 Projects (AUD 3 Billion)
New Projects:
346 Projects (AUD 1 Billion)
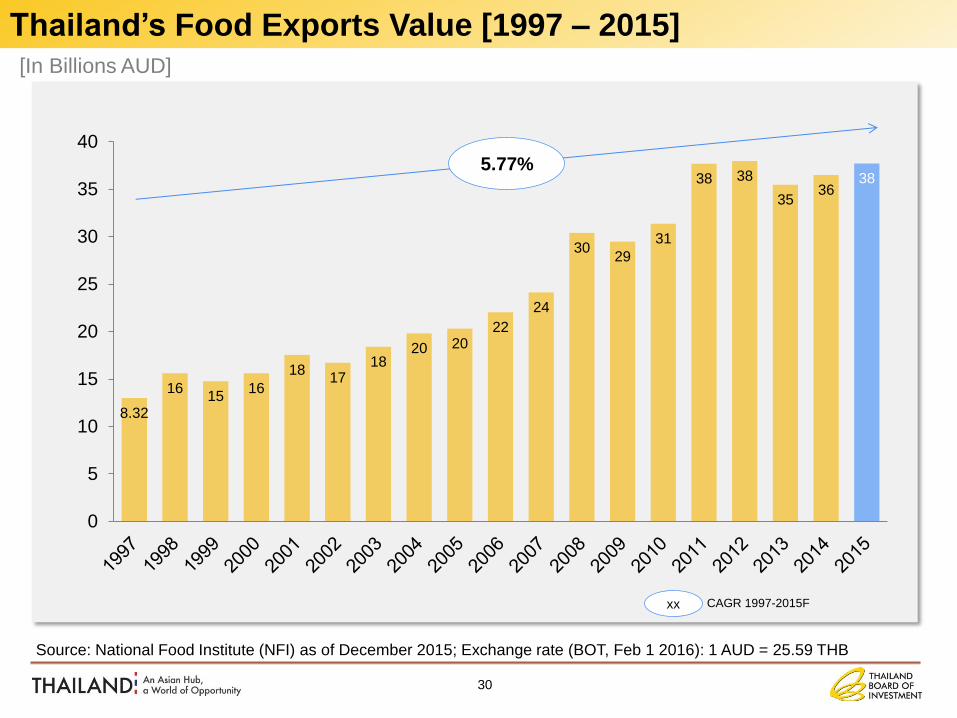
8.32
16 15
16
18 17
18 20 20
22
24
30 29
31
38 38
35 36
38
0
5
10
15
20
25
30
35
40
5.77%
[In Billions AUD]
Source: National Food Institute (NFI) as of December 2015; Exchange rate (BOT, Feb 1 2016): 1 AUD = 25.59 THB
30
CAGR 1997-2015F xx
Thailand’s Food Exports Value [1997 – 2015]

13.8%
12.3%
11.2%
4.0%
3.8% 2.8%
2.7%
39.0%
[In Billions AUD]
Source: National Food Institute (NFI) as of December 2015
31
Indonesia Myanmar Malaysia
Japan
United States
China
United Kingdom
Vietnam
Australia
Hong Kong
Others
AUD
37.7
Billion
3.3% 3.5% 3.6%
Thailand’s Food Export Market in 2015
32
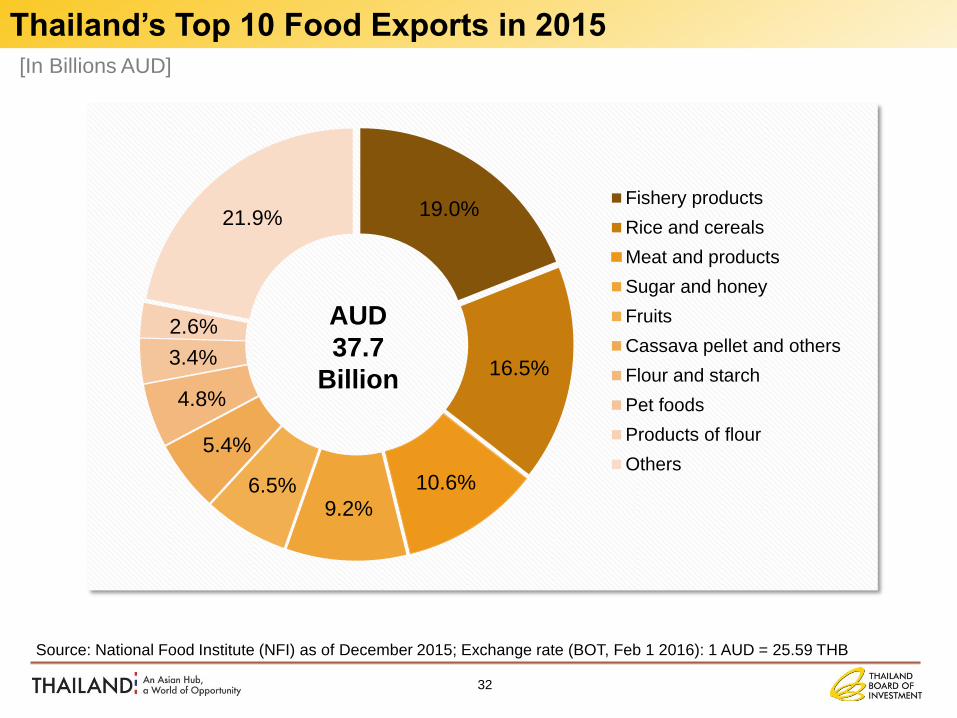
[In Billions AUD]
19.0%
16.5%
10.6%
9.2% 6.5%
5.4%
4.8%
3.4%
2.6%
21.9% Fishery products
Rice and cereals
Meat and products
Sugar and honey
Fruits
Cassava pellet and others
Flour and starch
Pet foods
Products of flour
Others
AUD
37.7
Billion
Source: National Food Institute (NFI) as of December 2015; Exchange rate (BOT, Feb 1 2016): 1 AUD = 25.59 THB
Thailand’s Top 10 Food Exports in 2015
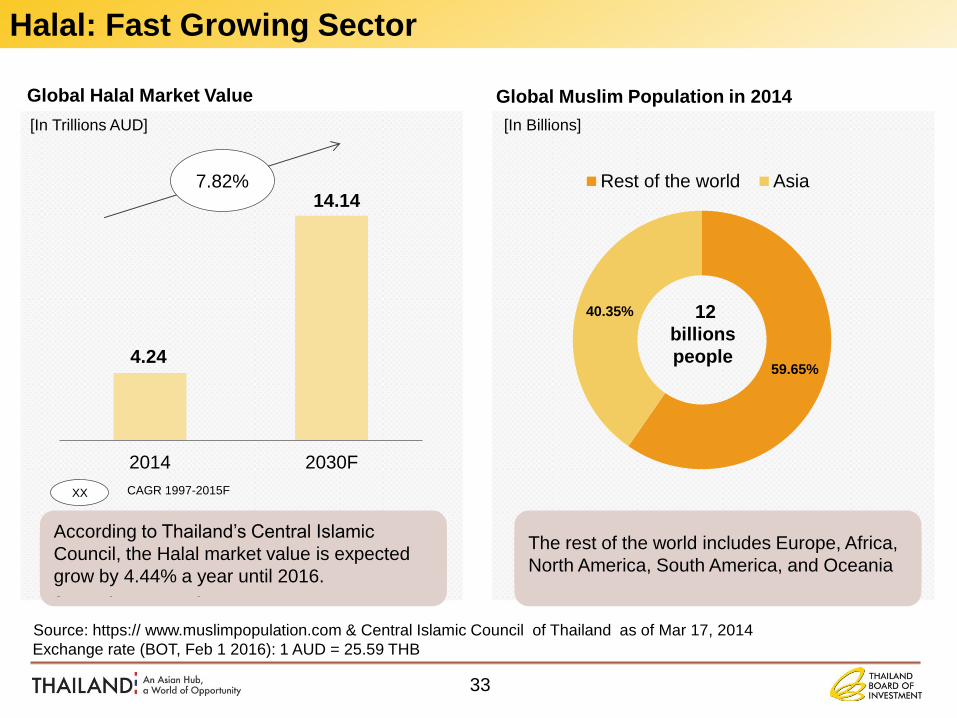
Global Muslim Population in 2014
59.65%
40.35%
Rest of the world Asia
The rest of the world includes Europe, Africa,
North America, South America, and Oceania
12
billions
people
[In Billions]
4.24
14.14
2014 2030F
7.82%
CAGR 1997-2015F
[In Trillions AUD]
According to Thailand’s Central Islamic
Council, the Halal market value is expected
grow by 4.44% a year until 2016.
Source: https:// www.muslimpopulation.com & Central Islamic Council of Thailand as of Mar 17, 2014
Exchange rate (BOT, Feb 1 2016): 1 AUD = 25.59 THB
Global Halal Market Value
XX
33
The rest of the world includes Europe, Africa,
North America, South America, and Oceania
According to Thailand’s Central Islamic
Council, the Halal market value is expected
grow by 4.44% a year until 2016.
Halal: Fast Growing Sector
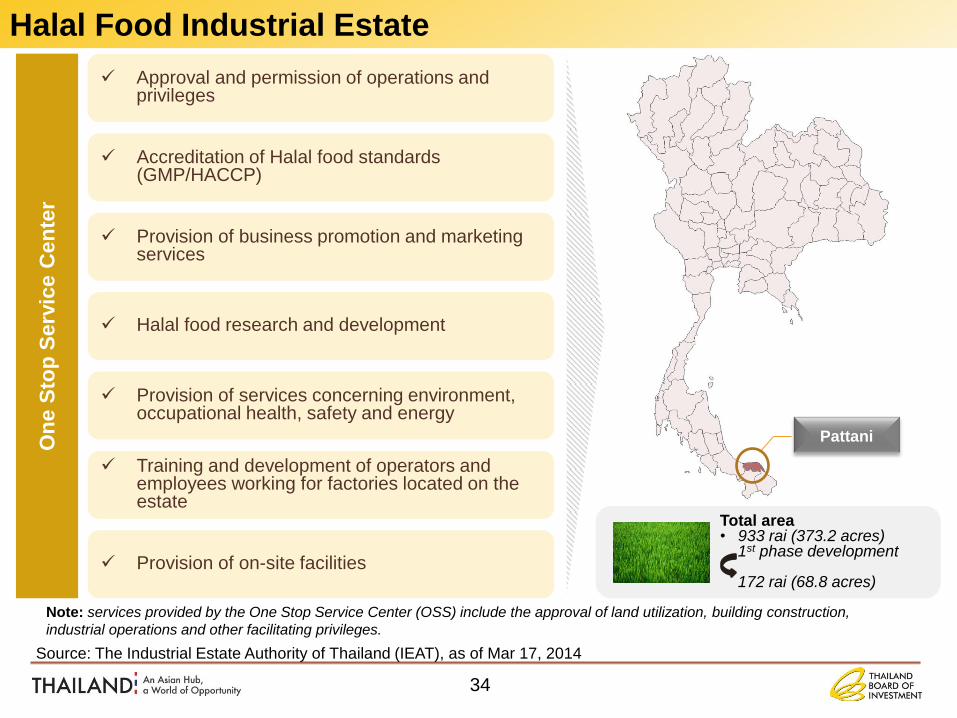
Training and development of operators and employees working for factories located on the estate
Provision of services concerning environment, occupational health, safety and energy
Halal food research and development
Provision of business promotion and marketing services
Accreditation of Halal food standards (GMP/HACCP)
Approval and permission of operations and privileges
Provision of on-site facilities
On
e S
top
Serv
ice C
en
ter
Note: services provided by the One Stop Service Center (OSS) include the approval of land utilization, building construction,
industrial operations and other facilitating privileges.
Source: The Industrial Estate Authority of Thailand (IEAT), as of Mar 17, 2014
Pattani
Total area • 933 rai (373.2 acres) 1st phase development
172 rai (68.8 acres)
34
Halal Food Industrial Estate
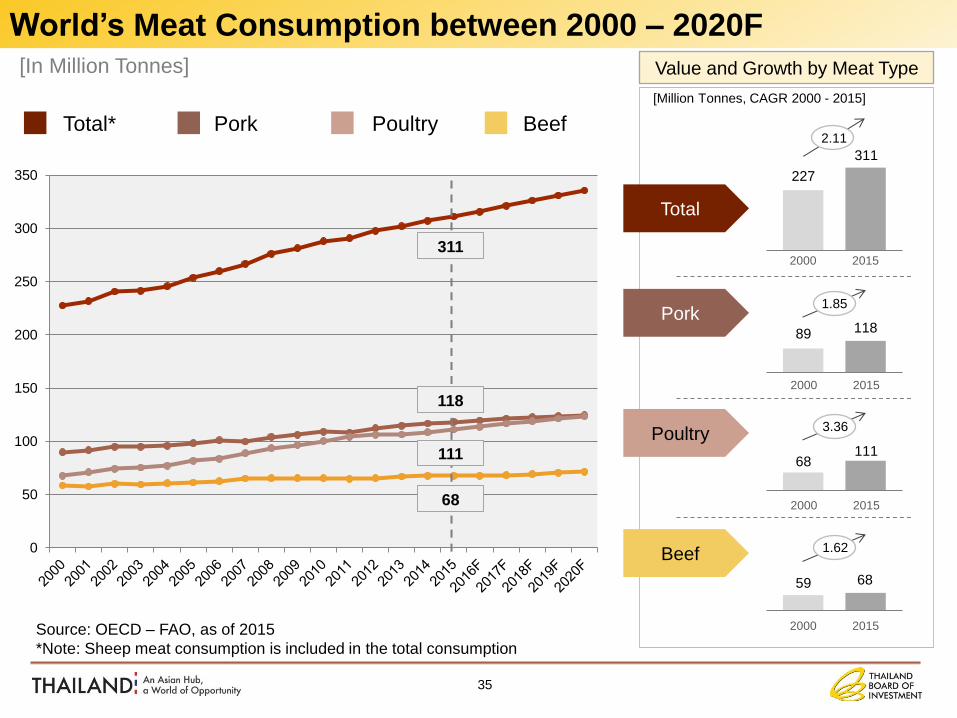
Source: OECD – FAO, as of 2015
*Note: Sheep meat consumption is included in the total consumption
35
Value and Growth by Meat Type
[Million Tonnes, CAGR 2000 - 2015]
[In Million Tonnes]
0
50
100
150
200
250
300
350
311
118
111
68
Beef
Pork
Poultry
Total
68 59
1.62
2000 2015
111 68
3.36
2000 2015
118 89
1.85
2000 2015
311
227
2.11
2000 2015
Total* Beef Poultry Pork
World’s Meat Consumption between 2000 – 2020F
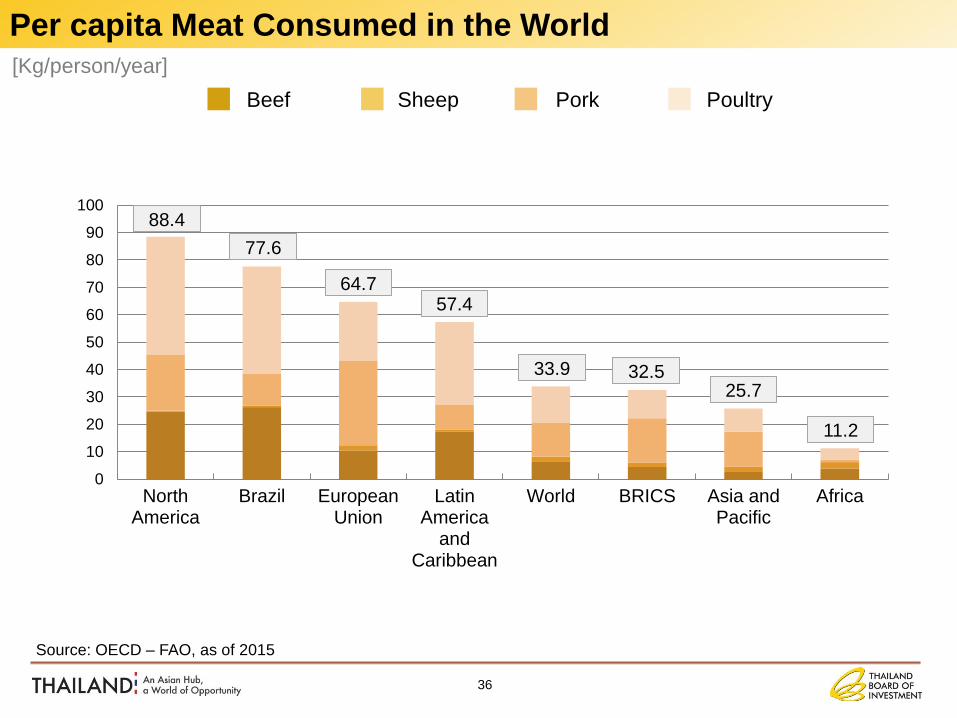
[Kg/person/year]
36
0
10
20
30
40
50
60
70
80
90
100
NorthAmerica
Brazil EuropeanUnion
LatinAmerica
andCaribbean
World BRICS Asia andPacific
Africa
Source: OECD – FAO, as of 2015
88.4
77.6
64.7 57.4
33.9 32.5 25.7
11.2
Beef Poultry Pork Sheep
Per capita Meat Consumed in the World
37
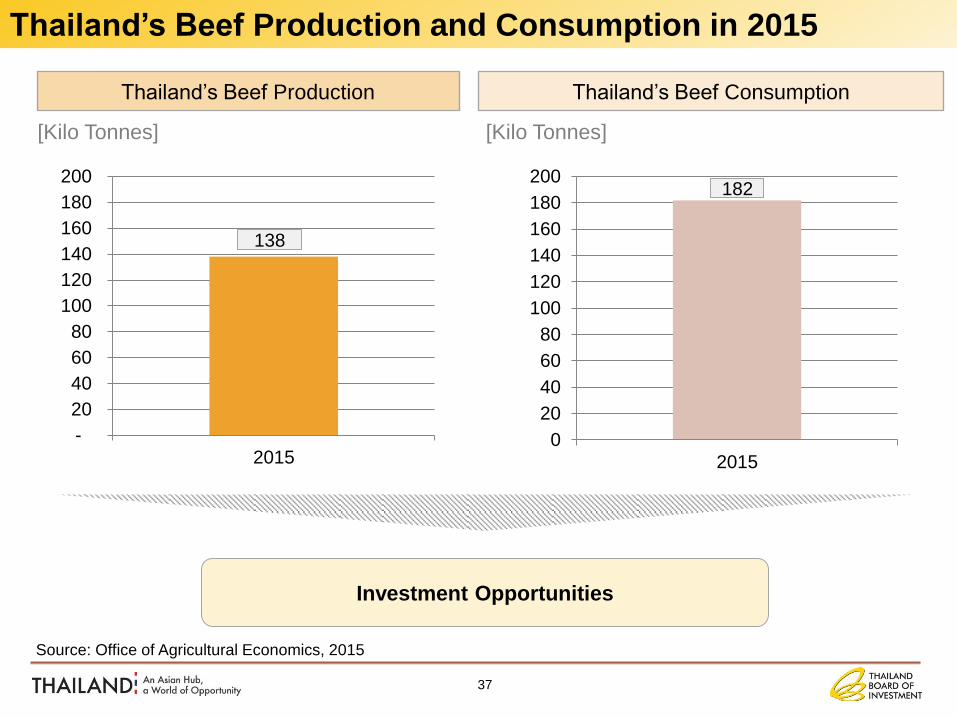
Source: Office of Agricultural Economics, 2015
Thailand’s Beef Production
-
20
40
60
80
100
120
140
160
180
200
2015
138
Thailand’s Beef Consumption
0
20
40
60
80
100
120
140
160
180
200
2015
182
[Kilo Tonnes]
Thailand’s Beef Production and Consumption in 2015
[Kilo Tonnes]
Investment Opportunities
[Million AUD]
38
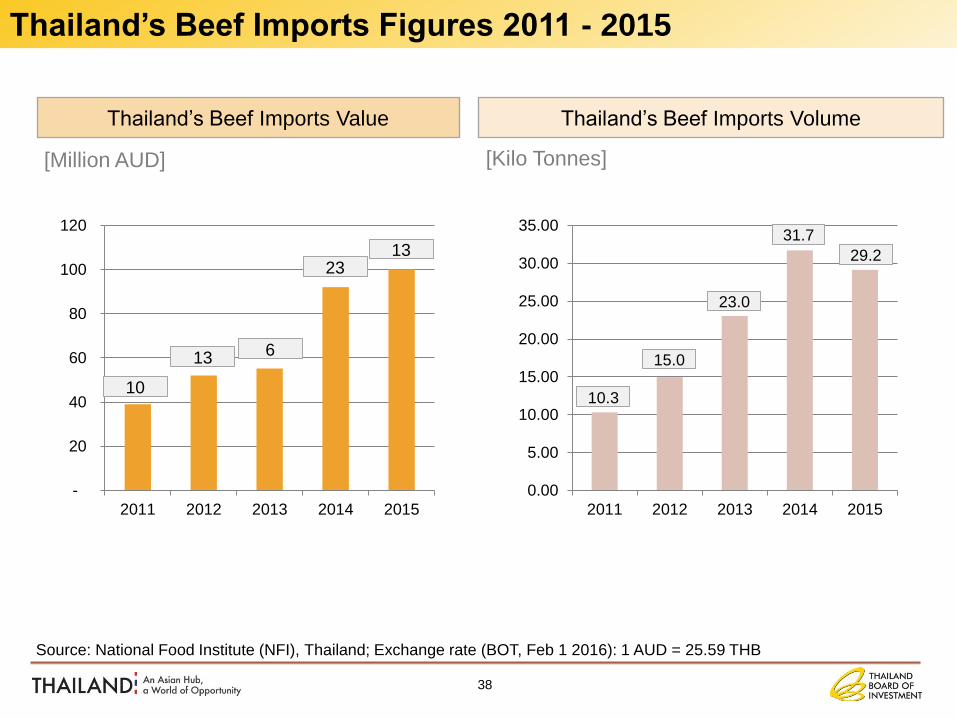
Source: National Food Institute (NFI), Thailand; Exchange rate (BOT, Feb 1 2016): 1 AUD = 25.59 THB
Thailand’s Beef Imports Value
-
20
40
60
80
100
120
2011 2012 2013 2014 2015
10
13 6
23 13
Thailand’s Beef Imports Volume
0.00
5.00
10.00
15.00
20.00
25.00
30.00
35.00
2011 2012 2013 2014 2015
10.3
15.0
23.0
31.7
29.2
[Kilo Tonnes]
Thailand’s Beef Imports Figures 2011 - 2015
[Million AUD]
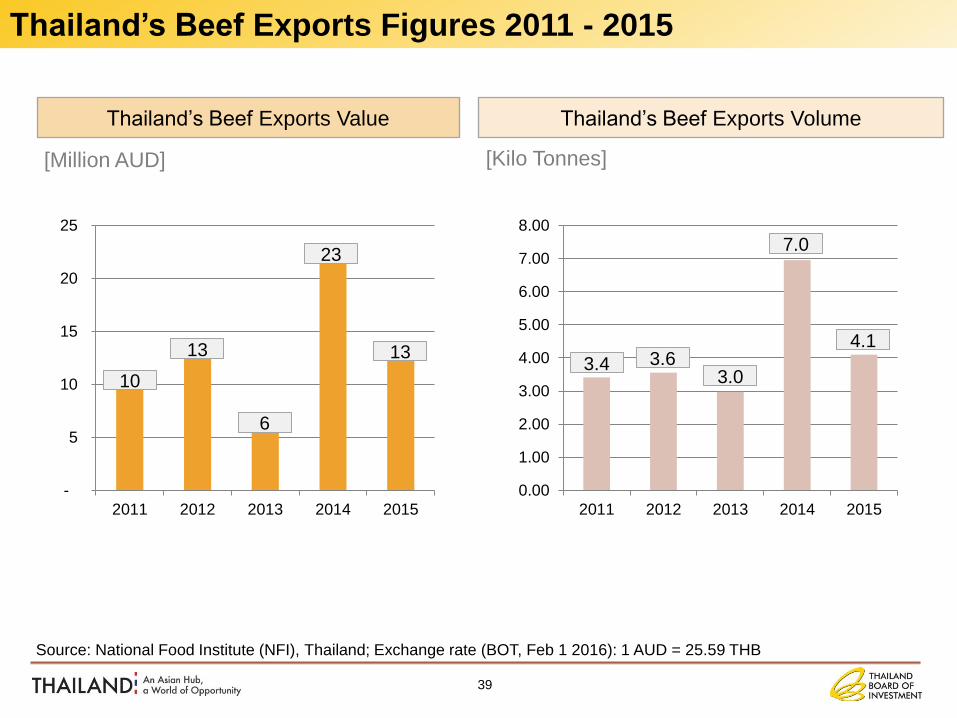
39
Thailand’s Beef Exports Value
-
5
10
15
20
25
2011 2012 2013 2014 2015
10
13
6
23
13
Thailand’s Beef Exports Volume
0.00
1.00
2.00
3.00
4.00
5.00
6.00
7.00
8.00
2011 2012 2013 2014 2015
3.4 3.6 3.0
7.0
4.1
[Kilo Tonnes]
Source: National Food Institute (NFI), Thailand; Exchange rate (BOT, Feb 1 2016): 1 AUD = 25.59 THB
Thailand’s Beef Exports Figures 2011 - 2015
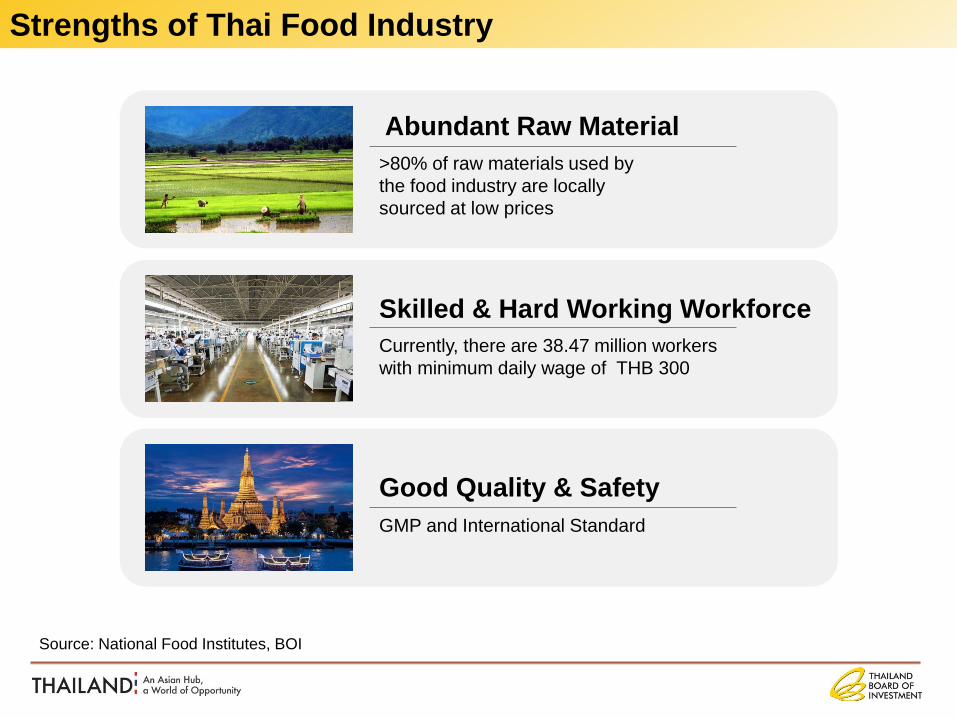
Strengths of Thai Food Industry
Source: National Food Institutes, BOI
Skilled & Hard Working Workforce
Currently, there are 38.47 million workers
with minimum daily wage of THB 300
Abundant Raw Material
>80% of raw materials used by
the food industry are locally
sourced at low prices
Good Quality & Safety
GMP and International Standard
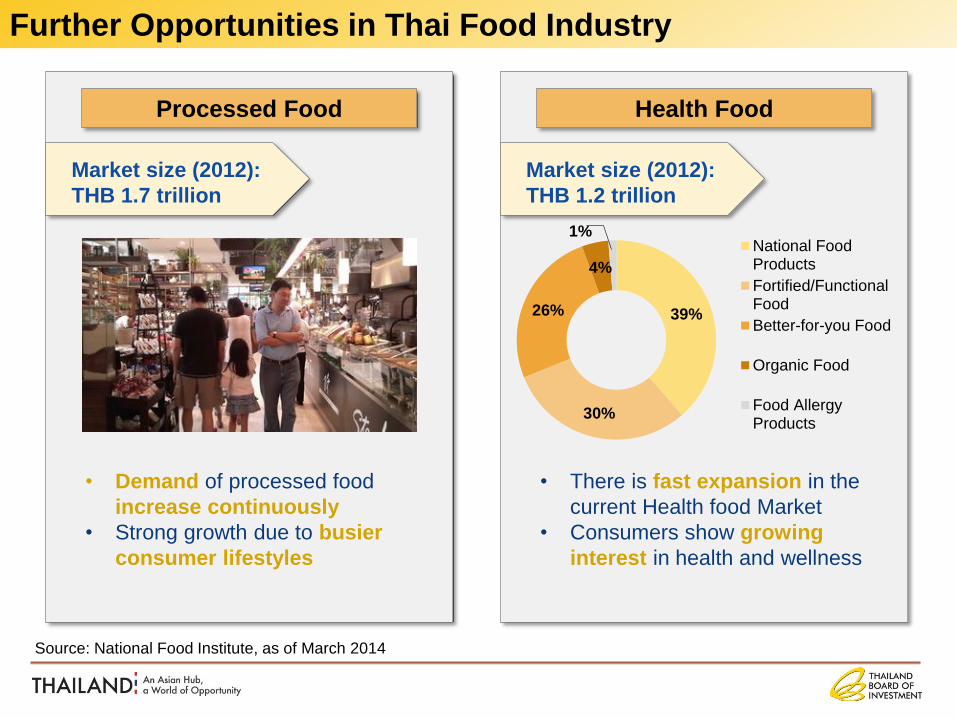
Further Opportunities in Thai Food Industry
Processed Food Health Food
• Demand of processed food
increase continuously
• Strong growth due to busier
consumer lifestyles
Market size (2012):
THB 1.7 trillion
Market size (2012):
THB 1.2 trillion
• There is fast expansion in the
current Health food Market
• Consumers show growing
interest in health and wellness
Source: National Food Institute, as of March 2014
39%
30%
26%
4%
1% National FoodProducts
Fortified/FunctionalFood
Better-for-you Food
Organic Food
Food AllergyProducts
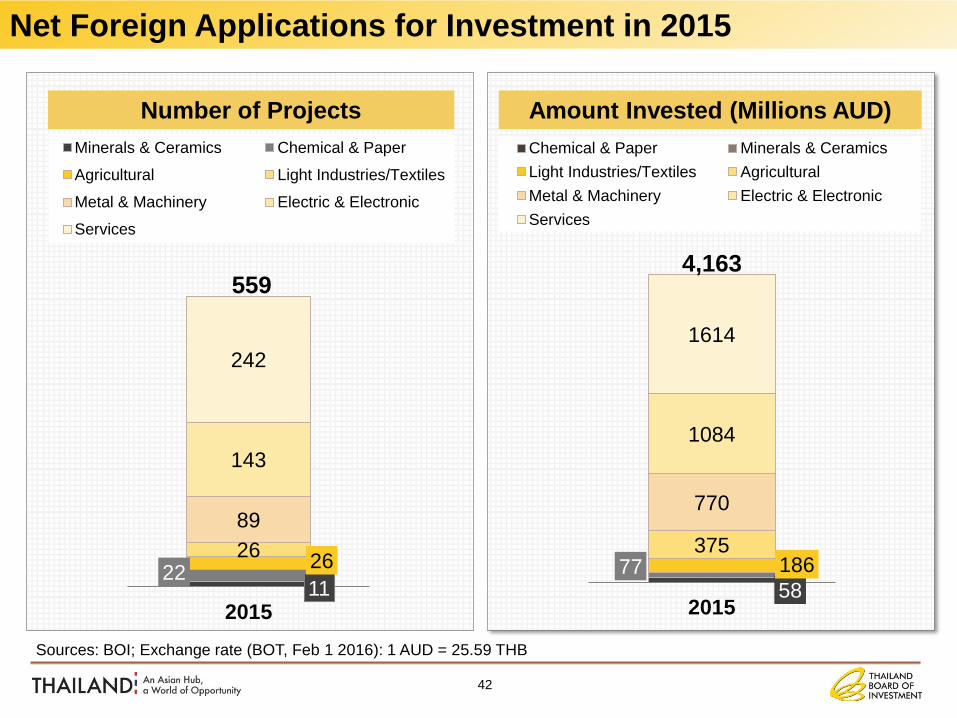
Number of Projects
22 11
26 26
89
143
242
2015
Minerals & Ceramics Chemical & Paper
Agricultural Light Industries/Textiles
Metal & Machinery Electric & Electronic
Services
Amount Invested (Millions AUD)
58 77 186
375
770
1084
1614
2015
Chemical & Paper Minerals & Ceramics
Light Industries/Textiles Agricultural
Metal & Machinery Electric & Electronic
Services
Sources: BOI; Exchange rate (BOT, Feb 1 2016): 1 AUD = 25.59 THB
559 4,163
42
Net Foreign Applications for Investment in 2015
43
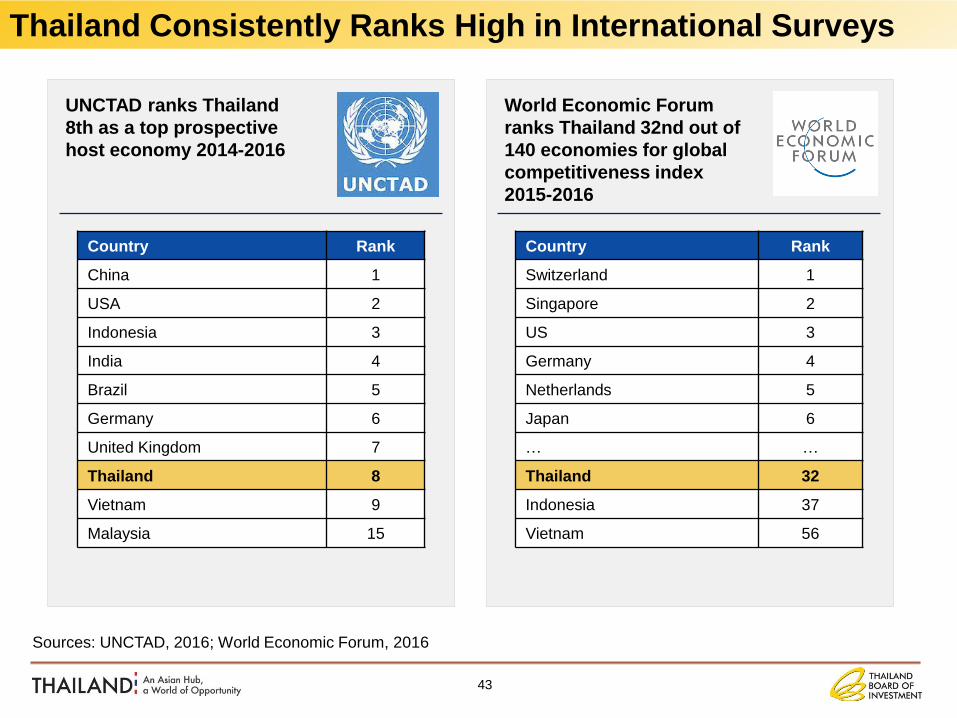
UNCTAD ranks Thailand
8th as a top prospective
host economy 2014-2016
Country Rank
China 1
USA 2
Indonesia 3
India 4
Brazil 5
Germany 6
United Kingdom 7
Thailand 8
Vietnam 9
Malaysia 15
World Economic Forum
ranks Thailand 32nd out of
140 economies for global
competitiveness index
2015-2016
Sources: UNCTAD, 2016; World Economic Forum, 2016
Country Rank
Switzerland 1
Singapore 2
US 3
Germany 4
Netherlands 5
Japan 6
… …
Thailand 32
Indonesia 37
Vietnam 56
Thailand Consistently Ranks High in International Surveys
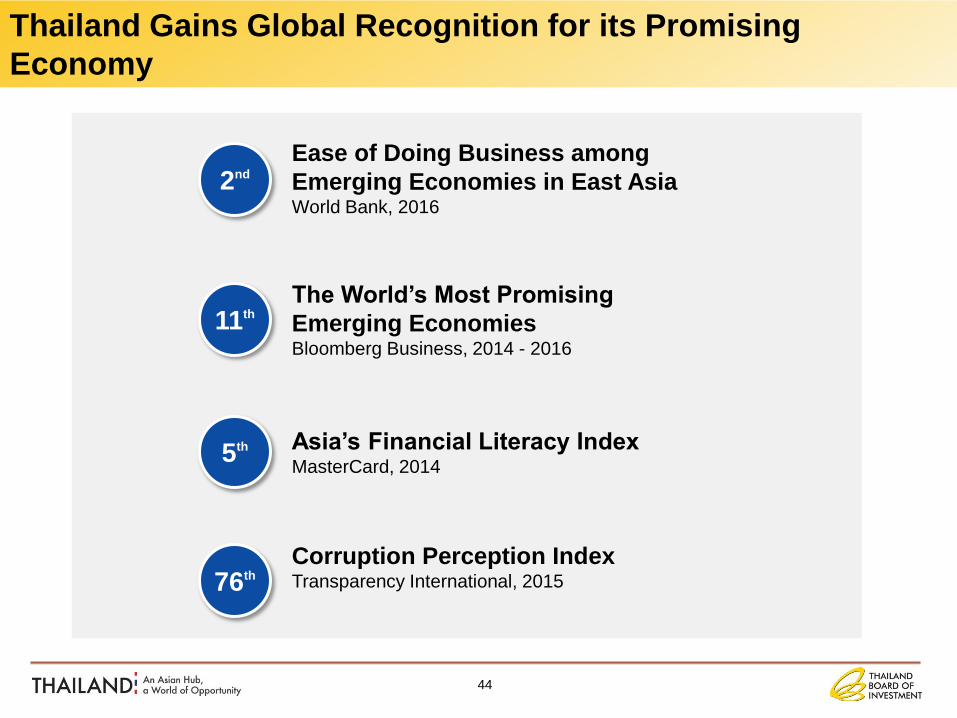
5th Asia’s Financial Literacy Index MasterCard, 2014
The World’s Most Promising
Emerging Economies Bloomberg Business, 2014 - 2016
11th
Ease of Doing Business among
Emerging Economies in East Asia World Bank, 2016
2nd
Corruption Perception Index Transparency International, 2015 76th
44
Thailand Gains Global Recognition for its Promising
Economy
45
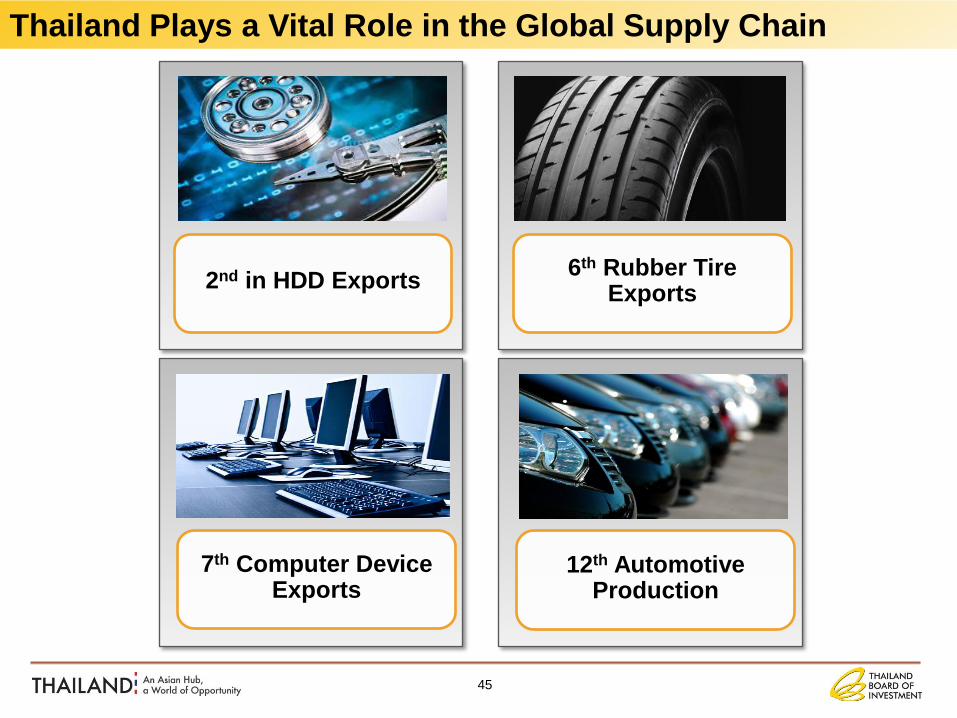
2nd in HDD Exports
Thailand Plays a Vital Role in the Global Supply Chain
6th Rubber Tire Exports
7th Computer Device Exports
12th Automotive Production
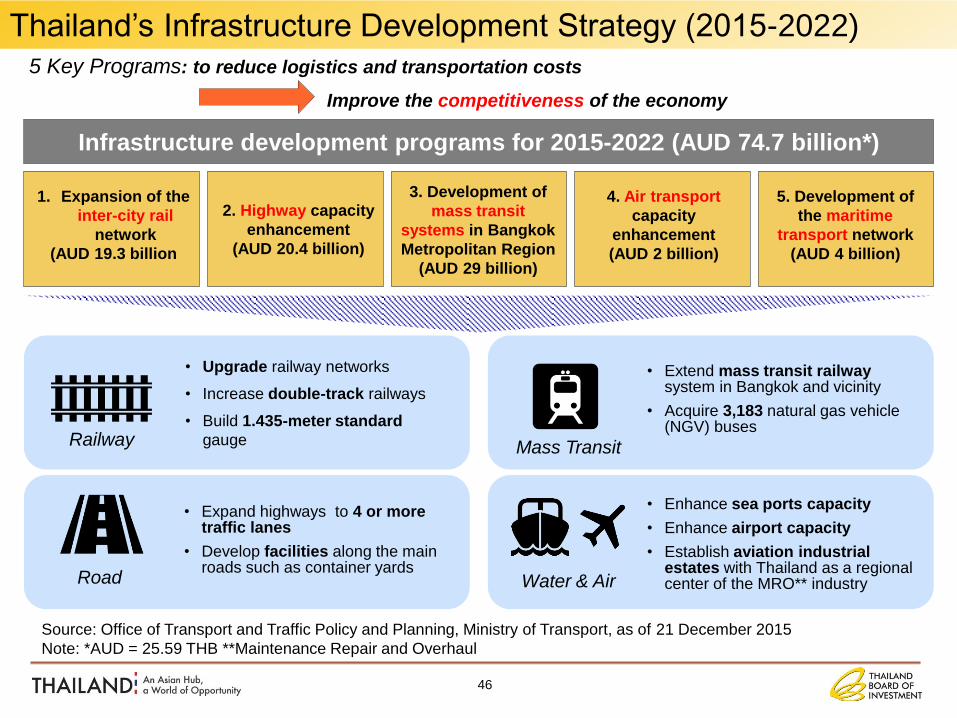
1. Expansion of the
inter-city rail
network
(AUD 19.3 billion
2. Highway capacity
enhancement
(AUD 20.4 billion)
3. Development of
mass transit
systems in Bangkok
Metropolitan Region
(AUD 29 billion)
4. Air transport
capacity
enhancement
(AUD 2 billion)
5. Development of
the maritime
transport network
(AUD 4 billion)
Infrastructure development programs for 2015-2022 (AUD 74.7 billion*)
5 Key Programs: to reduce logistics and transportation costs
Improve the competitiveness of the economy
• Upgrade railway networks
• Increase double-track railways
• Build 1.435-meter standard
gauge
• Expand highways to 4 or more traffic lanes
• Develop facilities along the main roads such as container yards
• Extend mass transit railway system in Bangkok and vicinity
• Acquire 3,183 natural gas vehicle (NGV) buses
• Enhance sea ports capacity
• Enhance airport capacity
• Establish aviation industrial estates with Thailand as a regional center of the MRO** industry
Railway
Road
Mass Transit
Water & Air
Source: Office of Transport and Traffic Policy and Planning, Ministry of Transport, as of 21 December 2015
Note: *AUD = 25.59 THB **Maintenance Repair and Overhaul
Thailand’s Infrastructure Development Strategy (2015-2022)
46
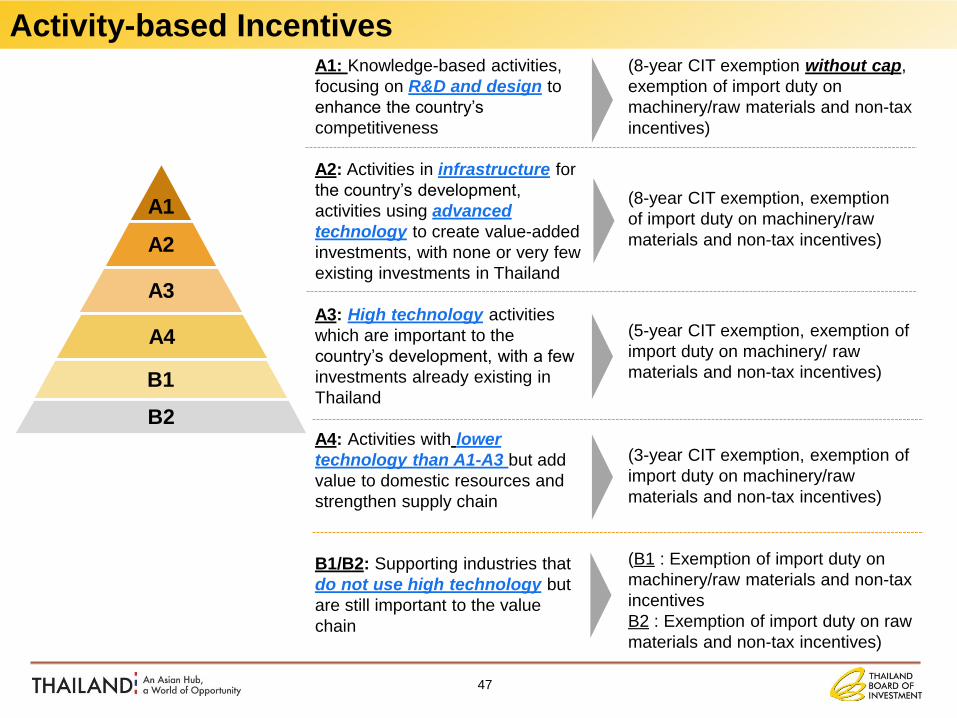
A1
A2
A3
A4
B1
B2
A1: Knowledge-based activities,
focusing on R&D and design to
enhance the country’s
competitiveness
A2: Activities in infrastructure for
the country’s development,
activities using advanced
technology to create value-added
investments, with none or very few
existing investments in Thailand
A3: High technology activities
which are important to the
country’s development, with a few
investments already existing in
Thailand
A4: Activities with lower
technology than A1-A3 but add
value to domestic resources and
strengthen supply chain
B1/B2: Supporting industries that
do not use high technology but
are still important to the value
chain
(8-year CIT exemption without cap,
exemption of import duty on
machinery/raw materials and non-tax
incentives)
(8-year CIT exemption, exemption
of import duty on machinery/raw
materials and non-tax incentives)
(5-year CIT exemption, exemption of
import duty on machinery/ raw
materials and non-tax incentives)
(3-year CIT exemption, exemption of
import duty on machinery/raw
materials and non-tax incentives)
(B1 : Exemption of import duty on
machinery/raw materials and non-tax
incentives
B2 : Exemption of import duty on raw
materials and non-tax incentives)
47
Activity-based Incentives
A1
A2
A3
A4
B1
B2
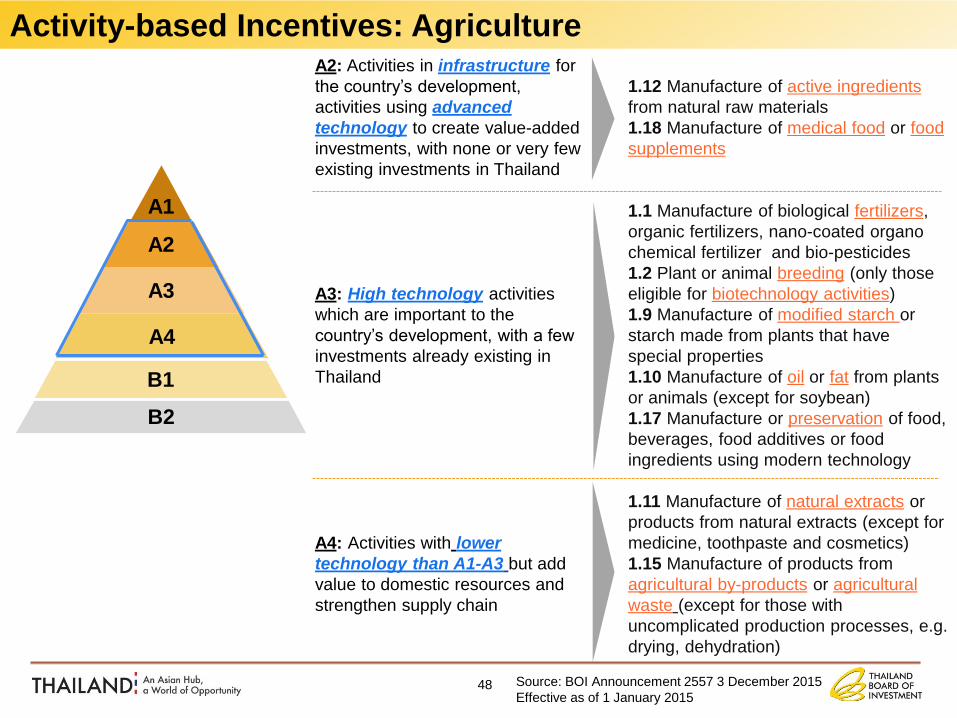
A2: Activities in infrastructure for
the country’s development,
activities using advanced
technology to create value-added
investments, with none or very few
existing investments in Thailand
A3: High technology activities
which are important to the
country’s development, with a few
investments already existing in
Thailand
A4: Activities with lower
technology than A1-A3 but add
value to domestic resources and
strengthen supply chain
1.12 Manufacture of active ingredients
from natural raw materials
1.18 Manufacture of medical food or food
supplements
1.1 Manufacture of biological fertilizers,
organic fertilizers, nano-coated organo
chemical fertilizer and bio-pesticides
1.2 Plant or animal breeding (only those
eligible for biotechnology activities)
1.9 Manufacture of modified starch or
starch made from plants that have
special properties
1.10 Manufacture of oil or fat from plants
or animals (except for soybean)
1.17 Manufacture or preservation of food,
beverages, food additives or food
ingredients using modern technology
1.11 Manufacture of natural extracts or
products from natural extracts (except for
medicine, toothpaste and cosmetics)
1.15 Manufacture of products from
agricultural by-products or agricultural
waste (except for those with
uncomplicated production processes, e.g.
drying, dehydration)
Source: BOI Announcement 2557 3 December 2015
Effective as of 1 January 2015
Activity-based Incentives: Agriculture
48