investing in gender equality: looking...
TRANSCRIPT

16
275
Mayra Buvinic, Trine Lunde, and
Nistha Sinha
Investing in Gender Equality: Looking Ahead
The realities of the world after the 2008–09 global fi nancial crisis call for
greater attention to gender, both to address the vulnerability of countries
to global shocks and to reach growth and poverty reduction goals. Invest-
ments in girls and women need to be scaled up substantially in response
to the recent crisis and, looking ahead, to alleviate demographic stresses
and harness demographic opportunities for growth. This is because the
fate of women and girls, especially in low-income countries and low-
income households, is closely linked to the economic prospects of these
countries and these households.
The Business Case for Gender Equality
Gender equality, embedded in the behavior of the family, the market,
and society, affects prospects for poverty reduction and growth by stim-
ulating productivity and earnings and improving child development
outcomes (fi gure 16.1). In particular, the added advantage of increased
The authors are grateful to Ursula Casabonne for undertaking the analysis of demo-
graphic trends presented in this chapter.

276 The Day after Tomorrow
gender equality in the intergenerational transmission of wealth, through
its effect on child well-being (the pathway depicted on the right in fi gure
16.1), is a potentially signifi cant policy lever to minimize the long-term
negative consequences of the crisis on human development.
Impact of Food, Fuel, and Financial Crises
The impacts of the food, fuel, and fi nancial crises at the end of the 1990s
have highlighted the vulnerability of developing countries to global
shocks and their gender dimensions—the latter especially in relation-
ship to the labor market, agricultural production, and human develop-
ment outcomes.
In the labor market, where women’s participation is below that of men
in virtually all developing countries and is concentrated in specifi c sec-
tors, economywide shocks affect their labor force participation in spe-
cifi c ways. Evidence shows that during crises, particularly in vulnerable
households where the main wage earner has lost a job or faces reduced
Figure 16.1 Women’s Earnings, Children’s Well-being, and Aggregate Poverty Reduction
and Economic Growth—the Gender Pathways
increased women’s labor force participation,productivity, and earnings
future poverty reduction and economicgrowth
current poverty reduction andeconomic growth
improved children’s well-being
increased gender equality in households, markets, and society
women have better accessto markets
women have bettereducation and health
better health andeducational attainmentand greater productivity
as adults
differentialsavings rates
income and consumptionexpenditure
mother has greater control overdecision making in household
Source: World Bank 2007a.

Investing in Gender Equality: Looking Ahead 277
earnings, women will look for work to maintain household consumption
(Sabarwal, Sinha, and Buvinic 2009). At the same time, lower aggregate
demand also affects jobs and earnings of self-employed women in the
informal sector. And employment losses in export sectors directly affected
by lagging global demand can especially hurt women, who often make
up a large proportion of the workforce in export manufacturing (as in
Bangladesh, Cambodia, Nicaragua, and the Philippines) and high-value
agricultural exports (as in Ecuador, Thailand, and Uganda).
The food and fuel crises and the opportunities brought about by the
growing markets for tropical high-value produce have encouraged
renewed attention to agriculture, food security, and rural development
and to the role of female farmers. In many low-income countries, par-
ticularly in Sub-Saharan Africa, agriculture is the most important sector
as a share of gross domestic product (GDP) and employment, elevating
the importance of broad-based growth in agricultural incomes for stim-
ulating economic growth. In many of these countries, women make up
60 to 80 percent of the workforce in agriculture and have a large role in
food production. Yet, they continue to have less access to land, fertilizers,
seeds, credit, and extension services than do men. Furthermore, women’s
access to output markets and profi table cash crops and their control over
household resources tend to be constrained, affecting productivity and
effi ciency in the agricultural sector (World Bank 2007b). More equitable
access for women to economic opportunities and resources would make
agriculture a more effi cient vehicle for promoting shared economic
growth, reducing poverty, and improving food security.
Crises also affect human development outcomes, especially the sur-
vival of infant girls. Friedman and Schady (2009) estimate that the
growth slowdown in 2009 will result in 28,000 to 49,000 excess deaths in
Sub-Saharan Africa, most of them infant girls. An analysis of 59 low-
income countries estimates that a 1 percent drop in per capita GDP
raises infant mortality by 0.27 deaths per 1,000 births for boys, but dou-
ble that (0.53) for girls (Baird, Friedman, and Schady 2007). An analysis
by Buvinic (2009) of the progress of countries toward the Millennium
Development Goals suggests that girls in poor households in countries
with high child mortality rates or low female schooling rates are espe-
cially vulnerable to the effects of the global economic and food crises.

278 The Day after Tomorrow
Their situation is most precarious in the 15 countries, mainly in Africa,
that are affected by high child mortality rates, low female schooling rates,
and decelerating growth (fi gure 16.2).1
Crisis Priorities
If left unaddressed, these gender-specifi c consequences of crises will
contribute to current poverty and imperil future development. Fortu-
nately, policy responses (summarized in table 16.1), which build on the
role of women as economic agents and their preference for investing
Figure 16.2 Impact of the Crises: Countries’ Progress toward the Millennium
Development Goals
Sources: For decelerating growth: growth estimates based on the International Monetary Fund World Economic Outlook
database 2009 projections and on World Bank staff estimates and data from the World Development Indicators
database 2009; for child mortality rates and schooling, WDI 2009.
Note: Countries with high infant mortality rates are those in the highest quartile of the distribution of under-5 mortality
rates (per 1,000 live births) for 151 developing countries in 2007. Countries with low female schooling rates are those in
the lowest quartile of the distribution of the ratio of girls to boys in primary and secondary enrollment for 131 develop-
ing countries for the latest available data between 2004 and 2007.
* Lowest performance in child mortality measured by dividing 151 developing countries in quartiles based on under-5 mor-
tality rate (per 1,000) in 2007.
** Lowest performance in gender parity in schooling measured by dividing 131 developing countries in quartiles based on
ratio of girls to boys in primary and secondary enrollment (percent) for the latest year between 2004 and 2007.
decelerating growth
Dominican
ChinaArmenia
Azerbaijan
MaliBelarus
Congo, Dem. Rep.Iran, Islamic Rep.Bhutan
Latvia
Vietnam Comoros
Pakistan
Ghana Congo, Rep.
Slovak Republic Turkmenistan India
Guatemala
Sudan Togo
Morocco
Timor-Leste
Turkey
Eritrea Nepal
Iraq Saudi Arabia
Lao PDR
lowest performance**
in gender parity in
schooling
highest risklowest performance*
in child mortality
Swaziland
Costa Rica Malaysia Trinidad and Tobago
Croatia Mexico Nicaragua
Bangladesh Ecuador Mongolia Thailand Angola Guinea−Bissau
Bosnia and Herzegovina Egypt, Arab Rep. Namibia Ukraine Central African Republic Liberia
Brazil Gabon Panama Mauritania Myanmar
Albania Bulgaria Georgia Paraguay Rwanda Tanzania
Argentina Chile Haiti Philippines Senegal Zambia Malawi
MalawiEl Salvador
São Tomé and Principe
Madagascar
Cambodia
Botswana
Colombia
Costa Rica
Croatia
Lesotho
Libya
Uruguay
Macedonia, FYR
Republic Moldova Venezuela
Honduras Poland
Hungary Romania
Indonesia Russian Federation
Tunisia
Jamaica
Jordan
Kazakhstan
Uzbekistan Tajikistan
Equatorial Guinea
Afghanistan
Burkina Faso Kenya
Chad
Sierra Leone
Ethiopia
Mozambique
Gambia, The Nigeria
Niger
Guinea
Djibouti
Cameroon
Burundi
Benin
Uganda
Somalia
Côte d'lvoire

Investing in Gender Equality: Looking Ahead 279
resources in child well-being, are promising and can go a long way
toward mitigating these negative effects.
Harnessing of Demographic Trends for Development in a Postcrisis World
Over the longer term, demographic trends help countries prioritize
gender mainstreaming in sectors likely to have the greatest impact on
development effectiveness and poverty reduction. Demographic pro-
cesses affect the share of the working-age population and the fi scal space
(both in total fi scal resources and priorities) and, therefore, infl uence
Table 16.1 Priorities for Crisis-Response Activities
Impact area of crisis Key issues Priority investments
Labor markets • Women in the informal sector,
particularly the self-employed,
lose jobs or face a decline in
earnings.
• Men lose jobs or their earnings
fall; women not previously in
the labor force search for jobs
to maintain household
consumption.
• Sectors that are large employers
of women, such as export
manufacturing, lay off
workers or reduce salaries.
• Public works programs are
designed to reach women
seeking jobs (offering
appropriate work and
facilities such as child care).
• Cash transfer programs and
other safety nets maximize
impact of cash transfer
programs by channeling
resources through mothers.
• Access to credit and savings
for women.
Human development outcomes
• Families cut back on food
consumed by mothers and
children; likely increase in
infant mortality.
• Child labor increases.
• Investments in children’s (male
and female) education fall.
• Nutritional supplementation
and feeding programs are for
mothers and children.
• Cash transfer programs and
other safety nets maximize
impact of cash transfer
programs by channeling
resources through mothers.
Agricultural production • Farmers, especially women
farmers, face reduced access
to inputs.
• Fertilizer and seed distribu-
tion programs are designed to
ensure women farmers’
access.
• Better access for women
farmers to rural services and
fi nance, training, and markets
is crucial for gender equality.
Source: Authors’ compilation.

280 The Day after Tomorrow
the prospects of countries for poverty reduction and economic growth.
Demographic stresses caused by high fertility rates or high young adult
mortality rates can be eased by investments in gender equality. And
investments to expand women’s ability to earn and control income can
strengthen prospects for gains when demographic conditions improve
(Buvinic, Das Gupta, and Casabonne 2009).
Trends in fertility and mortality rates are refl ected in four demo-
graphic scenarios: demographic explosion (countries with a high fertility
rate and more than 40 percent of the population below age 20 and, thus,
with high youth dependency ratios); demographic transition (countries
where a declining fertility rate has led to a high proportion of working-
age adults relative to children and the elderly); demographic implosion
(countries where the population is aging rapidly as a result of continuing
low fertility and declining adult mortality rates); and demographic hour-
glass (countries where the prime working-age population has been
affected by premature adult mortality, from armed confl ict or disease,
such as HIV/AIDS). Table 16.2 lists countries by their demographic
status.
Demographic Explosion Of the 134 countries for which we have complete data, 43 countries,
mostly in Sub-Saharan Africa, are in the demographic explosion stage.
The number of children and young people in these countries is at an
all-time high: 450 million, of a total population of 830 million, are under
age 20. The high adolescent fertility rate is a concern in these countries
(fi gure 16.3, panel a). The rate declined only marginally during 1990–
2006 (World Bank 2009a). Births to mothers ages 15–24 account for
30 to 50 percent of all births in more than half of the countries at the
explosion stage.
Teenage mothers are more likely than older mothers to die of preg-
nancy-related causes, a major cause of death in high-fertility settings
(Conde-Agudelo, Belizan, and Lammers 2005; WHO 2004). At the same
time, pregnant women in demographic explosion countries face much
higher maternal mortality risks than do their counterparts in other
countries (see fi gure 16.3, panel b). An important reason is low access to
prenatal care and to skilled health care providers during childbirth (fi g-
ure 16.3, panel d). New estimates show that many countries have made

Tab
le 1
6.2
D
eve
lop
ing
Co
un
trie
s b
y D
em
ogr
aph
ic S
ett
ing
, 20
10 a
nd
20
15
Exp
losi
on
20
10,
exp
losi
on
20
11
Exp
losi
on
20
10,
ear
ly t
ran
siti
on
2015
Earl
y t
ran
siti
on
2010
,
ear
ly t
ran
siti
on
2015
Earl
y t
ran
siti
on
2010
,
tran
siti
on
2015
Tran
siti
on
20
10,
tran
siti
on
20
15
Tran
siti
on
2010
,
imp
losi
on
2015
Imp
losi
on
2010
,
imp
losi
on
2015
AFR
An
gola
*
Be
nin
Bu
rkin
a Fa
so
Cam
ero
on
**
Ce
ntr
al A
fric
an
Re
pu
blic
**
Ch
ad
Cô
te d
’Ivo
ire
Co
ngo
, De
m. R
ep
.*
Eth
iop
ia
Equ
ato
rial
Gu
ine
a
Gam
bia
, Th
e
Gu
ine
a
Gu
ine
a-B
issa
u
Ke
nya
Leso
tho
**
Lib
eri
a*
Mad
agas
car
Mal
awi*
*
Mal
i
Mo
zam
biq
ue
***
Nig
er
Nig
eri
a
Rw
and
a*
Sen
ega
l
Sie
rra
Leo
ne
*
Som
alia
Tan
zan
ia**
Uga
nd
a**
Zam
bia
**
Co
ngo
Erit
rea
São
To
mé
an
d
Pri
nci
pe
Sud
an
Swaz
ilan
d*
Togo
Zim
bab
we
**
Bo
tsw
ana*
Bu
run
di*
Cap
e V
erd
e
Co
mo
ros
Djib
ou
ti
Gab
on
*
Nam
ibia
*
Gh
ana
Mau
rita
nia
Sou
th A
fric
a*M
auri
tiu
s
EAP
Tim
or-
Lest
e
Ton
ga
Sam
oa
Cam
bo
dia
Lao
PD
R
Mic
ron
esi
a
Pap
ua
Ne
w
Gu
ine
a
Ph
ilip
pin
es
Solo
mo
n Is
lan
ds
Van
uat
u
Fiji
Ch
ina
Ind
on
esi
a
Ko
rea,
Re
p.
Mal
aysi
a
Mo
ngo
lia
Mya
nm
ar
Th
aila
nd
Vie
tnam
(con
tinue
d)

Tab
le 1
6.2
D
eve
lop
ing
Co
un
trie
s b
y D
em
ogr
aph
ic S
ett
ing
, 20
10 a
nd
20
15
Exp
losi
on
20
10,
exp
losi
on
20
11
Exp
losi
on
20
10,
ear
ly t
ran
siti
on
2015
Earl
y t
ran
siti
on
2010
,
ear
ly t
ran
siti
on
2015
Earl
y t
ran
siti
on
2010
,
tran
siti
on
2015
Tran
siti
on
20
10,
tran
siti
on
20
15
Tran
siti
on
2010
,
imp
losi
on
2015
Imp
losi
on
2010
,
imp
losi
on
2015
ECA
Tajik
ista
nU
zbe
kist
anA
lban
ia
Arm
en
ia
Aze
rbai
jan
Be
laru
s
Kaz
akh
stan
Kyr
gyzs
tan
Mac
ed
on
ia, F
YR
Mo
ldo
va
Mo
nte
ne
gro
Turk
ey
Turk
me
nis
tan
Bo
snia
an
d
He
rze
govi
na
Ge
org
ia
Pola
nd
Ru
ssia
n
Fed
era
tio
n
Serb
ia
Bu
lgar
ia
Cro
atia
Ro
man
ia
Ukr
ain
e
LAC
Gu
ate
mal
a**
Be
lize
Bo
livia
Hai
ti
Ho
nd
ura
s
Nic
arag
ua
Para
guay
Do
min
ican
Re
pu
blic
Ecu
ado
r
El S
alva
do
r
Arg
en
tin
a
Bra
zil
Ch
ile
Co
lom
bia
Co
sta
Ric
a
Gre
nad
a
Gu
yan
a
Jam
aica
Me
xico
Pan
ama
Peru
Sain
t Lu
cia
Sain
t V
ince
nt
and
the
Gre
nad
ine
s
Suri
nam
e
Trin
idad
an
d
Tob
ago
Uru
guay
Ve
ne
zue
la, R
.B. d
e
MENA
Ye
me
n, R
ep
.Ir
aq**
Egyp
t, A
rab
Re
p.
Jord
an
Syri
an A
rab
Re
pu
blic
Alg
eri
a
Iran
, Isla
mic
Re
p.
Leb
ano
n
Lib
ya
Mo
rocc
o
Tun
isia
SAR
Afg
han
ista
n*
Ne
pal
*
Paki
stan
Ban
glad
esh
Bh
uta
n
Ind
ia
Mal
div
es
Sri L
anka
Sour
ce: A
uth
ors
’ an
alys
is b
ase
d o
n d
ata
fro
m t
he
Un
ite
d N
atio
ns
Pop
ula
tio
n D
ivis
ion
20
09.
Not
es: E
xplo
sio
n: o
ver
40 p
erc
en
t o
f p
op
ula
tio
n b
elo
w a
ge 2
0; E
arly
tra
nsi
tio
n: o
ver
40 p
erc
en
t o
f p
op
ula
tio
n b
elo
w a
ge 2
0, b
ut
wit
h 4
5 p
erc
en
t o
r m
ore
age
s 20
–59
; Tra
nsi
tio
n: o
ver
50 p
erc
en
t o
f
po
pu
lati
on
age
s 20
–59
; Im
plo
sio
n: o
ver
20 p
erc
en
t o
f p
op
ula
tio
n a
bo
ve a
ge 6
0. A
FR =
Afr
ica,
EA
P =
Eas
t A
sia
and
Pac
ifi c,
EC
A =
Eu
rop
e a
nd
Ce
ntr
al A
sia,
LA
C =
Lat
in A
me
rica
an
d t
he
Car
ibb
ean
,
MEN
A =
Mid
dle
Eas
t an
d N
ort
h A
fric
a, S
AR
= S
ou
th A
sia.
*Co
un
trie
s af
fect
ed
by
hig
h H
IV-A
IDS
. **C
ou
ntr
ies
affe
cte
d b
y vi
ole
nt
con
fl ic
t. *
**C
ou
ntr
ies
affe
cte
d b
y b
oth
hig
h H
IV-A
IDS
and
vio
len
t co
nfl
ict.
(con
tinue
d)
Investing in Gender Equality: Looking Ahead 283
250
150
50
0
200
100
Congo, Dem. Rep.
Nicaragua
Venezuela, R.B. de
Bulgaria
highest
value
lowest
value
average
a. Adolescent fertility rate, 2003–08
bir
ths
pe
r 1,
00
0 w
om
en
ag
es
15–
19
explosion
(43)
early transition
(37)
transition
(50)
implosion
(4)
Tonga Uzbekistan CroatiaLibya
1,600
1,400
1,200
1,000
800
600
400
200
0
highest
value
lowest
value
average
Afghanistan
Iraq
Haiti
Myanmar
Poland
b. Maternal mortality rate, 2003–08
de
ath
s p
er
100
,00
0 l
ive
bir
ths
explosion
(28)
early transition
(20)
transition
(40)
implosion
(4)
UkraineBulgaria
CapeVerde
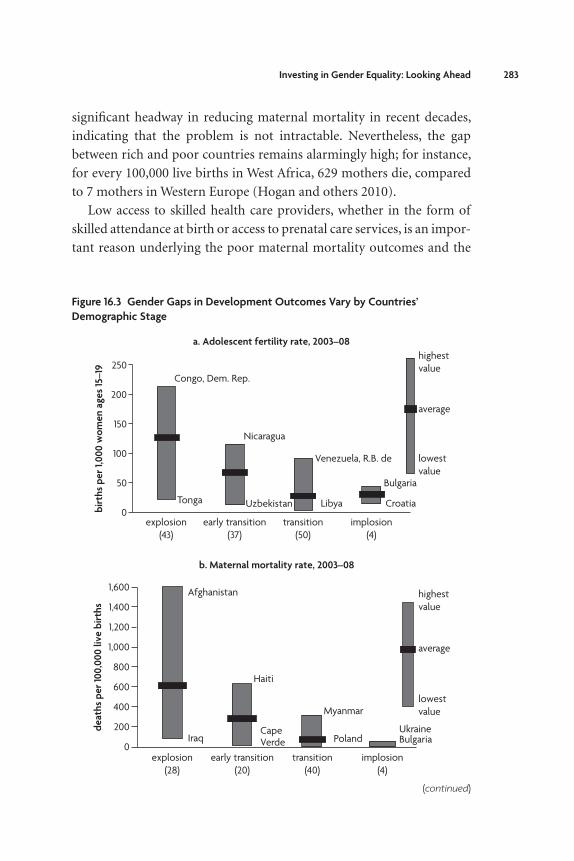
Figure 16.3 Gender Gaps in Development Outcomes Vary by Countries’
Demographic Stage
(continued)
signifi cant headway in reducing maternal mortality in recent decades,
indicating that the problem is not intractable. Nevertheless, the gap
between rich and poor countries remains alarmingly high; for instance,
for every 100,000 live births in West Africa, 629 mothers die, compared
to 7 mothers in Western Europe (Hogan and others 2010).
Low access to skilled health care providers, whether in the form of
skilled attendance at birth or access to prenatal care services, is an impor-
tant reason underlying the poor maternal mortality outcomes and the

284 The Day after Tomorrow
high risks associated with teenage pregnancy (fi gure 16.3, panel c). Young
women are therefore an important group to reach with maternal health
and family planning services and information.
The large number of young people under age 20 presents a major
challenge as countries struggle to provide education and employment
opportunities for them during the current economic and fi nancial crisis.
Refl ecting the push for universal primary education, girls’ enrollment
80
0
100
60
40
20
highest
value
lowest
value
average
Gambia, TheUzbekistan Sri Lanka Croatia
Romania
Nepal
Morocco
d. Pregnant women receiving prenatal care, 2003–08
Afghanistan
explosion
(38)
early transition
(28)
transition
(35)
implosion
(3)
80
0
100
60
40
20
highest
value
lowest
value
average
SamoaVanuatuUzbekistan Korea, Rep.
Morocco
Bangladesh
c. Births attended by skilled health staff, 2003–08
pe
rce
nta
ge
of
tota
lp
erc
en
tag
e o
f to
tal
Afghanistan
explosion
(40)
early transition
(29)
transition
(48)
implosion
(4)
Nepal
Ethiopia
Figure 16.3 Gender Gaps in Development Outcomes Vary by Countries’
Demographic Stage (continued)
Source: World Bank 2009b.
Note: Data are population-weighted averages.

Investing in Gender Equality: Looking Ahead 285
rates in demographic explosion countries rose substantially, reducing
the gap between girls’ and boys’ primary and secondary school enroll-
ment by 10 percentage points during 1991–2006. Yet a large gap remains,
particularly in Afghanistan and the Republic of Yemen, and primary
school completion rates are lower for girls (50 percent) than for boys
(63 percent; fi gure 16.4). Secondary school enrollment also remains
very low in Sub-Saharan Africa (24 percent for girls and 33 percent
for boys).
By 2015, nine explosion countries will face improved demographic
conditions and enter the demographic transition stage characterized by
a youth bulge and greater opportunities for growth and poverty reduc-
tion. At the same time, spikes in premature adult mortality caused by
violent confl ict or HIV/AIDS exacerbate demographic stresses in nearly
a third of countries in demographic explosion.
Hourglass ScenarioAmong countries in demographic explosion and early transition are 24
countries faced with high levels of adult mortality, often predominantly
of one gender, due to armed confl ict or disease such as HIV/AIDS. With
economies depleted of working-age adults, these countries are the most
demographically stressed countries.
Nine low-income countries have an HIV/AIDS prevalence rate among
adults of greater than 5 percent. By 2020, some of the worst-affected
countries (Botswana, Lesotho, Swaziland, and Zimbabwe) will have lost
an estimated 35 percent or more of their working-age populations (ILO
2006). Moreover, many more women than men are affected and at a
younger age. The Joint United Nations Program on HIV/AIDS estimates
that women make up three-quarters of Africans aged 15–24 who are
HIV positive (UNAIDS 2008). Yet wars tend to affect men, especially
young men, much more than women. Either way, families and econo-
mies end up losing members who play an essential role in the household
or economic structure. Confl ict and high HIV/AIDS prevalence have a
large negative impact on GDP growth through loss of labor productivity
because of illness and death and increased health care expenditures that
lead to dissaving and lower capital accumulation and expenditures on
schooling (Corrigan, Glomm, and Mendez 2005).

286 The Day after Tomorrow
Figure 16.4 Primary, Secondary, and Tertiary School Enrollment and Completion Rates
for Girls and Boys, 2003–08
120
100
80
60
40
20
0
0
120
100
80
60
40
20
explosion early transition transition
explosion early transition transition
female male
a. Gross primary enrollment rate
b. Primary completion rate
AFR
(33)
EAP
(3)
LAC
(1)
MENA
(2)
AFR
(10)
EAP
(8)
LAC
(8)
ECA
(2)
MENA
(3)
SAR
(5)
AFR
(1)
EAP
(6)
ECA
(14)
LAC
(17)
MENA
(6)
SAR
(2)
AFR
(33)
EAP
(3)
MENA
(1)
SAR
(2)
AFR
(10)
EAP
(5)
LAC
(8)
ECA
(2)
MENA
(3)
SAR
(5)
AFR
(1)
EAP
(6)
ECA
(10)
LAC
(16)
MENA
(3)
SAR
(5)
pe
rce
nt
pe
rce
nt
(continued)

Investing in Gender Equality: Looking Ahead 287
Figure 16.4 Primary, Secondary, and Tertiary School Enrollment and Completion Rates for
Girls and Boys, 2003–08 (continued)
120
100
80
60
40
20
0
explosion early transition transition
c. Gross secondary enrollment rate
AFR
(28)
EAP
(3)
LAC
(1)
MENA
(2)
AFR
(9)
EAP
(7)
LAC
(8)
ECA
(2)
MENA
(3)
SAR
(5)
AFR
(1)
EAP
(6)
ECA
(14)
LAC
(17)
MENA
(6)
SAR
(2)
120
100
80
60
40
20
0
explosion early transition transition
d. Gross tertiary enrollment rate
AFR
(25)
EAP
(1)
LAC
(1)
MENA
(2)
AFR
(9)
EAP
(5)
LAC
(7)
ECA
(2)
MENA
(1)
SAR
(5)
AFR
(6)
EAP
(6)
ECA
(12)
LAC
(14)
MENA
(6)
SAR
(1)
female male
pe
rce
nt
pe
rce
nt
Source: World Bank 2009b.
Note: Data are population-weighted averages. Numbers in parentheses are number of countries in each region. AFR = Africa,
EAP = East Asia and Pacifi c, ECA = Europe and Central Asia, LAC = Latin America and the Caribbean, MENA = Middle East
and North Africa, SAR = South Asia.

288 The Day after Tomorrow
In postconfl ict countries, additional challenges include the level of
violence against women and the rehabilitation and demobilization of
ex-combatants. An estimated 300,000 children under age 18 are fi ghting
in wars or have recently been demobilized (World Bank 2006). Initiatives
to reintegrate ex-combatants into society include a range of second-
chance programs, including medical and psychosocial support.
Demographic TransitionEighty-seven countries—65 percent of the countries for which we have
complete data—are currently in the early or middle phases of a demo-
graphic transition, with large working-age populations relative to chil-
dren and elderly persons. By 2015, fi ve will have moved into the implo-
sion stage.
Although fertility rates are lower in countries experiencing a demo-
graphic transition, poor maternal health remains a concern. Among
countries that have just entered this phase (early transition), use of
maternal health services (skilled attendance at birth and prenatal care)
remains low (see fi gure 16.3, panels c and d). Moreover, in some demo-
graphic transition countries such as Bangladesh, India, and Nicaragua,
births to young women still make up a large share of all births. Thus, a
focus on reproductive health of young women and adolescents remains
a priority for this group of countries as well.
The window of opportunity for high growth and poverty reduction—
the demographic dividend—provided by a large and young workforce
has opened for 37 low-income countries. But if this opportunity is to
result in accelerated growth, governments need to invest in these poten-
tial entrants to the workforce and to facilitate their participation in the
labor force by expanding employment opportunities.
Gender inequality in schooling and employment can limit the
potential for economic growth by reducing labor productivity. At this
point, the biggest challenge for countries in demographic transition is
to raise secondary enrollment and completion rates for both boys and
girls, especially in Sub-Saharan Africa, East Asia and Pacifi c, and South
Asia, where secondary enrollment rates are at 30–40 percent in coun-
tries at the early stage of transition. Tertiary enrollment is also extremely
low in low-income countries, at less than 20 percent for countries in
early transition.

Investing in Gender Equality: Looking Ahead 289
The ratio of employment to population in demographic transition
countries in South Asia is 24.4 percent for young women ages 15–24
and more than twice that (58.4 percent) for young men (fi gure 16.5).
Facilitating the entry of young women into the labor force and expand-
ing their employment opportunities are crucial for early transition
countries to reap the full benefi t of their investments in girls’ education
and to take advantage of the acceleration in growth offered by the demo-
graphic dividend. Investing in adolescent reproductive health to address
early childbearing is another way to ease women’s transition from school
to work.
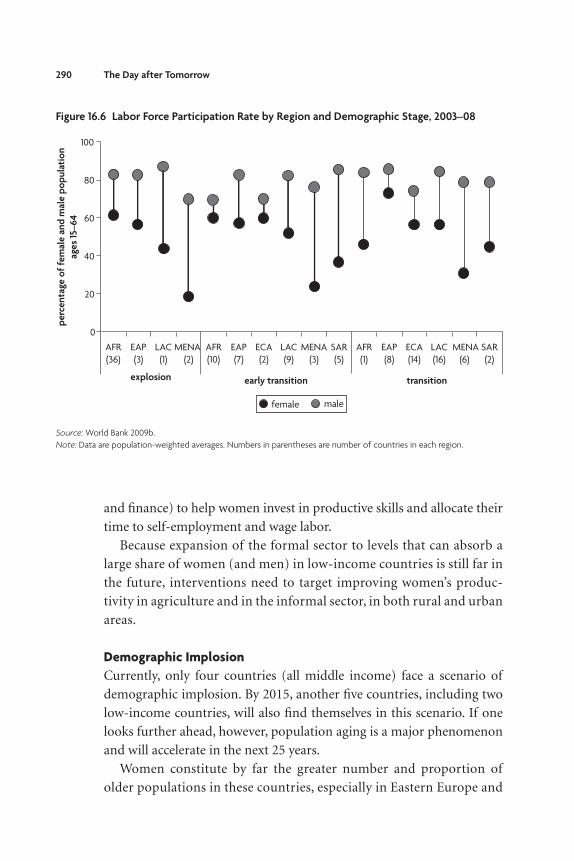
With fewer children than before, women are better placed to enter the
labor market. However, with the exception of Sub-Saharan African and
East Asian countries, women’s labor force participation in demographic
transition countries is far below that of men (fi gure 16.6). This implies
considerable scope for designing labor market policies and policies to
encourage entrepreneurship (including expanding access to technology
Figure 16.5 Ratios of Employment to Population Are Much Lower for Young Women than
for Young Men Ages 15–24
100
80
60
40
20
0
AFR
(35)
EAP
(1)
LAC
(1)
MENA
(2)
AFR
(9)
EAP
(6)
ECA
(2)
LAC
(9)
MENA
(6)
SAR
(2)
EAP
(6)
LAC
(9)
MENA
(3)
AFR
(1)
ECA
(2)
SAR
(5)
explosion early transition transition
female male
pe
rce
nt
Source: World Bank World Development Indicators database 2008.
Note: Data are population-weighted averages. Numbers in parentheses are number of countries in each region.
290 The Day after Tomorrow
100
80
60
40
20
0
AFR
(36)
EAP
(3)
LAC
(1)
MENA
(2)
AFR
(10)
EAP
(7)
ECA
(14)
LAC
(16)
MENA
(6)
SAR
(2)
EAP
(8)
LAC
(9)
MENA
(3)
AFR
(1)
ECA
(2)
SAR
(5)
explosion early transition transition
female male
pe
rce
nta
ge o
f fe
mal
e a
nd
mal
e p
op
ula
tio
n
age
s 15
–6
4
Figure 16.6 Labor Force Participation Rate by Region and Demographic Stage, 2003–08
Source: World Bank 2009b.
Note: Data are population-weighted averages. Numbers in parentheses are number of countries in each region.
and fi nance) to help women invest in productive skills and allocate their
time to self-employment and wage labor.
Because expansion of the formal sector to levels that can absorb a
large share of women (and men) in low-income countries is still far in
the future, interventions need to target improving women’s produc-
tivity in agriculture and in the informal sector, in both rural and urban
areas.
Demographic ImplosionCurrently, only four countries (all middle income) face a scenario of
demographic implosion. By 2015, another fi ve countries, including two
low-income countries, will also fi nd themselves in this scenario. If one
looks further ahead, however, population aging is a major phenomenon
and will accelerate in the next 25 years.
Women constitute by far the greater number and proportion of
older populations in these countries, especially in Eastern Europe and

Investing in Gender Equality: Looking Ahead 291
the Former Soviet Union. The average life expectancy for women in
Bulgaria, Croatia, Poland, Romania, the Russian Federation, Serbia,
and Ukraine combined is 75 years compared to 65 for men. The
central issue of the aging population is increased poverty and vulner-
ability. These problems are more acute for women, not only because
they tend to live longer than men, but also because women tend to be
disadvantaged in the patriarchal societies in which they live. The con-
sequences of gender roles (men as “breadwinners,” women as “house-
keepers”) become explicitly apparent. In situations where pension
schemes accrue mainly to employees, women who have not worked
for most of their adult lives become even more heavily reliant on their
husbands’ status and pensions. Older women who are single, widowed,
or divorced are especially vulnerable, receiving few or none of the
entitlements received by men. But there is also a future cohort of older
men that may be particularly vulnerable in the few societies where the
“culling” of infant girls will result in sharp sex-ratio imbalances, and
older, single men will be left to fend for themselves without the old-
age protection traditionally afforded by the family (Ebenstein and
Sharygin 2009).
Countries with rapidly aging populations face the challenge of design-
ing affordable old-age support policies with expanded coverage to
include these growing elderly cohorts. Gender-informed design and tar-
geting should increase the reach and affordability of these policies.
Postcrisis PrioritiesWhile in the short run, investments in gender equality should focus on
minimizing the negative impacts of the recent crises on development, in
the long run, countries will need to step up investments in gender equal-
ity that respond to specifi c country circumstances and are framed to
address the demographic stresses and opportunities associated with spe-
cifi c demographic scenarios. Table 16.3 defi nes priority investments in
gender equality for the four different demographic scenarios identifi ed
in this chapter. These priority investments are either proven to be effec-
tive (such as conditional cash transfers) or show promising results. In
most cases, countries will need to improve women’s earning opportuni-
ties and the quality of their jobs, but they will also need to intensify
gender integration in social sectors, particularly in reproductive health,

292 The Day after Tomorrow
Table 16.3 Priorities for Investments in Gender Equality over the Longer Term
Scenario Key issues Priority investments
Demographic explosion
• Lower per capita resources
for investment in human
capital and growth
• Poorer health and lifetime
earnings for women and
children, greater household
vulnerability to poverty
• Family planning programs to increase birth
intervals, reduce teen pregnancies, and
prevent mother-to-child HIV transmission
• Basic reproductive health services, particu-
larly those addressing the reproductive
health needs of adolescent and young
women and men
• Investments in schooling that increase
education quality for all and reduce gender
gaps in school enrollment and completion
(both supply and demand considerations
such as conditional cash transfers)
• Productivity-enhancing and income-earning
policies, including those targeting women
farmers
Demographic transition
• Potential for rapid economic
growth
• Additional efforts needed to
realize women’s contribution
to growth
• Policies that expand labor demand and create
economic opportunities for women (active
labor market programs such as skills training,
labor-intermediation programs, trade policies,
and access to entrepreneurship and
self-employment)
• Basic reproductive health services, particu-
larly those addressing the reproductive
health needs of adolescent and young
women and men
• Child care
Countries moving toward implosion
• Strained public and private
resources for support
• Added resource strains since
women live longer and have
fewer economic resources
• Safety net and pension options for
vulnerable elders, typically older women
(but also older men, especially in countries
with skewed gender ratios)
Hourglass (due to HIV/AIDS and confl ict)
• Lower potential for
economic growth,
households more vulnerable
to poverty
• If men missing (due to war),
more vulnerability to poverty
for female-headed
households; if women
missing (due to HIV/AIDS or
sex selection), deprivation of
familial support for
unmarried men
• Family planning programs to reduce teen
pregnancies and prevent mother-to-child HIV
transmission
• Investment in schooling, including accelerated
learning programs and targeted programs to
improve the school-to-work transition and
skill defi cits of poor young women
• Better access to entrepreneurship and
self-employment opportunities for women
• Antiretroviral therapy
• Interventions to address gender issues in
confl ict prevention (including gender-sensitive
Disarmament, Demobilization and
Rehabilitation programs)
Source: Authors’ compilation.

Investing in Gender Equality: Looking Ahead 293
where development assistance has contracted in recent years. And they
will need to address both “fi rst generation” gender equality issues, espe-
cially in the demographic explosion and hourglass scenarios, and “second
generation” issues, in the advanced transition and implosion cases, includ-
ing a focus on transferable skills for the modern labor market; access to
commercial credit; the formalization of female entrepreneurship; and
old-age security for vulnerable widowed women and, in societies with
gender-ratio imbalances, also aging protection for vulnerable single, older
men with no families.
Concluding Thoughts
While there are gender inequalities in all countries, these inequalities
take different forms depending on the country’s stage of demographic
transition and help to defi ne priority policy responses. Low-income,
high-fertility, and hourglass-scenario countries, in particular, need to
intensify gender integration in the social sectors. A priority area of inter-
vention (that has suffered contraction in development assistance in
recent years) is expanding access to quality reproductive health services
and coverage, including services for adolescents. Yet, late-transition and
implosion countries need to focus on old-age security and design afford-
able old-age support policies with expanded coverage, especially for vul-
nerable widowed women and, in the few societies with sharp sex-ratio
imbalances, also aging protection for vulnerable single, older men who
have no family support.
The exception to this is empowering women economically, which
emerges as a priority regardless of the country’s demographic scenario.
It is a proven way to manage crises and respond to demographic stresses.
The specifi c nature of the interventions will vary, of course, in response
to the different development needs of countries. For example, in low-
income countries, providing women with access to basic agricultural
inputs and microfi nance will continue to be fundamental to their eco-
nomic empowerment, while in transition and late-transition countries,
women’s economic opportunities are linked to an increased focus on
transferable skills for the modern labor market, access to commercial
credit, the formalization of female entrepreneurship, and viable child
care options.
294 The Day after Tomorrow
In all sectors, but especially for policies aiming to expand women’s
economic opportunities, there is a continued need to know what works
best and under which circumstances. At the same time, evidence-based
experience and good practices are emerging in a range of countries.
South-South dialogue should be intensifi ed so that new and innovative
responses to a changing world can be shared and issues related to gender
equality and development more broadly understood.
Note 1. Countries with high infant mortality rates are those in the highest quartile of
the distribution of under-5 mortality rates (per 1,000 live births) for 151 devel-
oping countries in 2007. Countries with low female schooling rates are those in
the lowest quartile of the distribution of the ratio of girls to boys in primary and
secondary enrollment for 131 developing countries for the latest available data
between 2004 and 2007.
BibliographyBaird, S., J. Friedman, and N. Schady. 2007. “Aggregate Economic Shocks and Infant
Mortality in the Developing World.” Policy Research Working Paper 4346,
World Bank, Washington, DC.
Buvinic, M. 2009. “The Global Financial Crisis: Assessing Vulnerability for Women
and Children—Identifying Policy Responses.” Paper prepared for the 53rd Ses-
sion of the United Nations Commission on the Status of Women, New York,
March 2–13.
Buvinic, M., M. Das Gupta, and U. Casabonne. 2009. “Gender, Poverty, and Demog-
raphy: An Overview.” World Bank Economic Review 23 (3): 347–69.
Conde-Agudelo, A., J. M. Belizan, and C. Lammers. 2005. “Maternal-Perinatal Morbid-
ity and Mortality Associated with Adolescent Pregnancy in Latin America: Cross-
sectional Study.” American Journal of Obstetrics and Gynecology 192 (2): 342–49.
Corrigan, P., G. Glomm, and F. Mendez. 2005. “AIDS, Human Capital, and Growth.”
Journal of Development Economics 77 (1): 107–24.
Ebenstein, A. Y., and E. J. Sharygin. 2009. “The Consequences of the ‘Missing Girls’ of
China.” World Bank Economic Review 23 (3): 399–425.
Fraser, A., J. Brockert, and R. H. Ward. 1995. “Association of Young Maternal Age with
Adverse Reproductive Outcomes.” New England Journal of Medicine 332 (17):
1113–17.
Friedman, J. A., and N. Schady. 2009. “How Many More Infants Are Likely to Die in
Africa as a Result of the Global Financial Crisis?” Policy Research Working
Paper 5023, World Bank, Washington, DC.

Investing in Gender Equality: Looking Ahead 295
Hogan, M., K. Foreman, M. Naghavi, S. Ahn, M. Wang, S. Makela, A. Lopez, R.
Lozano, and C. Murray. “Maternal Mortality for 181 Countries, 1980–2008: A
Systematic Analysis of Progress towards Millennium Development Goal 5.” The
Lancet 375 (9726): 1609–23.
ILO (International Labour Organization). 2006. HIV/AIDS and Work: Global Esti-
mates, Impacts on Children and Youth, and Response. Geneva: International
Labour Organization.
IMF (International Monetary Fund). 2009. World Economic Outlook Database.
http://www.imf.org/external/pubs/ft/weo/2009/01/weodata/index.aspx.
Sabarwal, S., N. Sinha, and M. Buvinic. 2009. “The Global Financial Crisis: Assessing
Vulnerability for Women and Children, Identifying Policy Responses.” Policy
Brief, Poverty Reduction and Economic Management Network, Gender and
Development Group, World Bank, Washington, DC.
Thirumurthy, H., J. Graff Zivin, and M. Goldstein. 2005. “The Economic Impact of
AIDS Treatment: Labor Supply in Western Kenya.” NBER Working Paper 11871,
National Bureau of Economic Research, Cambridge, MA.
UNAIDS (Joint United Nations Programme on HIV/AIDS). 2008. “Addressing the
Vulnerability of Young Women and Girls to Stop the HIV Epidemic in Southern
Africa.” Joint United Nations Programme on HIV/AIDS, Geneva.
World Bank. 1993. World Development Report 1993: Investing in Health. New York:
Oxford University Press.
———. 2006. World Development Report 2007: Development and the Next Genera-
tion. Washington, DC: World Bank.
———. 2007a. Global Monitoring Report 2007: Confronting the Challenges of Gender
Equality and Fragile States. Washington, DC: World Bank.
———. 2007b. World Development Report 2008: Agriculture for Development.
Washington, DC: World Bank.
———. 2009a. Global Monitoring Report 2009. Washington, DC: World Bank.
———. 2009b. World Development Indicators 2009. Washington, DC: World Bank.
______. 2009c. World Development Indicators Database. http://databank.worldbank
.org/ddp/home.do?Step=12&id=4&CNO=2.
WHO (World Health Organization). 2004. Adolescent Pregnancy: Issues in Adolescent
Health and Development. Geneva: World Health Organization.
Yamano, T., and T. S. Jayne. 2004. “Working-age Adult Mortality and Primary School
Attendance in Rural Kenya.” International Development Collaborative Policy
Briefs KE-TEGEMEO-PB-05, Michigan State University Department of Agri-
cultural Economics, East Lansing, MI.
