investing in africa's future: u.s. agricultural ... · what is agricultural development...
TRANSCRIPT

© 2005 Partnership to Cut Hunger and Poverty in Africa. All rights reserved. No portion of this paper may be reproduced without permission of the authors.
INVESTING IN AFRICA’S FUTURE: U.S. AGRICULTURAL DEVELOPMENT ASSISTANCE FOR SUB-SAHARAN AFRICA
FINAL REPORT—SEPTEMBER 2005
Michael R. Taylor and Julie A. Howard
Resources for the Future 1616 P Street, NW
Washington, DC 20036 www.rff.org
Partnership to Cut Hunger and Poverty in Africa 499 S. Capitol Street, Suite 500B
Washington, DC 20003 www.africanhunger.org

Contents
Acknowledgments .......................................................................................................... ..iv
Executive Summary...........................................................................................................v What Is Agricultural Development Assistance? ......................................................v
The Purpose of This Report ................................................................................... vi
Scope, Methods, Organization, and Findings....................................................... vii
Conclusions and Recommendations .................................................................. xviii
References ........................................................................................................... xxii
Figures .............................................................................................................. .xxiii
Tables................................................................................................................... xix
1 Agriculture’s Role in Africa’s Development ...........................................................1 Regional and Global Perspectives...........................................................................1
What Is Agricultural Development Assistance? ......................................................2
Overview and Methodology of the Report ...............................................................4
The Central Role of Agriculture in Africa’s Development ......................................6
International Consensus on Financing for Development ......................................15
Conclusion .............................................................................................................17
References ..............................................................................................................18
2 Institutional and Policy Landscape ........................................................................21 Congress ................................................................................................................22
The White House and the Department of State......................................................34
USAID....................................................................................................................36
Other Agencies Providing Bilateral Assistance for African Agriculture...............47
Agriculture-Oriented Multilateral Institutions ......................................................55
Conclusion .............................................................................................................63
References ..............................................................................................................65
Figure.....................................................................................................................69
Table ......................................................................................................................70
3 Recent Trends in U.S. Funding...............................................................................71 USAID’s Bureau for Africa Funding Levels and Trends.......................................73

Agriculture Funding by Other Bilateral U.S. Agencies.........................................90
U.S. Funding through Multilateral Agencies.........................................................91
Total U.S. Funding.................................................................................................95
Conclusion .............................................................................................................95
References ..............................................................................................................97
Figures .................................................................................................................100
Tables...................................................................................................................102
Appendix 3-A: USAID Strategic Objectives Related to African Agriculture......119
Appendix 3-B: USAID Title II Non-Emergency Food Aid...................................123
4 Lessons from the Country Studies........................................................................139 Country Policies and Programs...........................................................................140
Coordination of U.S. Assistance ..........................................................................142
Funding Trends for Agriculture...........................................................................143
Other Key Issues Raised by Stakeholders............................................................146
Figures .................................................................................................................152
Tables...................................................................................................................156
5 Conclusions and Recommendations.....................................................................159 Conclusions..........................................................................................................160
Recommendations ................................................................................................169
Appendix 4-A: U.S. Development Assistance in Ghana ............................................ A-1
Appendix 4-B: U.S. Development Assistance in Mali.............................................. A-34
Appendix 4-C: U.S. Development Assistance in Mozambique ............................... A-63
Appendix 4-D: U.S. Development Assistance in Uganda ...................................... A-101
Glossary ..................................................................................................................... A-138

iv
Acknowledgments
This report is a collaborative project of two independent nonprofit organizations—the
Partnership to Cut Hunger and Poverty in Africa (PCHPA) and Resources for the Future
(RFF)—and is funded by a grant from the Rockefeller Foundation. Michael R. Taylor is the
principal author and Julie A. Howard the co-author.
We gratefully acknowledge the cooperation of many people in the public and private sectors of
the United States and Africa who provided information and insight. We especially thank the
members of our project Advisory Board: Jim Bond, Ambassador A. Diop, Howard Gobstein,
Tom Hobgood, Earl Kellogg, Alexander Ray Love, Peter McPherson, Richard Mkandawire,
Cheryl Morden, Mima Nedelcovych, Ambassador A. Panguene, Emmy Simmons, Ambassador
E. Ssempala, and Roy Stacy.
Nicole Mason, Jody Tick, Michael McWilliams, and Robin Goldman provided extensive and
excellent research assistance for this project. Lastly, special thanks to our editors, Patti Miller
and Pamela Angulo, for their many contributions to this report.
Disclaimer
The authors retain responsibility for the content of the report.

v
Executive Summary
Never before has the divide between the world’s rich and poor been more glaring. The problems
are particularly acute in sub-Saharan Africa, where nearly half of the region’s 700 million people
live on less than one dollar a day and a third lack basic food security. And sub-Saharan Africa’s
situation is deteriorating: It is the only region of the world where poverty and hunger are
projected to increase over the next two decades unless major new investments are made.
Agricultural development is a critical catalyst for economic growth and poverty reduction
in sub-Saharan Africa. Three-quarters of the population lives and works in rural areas and for
every $1 generated through agricultural production, economic linkages add another $3 to the
rural economy.
External assistance for African agriculture has ebbed and flowed since the 1960s, but
agriculture’s central role in development regained prominence in the late 1990s as the global
community focused on the persistent problems of poverty and hunger in Africa. Its role is
emphasized in the Rome Declaration on World Food Security (FAO 1996), in the U.N.
Millennium Development Project, and in the poverty-reduction strategies of a host of African
governments and international development institutions.
From the beginning of his tenure in 2001 as administrator of the U.S. Agency for
International Development (USAID), Andrew S. Natsios stressed the central role of agriculture
in USAID’s development strategy and called for increased assistance:
Without economic growth and food security, no development effort is sustainable.
We will increase support for economic growth and agriculture programs that
reduce poverty and hunger, while finding better ways to mobilize and partner with
the private sector. (Natsios 2001)
What Is Agricultural Development Assistance?
The traditional understanding of agricultural development assistance focuses on improving
productivity on the farm. However, approaches have changed. This report takes a broad

vi
contemporary view and construes agricultural development assistance to include the wide range
of investments and activities that contribute to the ability of agriculture to foster rural economic
development and reduce poverty and hunger in Africa. It includes natural resources management
and the many other activities that contribute to improved productivity on the farm as well as
efforts to create an enabling policy and institutional environment for African agriculture (ranging
from improved land tenure systems to liberalized trade rules to applied agricultural research),
develop markets for agricultural inputs and outputs, build rural roads and other physical
infrastructure necessary for market access, facilitate rural employment through agribusiness and
value-added processing of agricultural commodities, and build agricultural export capacity and
opportunity.
The Purpose of This Report
This report examines the complex system through which the United States provides assistance to
African agriculture, whether the United States has significantly increased its assistance since
2000, and features of how U.S. assistance is delivered that affect its impact on the ground in
Africa. The purpose for providing this information is forward-looking. Never before has the
opportunity been so great to construct a foundation for sustainable economic growth in Africa.
At their July 2003 African Union Summit in Maputo, African heads of state endorsed the
Comprehensive African Agriculture Development Programme developed by the New
Partnership for Africa’s Development (NEPAD). They also pledged to allocate 10% of their
national budgetary resources to its implementation based on their conclusion that “agriculture-
led development is fundamental to cutting hunger, reducing poverty … agriculture must be the
engine for overall economic growth in Africa” (NEPAD 2002, 9).
In collaboration with Africans and other donors, the United States has a critical role to
play in devising and implementing an effective public investment strategy to foster agriculture-
led economic growth. For U.S. agricultural development assistance programs in Africa to make
progress, however, the starting point must be well understood. In this report, we attempt to
provide that understanding.
vii
Scope, Methods, Organization, and Findings
Specifically, the report seeks to:
• define agricultural development assistance;
• summarize the policy-level commitments to African agriculture made by U.S., African, and
other world leaders and organizations;
• document levels and trends in U.S. assistance to African agriculture;
• describe the system of institutions and funding mechanisms through which U.S. assistance is
provided;
• analyze how political and governance features of the U.S. aid system influence the
effectiveness of U.S. assistance based on country studies of U.S. assistance in Ghana, Mali,
Mozambique, and Uganda; and
• present conclusions and recommendations concerning U.S. agricultural development
assistance for sub-Saharan Africa based on the research conducted for this report to stimulate
thought and debate within the policy and stakeholder community working to improve the
U.S. assistance program and the contribution agriculture can make to poverty and hunger
reduction in Africa.
The report is based on an extensive review of publicly available documents on the
budgets and programs of agencies involved in agricultural development assistance and on
interviews and information provided by dozens of people in those agencies and the surrounding
community of experts and stakeholders in the United States. The research included a data-
gathering trip to Ghana, Mali, Mozambique, and Uganda and meetings with a broad cross section
of knowledgeable people in those countries. In addition, we issued an interim version of the
report in April 2005 and convened a workshop to stimulate comment and subsequently benefited
from important new information on USAID’s budget and new perspectives on other issues.
Many of these have been included in this final report, though some went beyond the scope of the
report.
The final report contains five chapters. In Chapter 1, we document the new recognition of
how agriculture can contribute to economic growth and poverty reduction in Africa. In Chapter
viii
2, we describe the institutional and policy landscape within which U.S. assistance for African
agriculture occurs. In Chapter 3, we document current funding levels and trends in U.S.
assistance through all channels. Chapter 4 distills lessons and observations drawn from the four
country studies that relate to aid effectiveness and how U.S. assistance aligns with the strategies
and priorities of recipient countries. Chapter 5 presents conclusions and recommendations.
Chapter 1: Agriculture’s Role in Africa’s Development
The recognition that agriculture must play a central role in reducing poverty and hunger in most
African countries is widespread and genuine.
• In addition to sharing NEPAD’s focus on agriculture, many African governments embrace
agriculture in their Poverty Reduction Strategy Papers (PSRPs).
• An understanding of agriculture’s central role underlies the World Bank’s rural development
strategy as well as programs of the Food and Agriculture Organization of the United Nations
(FAO) and the International Fund for Agricultural Development (IFAD).
• Private investment and entrepreneurship are widely understood to be essential.
• The role of public investment is to provide the critical public goods needed to make private
effort attractive and rewarding. They include supportive policy frameworks, market
information and market facilitation services, rural transport and other physical infrastructure,
human capacity building through training and extension, and technology development.
• The Monterrey Consensus on financing for development is an important component of the
international consensus on agricultural development in Africa (U.N. 2002). It calls for
mobilizing public and private investment within developing countries, increasing
international financial cooperation, significantly improving the level and quality of
development assistance, and cultivating recipient–country ownership of the development
process.
Chapter 2: Institutional and Policy Landscape
The United States provides agricultural development assistance to Africa within a complex web
of laws, competing policies, and interests whose interaction controls the level and uses of U.S.

ix
assistance resources. Congress plays a central role in funding and overseeing these programs,
which are administered by at least 10 U.S. agencies and international organizations.
Because it rarely amends the authorizing legislation,1 Congress most directly influences
development assistance programs today through the appropriations process—most prominently
through congressional earmarks that specify not only how much money is available for broad
purposes (e.g., health and economic development) but also how the money is to be spent to
achieve those purposes. Earmarks play a central role in controlling how USAID manages the
resources available to it for agricultural development in Africa.
The White House provides overall policy guidance on development issues, including
agricultural assistance. Within the White House, the Office of Management and Budget sets
budget priorities for international agricultural assistance. The Secretary of State provides policy
oversight to USAID and the USAID administrator reports to the Secretary of State.
As the primary development assistance agency, USAID has the most substantial
involvement in agricultural development assistance. It is a complex organization, and its multiple
units at headquarters and in the field play important roles in managing agricultural development
resources and programs.
• The Office of the Administrator declares new priorities, manages the agency, and brokers
between USAID and the administration and Congress.
• The Bureau for Policy and Program Coordination develops budgets and balances agency
priorities.
• The Bureau for Africa manages about $1.5 billion in program funds and designs and
implements and evaluates strategies and programs in sub-Saharan Africa—including 22
country missions and three regional programs.
• The Bureau for Economic Growth, Agriculture, and Trade (EGAT) is one of the three
“pillar” bureaus that provides policy leadership and technical expertise to support field
offices and contains most of the agency’s agricultural expertise. EGAT led the development
of USAID’s 2004 agriculture strategy (USAID 2004).
1 This includes the Foreign Assistance Act of 1961 (as amended in 1973 and 1978) and three food aid laws: Title II of P.L. 480 (originally enacted in 1954 as part of the Agricultural Trade Development and Food Assistance Act), Section 416(b) of the Agricultural Act of 1949, and the Food for Progress Act of 1985.

x
• The Bureau for Democracy, Conflict, and Humanitarian Assistance (DCHA) is the pillar
bureau that works on emergency relief and disaster assistance. DCHA’s Office of Food for
Peace (FFP) plays an important role in agricultural development assistance through its
management of the P.L. 480, Title II food aid program, a major source of resources for
USAID’s agricultural development efforts in Africa.
• USAID Field Offices, including country missions and regional offices, design and
implement programs. Field offices devise activities to produce results within the constraints
of agency policy and goals, budget allocations, and congressional earmarks.
Resource allocation within USAID is a complex process and details of the procedure
change frequently. Broadly speaking, it occurs through the combination of top-down budgeting
and bottom-up strategic objective planning. Development Assistance (DA) budget account funds
are allocated first to pillar and regional bureaus then to the field offices to be used for specific
purposes. The field offices devise strategic objectives and activities to achieve those objectives.
The allocation of USAID resources for agricultural development is guided by two headquarters-
driven policy frameworks: the current USAID agriculture strategy (USAID 2004) and the
president’s Initiative to End Hunger in Africa (IEHA), launched in 2002.
At least six other U.S. agencies provide bilateral assistance that can include African
agriculture, but all except one at substantially lower levels than USAID.
• The Foreign Agricultural Service in the U.S. Department of Agriculture (USDA) oversees
the distribution of Section 416(b) and Food for Progress food aid.
• The African Development Foundation provides small grants (generally less than $250,000)
to grassroots organizations to support poverty-alleviating projects.
• The U.S. Trade and Development Agency provides technical assistance and conducts
feasibility studies to identify trade opportunities that potentially benefit both developing
countries and U.S. companies.
• The Overseas Private Investment Corporation provides loan guarantees, insurance and
other forms of assistance to promote U.S. private investment in developing countries and
transition economies.

xi
• The Peace Corps provides volunteers to developing countries to help meet their needs for
trained men and women and to promote mutual understanding between Americans and the
people in host countries.
• Millennium Challenge Corporation (MCC) is a government corporation established in
2004 to implement the Millennium Challenge Account (MCA). President George W. Bush
pledged funding of $5 billion annually by FY 2006—a 50% increase over the current $10
billion annual funding for U.S. development and humanitarian assistance. The MCA was
intended to depart sharply from traditional U.S. development assistance by providing large
amounts of assistance to select countries that create an enabling environment for economic
growth through market-oriented, pro-growth policies; good governance, including tackling
corruption; and investment of their own resources in the health and education of their people.
The potential for agriculture is significant: 15 of 16 MCA-eligible countries included
agriculture in their proposals, including seven of the eight African countries.
At least five U.S.-funded international organizations provide multilateral assistance for
African agriculture.
• The lead U.N. agency for hunger is FAO. FAO supports policy change and agricultural
development programs with core annual resources of about $375 million, supplemented by
project-specific funding. About 20% of FAO’s field program budget is devoted to activities
in sub-Saharan Africa.
• The aim of the United Nations’ World Food Programme (WFP) is to meet emergency or
humanitarian food needs. In 2003, WFP fed 104 million people in 83 countries on a budget
of $3.3 billion. WFP also uses a portion of its resources (less than 10%) for longer term
development in Africa and elsewhere, including some activities related to agriculture.
• With concessional loans, IFAD has financed 653 projects in 115 countries, including projects
valued at about $175 million in 43 sub-Saharan African countries.
• The International Development Association (IDA), a member of the World Bank Group, is
the channel for virtually all of the bank’s activity in sub-Saharan Africa. IDA’s current
portfolio includes $16.6 billion in concessional loans and grants in Africa.

xii
• The African Development Fund, an arm of the African Development Bank, provides
development finance on concessional terms. The Agriculture and Rural Development sector
is the bank’s top priority, garnering about one-quarter of loan and grant approvals.
Key findings of Chapter 2 follow.
Competing Priorities and Congressional Earmarks Influence Agriculture Funding.
• Because decisions about U.S. development assistance funding are shaped by so many
executive institutions and, importantly, by Congress, priorities established by USAID
officials are very difficult to translate into new budget allocations.
• Since September 11, 2001, development initiatives with longer term investment horizons and
payoffs (such as support for agricultural development in Africa) have competed
unsuccessfully with immediate, short-term assistance needs in Afghanistan, Iraq, and Sudan.
• Competing policy and political considerations have led to an increasing imbalance in the
resources available for agriculture-led economic growth relative to assistance for the health
and education sectors. Funding for health-related assistance in Africa has grown dramatically
in recent years through USAID and special presidential initiatives to fight HIV/AIDS,
malaria, and other diseases of great concern.
• Even within funding available for agriculture, strong congressional earmarks severely limit
the flexibility of assistance programs to respond to needs identified at the country level.
Through earmarks, at least 90% of USAID’s DA account is pre-allocated to specific areas,
including trade capacity, microenterprise, biodiversity, and plant biotechnology. These are
important areas in general for agricultural development but may not match specific country
priorities.
• The effect of congressional earmarks is to reduce the flexibility of development assistance
programs to respond to the most important needs at the field level and thus reduce the
effectiveness of assistance.
• USAID reports on its development expenditures by strategic objective (such as Rural Income
Growth or Private Sector Expansion). There is no agency-wide system in place for reporting
progress on spending and outcomes related to implementing the agency’s agriculture strategy
and achieving agriculture-led economic growth in Africa.
xiii
Institutional Factors Affect the Scale and Potential Effectiveness of Development Resources.
• Estimated spending on agriculture-related strategic objectives in sub-Saharan African field
offices from 2000 through 2004 was spread widely across 24 countries and four regional
programs, resulting in average annual funding of about $6 million per year, per country.
These allocations typically were subdivided further among multiple contractors and grantees.
This approach raises the issues of whether most projects are large enough to have a lasting
effect and how their combined effects add up in terms of sustainable development impact.
• The need to compete for development resources with other sectors and to report quantifiable,
relatively near-term results through the USAID internal management system may or may not
result in projects that have an impact as large and as broad-based as longer term investments
in infrastructure and human capacity, the immediate effects of which are more difficult to
quantify.
• Fragmentation of resources also raises questions about the coordination of agricultural
development assistance within USAID, among U.S. agencies, and with other donor countries
and international institutions. For example, within USAID, the Bureau for Africa and FFP
traditionally have operated in parallel but independently. There is no U.S. government
mechanism in place to closely coordinate agricultural development strategy, resource
allocation, and on-the-ground activity with USDA or multilateral development institutions.
Because the general approach to agriculture-led economic growth and poverty reduction has
wide international agreement, improving coordination offers the opportunity to decrease
costs and increase assistance effectiveness by setting priorities, allocating resources, and
aggregating efforts.
• Domestic political considerations increase the costs of U.S. development assistance,
including the costs incurred to procure food in the United States and ship it to Africa in
predominately U.S. ships, tying aid to procurement from U.S. sources, and using
predominately U.S. contractors to implement development projects in Africa.
• MCC is a new government corporation that operates under a different institutional and policy
framework and receives funds that are not earmarked. It has the potential to become a
significant funder of agricultural development in Africa because African countries make up
about half of the MCA-eligible countries and most proposals for MCA funding have included

xiv
agriculture. MCA remains untested as a vehicle for development assistance, and it is
currently focused on a limited number of countries.
Chapter 3: Recent Trends in U.S. Funding
Because there is no standard definition of agricultural development assistance and agencies
report relevant activities in diverse ways, it is impossible to provide a precise measure or
accounting of U.S. development assistance for African agriculture. By devising approaches for
estimating such expenditures by each of the involved agencies, however, it is possible to form a
reasonable and informative picture of recent funding trends and priorities. Key findings of
Chapter 3 follow.
U.S. support for African agricultural development lags overall, while USAID funding for
African agriculture increased 9% in real terms from 2000 to 2004.
• Our estimates indicate that since 2000, overall U.S. resources devoted to agricultural
development in Africa have not increased significantly, with the high-end estimate indicating
a 2% increase in real terms from 2000 to 2004 despite USAID’s efforts to focus more of its
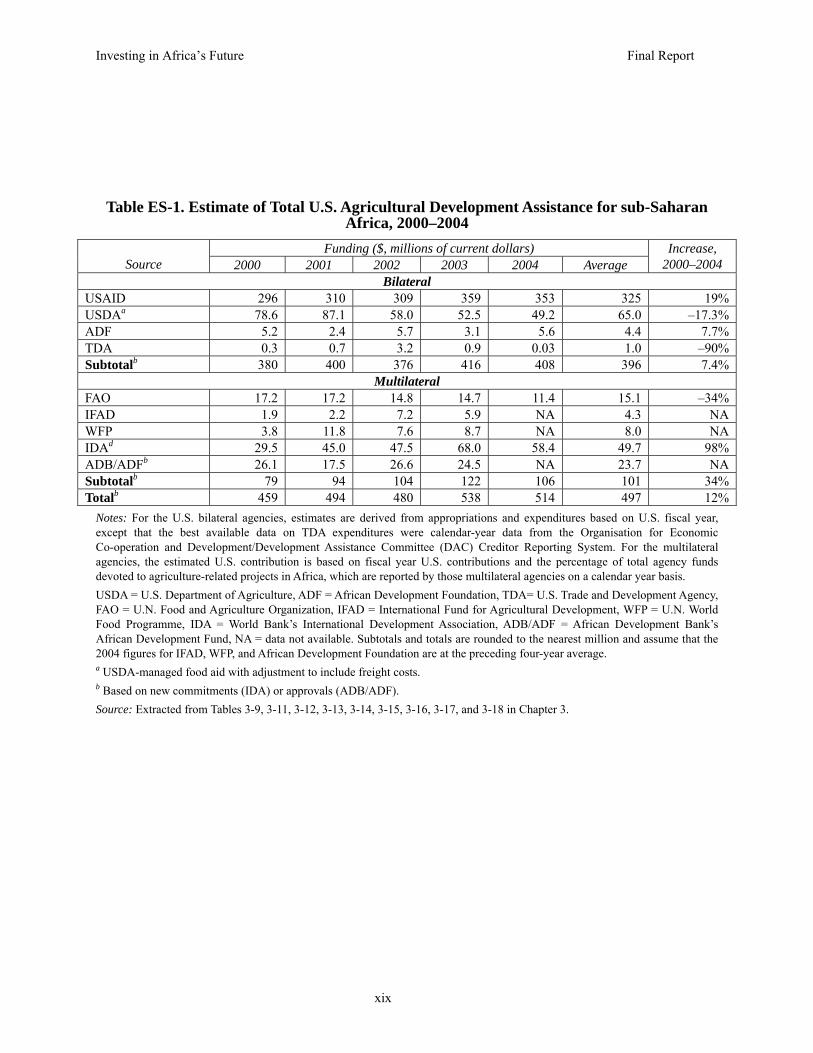
available development assistance resources on agriculture-related projects (Table ES-1).
• We estimate that USAID achieved an increase of 19% in its total estimated programming of
funds over the five-year period or 9% in real terms after adjustment for inflation (Table ES-
2). However, this increase was offset by absolute declines in funding through most other
bilateral and multilateral channels. Most of USAID’s gain occurred in one year (between
FY2002 and FY2003); estimated funding declined slightly in absolute terms in FY2004, and
actual FY2005 programming levels remain uncertain.
• USAID was the predominant funder of U.S. agricultural assistance for Africa from 2000 to
2004, accounting on average for 82% of U.S. bilateral funding and 67% of funding through
all channels (Figure ES-1).
The trend is flat in resources available to USAID’s Bureau for Africa.
• USAID funds African agricultural development through three channels: the Bureau for
Africa, the Title II food aid program of P.L. 480, and EGAT.
xv
• The Bureau for Africa is by far the largest single channel for U.S. agricultural development
assistance. Its funds for agricultural development come mainly through the DA budget
account, which includes three categories of funds that can be used to support agricultural
development as broadly construed: Agriculture, Economic Growth, and Environment. Since
2003, the Bureau for Africa has been funding some of its agriculture-related projects from
the DA account under the separate heading of IEHA.
• The Bureau for Africa uses most of its available DA resources for agricultural development,
but the amount of funds available for that purpose grew by only 7% from FY2000 to
FY2004, from $284 million to $304 million (Table ES-3), which means a 3% decrease in real
terms after adjusting for inflation. This places an effective cap on increases in expenditures
for African agriculture. This stagnancy contrasts sharply with the substantial growth in
USAID funding for health-related assistance in Africa.
• The $27 million and $47 million allocations designated as IEHA funding in 2003 and 2004,
respectively, came primarily from a reallocation of funds within the Africa DA account
rather than from increased funding (Figure ES-2).
Dramatically increased funding for health and education in Africa stands in stark contrast to
the flat trend in funding for economic growth activities.
• Figure ES-2 compares funding available between 2000 and 2004 in the DA account for
agriculture with funding for education, health, and other social development assistance
purposes.
• Bureau for Africa health funding alone grew by 51% in real terms during the period to $474
million and billions more have been pledged to protect health in Africa as part of the
president’s five-year, $15 billion commitment to HIV/AIDS and other health initiatives.
• In 2004, funding for African agriculture, as construed broadly for this report, was 4% of total
USAID-managed assistance worldwide and 29% of USAID resources available for
development in Africa, including health, education, and other sectors (Table ES-4).
xvi
Agriculture funding through multilateral channels has increased due to World Bank
investment in rural roads.
• U.S. funding for agricultural development in Africa through multilateral channels (FAO,
IFAD, WFP, World Bank/IDA, and the African Development Fund) was about 20% of total
U.S. funding and, as we estimated for this report, increased by 24% in real terms between
2000 and 2004, from $79 million to $106 million, due almost entirely to a commendable
increase in World Bank/IDA investment in rural roads.
Chapter 4: Lessons from the Country Studies
We sought to understand through case studies how U.S. development assistance programs and
funding levels relate to specific countries’ agricultural programs, priorities, and public
investments; how U.S. assistance is coordinated with assistance from other donors; and the views
of stakeholders on how U.S. development assistance, and public investment in agriculture in
general, could be improved. Key findings follow.
Agriculture and rural development play a central role in the PRSPs and related agricultural
development strategies of all four countries.
• The PRSPs embrace similar visions of changing archaic, near-subsistence agricultural
economies into progressive, dynamic, entrepreneurial, and profitable businesses. All place a
high priority on a market-oriented approach and the promotion of thriving agribusinesses
alongside a multidimensional approach to ensure food and nutrition security and improved
access to health services.
Sectoral development plans are extremely ambitious, reflecting the new understanding that
transforming rural economies will require far more than traditional agricultural development
assistance geared to improving productivity on the farm.
• Sector plans call for a broad array of investments needed to improve infrastructure; increase
productivity on and off the farm; reform land tenure; assist farmers and agribusinesses to
access inputs and financial services, improve agro-processing, and find markets for raw and

xvii
processed goods; and improve crisis prevention and response, education, health, and
environmental measures.
Despite the priority given to rural-led economic growth in policies and strategic plans,
domestic public resources are scarce and agriculture competes unfavorably with other sectors,
notably education and health, for PRSP funding.
• Countries rely on external donors for 37–90% of funding to implement their PRSPs and
agriculture/rural development strategies. Coordination of country and donor strategies and
programs is thus essential to meet agriculture and rural sector development goals. However,
under 10% of total Organisation for Economic Co-operation and Development bilateral
assistance to the countries was directed to core agriculture and rural sector development
programs. In each country, the proportion of PRSP expenditures dedicated to agriculture, and
actual domestic spending on agriculture and rural development, was expected to decline
between 2000–2004.
USAID country and sector plan priorities are highly consistent with PRSPs and country
sectoral strategies, underscoring the priority on rural-led economic growth, but this is not
reflected in U.S. assistance allocations.
• Agriculture activities received only 15% of USAID/Ghana’s budget and approximately 33–
45% of Mozambique, Uganda, and Mali’s budgets in FY2004.
Between 2000–2004, US bilateral assistance to agriculture declined in Ghana, Mali, and
Mozambique and rose only slightly in Uganda despite the fact that all four countries are
designated priority countries for the IEHA.
• By contrast, USAID spending on health and basic education ballooned, consuming 45–74%
of USAID’s annual budget in 2004 in the case countries.

xviii
Conclusions and Recommendations
Despite widespread recognition that agriculture is critical to future economic growth and poverty
reduction in Africa, total U.S. agricultural development assistance for Africa has grown by only
an estimated 2% in real terms since 2000. This essentially flat funding has occurred even as
USAID, the lead development agency, has focused more of its available development assistance
funds in Africa on agriculture and achieved an estimated real increase of 9% from 2000 to 2004
in its total funding for agricultural development. USAID’s gains are offset by absolute reductions
in funding for African agriculture by other agencies through which the United States provides
such funding.
Moreover, the apparent trend in U.S. assistance for African agriculture is not promising.
Most of USAID’s gains occurred in one year (from FY2002 to FY2003), and there was an
absolute decline in estimated funding for African agriculture by USAID and the U.S.
government as a whole in 2004. A central constraint for USAID is that although it has placed
agriculture at the center of its economic development strategy for Africa, the level of
appropriated money available to support such development declined in real terms between 2000
and 2004.
The stagnant U.S. funding for Africa’s economic development stands in stark contrast to
dramatic increases in funding for health programs in Africa. Increased health funding is critical,
but agricultural development should not be allowed to languish. Food, economic development,
and health are interdependent. Without adequate food, people will never be healthy; without
economic growth in rural communities, African nations will remain dependent on external
assistance to sustain their health systems and meet other basic human needs.
Recommendations
Funding Levels and Priority
Because U.S. funding for agricultural development assistance in Africa has lagged significantly
behind other sectors and regions, the United States should:
xix
• Invest More in Economic Growth, Making African Agriculture a Real Budget Priority – It is
critical that overall development assistance grow significantly. As part of a major increase,
creating a better balance between spending on social services and investments for economic
development is critical. African economic development in general and agriculture-led growth
and poverty reduction in particular should be made true budget priorities for Congress and
USAID. Assistance to African agriculture should grow at least as fast as overall foreign
development assistance and by 2009 at least double to 10% or more as a percentage of
USAID-managed development assistance.
Resource Use and Effectiveness
Because the level of resources actually reaching the ground in Africa and their effective
application are diminished by correctable policy and structural features of the aid system, the
United States should:
• Reduce Political Overhead – Congress and the administration should review and reform the
policies governing sourcing and shipping of food aid, U.S. procurement preferences, and
reliance on U.S.-based vendors so that more of the resources appropriated for agricultural
development assistance reach the ground in Africa.
• Reduce Fragmentation – USAID should take the lead among U.S. agencies to mount larger
and more focused programs within countries and within the region, taking advantage of all
available U.S. resources (DA, Title II food aid, and USDA-managed food aid) and managed
by fewer vendors, to ensure that the U.S. investment adds up to meaningful improvement in
the public goods required to build a successful agricultural system.
• Improve Donor Coordination and Pooling of Resources – To further improve the use and
effectiveness of resources, USAID should intensify its efforts to both coordinate programs
and pool resources with other donor agencies so that the donor community as a whole can be
a coherent, meaningful component of the recipient country’s agricultural development and
investment strategy.

xx
• Foster Local Ownership of the Development Process – USAID should expand its program
and budget support funding for agricultural development in countries that have committed to
a clearly defined development strategy and have installed the systems required to manage
resources with transparency and accountability.
Planning and Reporting
• Develop a Coordinated U.S. Strategy for Supporting Agriculture-Led Economic Growth in
Africa – To support growth in funding for agriculture-led economic growth in Africa and a
more strategic use of available funds, the USAID administrator should lead the development
of and propose to Congress a comprehensive cross-agency plan that defines funding needs
and priorities for this purpose and outlines how agricultural development resources will be
spent in a coordinated manner to foster broad-based economic growth and poverty reduction.
• Improve Transparency, Accountability, and Focus on Local Ownership and High-Impact
Programs with Longer Time Horizons to Achievement – As a key part of the comprehensive
agricultural development strategy, the USAID Administrator should develop and implement
a consistent reporting mechanism that reveals, on an annual basis and for all agencies with
programs related to African agricultural development:
o Levels and trends in U.S. assistance for agriculture-led economic growth and
poverty reduction in Africa;
o Progress against indicators of substantive progress established in the
comprehensive cross-agency plan; and
o Assessment of the projected long-term impact of projects, including standardized
projected returns to the investment beyond external funding and assessment of the
probability that the gains can be sustained by the host country following
withdrawal of external assistance.
Fund for African Rural Economic Growth
To provide a budget vehicle for increased investment in African agriculture and poverty-
reducing economic growth, the United States should:
xxi
• Develop a New Funding Mechanism – The principles underlying the MCA go a long way
toward insulating long-term investment for development from the congressional earmark
process and competition with the crisis or political priority of the day, but its scope remains
limited. Congress and the administration should create a similar, unearmarked fund
specifically for Africa targeted at supporting rural economic growth in countries that meet
specific criteria.

xxii
References
FAO (Food and Agriculture Organization of the United Nations). 1996. Rome Declaration on
World Food Security. Rome, Italy. Nov. 13. http://www.fao.org/wfs/index_en.htm
(accessed April 2, 2005).
Natsios, Andrew S. 2001. Testimony before the Senate Appropriations Committee,
Subcommittee on Foreign Operations. May 8. http://www.usaid.gov/press/spe_test/
testimony/2001/ty010508.html (accessed March 24, 2005).
NEPAD (New Partnership for African Development). 2002. Comprehensive Africa Agriculture
Development Programme. November. http://www.sarpn.org.za/documents/
d0000488/CAADP.pdf (accessed March 23, 2005).
U.N. (United Nations). 2002. Report of the International Conference on Financing for
Development, Monterrey, Mexico, 18–22 March, 2002.
http://www.un.org/esa/ffd/aconf198-11.pdf (accessed March 28, 2005).
USAID (U.S. Agency for International Development). 2004. USAID Agriculture Strategy:
Linking Producers to Markets. PD-ABZ-800. July. http://www.usaid.gov/our_work/
agriculture/ag_strategy_9_04_508.pdf (accessed March 25, 2005).
USAID. Various years. Congressional Budget Justifications. Available from
http://www.usaid.gov/policy/budget/ (accessed March 30, 2005).

xxiii
USDA13.1%
USAID65.5%
IFAD0.9%
WFP1.6%
FAO3%
TDA0.2%
IDA10.0%
AfrDevFund4.8%
AfrDevFdn0.9%
Bilateral Multi-Lateral
Notes: USDA = U.S. Department of Agriculture, AfrDevFdn = African Development Foundation, TDA = U.S. Trade and Development Agency, FAO = Food and Agriculture Organization of the United Nations, IFAD = International Fund for Agricultural Development, WFP = World Food Programme, IDA = International Development Association of the World Bank, AfrDevFund = African Development Fund of the African Development Bank, USAID = U.S. Agency for International Development.
Figure ES-1. Average Distribution of Total U.S. Agricultural Development Assistance for sub-Saharan Africa, 2000–2004

xxiv
Notes: CSH = Child Survival and Health, AG = Agriculture, EG = Economic Growth, ENV = Environment, Ed = Education, DA = Development Assistance, Agr = Agriculture, Non-Agr = Non-agriculture, ESF = Economic Support Fund, IEHA = Initiative to End Hunger in Africa.
Figure ES-2. USAID Non-Emergency Assistance to sub-Saharan Africa, FY2000–FY2004: Allocation of Appropriated Program Funds by Account and Sector
0
50,000
100,000
150,000
200,000
250,000
300,000
350,000
400,000
450,000
500,000
550,000
FY 2000 FY 2001 FY 2002 FY 2003 FY 2004Year
US
Dol
lars
(000
's)
953,934
CSH
DA
Title II
ESF
DA
DA
DADACSH
CSH
CSH
CSH
Title II Title IITitle II
Title II
ESF AG
EG
EN
VE
duca
tion
Edu
catio
n
Edu
catio
n
Edu
catio
n
Edu
catio
nE
NV
EN
V
EN
V EN
V
EG EG E
G
EG
AG
AG
AG
AG
AgrAgr
Agr Agr
Agr
ESFESF
ESF
Non
-Agr
Non
-Agr
Non
-Agr
Non
-Agr
Non-Agr
Total Funds ($000's) 1,030,457 1,149,129 1,342,978 1,232,085
IEHA IEHAIEHA
Dem / Con
Dem / Con
Dem
/ C
on
Dem / Con
Dem / Con
Investing in Africa’s Future Final Report
xix
Table ES-1. Estimate of Total U.S. Agricultural Development Assistance for sub-Saharan Africa, 2000–2004
Funding ($, millions of current dollars) Source 2000 2001 2002 2003 2004 Average
Increase, 2000–2004
Bilateral USAID 296 310 309 359 353 325 19% USDAa 78.6 87.1 58.0 52.5 49.2 65.0 –17.3% ADF 5.2 2.4 5.7 3.1 5.6 4.4 7.7% TDA 0.3 0.7 3.2 0.9 0.03 1.0 –90% Subtotalb 380 400 376 416 408 396 7.4%
Multilateral FAO 17.2 17.2 14.8 14.7 11.4 15.1 –34% IFAD 1.9 2.2 7.2 5.9 NA 4.3 NA WFP 3.8 11.8 7.6 8.7 NA 8.0 NA IDAd 29.5 45.0 47.5 68.0 58.4 49.7 98% ADB/ADFb 26.1 17.5 26.6 24.5 NA 23.7 NA Subtotalb 79 94 104 122 106 101 34% Totalb 459 494 480 538 514 497 12%
Notes: For the U.S. bilateral agencies, estimates are derived from appropriations and expenditures based on U.S. fiscal year, except that the best available data on TDA expenditures were calendar-year data from the Organisation for Economic Co-operation and Development/Development Assistance Committee (DAC) Creditor Reporting System. For the multilateral agencies, the estimated U.S. contribution is based on fiscal year U.S. contributions and the percentage of total agency funds devoted to agriculture-related projects in Africa, which are reported by those multilateral agencies on a calendar year basis. USDA = U.S. Department of Agriculture, ADF = African Development Foundation, TDA= U.S. Trade and Development Agency, FAO = U.N. Food and Agriculture Organization, IFAD = International Fund for Agricultural Development, WFP = U.N. World Food Programme, IDA = World Bank’s International Development Association, ADB/ADF = African Development Bank’s African Development Fund, NA = data not available. Subtotals and totals are rounded to the nearest million and assume that the 2004 figures for IFAD, WFP, and African Development Foundation are at the preceding four-year average. a USDA-managed food aid with adjustment to include freight costs. b Based on new commitments (IDA) or approvals (ADB/ADF). Source: Extracted from Tables 3-9, 3-11, 3-12, 3-13, 3-14, 3-15, 3-16, 3-17, and 3-18 in Chapter 3.

Investing in Africa’s Future Final Report
xx
Table ES-2. Estimated Total USAID Assistance for African Agriculture, FY2000–FY2004 Estimated Funding ($, millions)
Account FY2000 FY2001 FY2002 FY2003 FY2004 Total, FY2000–
FY2004 % of Total
Increase, FY2000– FY2004 (%)
Africa Bureau 187 190 211 243 226 1,058 65 21
Title II Food Aid 86 96 71 91 96 440 27 12
EGAT 23 24 27 25 31 130 8 35 Total 296 310 309 359 353 1,628 100 19 Note: EGAT = Bureau for Economic Growth, Agriculture, and Trade. Source: Tables 3-3, 3-5, and 3-8 in Chapter 3.
Table ES-3. USAID Development Assistance (DA) Account Allocation in Africa by Sector, FY2000–FY2004 (with percent of total DA allocation in parentheses)
Allocation ($, millions) Increase, FY2000–FY2004/2005
(%)
Account/Sector FY2000 FY2001 FY2002 FY2003 FY2004 FY2005
Total DA for Africa 443 (100%)
439 (100%)
471 (100%)
522 (100%)
494 (100%)
547 (100%) 11.5/23.5
Education 95 (21.4%)
94 (21.4%)
116 (24.6%)
114 (21.9%)
128 (25.9%)
149 (27.2%) 34.7/56.8
Democracy/Conflict
63 (14.2%)
62 (14.1%)
60 (12.7%)
84 (16.1%)
61 (12.4%)
80 (14.6%) -3.2/27.0
Agriculture (without IEHA)
91 (20.5%)
95 (216%)
110 (23.4%)
106 (20.4%)
90 (18.6%)
104 (19.0%) 1.1
Economic Growth 112 (25.3%)
102 (23.2%)
105 (22.3%)
106 (20.4%)
87 (17.6%)
95 (17.4%) –22.3/-15.2
Environment 82 (18.5%)
86 (19.6%)
76 (16.1%)
84 (16.1)
81 (16.4%)
71 (13.0%) 1.2/-13.4
IEHA 0 0 5 (0.11%)
27 (5.5%)
47 (9.1%)
47 (8.6%) NA—
Agriculture/IEHA Total 91 (20.5%)
95 (21.6%)
115 (24.4%)
133 (25.5%)
137 (27.7%)
151 (27.6%) 50.6/65.9
Agriculture/IEHA, Economic Growth, Environment Total
284 (64.1)
283 (64.5%)
295 (62.6%)
323 (62.0%)
304 (61.5%)
318 (58.1%) 7.0/12.0
Notes: The sectoral allocations in this table are based on the “653(a)” reports that USAID must provide to Congress within 30 days of enactment of the annual appropriations bill informing Congress of how the congressional appropriation in the DA and other accounts are to be allocated by the agency by region and sector. IEHA = President’s Initiative to End Hunger in Africa. Source: USAID/Africa Bureau Office of Development Planning (ABODP) table re: “FY 00–05 Budget Levels by Sector: DA/CSH” (provided to authors by Carrie Johnson, ABODP, May 19, 2005), and personal communication with Carrie Johnson, August 3, 2005.

Investing in Africa’s Future Final Report
xxi
Table ES-4. Estimated U.S. Agency for International Development (USAID) Funding for African Agriculture Relative to Other USAID-Managed Programs, FY2000 to FY2004
(with percentage of USAID total in parentheses)
Estimated Funding ($, millions)
Funding Use FY2000 FY2001 FY2002 FY2003 FY2004
Increase, FY2000– FY2004 (%)
USAID Totala
7,616 (100%)
7,822 (100%)
8,853 (100%)
9,465 (100%)
8,813 (100%) 15.7
Global Development Total (CSH, DA, ESF, P.L. 480b)
4,976 (65.3%)
4,949 (63.3%)
6,493 (73.3%)
5,012 (53.0%)
6,838 (77.6%) 37.4
Africa Development Total (CSH, DA, ESF, P.L. 480)
955 (12.5%)
1,005 (12.9%)
1,140 (12.9%)
1,314 (13.9%)
1,231 (14.0%) 28.9
Estimated African Agriculture Total: Point Estimates
296 (3.9%)
310 (4.0%)
309 (3.5%)
359 (3.8%)
353 (4.0%) 19
Estimated African Agriculture Total: Range Estimates
247–321 (3.2–4.2%)
254–335 (3.2–4.3%)
257–332 (2.9–3.7%)
287–383 (3.0–4.1%)
295–378 (3.4–4.3%) 19–18
African Agriculture as Percent of Global Development Total: Point (and Range Estimates)
6.0% (4.9–6.4%)
6.3% (5.1–6.7%)
4.8% (3.9–5.1%)
7.2% (5.8–7.7%)
5.2% (4.3–5.5%)
–13.3 (–12 to–14)
African Agriculture as Percent of Africa Development Total: Point (and Range Estimates)
31% (26–33%)
31% (25–33%)
28% (22–29%)
27% (22–29%)
29% (24–31%)
–6.5 (–7.7 to–
6.1)
Notes: CSH = Child Survival and Health, DA = Development Assistance, ESF = Economic Support Fund, P.L. 480 = Agricultural Trade Development and Food Assistance Act of 1954. a USAID total excludes Emergency Response Fund and wartime supplemental appropriations for Iraq. b Includes only the portion of the P.L 480 Title II appropriation used for non-emergency (i.e., development) purposes. Source: USAID Congressional Budget Justifications, FY2003 and FY2005 (USAID various years), and USAID/Africa Bureau Office of Development Planning table re: “FY 00–05 Budget Levels by Sector: DA/CSH” (provided to authors by Carrie Johnson personal communication, May 19, 2005).
Investing in Africa’s Future Final Report
1
1
Agriculture’s Role in Africa’s Development
Regional and Global Perspectives
Never before has the divide between the world’s rich and poor been more glaring. In a world of
plenty, half of the people on earth live in poverty and one in six go hungry. Poverty and hunger
are particularly acute in sub-Saharan Africa; nearly half its people try to sustain themselves on
less than one dollar a day, and a third confront hunger daily (FAO n.d.).
Over the past decade, these harsh realities have triggered a global recommitment to
eradicate poverty and hunger and a new push to identify the steps necessary to achieve this goal,
especially in the world’s poorest countries. A global consensus now recognizes not only the
moral imperative to tackle poverty and hunger in poor countries but also the self-interest of rich
countries to pursue a vision that “promotes human development as the key to sustaining social
and economic progress in all countries” (World Bank 2004). This new commitment is reflected
in the 1996 World Food Summit’s pledge to “reduce by half the number of undernourished
people” by 2015 (FAO 1996), which was reinforced by adoption of the United Nations’
Millennium Development Goals in 2000. Since September 11, 2001, the global community has
recognized anew the link between poverty reduction and security (U.N. 2004).
The recommitment to poverty reduction has been accompanied by a reaffirmation of the
essential role of agriculture. For millennia, agriculture provided the foundation for economic
well-being and growth worldwide, and it has reemerged today as the key driver of strategies to
reduce poverty and hunger in Africa. Today, there is widespread recognition among African
leaders, international institutions, and leaders in the United States and other donor countries that
improving the productivity and income-generating capacity of agriculture is essential if goals to
reduce poverty and hunger—and increase broad-based economic growth—are to be achieved.
This recognition is grounded in the great potential of Africa’s vast land and creative
people to produce not only an abundance of food but genuine wealth through modern, market-
oriented agriculture and agribusiness. The challenges are real, including the lack of roads and

Investing in Africa’s Future Final Report
2
other essential market infrastructure, the lack of capacity to apply modern technology to Africa’s
farming challenges, policies in need of reform, and public institutions in need of improved
performance. But these challenges can be overcome by investment in the same “public goods”
that any modern agricultural economy needs to succeed—investment that, to achieve the
necessary scale and effectiveness, must come from both African and external sources.
The opportunity to foster rural economic growth through agriculture is the motivation for
this report on the United States’ agricultural development assistance programs for sub-Saharan
Africa (which hereafter may be referred to simply as Africa), prepared under the auspices of the
Partnership to Cut Hunger and Poverty in Africa (PCHPA). Improving support for African
agriculture and rural economic development is one of the key objectives of PCHPA’s action
plan.1 This report is the first phase of a new PCHPA effort to foster such improvement by
providing information and ideas that policymakers and stakeholders in Africa, the United States,
and elsewhere can use to enhance both public and private investment in African agriculture. U.S.
agricultural development assistance for Africa is one element of the needed public investment,
and the goal of this report is to foster well-informed dialogue within the broad policymaker and
stakeholder community about how the level and quality of U.S. assistance can be improved.
What Is Agricultural Development Assistance?
PCHPA uses the term “agricultural development assistance” as shorthand to describe a broad
array of investments and activities that foster agriculture-led rural development and economic
growth, and we do the same in this report. Historically, it was easy to think of agricultural
development assistance as assistance for on-farm improvements in productivity, such as
improved seed, farming practices, and extension services for small-scale farmers. This
understanding stems in part from the Green Revolution begun in the 1960s, when the
development and dissemination of improved inputs—supported by the Rockefeller Foundation,
the United States, and other donor governments—spawned rapid progress in agriculture and
improved the lives of millions of people in Asia and Latin America.
1 PCHPA’s action plan is described in Now Is the Time: A Plan to Cut Hunger and Poverty in Africa (PCHPA 2002), which was the product of extensive analysis and dialogue with African leaders concerning how best to improve the welfare of the rural poor and improve the economies of poor countries in sub-Saharan Africa. The central theme of the action plan is that agricultural and economic growth must begin in rural African communities.

Investing in Africa’s Future Final Report
3
Today in Africa, the development challenge is more difficult. Sub-Saharan Africa lacks
much of the physical infrastructure (e.g., roads and other transport facilities) and institutional
capacity (for research, governance, and functioning markets) that helped make the Green
Revolution happen. Thus, we take a broad view of agricultural development assistance.
Enhancing farm productivity remains important, but for countries to achieve sustainable
economic growth and reduce poverty and hunger, farmers must have access to markets and be
able to sell their products at prices that adequately reward investment of scarce time and
resources. Off-farm employment opportunities stemming from more productive agriculture must
also be generated.
Our working definition of agricultural development assistance therefore includes the wide
range of investments and activities whose primary purpose is to contribute to the ability of
agriculture to foster rural economic development and reduce poverty and hunger. It includes
natural resources management and the many other activities that contribute to improved
productivity but also efforts to create an enabling policy and institutional environment for
agriculture in Africa (ranging from improved land tenure systems to liberalized trade rules to
applied agricultural research), develop markets for agricultural inputs and outputs, build rural
roads and other physical infrastructure necessary for market access, facilitate rural employment
through agribusiness and value-added processing of agricultural commodities, and build
agricultural export capacity and opportunity.
Although this broader conception is much closer to reality than a narrow one, it blurs the
definition of agricultural development assistance. One could argue that support for basic
education and health services in rural communities should be included because it helps build the
human capacity needed for agricultural success. We do not include assistance for these “social”
sectors in this report, however, because doing so would obscure any distinction between
investments whose primary purpose is to support agriculture-led, rural economic growth and
ones that have broader social purposes and effects.
The fact is that no single, agreed-upon definition of agricultural development assistance
currently exists. In fact, the U.S. Agency for International Development (USAID) and other
donor agencies may refer to some of the activities and investments that fall within our working
definition of the term as assistance for “rural income improvement,” “human capacity building,”
“rural roads,” “improved market services,” or “trade policy reform.” Thus, quantifying
Investing in Africa’s Future Final Report
4
agricultural development assistance (as we do in Chapter 3) is somewhat problematic and
imprecise, and cannot be done simply by drawing figures from currently available public reports.
However, this disadvantage is more than offset by the advantage of recognizing that agriculture
is not an isolated activity. It is central to facilitating the multifaceted process of economic
development in sub-Saharan Africa and reducing poverty and hunger on the African continent.
Overview and Methodology of the Report
This report includes an executive summary with key findings and recommendations, five
descriptive and analytical chapters, and appendices that present four country-specific studies of
U.S. agricultural development assistance and a series of data tables. In this first chapter, we set
the stage by describing the striking, renewed recognition of agriculture’s role in Africa’s
development that has emerged in Africa and worldwide over the past several years. This
discussion is the backdrop for the analysis of current U.S. assistance for African agriculture in
the remainder of the report.
In Chapter 2, we describe the institutional and policy landscape for U.S. agricultural
development assistance, focusing on USAID but in the context of the roles played by the U.S.
Congress, the White House, other U.S. agencies involved in bilateral assistance activities, and
the multilateral institutions through which the United States contributes to the development of
African agriculture. Our goal is to explain how and by whom decisions are made about the
allocation of development resources, the policy framework within which those allocations are
made, and the broad purposes for which U.S. assistance is used.
In Chapter 3, we describe and analyze recent levels and trends in funding of U.S.
agricultural development assistance for Africa through USAID, other bilateral agencies, and
multilateral institutions. Our purpose is to provide a factual basis for gauging the direction of
such funding since 2000 and where it stands in relation to other development priorities.
In Chapter 4, we present the four country studies—on Ghana, Mali, Mozambique, and
Uganda—that helped inform the analysis and recommendations in this report. The countries
were chosen in part because they are the PCHPA’s primary partners in Africa and thus
convenient vehicles for digging deeply into the U.S. assistance program. They also are among
the leading countries in Africa in terms of their commitments to pro-poor agricultural
development and the size of their agriculture-related U.S. assistance programs. The country

Investing in Africa’s Future Final Report
5
studies are based on information collected by local experts in each country and by the authors
during country visits in January 2005. These studies provide texture and illustrative detail about
current U.S. agricultural assistance programs from the perspective of agricultural and
development stakeholders in the countries.
Chapter 5 presents the author’s final conclusions and recommendations for the future of
the U.S. assistance program, which are based on the four country studies, the analysis in this
report, and comments we received on the analysis in response to an interim version of the report
that PCHPA circulated in April 2005 to the community of policymakers and stakeholders
concerned about Africa’s future.
Finally, a note on what this report does and does not do and the information sources on
which we rely. This report is comprehensive in documenting U.S. agricultural development
assistance for Africa from all sources. It is detailed in describing the allocation and uses of U.S.
assistance and how decisions are made as thoroughly as possible, given the limitations of
practicality and available data. Such detail is necessary for a real understanding of the program
and for any analysis that one might undertake.
However, the report is not a management or effectiveness evaluation of the U.S. program
nor is it an audit. With the generous help of USAID staff, we have worked to understand where
the resources for agricultural development assistance come from, how they flow through USAID
and other agencies, and how they are applied on the ground in Africa. It is one of the most
complicated resource management systems in the U.S. government, and a detailed audit or
complete documentation of resource flows is beyond the scope of this report.
The purpose and analytical approach of this report are broader. With the recent
recognition of agriculture’s role in African development as the backdrop, we address two
questions:
• What does the U.S. agricultural development assistance program for Africa consist of today
in terms of resource levels and governance?
• How can the program be improved?
The primary information sources for this report include the web sites of USAID and other
U.S. government agencies as well as data and information about agency programs supplied
directly to us by agency staff. We also consulted the open literature on development and the
Investing in Africa’s Future Final Report
6
databases and other repositories of information maintained by the Development Assistance
Committee (DAC) of the Organization for Economic Co-operation and Development (OECD) in
Paris, France, and by the Food and Agriculture Organization of the United Nations (FAO) in
Rome, Italy. Even more importantly, however, we have benefited from the input and insights of
many individuals from diverse institutions in Africa and the United States who have shared their
time and expertise in interviews and other settings.
The Central Role of Agriculture in Africa’s Development
The birth of agriculture 10,000 years ago made modern civilization possible, providing the
foundation for economic success in most of the world’s developed countries. A vast natural
resources base and predominately rural population mean that agriculture is the logical foundation
for economic growth in Africa, as well. These facts are not new, and they are widely accepted by
experts.
For that reason, agriculture was the focus of development assistance efforts by external
donors to African countries during the years immediately after their independence—the 1960s
and 1970s. In fact, the level of funding for African agriculture by all donors, including the
United States, roughly doubled in real terms from 1975 to the late 1980s. In the 1990s, however,
in response to the HIV/AIDS epidemic and strong support for wider access to basic education,
funding priorities began shifting strongly to these social sectors, and donor support for African
agriculture receded to mid-1970s levels by 2000.2
Through the World Food Summit and Millennium Development Goal (MDG) processes,
however, global efforts have focused on how best to reduce poverty and hunger in Africa in
today’s market-oriented world, returning anew to agriculture as a key driver of economic
success. There is not only a new recognition of agriculture’s intrinsic importance but also some
widely shared perspectives among African leaders, international bodies, and Americans about
what must be done for agriculture to fulfill its role, including the need for investment in the
public goods that are necessary for the success of any market-oriented agricultural system. These
perspectives are summarized in the remainder of this chapter.
2 This history is well described and documented by Eicher (2003).

Investing in Africa’s Future Final Report
7
Africa’s Embrace of an Agriculture-Led Development Strategy
The erosion of donor support for agriculture in Africa beginning in the mid-1980s was paralleled
by a focus among many African leaders on the needs of the cities and the health and education
sectors. In the late 1990s, several African leaders—including the presidents of South Africa,
Nigeria, Senegal, Mali, and Uganda—began a process to revitalize and refocus economic
cooperation and economic development in sub-Saharan Africa. At Abuja, Nigeria, in October
2001, African leaders came together under the auspices of the African Union to form the New
Partnership for Africa’s Development (NEPAD), which has become the vehicle for a dramatic
shift in the importance accorded agriculture in Africa’s development strategy across the
continent. NEPAD embodies:
a pledge by African leaders, based on a common vision and a firm and shared
conviction, that they have a pressing duty to eradicate poverty and to place their
countries, both individually and collectively, on a path of sustainable growth and
development, and at the same time to participate actively in the world economy
and body politic. (UNECA 2001, 1)
To fulfill this pledge, the African heads of state espoused a common vision and an
ambitious agenda for achieving peace and security, adopting democratic governance reforms,
bridging the infrastructure gap, and building human capacity through improved education and
health. They also identified development of agriculture as a critical priority for addressing the
“urgent need to achieve food security in African countries” and for economic development,
declaring that:
Improvement in agricultural performance is a prerequisite of economic
development on the continent. The resulting increase in rural peoples’ purchasing
power will also lead to higher effective demand for African industrial goods. The
induced dynamics would constitute a significant source of economic growth.
(UNECA 2001, 30)
To foster progress toward agriculture-led food security and economic growth, the
NEPAD Secretariat issued in July 2003 a detailed analysis of the investment needs for African
agriculture and an action plan called the Comprehensive Africa Agriculture Development

Investing in Africa’s Future Final Report
8
Programme (CAADP). Finding African agriculture to be “in crisis” because of low productivity,
NEPAD nevertheless described agriculture as “the backbone of most African economies,”
(NEPAD 2002, 7) and, with broad stakeholder and expert input, underscored agriculture’s
importance to Africa’s future:
Agriculture-led development is fundamental to cutting hunger, reducing poverty,
generating economic growth, reducing the burden of food imports and opening
the way to an expansion of exports. … In short, agriculture must be the engine for
overall economic growth in Africa. (NEPAD 2002, 9)
Thus, NEPAD’s vision is that African agriculture will lead economic development that
“eliminates hunger and reduces poverty and food security, thereby enabling the expansion of
exports and putting the continent on a higher economic growth path” (NEPAD 2002, 11). To this
end, the CAADP vision statement identified seven specific goals for African agriculture
(NEPAD 2002, 11):
• attain food security (in terms of availability, affordability, and accessibility of the poor to
adequate food and nutrition);
• improve the productivity of agriculture to attain an average annual growth rate of 6%, with
particular support for small-scale farmers, especially women;
• develop dynamic economic agricultural markets between nations and regions;
• integrate farmers into the market economy and improve their access to markets, so Africa can
become a net exporter of agricultural products;
• achieve a more equitable distribution of wealth;
• play a strategic role in agricultural science and technology development; and
• cultivate environmentally sound production methods and sustainable management of the
natural resources base.
CAADP recognizes the many impediments to achieving these goals, including
fundamental issues of poor governance, unsupportive policies, weak public institutions and
private-sector entrepreneurship, and HIV/AIDS, all of which are on the broader NEPAD reform
agenda. To move forward in agriculture, however, CAADP identifies four “pillars for priority
Investing in Africa’s Future Final Report
9
investment” that NEPAD believes can “make the earliest difference to Africa’s agricultural
crisis” (NEPAD 2002, 15):
• Pillar 1: Land and Water Management (to ensure access to the basic inputs of water and soil
nutrients required for productive agriculture);
• Pillar 2: Rural Infrastructure and Trade-Related Capacities for Improved Market Access (to
allow farmers to increase profits through the sale of surplus food crops and other tradable
commodities);
• Pillar 3: Increased Food Supply and Reduced Hunger (to address the immediate need for
food security by increasing local production and providing safety nets for emergencies); and
• Pillar 4: Agricultural Research and Technology Dissemination and Adoption (to support the
other three pillars and the long-term success of African agriculture).
On the premise that “African agriculture has for long been starved for investment”
(NEPAD 2002, 12), a central purpose of CAADP was to stimulate a dialogue—among African
governments and between African governments and external donors and private investors—
concerning the levels and possible sources of investment needed to fund the four pillars. The
report contains several estimates on these points, including one that a total of $251 billion is
required, from public and private sources, to fund all pillars over the immediate, short, and
medium terms (through 2015)—an average of about $25 billion per year (NEPAD 2002, 106,
table 2).
In July 2003, the heads of state and government of the African Union met in Maputo,
Mozambique, where they issued the Declaration on Agriculture and Food Security in Africa
(commonly referred to as the Maputo Declaration), which embraces CAADP and calls for its
implementation “as a matter of urgency,” declaring:
To this end, we agree to adopt sound policies for agricultural and rural
development, and commit ourselves to allocating at least 10% of national
budgetary resources to their implementation within five years. (African Union
2003, 2)

Investing in Africa’s Future Final Report
10
For countries that had long not emphasized agriculture in their development strategies,
this public promise of policy reform and commitment of resources, within the NEPAD
framework, marks a real departure. Delivering on the Maputo Declaration would go a long way
toward agriculture’s realizing its key role in Africa’s development.
International Institutions
The central role of agriculture in driving development and in reducing poverty and hunger in
Africa also is recognized at the international level. Supporters include the U.N. Millennium
Project; the World Bank, in its rural development strategy; and specialized bodies that focus on
agriculture, including FAO and International Fund for Agricultural Development (IFAD).
Millennium Development Project
In September 2000, the members of the U.N. General Assembly adopted the U.N. Millennium
Declaration, pledging, “We will spare no effort to free our fellow men, women and children from
the abject and dehumanizing conditions of extreme poverty, to which more than a billion of them
are currently subjected” (U.N. 2000, 2).
This commitment triggered the adoption of the eight MDGs in September 2001 as part of
the road map for implementing the Millennium Declaration. The MDGs address the basic
development sectors of health, education, and the environment, but the first goal on the list is to
“eradicate extreme poverty and hunger”—specifically, to reduce by half by 2015 the number of
people who live on less than one dollar a day and are hungry (World Bank 2004).
In response to a charge by the secretary general to develop concrete plans for achieving
the MDGs, in January 2005 the U.N. Millennium Project issued a report entitled Investing in
Development (U.N. Millennium Project 2005b) and the final report of the Millennium Project
Task Force on Hunger (U.N. Millennium Project 2005a). Both documents have a special focus
on sub-Saharan Africa and tightly link hunger alleviation with poverty reduction and agricultural
improvements. For example, Investing in Development focuses on the prevalence of hunger
among smallholder farmers and their families, especially in sub-Saharan Africa. It puts rural
development—specifically, “increasing food output and incomes”—at the top of its list of
“priority public investments to empower poor people,” calling for a “Twenty-First Century
African Green Revolution” (U.N. Millennium Project 2005b, 25–28).

Investing in Africa’s Future Final Report
11
Likewise, Africa and agriculture are at the center of the Task Force on Hunger’s in-depth
analysis and its recommendations for how to reach the hunger reduction goal. The task force
notes that sub-Saharan Africa is the one region where hunger and its consequences appear to be
getting worse rather than better, and most of its recommended solutions center on building a
more productive, market-oriented agricultural system. It calls for an enabling policy environment
for agriculture that improves the productivity of food-insecure farmers, increases access to
markets, and maintains the natural resources base for agriculture.
The Task Force on Hunger also emphasizes the need for public investment in such areas
as agricultural research, extension, and market infrastructure. Endorsing the Maputo Declaration
on Agriculture and Food Security in Africa, it recommends that “African governments invest at
least 10% of their budget specifically on agriculture and the public goods needed for agriculture
to develop—in addition to the needed investments in rural energy, infrastructure, health,
education, and other rural sectors” (U.N. Millennium Project 2005a, 89).
The agriculture message of the Task Force on Hunger is fully in line with what African
leaders have said: Investments and policy changes that increase agricultural productivity and link
farmers to markets are keys to reducing poverty and hunger.
The World Bank’s Rural Development Strategy
The World Bank, whose mission is “to fight poverty and improve the living standards of people
in the developing world,” initiated a review of its rural development strategy in 2000 and issued
Reaching the Rural Poor in 2003. Recognizing that “three out of every four of the world’s poor
live in rural areas” and embracing the U.N.’s MDGs, the bank declared that the MDGs “will be
met only through increases in rural incomes” and, furthermore, that “in most of the poorest
developing countries agriculture is the main source of rural economic growth. That is why
improved agricultural productivity and growth are central to the Bank’s strategy for reducing
poverty” (World Bank 2003, Executive Summary).
These statements signify an important reversal for the World Bank, whose investment in
agriculture had declined sharply from more than 30% of total lending in the early 1980s to just
8% in 2001, a new low in both absolute and percentage terms. Now, to cut poverty and hunger in
accordance with the MDGs, “agriculture must be put on top of the development agenda—but
‘business as usual’ will not suffice” (World Bank 2003, 40).
Investing in Africa’s Future Final Report
12
The World Bank’s strategy for agriculture embodies the same commitment to increasing
productivity and improving market linkages as the Task Force on Hunger and outlines several
new activities that it will focus on “enhancing agricultural productivity and competitiveness,”
including:
• supporting the intensification and diversification of production, with a focus on high-value
products;
• encouraging, through demand-driven extension services, more efficient use of water and
other inputs;
• reducing post-harvest losses;
• improving food quality and safety;
• strengthening farmer-to-market linkages; and
• supporting the development of physical and services infrastructure.
The World Bank also emphasizes an enabling policy environment and institutional
framework for broad-based and sustainable rural growth that includes a heavy emphasis on trade
policy reform (at both global and developing-country levels), good governance in developing
countries, and rural financial services. All of these features are intended to make markets work
for the poor.
The FAO and IFAD
The two U.N. agencies that specialize in food security and agricultural development have long
promoted the link between agriculture and welfare of the rural poor and thus are important
supporters of the new emphasis on agriculture’s role in reducing poverty and hunger in Africa.
The FAO mission is to “help build a food-secure world for present and future
generations,” which is pursued in large part by supporting agricultural development (FAO 1999).
Like the Task Force on Hunger and the World Bank, FAO links food insecurity with poverty and
sees sustainable, agriculture-led economic growth as a key to solving both problems. One of
FAO’s principal strategic objectives is “contributing to the eradication of food insecurity and
rural poverty,” which it pursues by supporting the development of income-generating
agricultural activities. It assists in targeting public and private agricultural investment in ways

Investing in Africa’s Future Final Report
13
that promote food security and poverty eradication, build human capacity, and ensure equitable
access to the natural resources and other assets that the rural poor and disadvantaged need to
succeed.
Similarly, IFAD has pursued its mission “to enable the rural poor to overcome their
poverty” by supporting agricultural and rural development since 1977 (IFAD n.d). In its overall
strategic framework for 2002–2006, IFAD focuses on empowering the poor to acquire the
personal, social, economic, and governance assets they need to overcome poverty and succeed in
the agriculture-based economies in which they live (IFAD 2001). The IFAD strategic
frameworks targeted specifically at sub-Saharan Africa also recognize and support the need to
build the market linkages and infrastructures that are essential to rewarding (and providing
incentives to generate) increased production, which in working markets can provide immediate
food security and generate the income to overcome poverty.
The United States and African Agriculture
The United States fully supports the central role of African agriculture in the continent’s
development in the words of its leaders and in new development initiatives. Like every aspect of
U.S. development and foreign policy, however, this fact must be understood in the context of
September 11, 2001, and the U.S. effort to combat terrorism and the conditions that foster it.
Even before September 11, President George W. Bush made clear his interest in
combating global poverty, telling a World Bank audience on July 17, 2001, that “a world where
some live in comfort and plenty while half of the human race lives on less than $2 a day is
neither just nor stable” (Bush 2001). President Bush also appointed Andrew S. Natsios as
administrator of USAID—a man who, from long development experience in Africa and
elsewhere, is passionately committed to reducing poverty and believes in agriculture’s central
role in that endeavor.
In his confirmation hearing on April 25, 2001, Natsios cited his personal experience in
witnessing how agricultural reconstruction had restored communities in Mozambique since civil
war just over a decade before. The administrator-designate also explained his view of
agriculture’s role in development more broadly—a view totally aligned with the global
recognition of agriculture’s role in Africa—and put down a marker for change in the USAID
program:

Investing in Africa’s Future Final Report
14
Without economic growth no development is ultimately sustainable. I would like
to focus more of USAID’s resources on economic development to reduce poverty
and on agricultural development to reduce hunger and malnutrition. … For much
of the third world, economic growth and poverty reduction are synonymous with
agriculture since 75 percent of the world’s poor live in rural areas. All countries
that have graduated from the third to the first world have begun with their
agricultural sectors. The last fifteen years have not been good to agriculture
programs in USAID: agricultural development funding has declined from $1.2
billion in 1985 to $300 million this year. In 1985, USAID had 258 agricultural
scientists and agricultural economists, when I left the first Bush Administration
that had declined to 183, now there are only 48 left. I believe this situation must
be reversed. (Natsios 2001b)
Two weeks later, when he presented the Bush administration’s first USAID budget to
Congress, Administrator Natsios affirmed his and the administration’s embrace of agriculture by
naming “Economic Growth and Agriculture” as one of three program pillars supporting
USAID’s development strategy. He declared, “Without economic growth and food security, no
development effort is sustainable. We will increase support for economic growth and agriculture
programs that reduce poverty and hunger, while finding better ways to mobilize and partner with
the private sector” (Natsios 2001a).
Five months later, the events of September 11 transformed the way many Americans look
at the world and dramatically heightened awareness of the link between development and U.S.
national security interests. One of the Bush administration’s responses was its proposal to
establish the Millennium Challenge Account (MCA) as a vehicle for substantially increasing and
better targeting development assistance. President Bush personally unveiled the proposal in a
March 14, 2002, speech at the Inter-American Development Bank, the week before the
International Conference on Financing for Development was to be held in Monterrey, Mexico.
He directly linked development and national security:
This growing divide between wealth and poverty, between opportunity and
misery, is both a challenge to our compassion and a source of instability. We must
confront it. We must include every African, every Asian, every Latin American,

Investing in Africa’s Future Final Report
15
every Muslim, in an expanding circle of development. … The advance of
development is a central component of American foreign policy. … We work for
prosperity and opportunity because they’re right. … We also work for prosperity
and opportunity because they help defeat terror. (Bush 2002)
The president said the MCA would be used to, among other things, assist African export
trade and “apply the power of science and technology to increase harvests where hunger is
greatest.” During a press briefing at the Monterrey conference, Administrator Natsios
reemphasized the importance of investing in agriculture: “One of the commitments of the Bush
administration, Secretary Colin Powell, and President Bush is to reinvest in the agricultural
sector because [it] is absolutely essential for economic growth over the long term” (Natsios
2002).
In September 2002, at the World Summit on Sustainable Development in Johannesburg,
South Africa, the United States unveiled the centerpiece of its strategy to better support African
agriculture: the President’s Initiative to End Hunger in Africa (IEHA). Intended to help fulfill the
MDG hunger-reduction goal and reduce African dependence on food aid, IEHA “focuses on
promoting agricultural growth and building an Africa-led partnership to cut hunger and poverty.
The primary objective of the initiative is “to rapidly and sustainably increase agricultural
growth and rural incomes in sub-Saharan Africa” (emphasis in original) (U.S. Department of
State/USAID 2003).
Testifying before the House International Relations Committee on April 1, 2003, Under
Secretary of State Alan P. Larson summed up the importance of food security to U.S. national
interests: “Food security is a serious foreign policy concern that profoundly threatens human
health, economic prosperity and political stability.” He also underscored the critical role of
African agriculture in addressing it: “We must increase agricultural productivity, especially in
Africa, to give Africans a chance to leave the poverty that are both a cause and an effect [of]
hunger and malnutrition” (Larson 2003).
International Consensus on Financing for Development
In addition to recognizing and supporting the role of agriculture in Africa’s development, the
United States and the international community have agreed on a set of principles for financing

Investing in Africa’s Future Final Report
16
development that are relevant to this report’s examination of agricultural development assistance
for Africa.
In 2002, the nearly 200 countries gathered at the International Conference on Financing
for Development in Monterrey, Mexico, agreed on the Monterrey Consensus, a statement of
principles for marshaling the resources required to “eradicate poverty, achieve sustained
economic growth and promote sustainable development” (U.N. 2002, 2). The principles are
organized around four main goals:
• Mobilize domestic financial resources for investment: highlighting the need for
developing countries to take responsibility for their own development by establishing good
governance, adopting sound economic policies, and investing their own resources in the
physical and social infrastructure and services required for development.
• Mobilize international resources for foreign direct investment and other private
investment flows: calling for action by both developing countries and the broader
international community to foster the conditions necessary for increased private investment,
which is an essential component of financing for development.
• Use international trade as an engine for development: recommending a host of measures
to create trade rules and develop trading capacity in recognition of the fact that trade can be
the largest external generator of financing for development.
• Increase international financial and technical cooperation for development: emphasizing
the essential role played by official development assistance in financing development in the
least-developed countries, calling for significant improvement in the level and quality of
official development assistance and recipient-country ownership of the development process,
and citing Africa’s NEPAD initiative as a model to be supported.
The Monterrey Consensus also cites the need for debt relief and greater coherence and
consistency in the international monetary, financial, and trading systems as keys to achieving
adequate and effective financing for development. The Monterrey principles are in line with the
approaches to mobilizing resources agreed to by African leaders in the original 2001 NEPAD
compact and are a sound framework within which to examine and understand U.S. assistance for
African agriculture.

Investing in Africa’s Future Final Report
17
Conclusion
The recent shifts in thinking and broad agreement on agriculture’s role in Africa are important.
They provide the impetus and a framework for making the investments from internal and
external sources that are necessary to support agricultural development and economic growth.
The road ahead in fulfilling Africa’s potential is long, however, and any investment strategy
must take a commensurately long view. The balance of this report focuses on examining where
one participant in this investment strategy—the United States—stands today.

Investing in Africa’s Future Final Report
18
References
African Union. 2003. Declaration on Agriculture and Food Security in Africa. July 10–12.
http://www.africa-union.org/Official_documents/Decisions_Declarations/Assembly%20fi
nal/Decl%20on%20the%20Agriculture%20and%20Food%20Security%20Maputo%2020
03.pdf (accessed March 23, 2005).
Bush, George W. 2001. Remarks by the President to the World Bank. July 17. http://www
.whitehouse.gov/news/releases/2001/07/20010717-1.html (accessed March 23, 2005).
Bush, George W. 2002. Remarks by the President on Global Development, Inter-American
Development Bank, Washington, D.C. March 14. http://www.whitehouse.gov/
news/releases/2002/03/20020314-7.html (accessed March 24, 2005).
Eicher, Carl K. 2003. Flashback: Fifty Years of Donor Aid to African Agriculture. Presented at
Successes in African Agriculture: Building for the Future, Pretoria, South Africa, Dec. 1–
3. http://www.ifpri.org/events/conferences/2003/120103/papers/paper16.pdf (accessed
March 23, 2005).
FAO (Food and Agriculture Organization of the United Nations). 1996. World Food Summit
Home Page. http://www.fao.org/wfs/index_en.htm (accessed March 23, 2005).
FAO. 1999. The Strategic Framework for FAO, 2000–2015. Available from http://www.fao.org
/documents/show_cdr.asp?url_file=/docrep/x3550e/x3550e00.htm (accessed March 23,
2005).
FAO. n.d. FAO Home Page. http://www.fao.org/ (accessed April 2, 2005).
IFAD (International Fund for Agricultural Development). 2001. Enabling the Rural Poor to
Overcome Their Poverty: Strategic Framework for IFAD 2002–2006. Rome, Italy.
http://www.ifad.org/sf/SFeng.pdf (accessed April 5, 2005).
IFAD. n.d. IFAD Home Page: Enabling the Poor to Overcome Poverty. http://www.ifad.org/
(accessed March 23, 2005).
Larson, Alan P. 2003. Testimony before the House International Relations Committee,
Washington, D.C. April 1. http://www.state.gov/e/rls/rm/2003/19346.htm (accessed
March 24, 2005).

Investing in Africa’s Future Final Report
19
Natsios, Andrew S. 2001a. Testimony before the Senate Appropriations Committee
Subcommittee on Foreign Operations. May 8. http://www.usaid.gov/press/spe_test/
testimony/2001/ty010508.html (accessed March 24, 2005).
Natsios, Andrew S. 2001b. Testimony before the U.S. Senate Committee on Foreign Relations.
April 25. http://www.usaid.gov/press/spe_test/testimony/2001/an_conf_stmt.html
(accessed March 23, 2005).
Natsios, Andrew S. 2002. Press Briefing at Monterrey Conference, Monterrey, Mexico, March
21. http://www.usaid.gov/press/spe_test/speeches/2002/sp020321.html (accessed March
24, 2005).
NEPAD (New Partnership for African Development). 2002. Comprehensive Africa Agriculture
Development Programme. November. http://www.sarpn.org.za/documents/d0000488/
CAADP.pdf (accessed March 23, 2005).
PCHPA (Partnership to Cut Hunger and Poverty in Africa). 2002. Now Is the Time: A Plan to
Cut Hunger and Poverty in Africa. Available from http://www.africanhunger.org/
?location=view,article&id=55 (accessed March 23, 2005).
U.N. (United Nations). 2000. Resolution Adopted by the General Assembly: United Nations
Millennium Declaration. Sept. 18. http://www.un.org/millennium/declaration/
ares552e.pdf (accessed March 23, 2005).
U.N. 2002. Report of the International Conference on Financing for Development. Monterrey,
Mexico, 18–22 March, 2002. http://www.un.org/esa/ffd/aconf198-11.pdf (accessed
March 28, 2005).
U.N. 2004. Executive Summary. In A More Secure World: Our Shared Responsibility, a Report
of the High-Level Panel on Threats, Challenge, and Change.
http://www.un.org/secureworld/brochure.pdf (accessed April 3, 2005).
U.N. Millennium Project. 2005a. Halving Hunger: It Can Be Done. Task Force on Hunger. New
York. Available from http://www.unmillenniumproject.org/reports/reports2.htm#01
(accessed March 24, 2005).
U.N. Millennium Project. 2005b. Investing in Development: A Practical Plan to Achieve the
Millennium Development Goals. New York. Available from
http://www.unmillenniumproject.org/reports/index.htm (accessed March 24, 2005).

Investing in Africa’s Future Final Report
20
U.S. Department of State/USAID (U.S. Agency for International Development). 2003. Fact
Sheet: Initiative to End Hunger in Africa. March 18.
http://www.state.gov/g/oes/rls/fs/2003/18796.htm (accessed March 29, 2005).
UNECA (U.N. Economic Commission for Africa). 2001. NEPAD: The New Partnership for
Africa’s Development. October. http://www.uneca.org/eca_resources/Conference_
Reports_and_Other_Documents/nepad/nepad.pdf (accessed March 28, 2005).
World Bank Group. 2003. Reaching the Rural Poor: A Renewed Strategy for Rural
Development. Washington, DC: International Bank for Reconstruction and
Development/World Bank. http://www-wds.worldbank.org/servlet/WDSContentServer/
WDSP/IB/2003/10/03/000094946_03092504152762/Rendered/PDF/multi0page.pdf
(accessed March 24, 2005).
World Bank Group. 2004. Millennium Development Goals: About the Goals. September.
http://www.developmentgoals.org/About_the_goals.htm (accessed March 23, 2005).

Investing in Africa’s Future Final Report
21
2
Institutional and Policy Landscape
Development assistance for agriculture and other purposes is a component of American foreign
policy and the overall national security program of the United States. The Bush administration
has elevated the role of development and integrated it into its National Security Strategy. As
then-National Security Advisor Condoleezza Rice explained, “Development assistance is one of
our three Ds: Diplomacy, Development, and Defense” (USAID 2004a, 23).
Development assistance is also a creature of domestic politics. Its scale and composition
are heavily influenced by the U.S. Congress, which shapes development assistance to a large
extent in response to pressures from U.S. economic and social interest groups. These domestic
interests help explain many features of the U.S. food aid program; the focus of development
assistance on health, education, and other social sectors with strong U.S. constituencies; and a set
of policies that channel a large portion of U.S. assistance dollars to United States-based vendors.
This grounding of international development assistance in national security policy and
domestic politics makes governance of the program enormously complex. A detailed analysis of
the political economy of development assistance is beyond the scope of this report, but to
understand U.S. agricultural development assistance to Africa, an overview of the many
government institutions that are involved and the roles they play is essential. In this chapter, we
provide that overview and, in so doing, give some perspective on the political forces that shape
agricultural development assistance.
Because USAID administers about 75% of all U.S. development assistance and the great
preponderance of agricultural assistance, we treat it in greater detail than other agencies.
However, USAID’s activities cannot be understood without also considering the roles of
Congress, the White House, and the Department of State in shaping the USAID program.
Other U.S. agencies play roles of varying importance in this arena, including the U.S.
Department of Agriculture’s (USDA) Foreign Agricultural Service (FAS), the U.S. Trade and
Development Agency (TDA), and the African Development Foundation (ADF). The agricultural
assistance roles of these agencies are described here. The Millennium Challenge Corporation

Investing in Africa’s Future Final Report
22
(MCC), the important new development institution created to administer the Millennium
Challenge Account (MCA), is likely to become a significant force in agricultural development in
Africa and elsewhere and thus also is discussed in this chapter.
The relevant institutional landscape is not limited to domestic agencies. Through the
Departments of Treasury and State, the United States contributes to multilateral institutions that
play important roles in African agricultural development: the World Bank, the United Nations’
FAO, the World Food Programme (WFP), the IFAD, and the African Development Bank
(ADB). The roles of these institutions and how they relate to U.S. bilateral assistance for
agriculture are described briefly in this chapter.
The complexity of the institutional landscape is not unique to foreign assistance; it is a
common feature of government programs that evolve over time in response to changing social
and political pressures and circumstances. As in other arenas, the involvement of multiple
institutions in agricultural development assistance contributes to the fragmentation of efforts and
raises issues of coordination that can affect the ability to achieve public investment in African
agricultural development that is coherent and cumulatively beneficial.
Congress
Whereas the U.S. Constitution vests in the president the power to make treaties, appoint
ambassadors, and conduct the day-to-day foreign affairs of the United States, Article I gives
Congress extensive authority in foreign affairs, grounded in its broad legislative powers and its
constitutional responsibility to “provide for the common Defence [sic] and general Welfare of
the United States,” declare war and raise armies, and regulate foreign commerce. Equally
important, Congress has the power of the purse: It ultimately controls how the government
spends its money.
Congress makes full use of its powers to shape foreign development assistance through
substantive legislation—principally the Foreign Assistance Act (FAA) of 1961 (FAA, P.L. 87-
195)—and the appropriations process. In so doing, Congress provides the president and USAID
with extensive guidance on policy and largely directs resource allocation for development
assistance.

Investing in Africa’s Future Final Report
23
The Legislative Framework for Agricultural Development Assistance
Foreign Assistance Act of 1961
Although the post-World War II Marshall Plan was widely applauded as a development success,
public support for foreign aid eroded during the 1950s and became an issue in the 1960
presidential election. President John F. Kennedy responded with the Alliance for Progress and
support for enacting the FAA, which authorized the creation of USAID, created new funding
mechanisms for development assistance, and recognized the need for country-by-country
planning and the long-term programming of development resources.
Objectives and Principles
In 1973 and 1978, Congress amended the FAA to articulate development objectives and
principles and to establish the funding authorizations for development assistance that remain in
effect today.3 Citing the “interdependence of nations” and the “traditional humanitarian ideals of
the American people,” Congress declares in the FAA that a principal objective of American
foreign policy is “the encouragement and sustained support of the people of developing countries
in their efforts to acquire the knowledge and resources essential to development and to build the
economic, political, and social institutions which will improve the quality of their lives” (FAA,
Sec. 101).
To achieve this objective, the FAA establishes five major goals of United States
development cooperation policy:
• To alleviate the worst physical manifestations of poverty among the world’s poor majority;
• To promote conditions that enable developing countries to achieve self-sustaining economic
growth with an equitable distribution of benefits;
• To encourage development processes in which individual civil and economic rights are
respected and enhanced;
• To integrate developing countries into an open, equitable international economic system; and
3 Foreign Military Sales and Assistance Act of 1973 (P.L. 93-189) and the International Development and Food Assistance Act of 1978 (P.L. 95-88).

Investing in Africa’s Future Final Report
24
• To promote good governance by combating corruption and improving transparency and
accountability.
The FAA also enunciates 17 principles to govern development assistance in pursuit of
these goals (FAA, Sec. 102). For example:
• Development is primarily the responsibility of the people of the developing countries
themselves, and U.S. assistance should support local “self-help” and grassroots involvement
through democratic processes.
• Assistance “shall be concentrated in countries which will make the most effective use of such
assistance to help satisfy basic human needs of poor people through equitable growth.”
• U.S. assistance should support the development goals and capacity-building needs of the host
government while giving priority to efforts that help the poorest citizens and the sectors that
affect the most people (of which “food production and nutrition” and “rural development”
are the first two listed).
Authorization of Appropriations for Agricultural Development Assistance
Besides establishing goals and broad principles for development assistance in general, the FAA
provides congressional authorization for appropriations in numerous specific sectors and areas of
interest, ranging from broad assistance categories (Agriculture, Rural Development, and
Nutrition; Population and Health; Education and Human Resources; and Environment and
Natural Resources) to more targeted ones (Micro- and Small Enterprise, Integrating Women into
National Economies, Tropical Forests, and Endangered Species) (FAA, secs. 103–120).
The FAA’s authorization of assistance for Agriculture, Rural Development, and Nutrition
(FAA, Sec. 103) broadly authorizes assistance to address hunger and malnutrition; expand
services that the rural poor need “to enhance their capacity for self help”; and improve the
incomes of the rural poor by creating productive employment, on and off the farms, and a more
viable economic base in rural communities. It provides that assistance “shall be used primarily
for activities which are specifically designed to increase the productivity and incomes of the rural
poor,” and the law identifies a wide range of possibilities, including rural finance, rural
infrastructure and utilities (including farm-to-market roads, water management systems, land

Investing in Africa’s Future Final Report
25
improvement, energy, and storage facilities), more secure land tenure arrangements, marketing
facilities and systems, and the array of services and inputs needed to increase farmers’
productivity.
The FAA calls specifically for enhancing the productivity of small farmers to expand the
production and availability of food in the rural areas of the world’s poorest nations, which it says
is “a matter of social justice and a principal element contributing to broadly based economic
growth.” In this context, the FAA specifically encourages developing country efforts to improve
food security and directs bilateral assistance under the FAA and food aid programs to emphasize
policies and programs that increase food security.
Development Fund for Africa
As the Cold War wound down in the 1980s, so did politically motivated economic assistance for
Africa. Congressional supporters of African development responded in 1990 by adding a new
Chapter 10 to the FAA, establishing the Development Fund for Africa (DFA) as a long-term
funding vehicle. The declared purposes of DFA were to “help the poor majority of men and
women in sub-Saharan Africa to participate in a process of long-term development through
economic growth that is equitable, participatory, environmentally sustainable, and self-reliant”
and to encourage private-sector and individual initiatives while “helping to reduce the role of
central governments in areas more appropriate for the private sector” (FAA, Sec. 496).
In establishing the DFA, Congress provided that the development program for Africa
should focus on “critical sectoral priorities,” including agricultural production, natural resources,
health, and education. It also ensured that the program addresses sectoral economic policy
reform and strengthen democratization and capabilities for conflict resolution.
Through FY1995, Congress earmarked appropriations for DFA. Since then,
appropriations for development in Africa and other regions have been made through two broadly
applicable funding programs or accounts—Development Assistance (DA) and Child Survival
and Health (CSH)4—and Congress no longer uses the DFA as a distinct funding vehicle for
Africa. DFA’s authorizing language and policy direction remain in effect, however, and
Congress continues to cite Chapter 10 together with the other relevant authorizing provisions
when it appropriates funds for agriculture and other development assistance in Africa.
4 Before FY2002, the CSH program was called Child Survival and Disease.

Investing in Africa’s Future Final Report
26
Other Africa-Specific Measures
Since DFA ceased to be a distinct vehicle for appropriations, Congress has passed two measures
that reaffirm its belief in the importance of African agriculture and rural development. In the
Africa Seeds of Hope Act of 1998, Congress declared that the “economic, security, and
humanitarian interests of the United States and the nations of sub-Saharan Africa would be
enhanced by sustainable, broad-based public and private sector agricultural and rural
development in each of the African nations” and that U.S. policy supports such development.
(H.R. 4283, P.L. 105-385). The act called on USAID and other agencies to focus on food
security, microenterprise assistance, and other efforts to achieve sustainable, market-oriented
agricultural and rural development.
In 2002, Congress passed the Africa Hunger to Harvest Resolution, which called on the
president to develop 5- and 10-year strategies “to achieve a reversal of current levels of hunger
and poverty in sub-Saharan Africa” (H. Con. Res. 102, March 8, 2002). The strategies were to
include emphasis on strengthening agriculture, from the subsistence level to the global
agricultural market level, and investment in infrastructure and rural development. These
measures were the product of an active coalition of non-governmental organizations (NGOs) led
by Bread for the World, which has successfully kept the issue of African agriculture and rural
development before Congress and elicited steady congressional support for the ideas underlying
the new global recognition of how agriculture can lead economic growth in Africa.
Food Aid Statutes
In addition to development assistance activities authorized and funded under the FAA, food aid
is a major vehicle for agricultural development assistance in Africa. Congress has authorized and
funds food aid programs that are used for this purpose through three primary statutes. Like the
FAA, these statutes set the broad policy and spell out many of the details of how the programs
are managed.
Investing in Africa’s Future Final Report
27
P.L. 480
P.L. 4805 is shorthand for the Agricultural Trade Development and Food Assistance Act of 1954,
which initially authorized and now governs three U.S. food aid programs, known collectively as
the Food for Peace Program. The largest of these programs and the most important one for
agricultural development purposes is the P.L. 480, Title II program, or Title II for short.
Administered by USAID, Title II is named after the provisions of P.L. 480 that authorize
Emergency and Private Assistance Programs.
As its name implies, Title II is intended to address both emergencies (i.e., famine,
immediate malnutrition, and other extraordinary relief needs) and long-term development, which
includes attacking the causes of hunger and promoting “economic and community development”
and “sound environmental practices” (P.L. 480, Sec. 201). In the 1990 Farm Bill,6 Congress
amended P.L. 480 to establish food security as the primary objective of Title II and called for the
use of agricultural commodities to, among other things, “combat world hunger and malnutrition
and their causes” and “promote broad-based, equitable, and sustainable development, including
agricultural development” (P.L. 480, Sec. 2).
Title II is funded by specific, annual appropriations that are used to purchase food
commodities, which USAID then gives to other agencies and organizations to carry out
emergency feeding and development programs. The majority of Title II food aid is used for
development purposes, rather than direct feeding, and agricultural development is a major focus.
Development food aid is given primarily to private voluntary organizations (PVOs) that work
with USAID as cooperating sponsors of food aid projects based on the detailed Development
Activity Program proposals they submit to the agency. As authorized by Congress, the PVOs
commonly sell (or monetize) most or all the food in the country in which they are working and
use the local currency proceeds to finance their development programs. In some cases, PVOs
distribute the food directly to local people working on food-for-work development projects.
Congress not only sets the broad goals and operating framework for the Title II program
but also prescribes the minimum annual tonnage of commodities to be purchased for the
program, the procedures for purchasing and shipping the commodities overseas (requiring that
75% of the annual tonnage be shipped on U.S.-flag vessels), the form in which commodities are 5 The Agricultural Trade Development and Food Assistance Act of 1954 was enacted by the 78th Congress as P.L. 83-480, which has been shortened in common usage to P.L. 480.

Investing in Africa’s Future Final Report
28
shipped (requiring at least 75% in a value-added form and at least 50% of the bagged commodity
being bagged in the United States), conditions for monetizing the commodities, and the
development purposes for which the resources can be used. Title II also provides in Section
202(e) that no less than 5% or more than 10% of the funds appropriated annually for Title II shall
be paid directly to the food aid PVOs to meet their own food aid-related institutional needs.
Agricultural Act of 1949, Section 416(b)
In Section 416(b) of the Agricultural Act of 1949 as amended, Congress authorizes the donation
of commodities owned by USDA’s Commodity Credit Corporation (CCC) for development
assistance purposes. The CCC acquires surplus commodities through its domestic price support
operations and is authorized to donate them to carry out the development purposes of P.L. 480 as
well as the Food for Progress Act and its programs (discussed later), as long as the remaining
supplies are adequate to meet domestic needs and normal export marketing of the commodity
would not be adversely affected. Because the amount of food available under 416(b) depends on
price and supply conditions in the U.S. marketplace and the level of stocks CCC owns, donations
for food aid purposes can vary widely from year to year.
Like Title II food aid, Section 416(b) commodities can be given to PVOs under
agreements that spell out the development purposes for which they can be used. Some but not all
food donated under Section 416(b) is used for agricultural development purposes. Section 416(b)
is administered by FAS.
Food for Progress Act of 1985
In the Food for Progress Act of 1985 (P.L. 99-198), Congress provided a separate authorization
for CCC to make food commodities available to foreign governments or PVOs by grant or sale
for development purposes in countries that “have made commitments to introduce or expand free
enterprise elements in their agricultural economies.” The CCC is also authorized to finance
shipping expenses and other costs associated with food aid programs.
Unlike Title II, the Food for Progress Act provides little guidance on how resources are to
be used; however, its underlying purposes are to encourage open international markets for
agricultural commodities and to develop potential markets for U.S. exports. The resources
6 The Agricultural Development and Trade Act of 1990 (P.L. 101-624).
Investing in Africa’s Future Final Report
29
typically are used for agricultural development purposes. Food for Progress is implemented by
FAS.
The Legislative Message on Agriculture
In the FAA, Congress has made agriculture and food security high priorities for development
assistance within a framework focused on economic development to benefit the very poor—a
framework that is quite consistent with the new recognition and understanding of agriculture’s
role in Africa outlined in Chapter 1. The FAA stresses self-help and economic growth more than
relief. Moreover, in its Section 103 authorization for agricultural assistance, the FAA calls for
not only increasing the productivity of smallholders but also building the array of market
infrastructures and services that are essential if enhanced productivity is to produce higher
incomes for the rural poor. Congress also singles out Africa as a focal point for development
assistance in its Chapter 10 authorization of DFA and calls agriculture a critical sector.
Title II of P.L. 480, as amended in 1990 to focus more acutely on food security, also
gives first-order importance to agriculture. Agricultural improvements are vital to increasing
locally available food stocks to meet food security needs in the short term, but Title II also links
broad-based and sustainable development—specifically agricultural—to hunger prevention and
long-term food security.
Together, these two statutes authorize nearly all bilateral U.S. development assistance for
African agriculture. They represent mainstream current thinking about the role agriculture can
play in reducing poverty and hunger in Africa, including the need to pursue a long-term, market-
oriented approach to development and investment that will fulfill agriculture’s potential.
Congressional Earmarks and the Appropriations Process
As extensive as the congressional direction in authorizing legislation may be, the more direct,
day-to-day involvement of Congress in the country’s development assistance program comes
through the appropriations process. The federal budget process is complicated and involves
elaborate interaction between the executive branch and the Congress. As is often said, however,
“The president proposes, but Congress disposes.”
The key congressional units for decision-making on resource allocation for development
assistance are the House and Senate foreign operations subcommittees of the Committee on

Investing in Africa’s Future Final Report
30
Appropriations in each body, which have jurisdiction over the budget of USAID, among other
agencies.7 The foreign operations subcommittees are not completely free agents. Like all
appropriations subcommittees, they work within budget allocations that are generated initially by
the budget committees of each house and adopted by Congress as a whole in the annual
Concurrent Budget Resolution. These allocations are passed along through the Committee on
Appropriations to each of 13 subcommittees as a committee allocation, which sets a practical
limit on the total amount the subcommittee has to allocate among the programs under its
jurisdiction. Within their budget allocations, however, the foreign operations subcommittees
have broad discretion to set budget priorities and spending levels for specific programs and to
attach conditions to the spending of appropriated funds. Decisions of the subcommittees must be
ratified at the committee level and included in the foreign operations appropriations bills
ultimately passed by Congress—and they usually are.
In the case of the USAID budget, Congress appropriates funds across a complex series of
budget accounts that cover both agency program activities and operating expenses. The
subcommittees make decisions about resource allocation among and within these accounts. In
considering their budget decisions, the subcommittees work initially from a detailed budget
proposal and budget justification that are prepared by USAID in conjunction with the
Department of State and the Office of Management and Budget (OMB) in the White House
(discussed below). The USAID Congressional Budget Justification is forwarded to Congress as
part of the president’s annual budget submission.8 The USAID proposal includes not only
proposed total spending in each congressional budget account but also the intended resource
allocation within those budget accounts.
The appropriations subcommittees make both macro- and micro-level decisions about
how USAID spends its money, and they express those decisions with differing levels of
formality. The macro-level decisions include how resources are allocated across the budget
accounts and major allocations among programs within the accounts; these decisions are
7 More formally, the House Subcommittee on Foreign Operations, Export Financing, and Related Programs (chaired by Rep. Jim Kolbe [R–Arizona]) and the Senate Subcommittee on Foreign Operations (chaired by Sen. Mitch McConnell [R–Kentucky]. The agriculture appropriations subcommittees also play roles in agricultural development assistance based on their appropriating jurisdiction over P.L. 480, Title II, as well as the other food aid programs, but their role in directing the use of development resources is modest compared with those of the foreign operations subcommittees. 8 Congressional budget justifications, posted annually on the USAID web site (USAID various years), provide a wealth of information about the USAID budget.

Investing in Africa’s Future Final Report
31
typically expressed in the legislative language of the appropriations bill itself. The micro-level
decisions involve allocations within programs or for very specific purposes; the sums may be
relatively large or quite small, and the allocations may be to specific private-sector organizations.
Some of these decisions are incorporated in the appropriations bill itself, whereas many others
are expressed in the House and Senate committee reports that accompany the annual
appropriations bill. These micro-level resource decisions are commonly known as earmarks, and
they are an important and controversial feature of the relationship between Congress and
USAID.
Of the seven major USAID program accounts, the two most relevant to understanding the
congressional role in resource allocation and the importance of earmarks for agricultural
development assistance are the accounts intended to fund long-term global development
activities: DA (which addresses all areas of long-term development besides health) and CSH (the
health account).9 One important decision that Congress must make concerns resource allocation
between the DA and CSH accounts. In the FY2005 appropriations bill, for example, Congress
provided a total of $1.46 billion for DA and $1.55 billion for CSH. Although some people might
argue for a different outcome, allocating resources across these broad categories is the kind of
policy decision that most people expect Congress to make.
Within the CSH category, Congress specifies how most of the appropriated $1.55 billion
is to be allocated among major health programs: child survival and maternal health ($345
million); HIV/AIDS ($350 million); the Global Fund to Fight HIV/AIDS, Tuberculosis, and
Malaria ($250 million); other infectious diseases ($200 million); vulnerable children ($30
million); and the Vaccine Fund ($65 million). All these programs are important. However, some
people may argue that they address a particular subset of the health challenges facing developing
countries and may or may not reflect how health professionals would deploy finite resources to
address global health concerns. Others would contend that these allocations do not occur in a
vacuum, that they reflect the input Congress received from the administration and other sources,
and that it is clearly the prerogative of Congress to make spending decisions of this kind.
9 The other accounts address short-term humanitarian needs, are geographically focused, or serve primarily foreign policy rather than developmental interests: International Disaster and Famine Assistance, Economic Support Fund, Assistance to Eastern European and Baltic States, Assistance to Independent States of the Former Soviet Union, and Transition Initiative.
Investing in Africa’s Future Final Report
32
The congressional role goes even deeper in the DA account, which is the primary source
of funding for agricultural development assistance in the USAID budget. Many contend that the
use of earmarks in the DA account severely limits both the amount of funding available for
agriculture and USAID’s flexibility to use its DA funding in ways that will do the most good in
the agriculture sector. In the FY2005 appropriations bill, nine earmarks allocate $823.3 million
(of the $1.46 billion total appropriated for the DA account) for specific purposes. Four of these
earmarks are for substantial sums and fairly broad categories, arguably akin to the broad
allocations made within the CSH account: basic education ($300 million), trade capacity
building ($194 million), biodiversity ($165 million), and drinking water supply ($100 million).10
Other legislated DA earmarks in the FY2005 appropriations bill are smaller and more
targeted: plant biotechnology research and development ($25 million), the American Schools and
Hospitals Abroad program ($20 million), women’s leadership capacity ($15 million), the
International Fertilizer Development Center ($2.3 million), and clean water treatment ($2
million). Interestingly, in the wording of the bill, Congress uses the term shall in connection with
only two of these eight earmarks; the others say that USAID should make the prescribed amount
available. The difference between shall and should may have legal significance—one is clearly
mandatory while the other is a strong admonition—but it makes little practical difference in
USAID’s need to comply with the congressional directive to the best of its ability.
Besides these legislated earmarks, the House and Senate reports accompanying the
FY2005 appropriations bill contain about a dozen additional earmarks that allocate specific
amounts of DA funds for specific purposes, totaling about $520 million besides the $823.3
million earmarked in the bill itself. Thus, of the $1.46 billion appropriated in the DA account,
Congress has earmarked about $1.34 billion (92% of the total). In the committee reports,
Congress variously “recommends,” “urges,” “expects,” or “directs” USAID to spend the money
in the prescribed manner. Signals of this kind from appropriators must be taken seriously and
acted upon, but there is some flexibility in the system for USAID to work out internally and in
consultation with Congress what constitutes compliance with the earmark.
Some of these report language earmarks are substantial, including a House earmark for
microenterprises ($200 million), a Senate earmark for energy efficiency and renewable energy
10 Consolidated Appropriations Act, 2005 (H.R. 4818, P.L. 108-447), Division D (Foreign Operations, Export Financing, and Related Programs), Title II (Bilateral Economic Assistance/Development Assistance), and Title V (General Provisions/sec. 576 Environmental Programs).
Investing in Africa’s Future Final Report
33
sources ($180 million), and House and Senate earmarks for biodiversity ($110 million and $175
million, respectively). Others are smaller but targeted for specific purposes or recipients; for
example, House earmarks of $20 million to be spent on dairy development and $28 million to be
used for the Collaborative Research Support Programs, which are agricultural research programs
based at U.S. universities.
The committee reports also call USAID’s attention to about 100 project proposals related
to international development that have been advanced by American colleges and universities.
The committees “recommend” that these proposals receive “active consideration” by USAID,
and the Senate report “provides” $40 million to be drawn from various USAID accounts
(including DA) to fund these projects.
Finally, the report language on USAID’s FY2005 DA account contains admonitions and
recommendations that are not accompanied by recommended or directed spending levels but
have policy and resource allocation implications. For example, the House report called on
USAID to “fully fund” a certain scholarship program for technical training in Latin America,
expand microcredit for coffee cooperatives, pursue a particular coffee strategy, provide
“adequate funding” for the overseas development programs of U.S. credit unions and
cooperatives, and increase funding for rural electrification in developing countries.
At the same time, the House report “notes with concern the reductions made in the budget
request to several countries in Africa” and says, “the Committee expects USAID to restore the
cuts in African country allocations (for countries not eligible for MCC funding) to their fiscal
year 2004 levels, consistent with proper programmatic considerations.” In the next paragraph,
the committee “urges” USAID to consider specific proposals to support community-based courts
in Rwanda and training for journalists to be provided by an organization called All Africa Global
Media. The Senate report provides similar micro-level guidance to USAID, including the
endorsement of more than two dozen specific projects and NGOs carrying out development
activities. Such projects include the Peregrine Fund’s Neotropical Raptor Conservation Program
in Panama, Students in Free Enterprise (http://www.sife.org/), and Idea Village
(http://www.ideavillage.org).
Finally, the Senate committee report also states, “The Committee supports USAID’s
renewed emphasis on agriculture, as it has long believed that agricultural development is critical
Investing in Africa’s Future Final Report
34
to combating poverty. The Committee encourages a central role for these programs in USAID’s
future economic development and disaster relief strategies.”
USAID would, of course, like to comply with this last bit of guidance and strategically
deploy significant DA resources to foster agriculture-led economic growth, but it faces the hard
reality that some 92% of the DA budget is spoken for through quantitative earmarks for purposes
that are unrelated to agriculture (e.g., basic education), tangentially related to agriculture (e.g.,
microenterprises, trade capacity, and biodiversity), or intended for very specific constituency-
driven rather than strategy-driven purposes (e.g., biotechnology and dairy development).
There is no earmark for agriculture per se or for agriculture-led economic growth
strategies. USAID is thus in the position of piecing together funding for its agriculture initiatives
from a funding pool that is earmarked for other purposes and has diverse motivations. The
management of congressional earmarks is central to the overall resource allocation process at
USAID and has significant consequences for USAID’s agriculture funding and programs.
The White House and the Department of State
The White House and the Department of State are important parts of the institutional and policy
landscape for agricultural development assistance. They are far removed from the day-to-day
management that takes place at USAID and other agencies, but they have a big effect on the
overall policy directions and budget priorities that affect agricultural development assistance.
The White House
As discussed in Chapter 1, the Bush administration has made development an integral part of the
U.S. national security strategy and agriculture a key element of its development program.
President Bush has demonstrated a personal commitment to development assistance through his
sponsorship of the MCA and to agriculture as seen in the IEHA. Presidential leadership has
clearly set a positive tone and created a receptive environment for agriculture-related
development activities.
Beyond displaying presidential leadership and highlighting important issues and
priorities, the White House plays a critical institutional role: arbitrating among competing budget

Investing in Africa’s Future Final Report
35
and policy priorities through OMB and its International Affairs Division. Understandably, many
priorities compete in the development assistance arena.
In Africa, HIV/AIDS is a devastating health, social, and economic problem that affects
all aspects of life on the continent, including agriculture; President Bush has backed this personal
priority with strong funding commitments. The refugee crisis spurred by violence in Sudan’s
Darfur region is another important priority and in the wake of September 11, development and
relief priorities in other regions also compete, with Iraq and Afghanistan claiming a large share
of resources. With input from USAID, the Department of State, and the National Security
Council, OMB plays a central role in balancing these competing priorities through the annual
budget process.
The Department of State
The Department of State plays two major roles that relate to agricultural development assistance,
one at the broad policy level and one at the program management level.
As the president’s chief foreign policy advisor and representative, the secretary of state
has a strong voice in shaping development assistance to ensure that it advances the country’s
foreign policy objectives. With development assistance resources perpetually scarce, any
program area that does not fit with those objectives will have a doubly difficult time gaining
significant funding. In recent years, agriculture has had strong support at the Department of
State, especially with former Under Secretary for Economic, Business, and Agricultural Affairs
Alan P. Larson linking agricultural development to U.S. national security interests, as noted in
Chapter 1.
At the management level, the Department of State is a partner with USAID in setting
policy for and managing development programs. Though USAID is organizationally an
independent agency in the executive branch, the USAID administrator reports to and takes policy
guidance from the secretary of state. The Department of State and USAID now develop their
strategic plans jointly, which means that the Department of State must support any major
initiative that USAID wants to pursue. In the current joint strategic plan, the declared mission of
the department and USAID is to “create a more secure, democratic and prosperous world for the
benefit of the American people and the international community” (State Dept./USAID 2003, 1).

Investing in Africa’s Future Final Report
36
Promoting agricultural development is one of the four strategies cited in the plan for
achieving the goal of economic prosperity and security:
A productive agricultural sector is a critical engine for economic growth in many
developing countries, especially in Africa. It also is critical for food security,
improved nutrition and health, and environmental sustainability and security both
in developing and transition countries. … We will work with partner countries to
strengthen the operation of local, regional, and global markets in agricultural
products. (State Dept./USAID 2003, 23)
The Department of State and USAID also co-manage the largest single foreign assistance
account, the Economic Support Fund (ESF). The fund is controlled for policy purposes by the
Department of State, administered by USAID, and intended primarily to support the immediate
foreign policy and political interests of the United States rather than long-term development
priorities. Nearly half of the $2.5 billion appropriated for the ESF in FY2005 is earmarked for
Israel, Egypt, and Jordan, but some funds are available for USAID development projects in
Africa, including some related to agriculture.
Finally, the Department of State is involved in agricultural development assistance
through its Bureau of International Organization Affairs (IO), the conduit for U.S. funding of
FAO, which is the principal U.N. agency for agricultural development. The Department of State
maintains a permanent mission to the U.N. agencies in Rome, Italy, through which it maintains
liaison with and provides U.S. policy guidance to FAO as well as the other U.N. food- and
agriculture-related agencies in Rome: IFAD and WFP.
USAID
USAID is the primary development assistance agency in the U.S. government and the agency
with by far the most substantial direct involvement in agricultural development assistance. An
overview of USAID’s organization, resource allocation practices, and agricultural development
policies is thus essential to an understanding of U.S. assistance for agriculture in Africa. This
section provides that overview at a level of detail that serves the purposes of this report without
Investing in Africa’s Future Final Report
37
delving too deeply into the detailed inner workings of one of the most complex agencies in the
U.S. government.
Organization
At its headquarters in Washington, DC, USAID is organized around four regional bureaus that
oversee the agency’s field operations in more than 100 countries and three pillar bureaus that
provide global leadership and technical support to the field (Figure 2-1). These bureaus at
headquarters support 89 country-level and regional field offices of varying sizes that manage the
frontline development programs.
The following description of the USAID organizational structure focuses on the elements
that are most involved in agricultural development assistance.
Office of the Administrator
USAID is headed by an administrator who is appointed by the president, is confirmed by the
Senate, and reports to the secretary of state. The current administrator is Andrew Natsios. Like
any agency head, USAID administrators have the power to set the policy tone within the agency,
declare and pursue priority initiatives, and manage the internal processes of the agency. As a
direct report to the secretary of state and thus a member of the administration’s foreign policy
and national security team, however, the administrator is largely a broker between the career
staff and operating units of USAID on one side and the other elements of the administration and
Congress on the other. Among other important functions, the administrator leads USAID’s
participation in the internal administration budget process, where important priority and resource
allocation decisions are made. As discussed in Chapter 1, Administrator Natsios called for
increased investment in agriculture, especially in Africa, at the beginning of his tenure.
Within the Office of the Administrator, the Bureau for Policy and Program Coordination
(PPC) plays a critical role on the administrator’s behalf on policy, program, and budget issues
affecting agricultural development assistance. Most importantly, PPC manages the USAID
budget preparation process and allocates resources among USAID programs and organizational
units based on the administration’s priorities and congressional directives, including
appropriation earmarks. PPC bears the brunt of balancing proposed investments in agriculture-

Investing in Africa’s Future Final Report
38
related programs with other priorities agency-wide, all in conformity with the guidance provided
by Congress.
The Bureau for Africa
USAID’s Bureau for Africa is responsible for designing, implementing, and evaluating USAID’s
development strategies and programs in sub-Saharan Africa. It provides direction and oversight
to 22 bilateral field missions, 26 country programs, and 3 regional programs in Africa where
assistance programs are actually implemented. In FY2005, the Bureau for Africa is managing
about $1.44 billion in program funds. The bureau has staff units that oversee programs in each of
the agency’s primary areas of development work in Africa: economic growth and agriculture,
health, education, and governance. Humanitarian relief, such as for the Darfur crisis in Sudan, is
handled by a separate headquarters unit.
Until recently, the four USAID regional bureaus housed subject experts who provided
economic development support to the in-country field offices and programs. Most of this
expertise has now been consolidated in the Bureau for Economic Growth, Agriculture, and Trade
(EGAT). Thus, like all the regional bureaus, the Bureau for Africa’s primary roles involve
allocating resources at the budget preparation and implementation stages (discussed below) and
ensuring that as planned and implemented, the development programs it manages are consistent
with USAID’s objectives and produce meaningful results.
Bureau for Economic Growth, Agriculture, and Trade
EGAT is one of the three pillar bureaus charged with working globally in their areas of expertise
to support the field offices and otherwise help achieve USAID’s goals; they are the repositories
of most of the agency’s subject-specific technical expertise. EGAT’s responsibilities are in the
areas of economic growth, poverty reduction, education, economic infrastructure, agriculture,
environment, natural resources management, and women in development. EGAT designs and
implements programs in its areas of expertise with about $150 million in program funds
(FY2004). Such programs are intended to augment those managed by the bilateral and regional
field offices. EGAT also provides technical advice and training to field staff.
Within USAID, EGAT has played a leadership role on agricultural development. It
devotes about $55 million of its program resources to agriculture-related research and technology

Investing in Africa’s Future Final Report
39
development, and it led the development of USAID’s new agriculture strategy document issued
in July 2004 (USAID 2004b). Working with the regional bureaus and PPC, EGAT’s Office of
Agriculture plays a role in all agency-wide deliberations on agriculture-related policy and
resource allocation, and its expert teams work on rural policy and governance issues affecting
agriculture, agricultural technology, agribusiness, and markets.
The Bureau for Democracy, Conflict, and Humanitarian Assistance
The Bureau for Democracy, Conflict, and Humanitarian Assistance (DCHA) is the headquarters
pillar bureau that works primarily in the areas of emergency relief and disaster assistance, often
in countries in conflict (e.g., Sudan, Iraq, and Afghanistan). DCHA also plays an important role
in agricultural development assistance through its management of the P.L. 480, Title II food aid
program.
The Office of Food for Peace (FFP) manages both emergency and development uses of
food aid. In 1995, FFP adopted a policy of targeting its non-emergency food aid in countries that
face the most serious food security problems and for uses that promise long-term solutions
(USAID/FFP 1995). As a result, development food aid is a major source of resources for
USAID’s agricultural development efforts in Africa. In FY2004, USAID valued its development
food aid in Africa at about $190 million, slightly more than half of which was devoted to
agriculture-related projects.
FFP coordinates its development food aid programs in Africa and elsewhere with the
local USAID field offices. However, it operates by making grants of food commodities directly
to U.S.-based organizations such as World Vision, CARE, and Catholic Relief Services, which in
turn implement programs in developing countries by using either the proceeds from the sale of
the food or the food itself as an in-kind resource.
Field Offices
USAID field offices are on the frontline of development assistance. They include bilateral
mission offices and regional program offices. USAID has bilateral missions in 22 African
countries—some large and fully staffed to provide comprehensive services, others quite small
Investing in Africa’s Future Final Report
40
with only a few employees who are backed up by other field offices.11 Africa has three regional
program offices: the Regional Economic Development Services Office for East and Southern
Africa in Nairobi, Kenya; the Regional Center for Southern Africa in Gabarone, Botswana; and
the West Africa Regional Program in Accra, Ghana.
The function of all USAID field offices is to design and implement development
strategies and programs that will produce meaningful results in the countries and regions for
which they are responsible. The field offices must work within the resource allocations they
receive from Washington, considering the congressional earmarks on use of funds. Nevertheless,
the field offices are given substantial responsibility to devise the specific activities they believe
will produce good development results. Many bilateral missions have developed country
strategic plans that describe a comprehensive vision for USAID’s contribution to development in
that country and specific strategies for achieving it. In developing these plans, USAID field staff
typically consult with local government officials, representatives of other donor countries, and
private-sector stakeholders.
Field offices carry out most of their program activities through grants or contracts,
typically with U.S.-based PVOs (such as the NGOs that also manage food aid programs) or
commercial consulting firms and other vendors (e.g., Chemonics International, Inc., Abt
Associates, Inc., and Deloitte Touche). USAID staff define the terms of these grants and
contracts and oversee their implementation.
A key dynamic within USAID is the natural tension between headquarters units (which
have global responsibilities and grapple with the realities of competing demands, finite
resources, and congressional earmarks) and the field offices (which see development needs and
opportunities close up). As in many federal government agencies, headquarters staff often
perceive field staff as too independent, and field staff perceive headquarters as too controlling.
This dynamic is particularly important within USAID because neither entity can function
meaningfully without the other and because the development results that ultimately matter back
in Washington are the ones achieved on the ground, mostly by field offices.
The frontline role of the country-level missions, the responsibility they have in the
USAID system for program design, and the important role the missions typically play in
11 Countries in sub-Saharan Africa with USAID missions are Angola, Benin, Democratic Republic of Congo, Eritrea, Ethiopia, Ghana, Guinea, Kenya, Liberia, Madagascar, Malawi, Mali, Mozambique, Namibia, Nigeria, Rwanda, Senegal, South Africa, Tanzania, Uganda, Zambia, and Zimbabwe (USAID n.d.).
Investing in Africa’s Future Final Report
41
managing projects make the mission directors key figures within both USAID and the countries
where they work. Mission directors are the senior, authoritative field voices informing
headquarters of opportunities and challenges in their countries and advocating for the resources
and other support needed to achieve results. Their views can also carry great weight with
officials in the host government, especially in countries where the United States is among the
largest contributors of external assistance.
Resource Allocation
The process through which USAID allocates its resources for agricultural development and other
purposes is quite complex, flowing from an elaborate set of planning, budget development, and
budget implementation processes. It is beyond the scope of this report to describe the details of
this process, which are subject to fairly frequent change, but the essential elements of the process
are important to an understanding of resource flows for purposes related to agricultural
development. This overview illustrates the roles of the various organizational units in resource
allocation; additional details are provided as needed in Chapter 3 to describe recent trends in
funding for agricultural development assistance.
Program planning at USAID is the process through which operating units—namely, field
offices and some headquarters units that spend program money to achieve development results—
decide which program activities they want to undertake. Budget development and
implementation is the process through which USAID develops its appropriations request to
Congress and allocates the funds that Congress appropriates. In what might be an oversimplified
description, program planning at USAID is a bottom-up process, whereas the budget
development and implementation process is top-down.
Program planning is bottom-up in the sense that it is driven by teams of USAID
employees who work at the operating unit level to establish strategic objectives for their teams
and devise the activities they consider appropriate to achieve each objective. For example, based
on its local consultations and country strategic plan, the USAID Mozambique Mission has
formed several strategic objective teams, including a Rural Incomes Team that focuses on
linking agricultural producers to markets in efforts to raise rural incomes. This team is
responsible for devising the activities needed to achieve its objective and selecting grantees and
contractors to carry them out. Even though everything related to the strategic objectives must be
Investing in Africa’s Future Final Report
42
in general alignment with USAID’s overall development strategy as set in Washington
(including the relevant earmarks), most program activities are planned locally.
The money required to carry out program activities is appropriated and allocated through
what generally is a top-down process. It is true that strategic objective teams project their
funding needs over a multiple-year period and that these projections feed into the annual budget
development process; however, funds are allocated to particular accounts—such as the DA and
P.L. 480, Title II accounts that fund most agricultural development assistance—through an
appropriations process that ultimately is controlled by Congress, and appropriated funds are
allocated to bilateral missions and other operating units through a process controlled by USAID
headquarters in Washington.
With respect to the DA account, PPC in the Office of the Administrator allocates
available DA funds to the Bureau for Africa and other USAID organizations that oversee
operating units (e.g., missions and regional programs in Africa); these organizations in turn
allocate DA shares to their operating units. Operating units and their strategic objective teams
then decide how to use that money to fund their activities and achieve their objectives. (This
process is similar to FFP’s allocation of Title II food aid resources, except that FFP maintains
greater control of contracting and program oversight at the Washington headquarters.)
The details of how the DA resources allocated by Washington are deployed to fund
strategic objectives at the mission level raise several issues that are important to understanding
the amount and nature of USAID’s investment in agricultural development; we discuss these
issues in Chapter 3.
USAID’s Agriculture Strategy and Policies
USAID Administrator Andrew Natsios declared agriculture a top priority at the very beginning
of his tenure, making Economic Growth and Agriculture one of the agency’s three program
pillars (along with Global Health and Conflict Prevention and Developmental Relief) and telling
Congress in his first budget testimony that “without economic growth and food security, no
development effort is sustainable. We will increase support for economic growth and agriculture
programs that reduce poverty and hunger” (Natsios 2001).
This view of agriculture’s role, especially as it affects food security, was not entirely new
as a driver of USAID programs. The 1995 FFP policy paper had highlighted the need to build
Investing in Africa’s Future Final Report
43
sustainable agricultural capacity to improve food security, resulting in a major shift in the use of
food aid resources to agricultural development projects (USAID/FFP 1995).
Administrator Natsios helped bring a new focus to the role of agriculture in Africa’s
development and to the importance of improving not only farmers’ productivity but also the links
between farmers and markets, where incomes can be increased. One consequence of this new
focus was the president’s largely agriculture-based IEHA. Another was the issuance of USAID
Agriculture Strategy: Linking Producers to Markets (USAID 2004b) as a guide to global
agriculture initiatives.
The following paragraphs summarize USAID’s strategy for agricultural development in
Africa (as reflected in the strategy document itself), the principles governing IEHA, and FFP’s
food aid and food security policy.
USAID’s 2004 Agriculture Strategy
USAID grounds its strategy for agriculture in the joint Department of State–USAID strategic
plan and the Monterrey Consensus (named for the Monterrey, Mexico, location of the 2002
International Conference on Financing for Development at which it was proposed) principles for
the effectiveness of development assistance (U.N. 2002). The strategy document thus stresses the
importance of good governance both in the agriculture sector and generally, citing the principle
of mutual responsibility for development among donors and developing countries, and it
reaffirms the commitment by the Department of State and USAID to “work to ensure that
institutions, laws, and policies foster private sector-led growth, macroeconomic stability, and
poverty reduction” (USAID 2004b, 10). The document then declares that “agricultural
development is a strategic priority for USAID. This strategy marks a renewal of the Agency’s
support for agricultural development and sets out guidance for its engagement in such efforts” (p.
11).
The USAID agriculture strategy has four themes:
• Expand trade opportunities, and improve the trade capacity of producers and rural
industries. This theme includes fostering an enabling policy and institutional environment
for agricultural trade, increasing access to rural finance, strengthening producer groups and
other rural organizations, and enhancing access to the technologies needed to produce the
products demanded by the marketplace.

Investing in Africa’s Future Final Report
44
• Improve the social, economic, and environmental sustainability of agriculture.
Recognizing that “biodiversity and natural resources are central to the livelihoods of rural
populations throughout the developing world” (USAID 2004b, 13), this theme includes
efforts to restore the health of the land, water, and forestry resources; develop renewable
energy sources; build natural resources assessment and management capabilities; and foster
good policy and governance in the resource arena.
• Mobilize science and technology, and foster the capacity for innovation. This theme
focuses on building capacity within developing countries to harness modern science and
technology—biotechnology, nanotechnology, Global Positioning System, and geographic
information systems—to improve productivity and market participation. Necessary efforts
include developing working science and technology policy, supporting technology
development and application for specific agricultural purposes, building public- and private-
sector partnerships, and fostering the innovation capacity of local institutions.
• Strengthen agricultural training and education, outreach, and adaptive research.
Addressing the knowledge gap that impedes the adoption of more productive agricultural
technologies and practices in many developing countries, this theme includes supporting
basic education in agricultural sciences and related subjects, building rural information and
communication technology systems adapted to the diverse needs of farmers and agribusiness
entrepreneurs, and performing adaptive research to solve local problems.
To implement these themes, the strategy document pledges that USAID will, among
other things, link its agriculture strategy with the overall Department of State–USAID strategic
plan, develop indicators to measure performance, strengthen donor coordination in the
agriculture sector, and “provide adequate resources to agriculture from all budget sources”
(USAID 2004b, 5).
IEHA–USAID Agriculture Strategy for Africa
Although IEHA (unveiled in 2002) predates issuance of USAID’s 2004 agriculture strategy, it
includes essentially the same themes and stands as USAID’s Africa-specific strategy for
agriculture. IEHA is intended specifically to help achieve the MDG of cutting the number of
hungry people in Africa in half by 2015 by “promoting agricultural growth and building an

Investing in Africa’s Future Final Report
45
Africa-led partnership to cut hunger and poverty by investing in a smallholder-oriented
agricultural growth strategy” (USAID 2005).
IEHA thus includes an agricultural action plan that is intended to “increase agricultural
growth and rural incomes in sub-Saharan Africa rapidly and sustainably,” enabling farmers to
“grow out of poverty” by generating “profits and incomes from their products and services.” The
action plan elements include creating momentum and support in Africa for agricultural growth as
a “critical development pathway;” targeting opportunities to accelerate smallholder-based
agricultural growth; forging linkages with health, education, macroeconomic reform, and
infrastructure sectors and initiatives; and building alliances and financial and political
commitments to reduce hunger by half by 2015.
IEHA also includes a framework to guide USAID agricultural growth investments in
Africa. The framework is premised on the belief that “innovations that increase agricultural
productivity and more competitive markets are essential ingredients of smallholder agricultural
growth.” Although it is more explicitly smallholder-oriented than the overarching agency
agriculture strategy, the IEHA investment framework includes six themes that fully overlap the
four themes of the agency strategy:
• scientific and technological applications that harness new technology to raise productivity;
• agricultural trade and market systems that add value to products and attract private and
foreign investment in African agriculture;
• community- and producer-based groups that support the interests and efforts of farmers;
• development of human capital and institutions that shape and lead agricultural policy and
research and provide education;
• integration of vulnerable groups and countries in transition into sustainable development
processes; and
• environmental management that contributes to growth of agricultural and rural sectors.
As IEHA operates, USAID field offices develop country and regional IEHA action plans,
which are expected to be structured around these six themes. The IEHA framework cites the fact
that “infrastructure development in transportation, energy, water/sanitation, and
telecommunications is also increasingly urgent.” It is unclear, however, how this important
Investing in Africa’s Future Final Report
46
observation relates to USAID’s agricultural investment strategy in Africa. Infrastructure
development was not included among the four strategic themes in the overall agency agriculture
strategy, and infrastructure investment—especially for the rural roads that are vital for linking
farmers to markets—is rarely part of the USAID program in Africa (USAID 2005).
Agriculture and Food Aid
The 1995 Food Aid and Food Security Policy Paper (USAID/FFP 1995) is another expression of
USAID policy that relates to agricultural development in Africa. This policy does not conflict
with the policies in the USAID agriculture strategy and IEHA but tilts in a different direction; its
goal is “to increase the impact of food aid in reducing hunger” (p. 2). Although the policy
recognizes the relationship between this goal and the broader goals of economic growth and
poverty reduction, the priorities of the FFP Title II food aid program are reducing hunger and it
highlights Africa as a region especially in need of help to achieve this goal.
To that end, the two priority program areas for the FFP program are agricultural
productivity and household nutrition (which involves efforts to improve the use of available food
to achieve adequate nutrition). The agricultural productivity limb of the FFP policy recognizes
that improvement involves not only inputs and on-farm activities but also improved market
access. However, the focus of the policy and the uses of food aid that result are more at the
grassroots level than the overall USAID agriculture strategy. They are focused somewhat more
on agricultural activities that contribute to food security through local food access and good
household nutrition rather than through the broader mechanism of sustainable economic growth.
This focus is not in conflict with the new agriculture strategy but, arguably, complements it.
On the other hand, some people argue that short-term food aid for purposes other than to
meet immediate, emergency needs is inherently in conflict with an agricultural development
strategy because it inevitably displaces local production or distorts local markets and fosters
dependency that undercuts locally driven development initiatives.
Conclusion
As the lead development assistance agency in the U.S. government, USAID is the central player
in the U.S. agricultural development assistance program. Agricultural development in Africa has
a prominent place in USAID’s overall development strategy, as articulated by the agency’s

Investing in Africa’s Future Final Report
47
leaders and in strategy documents. The USAID strategy for African agriculture is both poverty-
focused and market-oriented and in those ways is consistent with the strategies shared by African
leaders, NEPAD, the World Bank, and other development organizations.
With this institutional and policy background in mind, we examine recent trends in
USAID resources for agricultural development assistance in Africa in Chapter 3. First, however,
it is important to complete the organizational and policy landscape for the overall U.S.
contribution to agricultural development assistance in Africa.
Other Agencies Providing Bilateral Assistance for African Agriculture
Foreign Agricultural Service
The mission of USDA’s FAS is to represent and promote the interests of U.S. agriculture
oversees, focusing primarily on ensuring access to foreign markets and promoting agricultural
exports from the United States (USDA n.d.). FAS provides technical and financial assistance to
U.S. exporters, generates data and analysis on overseas markets, and works on agricultural trade
negotiations in conjunction with the Office of the U.S. Trade Representative.
Unlike USAID, USDA does not have a statutory mandate to be an international
development agency. In keeping with its broader mission, however, FAS is involved in
assistance for African agriculture through its management of Section 416(b) and Food for
Progress food aid and as a provider of technical assistance.
USDA Food Aid Programs
FAS manages food aid under its Export Credits unit. The two USDA food aid programs that are
relevant to agricultural development in Africa are Section 416(b) and Food for Progress. FAS
also manages the Food for Education Program, which donates food to developing countries as an
inducement for children to remain in school, and Title I of P.L. 480, which makes concessional
sales to foreign governments but rarely to African countries.
As noted earlier, the underlying statutory purposes of Section 416(b) and Food for
Progress are to dispose of surplus commodities and expand free enterprise in agricultural markets
worldwide, respectively. However, the food aid resources provided under these programs are
used in ways quite similar to those of USAID’s FFP Program. Donations of food are made to
Investing in Africa’s Future Final Report
48
PVOs or, in some cases, to governments, with the understanding that they will be used for
specified development purposes.
USDA provides somewhat less direction to the organizations that receive food aid
donations than USAID does. Section 416(b) resources tend to be used for both agricultural
development and other purposes (such as health), whereas uses of Food for Progress resources
must, by law and USDA policy, have some nexus to agriculture and improvement of agricultural
markets.
The total annual value of Section 416(b) food aid varies according to commodity surplus
levels in the United States, ranging from as much as $640 million in FY2001 to about $150
million in FY2004, with less than 20% in recent years (about 2% in FY2004) going to Africa. In
recent years, Food for Progress donations have been in the range of $100 million to $125 million,
with 10–20% going to Africa.
USDA Technical Assistance
FAS contributes technical staff and expertise to development-related activities under its
International Cooperation and Development (ICD) Program, Development Resources Division.
It has no appropriation for this purpose but rather provides reimbursable services to USAID-
funded projects. The USDA employees providing these services are paid for with USAID
program funds but are not subject to congressional limits on USAID operating expenses and
staffing levels. These projects typically involve food safety, technical and policy issues related to
food security and trade capacity, and natural resources management related to crop production
and forestry. Nearly 150 full-time USDA employees are involved in these programs, including
about 100 who work at USAID in Washington and 10 who work at USAID field offices, of
whom three are in Africa (USDA FAS 2005).
ICD also provides some training and technical assistance related to African agriculture
through its Food Industries Division (USDA 2003), which administers the Norman E. Borlaug
International Science and Technology Fellows Program, the Cochran Fellowship Program, a
Professional Development Program, and a Trade and Investment Program. With the exception of
the Borlaug Fellowship, all these programs are aimed at improving skills and relationships that
will advance the FAS market expansion mission, but they also all relate to the development of
agriculture and agribusiness in foreign countries, including in Africa. USDA estimates the value

Investing in Africa’s Future Final Report
49
of specific activities taking place in Africa under these programs at about $1 million annually
(Brown 2005).
African Development Foundation12
The U.S. Congress established ADF in 1980 to “promote the participation of Africans in the
economic and social development of their countries.” The ADF makes small grants—generally
less than $250,000, with one-third below $100,000—directly to African private enterprises and
other NGOs to:
• finance sustainable, poverty-alleviating initiatives that are conceived, designed, and
implemented by Africans and aimed at enlarging opportunities for community development;
• stimulate and expand the participation of Africa’s poor in the development of their countries;
and
• build sustainable African institutions that foster grassroots development.
ADF takes a community-based approach, with grants going exclusively to projects that
are “made in Africa”—that is, conceived, developed, and implemented by Africans. The primary
objectives are to foster sustainable development and broad community participation in
development by funding micro- and small-enterprise projects that will generate income and
employment, build trading relationships within Africa and with the United States, and develop
local organizations and other community-based capacity to pursue sustainable development.
ADF recently established a trade and investment program that recognizes the opportunity
for agricultural producers to benefit from export trade. It is actively involved in identifying and
supporting projects that will benefit from the African Growth and Opportunity Act, intended to
promote exports from Africa to the United States.
According to the organization’s 2002–2003 annual report (ADF 2003), ADF is currently
active in 15 sub-Saharan Africa countries: Benin, Botswana, Cape Verde, Ghana, Guinea, Mali,
Namibia, Niger, Nigeria, Senegal, Swaziland, Tanzania, Uganda, Zambia, and Zimbabwe. In
FY2002 and FY2003, ADF made 97 grants totaling $14.75 million. Approximately one-third of
the projects (33 of 97), with a combined value of $8.8 million, were for agriculture-related
12 Information in this section is drawn from the African Development Foundation web site (ADF n.d.) unless otherwise noted.
Investing in Africa’s Future Final Report
50
projects. However, the emphasis on agriculture varies from country to country. For example, in
the three of these countries examined more closely for this report, eight of Uganda’s 10 ADF
projects funded in FY2002 and FY2003 were agriculture oriented, compared with four of eight
in Mali and one of 10 in Ghana.
U.S. Trade and Development Agency13
The mission of TDA is to “advance economic development and U.S. commercial interests in
developing and middle income countries.” To carry out this mission, TDA works closely with
other U.S. federal agencies to help American businesses build partnerships and take advantage of
emerging market opportunities worldwide. TDA funds activities such as technical assistance,
training, and feasibility studies that “support the development of a modern infrastructure and a
fair and open trading environment.”
TDA activities generally fall into two broad categories: trade capacity building and sector
development, and project definition and investment analysis. The sectors it works in most often
are energy and power, transportation, health care, mining and minerals development,
telecommunications, and environmental services. TDA works in five geographic regions: Asia;
Europe and Eurasia; Latin America and the Caribbean; the Middle East, North Africa, and South
Asia; and sub-Saharan Africa.
TDA’s total appropriation in FY2005 is $50 million which reflects a gradual rise from
$44 million in FY2000. As reported to the Organisation for Economic Co-operation and
Development’s Creditor Reporting System on Aid Activities, TDA’s total funding for Africa
during 2000–2003 averaged $5.6 million annually, of which an average of $1 million annually
was for projects related to agriculture or agribusiness (OECD n.d.). Such projects typically
involve financing feasibility studies or country visits to explore potential ventures in areas such
as biomass-fueled power generation, fertilizer manufacturing, sugar refining, or other
agroprocessing activities.
13 Information in this section is drawn from the U.S. Trade and Development Agency web site (USTDA n.d.) unless otherwise noted.

Investing in Africa’s Future Final Report
51
Overseas Private Investment Corporation14
The Overseas Private Investment Corporation (OPIC) was created in 1971 “to support economic
development by promoting U.S. private investment in developing countries and transition
economies,” which it does through loan guarantees, insurance, and other means. A U.S.
government agency, OPIC “complements the private sector in managing the risks associated
with foreign direct investment (FDI) and supports U.S. foreign policy.” The OPIC mission is
based on the development hypothesis that FDI stimulates economic growth, thereby reducing
income poverty (OPIC n.d.).
OPIC activities mainly focus on agriculture, energy, construction, natural resources,
telecommunications, transportation and distribution, banking, and services. Project assistance
can be for as much as $400 million per project. FDI to sub-Saharan Africa is the lowest in the
world, reaching a 15-year low of 0.8% of emerging market FDI in 1999–2000. Partly because of
OPIC support, however, FDI has been on the rise in Africa (a record of 2.3% of emerging market
FDI in 2001). Through its work in sub-Saharan Africa, OPIC “not only support[s] but actively
seek[s] developmental projects with the potential to help nations … meet their populations’ basic
developmental needs and help them prepare for future economic growth.”
OPIC investment in African agriculture is limited but appears to be rising. In 2003, four
of 11 OPIC projects in sub-Saharan Africa were related to agriculture:
• Seaboard Overseas Ltd. flour mill and commodity-trading operations in Angola;
• Amoah, George K. & Chicken George Farms LLC poultry production and distribution in
Ghana;
• ROTA International development of organic cashew production and processing in Guinea-
Bissau; and
• SORWATHE development of an eucalyptus plantation for fuelwood and expansion of a tea
plantation.
In contrast, OPIC financed only one agriculture-related project in sub-Saharan Africa in
2002, one in 2001, and none in 2000. Although currently working at a modest level and not a
14 Information in this section is drawn from the Overseas Private Investment Corporation web site (OPIC n.d.) unless otherwise noted.
Investing in Africa’s Future Final Report
52
significant factor in U.S. agricultural development assistance to Africa, OPIC could play a
significant future role in facilitating U.S. private-sector investment in Africa’s rural economy.15
Peace Corps16
The Peace Corps provides volunteers to developing countries to help meet their need for trained
men and women and to promote mutual understanding between Americans and the people in
host countries. Volunteers work in work in five major fields, of which one is agriculture. The
others are education, health and HIV/AIDS, environment, and business.
While the Peace Corps is often identified with agricultural projects, the primary projects
of the vast majority of Peace Corps volunteers serving in sub-Saharan Africa are in sectors other
than agriculture. In FY2004, 35% of the approximately 2,700 volunteers working in sub-Saharan
Africa (963) worked primarily in the education sector, 29% (799) worked in health and
HIV/AIDS, 19% (523) worked in environment, and 12% (331) worked in business (Arnold
2005). Only 4%, or 110 of the Peace Corps volunteers in Africa had primary projects focused on
agriculture in FY2004, down from 7% in FY2000–FY2002 and 5% in FY2003. The estimated
budget for Peace Corps work in the agriculture sector declined by 47% between FY2000 and
FY2004, from $3.66 million $2.5 million, and averaged $3.32 million over the five-year period.
Of the 26 countries with Peace Corps programs in sub-Saharan Africa, six had agriculture
programs per se (Gabon, Mali, Mauritania, Niger, Senegal, and Zambia) (Peace Corps n.d.).
Eleven additional countries (Benin, Burkina Faso, Cameroon, Gambia, Ghana, Guinea, Lesotho,
Madagascar, Malawi, Tanzania. and Togo) had activities under other programs that appear to be
related to agricultural development, broadly construed. Agricultural development activities
undertaken by Peace Corps volunteers include partnering with farmers to: 1) introduce
techniques such as water harvesting, crop rotation and soil fertility management to improve crop
yields (Agriculture Program, Niger); 2) establish networks of farmer leaders “who understand
15 The Export-Import Bank of the United States is another U.S. entity whose programs can affect economic activity in Africa by providing financing, insurance, and other risk management services to support the business activities of U.S. exporters. Like OPIC, however, the core mission of the Export-Import Bank is to serve U.S. business interests rather than pro-poor economic growth in developing countries. Its activities in Africa are relatively modest and beyond the scope of this report. 16 Information in this section is drawn from the Peace Corps web site (U.S. Peace Corps n.d.) unless otherwise noted.

Investing in Africa’s Future Final Report
53
the benefits of agroforestry and permanent farming systems, and who will teach these activities
to other farmers” (Environment Program, Cameroon); and 3) establish cooperatives and market
their products locally and internationally (Small Enterprise Development Program, Ghana)
(Peace Corps n.d.).
Millennium Challenge Corporation17
MCC is the government corporation that Congress established in January 2004 to implement the
MCA, the bold new vehicle for development assistance that President Bush unveiled in the run-
up to the March 2002 International Conference on Financing for Development in Monterrey,
Mexico. The MCA was intended in part to demonstrate the United States’ commitment to play
its role in achieving the United Nations’ poverty-focused MDGs. It accompanied a pledge by
President Bush to fund the account at $5 billion annually by FY2006, which, if fulfilled, would
mean a 50% increase over the current base of about $10 billion annually in U.S. development
and humanitarian assistance.
President Bush intends to use the MCA as a sharp departure from the traditional approach
to U.S. development assistance. The basic idea is to provide more assistance to developing
countries that have created the necessary enabling environment for economic growth through
market-oriented, pro-growth policies; good governance, including anticorruption policies; and
investment of their own resources in health and education. Instead of the United States
stipulating uses for the aid, countries meeting the basic eligibility criteria for MCA funding
would develop their own proposals—including goals and benchmarks for success—and the
money would be awarded directly to the government under a development compact in which
transparency and accountability for results are priorities.
This approach differs from the USAID development assistance model in which many
modestly financed projects are pursued in many countries, project design is controlled to a large
extent by USAID, and money is awarded to PVOs or commercial contractors (rather than to the
local government). The MCA remains an untested vehicle for development assistance, with the
first developing country compact being signed in spring 2005. However, its potential importance
for agricultural development in Africa is substantial for several reasons.
17 Information in this section is drawn from the Millennium Challenge Corporation web site (MCC n.d.) unless otherwise noted.
Investing in Africa’s Future Final Report
54
First, the pool of resources is large and growing. Congress appropriated $1 billion for the
MCA in FY2004 and $1.5 billion in FY2005 (of the president’s request for $2.5 billion). These
funds accumulate and are available to the MCA until committed to developing countries under
compacts. The president’s FY2006 request is $3 billion, and the head of the MCA states the
administration’s intent of reaching an annual level of $5 billion in FY2007 (whereas USAID’s
entire FY2005 appropriation was $3 billion for both DA and CSH accounts). Moreover, there is
no fixed limit on the size of MCA country grants. Thus, given the large pool of funds and the
expectation that only some of the 17 countries deemed eligible for the first round of compacts
will be funded, the size of each grant could be in the hundreds of millions of dollars—several
times more than the total amount of non-emergency development assistance that any African
country currently receives from the United States.
Second, Africa is very well represented in the initial group of 17 countries that MCC has
determined to be eligible for the program; eight are in sub-Saharan Africa: Benin, Cape Verde,
Ghana, Lesotho, Madagascar, Mali, Mozambique, and Senegal. So are seven of the 13 so-called
threshold countries that have accepted the MCA concept and are close to qualifying: Burkina
Faso, Kenya, Malawi, Sao Tome and Principe, Tanzania, Uganda, and Zambia. Thus, half of all
the countries positioned to benefit from the MCA are in sub-Saharan Africa.
Finally, while MCC looks to the developing country to develop and fully own its MCA
proposal, the MCC’s background paper says that increasing economic growth and reducing
poverty “requires an emphasis on investments that raise the productive potential of a country’s
citizens and firms and help integrate its economy into the global product and capital markets”
(MCC 2003, 1). It then cites six key areas of focus for the MCA, the first of which is agricultural
development; the others are education, enterprise and private-sector development, governance,
health, and trade capacity building. Not surprisingly, 15 of the 16 MCA country proposals
submitted to date include an agriculture component.
Aspirations underlying the MCA are high. At the first MCC Board meeting on Feb. 2,
2004, then-Secretary of State Colin L. Powell, the board chair, expressed his excitement about
the potential of the MCC and added:
But the one who is most excited is the President of the United States. This is his
baby, this is his corporation, and he intends to use this corporation and the monies
that Congress makes available to make fundamental changes in the whole manner

Investing in Africa’s Future Final Report
55
in which we provide development assistance to those nations who are governing
wisely and well, transparently and with openness, and all fundamentally based on
the rule of law, democracy, and open economic systems. (U.S. Department of
State 2004)
Whether the high hopes for the MCA will be fulfilled will be determined only over the
next several years, as compacts are entered into and implemented. In any event, the MCA
promises to play a significant role in the U.S government’s approach to and funding of
agricultural development assistance in Africa.
Agriculture-Oriented Multilateral Institutions
In addition to the assistance for African agriculture provided through bilateral agencies, the
United States also contributes through multilateral development and financial institutions whose
work includes agricultural development assistance. Principal among these are FAO, WFP, IFAD,
the World Bank Group through its International Development Association (IDA), and ADB
through its ADF.
The United States funds FAO and WFP through the Department of State’s IO, which is
responsible for funding and managing the United States’ relationship with more than 40
international organizations, including the U.N. system. The bureau has a total annual budget of
more than $1 billion, of which $72 million (about 20% of FAO’s core budget) was allotted to
FAO’s regular program in FY2004. The United States funds WFP primarily through commodity
donations from USAID and USDA food aid programs combined with limited cash contributions
from the IO budget and other sources. In 2004, the United States contributed more than $1
billion—nearly half of all WFP contributions that year. The bureau also oversees the U.S.
Mission to the U.N. agencies in Rome, where FAO and WFP are based, and provides input into
the formulation of policies and programs of the two agencies through the mission.
The U.S. funds IFAD, IDA, and ADB/ADF through the U.S. Department of the
Treasury’s Office of Multilateral Development Banks and Specialized Development Institutions,
under the assistant secretary for international affairs. This office is responsible for funding about
a dozen international financial institutions and has a total annual budget of about $1.5 billion.
IDA, the World Bank’s primary development assistance arm, receives by far the largest share: in
Investing in Africa’s Future Final Report
56
FY2004, IDA received $913 million, ADB/ADF $113 million, and IFAD $15 million. A U.S.
executive director is assigned to each of the international financial institutions to ensure that U.S.
views are considered in managing these institutions.
The following paragraphs briefly describe the missions and activities of the international
development and financial institutions as they relate to agricultural development in Africa. More
detail about the U.S. funding of these institutions and their agriculture-related programs in Africa
is presented in Chapter 3.
Food and Agriculture Organization18
FAO is the lead agency in the U.N. system for addressing the problem of hunger worldwide. As
a membership organization of about 180 countries, FAO’s purpose is to work with its member
countries to “raise levels of nutrition and standards of living of the peoples under their respective
jurisdictions, secure improvements in the efficiency of the production and distribution of all food
and agricultural products, to better the condition of rural populations, and thus contribute
towards an expanding world economy and ensure humanity’s freedom from hunger” (FAO n.d.).
FAO pursues this goal primarily through leadership and support for policy change aimed
at improving food security and through funding and technical support for agricultural
development projects, primarily in rural areas of the world’s poorest countries. FAO employs
about 3,500 people, about half of whom work in FAO’s Rome headquarters and half in the field
in more than 78 countries. The annual budget for FAO’s core program is about $375 million, and
it receives supplemental support from member countries for specific projects. FAO is governed
by the Conference of Member Nations, which meets every two years to approve the budget and
two-year Programmes of Work.
In 1996, FAO convened the World Food Summit, at which 186 nations first committed to
the goal of cutting hunger in half by 2015, an aspiration that was later incorporated in the United
Nations’ overall MDGs. In 1999, FAO put forth its strategic framework for achieving the World
Food Summit and MDG food security goal (FAO 2000). It calls for FAO to work toward:
reducing food insecurity and rural poverty; ensuring an enabling policy and
regulatory framework for food and agriculture, fisheries and forestry; securing

Investing in Africa’s Future Final Report
57
sustainable increases in the supply and availability of food; conserving and
enhancing the natural resources base; and generating knowledge of food and
agriculture, fisheries and forestry. (para. 24)
Although the strategy focuses heavily on improving productivity and ensuring
availability and access to food at the household level, it also recognizes the importance of the
enabling policy environment and effective markets through which farmers can increase the
income required for food security and other critical household needs. About half of FAO’s core
budget is devoted to technical programs to improve food production and availability and half to
policy issues, building cooperation and partnerships to improve food security, and management
(FAO 2003).
About 20% of FAO’s field program budget is devoted to activities in sub-Saharan Africa.
FAO maintains a Regional Office for Africa in Accra, Ghana, and subregional offices in Tunis,
Tunisia, for northern Africa and in Harare, Zimbabwe, for southern and eastern Africa. Examples
of major FAO projects in sub-Saharan Africa include
• Livestock, Environment, and Development Initiative;
• Pro-Poor Livestock Policy Initiative;
• Milk and Dairy Products, Post-Harvest Losses, and Food Safety in sub-Saharan Africa and
the Near East, which is active in Ethiopia, Kenya, Tanzania, and Uganda;
• Promotion and Utilization of Agricultural Inputs for Producer Organizations, in Niger;
• Crop and Grassland Service;
• African Seed Network, which assists with seed production, security, policy, and
improvement; and
• Agricultural Support Systems Division, which has 21 projects addressing a wide range of
specific policy and technical issues that affect agricultural production and marketing in 14
African countries.
18 Information in this section is drawn from the Food and Agriculture Organization web site (FAO n.d.) unless otherwise noted.

Investing in Africa’s Future Final Report
58
World Food Programme
The primary purpose of the United Nations’ WFP is to distribute emergency or humanitarian
food aid for immediate use by people in need. In 2003 (the most recent year on which detailed
reports are available), WFP fed 104 million people in 83 countries on a budget of $3.275 billion
(WFP 2005). The United States is by far the largest contributor to WFP, accounting for about
45–60% of total contributions annually during the period 2000–2004 and averaging about $1.1
billion each year. The WFP director traditionally is an American.
WFP’s involvement in long-term agricultural development is small compared with its
emergency and humanitarian feeding programs. In 2003, it ascribed an estimated 9% by volume
of its food aid shipments and 7% of its operational expenditures worldwide to development
programs. However, many of these programs involved food-for-work and other efforts to support
people emerging from crisis situations in reestablishing their ability to feed themselves rather
than long-term agricultural development.
Africa receives more WFP food aid than any other region—about 46% of WFP’s 2003
operational expenditures. Of this amount, WFP ascribed about 8% (about $125 million) to
development programs. The 2003 total for Africa was increased from an average of about $81
million in WFP development program expenditures in Africa during 2000–2002.
International Fund for Agricultural Development19
The focus of IFAD is squarely on long-term agricultural development. Formed as an
international financial institution in 1977, IFAD was an outcome of the 1974 World Food
Conference that responded to African food crises of the early 1970s. In recognition of the fact
that food insecurity is due more to poverty than to inadequate food production and that the
majority of the world’s hungry live in rural areas, IFAD’s mission is stated broadly as: “enabling
the rural poor to overcome poverty … by fostering social development, gender equity, income
generation, improved nutritional status, environmental sustainability, and good governance.”
IFAD finances agricultural development in developing countries, primarily through
concessional loans, and has financed 653 projects in 115 countries since its inception. IFAD
obtains its resources from member countries, which make annual contributions in accordance
19 Information in this section is drawn from the International Fund for Agricultural Development web site (IFAD n.d.) unless otherwise noted.

Investing in Africa’s Future Final Report
59
with periodic replenishment agreements. In 2005, IFAD plans to allocate $475 million in
financing to 121 countries. Of this amount, about $175 million is to be allocated to 43 countries
in sub-Saharan Africa. IFAD leverages the impact of its resources by seeking partnerships and
opportunities for co-financing projects; it lists on its web site more than 80 bilateral donor
countries, regional and international organizations, and NGOs with which it has worked.
IFAD’s strategy in Africa is tied to achieving the MDGs. It has adopted specific sub-
regional strategies for Eastern and Southern Africa and for Western and Central Africa. IFAD
describes Eastern and Southern Africa as the region where “poverty reduction is most clearly
dependent upon rural development.” Because 85% of the extremely poor in this region depend
primarily on smallholder agriculture for their livelihoods and because agricultural development
in the region has stagnated or regressed in recent years, the strategy focuses on generating
growth in the smallholder economy. It includes four principal thrusts:
• Promote efficient and equitable market linkages;
• Develop rural financial systems;
• Improve access to and management of land and water; and
• Create a better knowledge, information, and technology system.
Programs and projects to realize these thrusts are developed in the context of the cross-
cutting principles of targeting, empowerment, and good governance; in harmony with each
country’s poverty reduction strategy paper, where one exists; and in partnership with
government, NGOs, civil society, and the private sector.
IFAD’s strategy in Western and Central Africa addresses a different set of challenges and
opportunities. Although the region has experienced improvement in democratization,
decentralization, liberalization, market openness, and civil society development since the 1990s,
civil strife and conflict continue. The shift of population to urban areas also has created an
“urban bias” in public policy, resulting in government spending priorities that favor urban
infrastructure, social programs, and food subsidies and that can exacerbate poverty in the rural
areas where 75% of the region’s poor reside. According to the IFAD strategy for Western and
Central Africa, policy reform could unleash the market opportunities in urban areas to create a
win–win situation for urban businesses and rural producers.

Investing in Africa’s Future Final Report
60
To address this reality, IFAD’s strategic goal in Western and Central Africa is “rural
poverty reduction and empowerment,” to be accomplished by pursuing four objectives:
• Strengthen the capacity of the rural poor and their organizations, and improve the pro-poor
focus of rural development policies and institutions;
• Raise agricultural and natural resources productivity and improve access to technology;
• Increase rural incomes through improved access to financial capital and markets; and
• Reduce vulnerability to major threats to rural livelihoods.
Policy dialogue and knowledge management—as well as the cross-cutting approaches of
investing in women, enhancing participation, and building on indigenous knowledge—are to be
used in the pursuit of each of strategic objective.
Country-by-country details of IFAD projects are listed on the IFAD web site (IFAD n.d.).
The World Bank Group’s IDA20
The mission of the World Bank Group is “to fight poverty and improve the living standards of
people in the developing world.” It also embraces the United Nations’ MDGs and works to help
achieve them. The bank pursues its mission by providing low-interest loans, interest-free credit,
grants, policy advice, technical assistance, and other knowledge-sharing services to developing
countries.
IDA is the member of the World Bank Group that focuses on providing highly
concessional loans and grants to the world’s poorest countries. Most of the World Bank’s
activity in sub-Saharan Africa is through IDA. The other major development financing arm of
the World Bank Group is the International Bank for Reconstruction and Development (IBRD),
which finances development-related projects at market rates. In FY2004, IDA and IBRD made
new commitments to 245 projects worldwide with a total value of nearly $23 billion.
The World Bank’s activities address a broad range of development needs, including
achieving universal primary education; combating HIV/AIDS, malaria, and other diseases;
developing a global partnership for development; ensuring environmental sustainability;
improving maternal health; promoting gender equality and empowering women; and reducing
20 Information in this section is drawn from the World Bank web site (World Bank n.d.) unless otherwise noted.

Investing in Africa’s Future Final Report
61
child mortality. In addition, a key World Bank program in recent years has been the Heavily
Indebted Poor Countries (HIPC) Initiative. Through the HIPC Initiative, the World Bank has
provided debt relief savings of $41 billion to 26 developing countries. Freed of a significant
portion of their debts, these countries can use the money saved to provide social services for their
citizens. Africa has been granted $3.9 billion in debt relief under the HIPC Initiative.
IDA is active in sub-Saharan Africa, with $4.1 billion in new commitments in 2004—a
substantial increase from an annual average of $2.25 billion from 1995 to 1997 and $2.16 billion
in 2001. Its total current portfolio is valued at $16.6 billion and includes 334 projects related to
infrastructure, agriculture, regional trade facilitation, health, nutrition, population, education,
community-driven development, and capital flows (World Bank 2004). This large investment
makes the World Bank the largest single provider of development assistance to the region. The
World Bank’s commitment to sub-Saharan Africa is further underscored by its granting 46% of
new IDA disbursements to the region in FY2004 and its medium- to long-term goal of
committing 50% of new IDA funding to the region. Only when IDA and IBRD commitments are
considered together does sub-Saharan Africa rank behind both the South Asia and the Latin
America and Caribbean regions in new 2004 commitments and current portfolio value.
As discussed in Chapter 1, in 2003 the World Bank Group issued its new strategy for
rural development in which it declared that agriculture is “the main source of rural economic
growth” and must “be put on top of the development agenda” (World Bank 2003). As of today,
the agriculture, fishing, and forestry sector of the bank’s activity holds only a small share of
funding, garnering about 7% of the total of new commitments in 2004. However, this percentage
may understate the level of commitment to agriculture-led economic growth as understood more
holistically. When IDA commitments to sub-Saharan Africa are described by theme rather than
by sector, 9% of FY2004 IDA commitments went to rural development, 9% to trade and
integration, and 5% to environmental and natural resources management—all of which are likely
to include substantial activities that help foster agriculture-led economic growth. Illustrative
examples of agriculture-related projects are listed in Table 2-1.
Investing in Africa’s Future Final Report
62
African Development Fund of the African Development Bank Group21
The ADB Group is a multinational development bank supported by 77 member countries,
including the United States. It was formed in 1964 with the overall mission to promote economic
and social development in Africa through loans, equity investments, and technical assistance.
The group includes ADB, which makes loans on normal market terms; ADB/ADF, which
provides development finance on concessional terms to low-income African countries that
cannot afford to borrow on ADB’s nonconcessional terms; and the Nigeria Trust Fund, which
was established by the government of Nigeria to assist development in the poorer African
countries and is managed by ADB.
ADB/ADF, whose role parallels that of IDA in the World Bank Group, is the relevant
component of the ADB Group for purposes of this report. As a matter of policy, poverty
reduction is the main purpose of the fund’s concessional loans and grants, and agriculture is a
focus of the fund’s activity.
At a policy level, the approach to agricultural development taken by the ADB Group and
ADB/ADF is in line with that adopted by African leaders through NEPAD and by the
international institutions outlined in Chapter 1. This approach is laid out in Agriculture and
Rural Development Sector Bank Group Policy:
The transformation of Africa agriculture requires a shift from the highly
diversified, subsistence-oriented farming activity towards a more commercially-
oriented agriculture with improved access to markets and agro-industry. It
involves greater reliance on input and output markets and increased integration of
agriculture with other sectors of the domestic and international economies. It also
involves a more efficient and balanced use of indigenous knowledge and
“modern” scientific knowledge. (ADB/ADF 2000, iii)
The Bank Group Policy on Poverty Reduction names agriculture and rural development
first among the ADB Group’s five sectoral priorities, declaring that “agriculture and rural
development will continue to be the engine of pro-poor growth in Africa” (ADB/ADF 2004, 20).
This priority is reflected in the fund’s recent activity. For 2003, about 25% of its loan and grant
21 Information in this section is drawn from the web site of the African Development Bank Group (ADBG n.d.) unless otherwise noted.
Investing in Africa’s Future Final Report
63
approvals were in the agriculture and rural sector, a larger share than in any other sector; the
transport and poverty alleviation/microfinance sectors (which also tend to benefit agricultural
development) garnered 19% and 15%, respectively; the education and health sectors received
18% and 4%, respectively.
In its approach to agriculture and poverty reduction in general, the World Bank Group
embraces the United Nations’ MDGs and the idea that development should be owned at the
country level. It thus looks to the poverty reduction strategy papers prepared by many African
countries as the framework within which to consider World Bank and ADB/ADF investments in
particular countries.
The United States contributes to the ADB Group through an annual appropriation
channeled through the Department of the Treasury. The total U.S. contribution to the group has
averaged about $110 million annually over the period 2000–2005, with all but about $5 million
of this amount going specifically to ADB/ADF rather than to ADB.
Conclusion
The institutional landscape for U.S. agricultural development assistance in Africa is undeniably
complex. It includes the Congress, the White House, the Department of State, four USAID
headquarters units, and more than two dozen USAID field offices and programs. It includes six
other bilateral agencies with various missions and roles in Africa, and the MCA coming online as
an additional and potentially overshadowing funder of agricultural development in selected
African countries. The United States also funds agricultural development assistance through five
multilateral institutions.
USAID is today the largest U.S. channel of assistance for African agriculture. The agency
has its own internal processes—albeit driven largely by congressional directive—for determining
program priorities and allocating resources. It is anticipated that USAID will coordinate with
MCA assistance programs as MCA compacts begin to come into play. However, there is no
mechanism for ongoing coordination of program priorities and resource allocation between
USAID and the nine other bilateral and multilateral institutions that provide assistance to African
agriculture on behalf of the United States.
Despite institutional complexity and lack of management coordination, these institutions
show striking policy-level consistency in their approaches to support for African agriculture.

Investing in Africa’s Future Final Report
64
Across the board, the policy frameworks are strongly market-oriented and directed toward
developing African agriculture as a business, not only a producer, of more food. They thus stress
improving farmer productivity by developing input markets and providing access to modern
technology, and they stress the generation of cash income by connecting farmers to local,
regional, and international markets. One future issue to be addressed is whether organizational
fragmentation in the system is an obstacle to the effective use of resources and achievement of
the vision for African agriculture embedded in the policy frameworks.
A parallel question that arises from our survey of the institutional landscape concerns the
transparency and accountability of decision-making, especially in the relationship between
USAID and Congress. Congress creates and USAID manages earmarks in a manner that is
generally shielded from public view and input. Yet, earmarks appear to drive both strategy and
day-to-day resource allocation for agricultural development assistance. There is striking
congruence among the four themes in USAID’s new agriculture strategy and the congressional
earmarks for trade capacity building, biodiversity, biotechnology, and the Collaborative
Research Support Programs (which, in combination with legislated earmarks for basic education,
control most of USAID’s DA budget account—the primary source agricultural development
assistance).
Earmarks seem more likely to be driving USAID strategy than USAID strategy driving
earmarks. In our system of government, earmarking is a congressional prerogative, but on what
basis are earmarks established? On what basis can Congress or USAID assure the U.S. public
and development partners in Africa that the resulting resource allocations make the most sense
for Africa? The answers to these questions are not clear.

Investing in Africa’s Future Final Report
65
References
ADB/ADF (African Development Bank, African Development Fund). 2000. Agriculture and
Rural Development Sector Bank Group Policy. January. http://www.afdb.org/en/layout/
set/print/content/download/958/6421/file/agri_policy_apr2000.pdf (accessed March 28,
2005).
ADB/ADF. 2004. Bank Group Policy on Poverty Reduction. February. Available from
http://www.afdb.org/psdu/poverty/policy_politique/bank_group_policy_on_poverty_
reduction (accessed March 28, 2005).
ADBG (African Development Bank Group). n.d. ADBG Home Page. http://www.afdb.org/en
(accessed March 28, 2005).
ADF (African Development Foundation). 2003. Innovative Investments in Africa’s Future: ADF-
Funded Projects—Fiscal Years 2002–2003. http://www.adf.gov/ADF200203report.pdf
(accessed March 28, 2005).
ADF (African Development Foundation). n.d. ADF Home Page. http://www.adf.gov (accessed
March 28, 2005).
Arnold, Nathan. 2005. Personal communication from Nathan Arnold, Peace Corps, Office of
Press Relations, to the authors, May 25.
Brown, Jocelyn. Personal communication from Jocelyn Brown, assistant deputy administrator,
ICD/FAS/USDA, to the authors, Feb. 4.
FAO (Food and Agriculture Organization of the United Nations). 2000. The Strategic
Framework for FAO 2000–2015. Available from http://www.fao.org/strategicframework/
(accessed March 24, 2005).
FAO. 2003. Adjustments to the Programme of Work and Budget 2004–05. Available from
http://www.fao.org/pwb/2005/ (accessed March 24, 2005).
FAO. n.d. FAO Home Page. http://www.fao.org (accessed March 28, 2005).
IFAD (International Fund for Agricultural Development). n.d. IFAD Home Page: Enabling the
Rural Poor to Overcome Poverty. http://www.ifad.org (accessed March 28, 2005).
Manheim, Marianne. 2005. Personal communication from Marianne Manheim, Peace
Corps FOIA/Privacy Act Specialist, to the authors, June 27.

Investing in Africa’s Future Final Report
66
MCC (Millennium Challenge Corporation). 2003. Background Paper: Implementing the
Millennium Challenge Account. Feb. 5. http://www.mcc.gov/about_us/key_documents/
MCA_BackgroundPaper_FactSheet.pdf (accessed March 28, 2005).
MCC. n.d. MCC Home Page: Reducing Poverty through Growth. http://www.mcc.gov (accessed
March 28, 2005).
Natsios, Andrew S. 2001. Testimony before the Senate Appropriations Committee
Subcommittee on Foreign Operations. May 8. (http://www.usaid.gov/press/spe_test/
testimony/2001/ty010508.html (accessed March 24, 2005).
OECD (Organisation for Economic Co-operation and Development). n.d. CRS Online Database
on Aid Activities. Available from http//:www.oecd.org/dac/stats/idsonline (accessed April
3, 2005).
OPIC (Overseas Private Investment Corporation). n.d. OPIC Home Page. http://www.opic.gov
(accessed March 28, 2005).
Peace Corps (U.S. Peace Corps). n.d. About the Peace Corps: Where do Volunteers Go?
Available from http://www.peacecorps.gov/index.cfm?shell=learn.wherepc.africa
(accessed April 25, 2005).
Peace Corps. Various years. Congressional Budget Justifications.
State Dept./USAID (U.S. Department of State and U.S. Agency for International Development).
2003. Strategic Plan: Fiscal Years 2004–2009. August.
U.N. (United Nations). 2002. Report on the International Conference on Financing for
Development, Monterrey, Mexico, March 18–22. http://www.un.org/esa/ffd/aconf198-
11.pdf (accessed March 28, 2005).
U.S. Department of State. 2004. Inaugural Board Meeting of the Millennium Challenge
Corporation. Bureau of Public Affairs, Feb. 2. http://www.state.gov/secretary/former/
powell/remarks/28721.htm (accessed March 24, 2005).
USAID (U.S. Agency for International Development). 2003. USAID Organization Chart.
January. http://www.usaid.gov/about_usaid/orgchart.html (accessed March 25, 2005).
USAID. 2004a. On the Front Lines: Performance and Accountability Report, Fiscal Year 2004.
Nov. 15. http://www.usaid.gov/policy/par04/management.pdf (accessed March 28, 2005).

Investing in Africa’s Future Final Report
67
USAID. 2004b. USAID Agriculture Strategy: Linking Producers to Markets. PD-ABZ-800. July.
http://www.usaid.gov/our_work/
agriculture/ag_strategy_9_04_508.pdf (accessed March 25, 2005).
USAID. 2005. Initiative to End Hunger in Africa (IEHA). USAID sub-Saharan Africa.
http://www.usaid.gov/locations/sub-Saharan_africa/initiatives/ieha.html (accessed March
28, 2005).
USAID. n.d. Africa: Country and Regional Programs. http://www.usaid.gov/locations/sub-
Saharan_africa/countries/ (accessed April 3, 2005).
USAID. Various years. Congressional Budget Justifications. Available from
http://www.usaid.gov/policy/budget/ (accessed March 30, 2005).
USAID/FFP (U.S. Agency for International Development/Office of Food for Peace). 1995. Food
Aid and Food Security Policy Paper. Feb. 27.
http://www.usaid.gov/policy/ads/200/foodsec/foodsec.pdf (accessed March 25, 2005).
USDA (U.S. Department of Agriculture). 2003. International Training and Cooperation from
the Farm Gate to the Dinner Plate. Foreign Agricultural Service, Food Industries
Division. http://www.fas.usda.gov/dlp/food-industries/index.html (accessed March 24,
2005).
USDA. n.d. Foreign Agricultural Service Home Page. http://www.fas.usda.gov/ (accessed March
28, 2005).
USDA FAS (U.S. Department of Agriculture, Foreign Agricultural Service). 2005. FAS Online:
The Development Resources Division and USDA International Technical Assistance.
http://www.fas.usda.gov/icd/drd/drd.html (accessed March 28, 2005).
USTDA (U.S. Trade and Development Agency). n.d. USTDA Home Page. http://www.ustda.gov
(accessed March 28, 2005).
WFP (U.N. World Food Programme). 2005. Facts and Figures. http://www.wfp.org/aboutwfp/
facts/index.asp?section=1&sub_section=5 (accessed March 24, 2005).
World Bank Group. 2003. Reaching the Rural Poor: A Renewed Strategy for Rural
Development. Washington, DC: International Bank for Reconstruction and
Development/World Bank. Available from http://www-wds.worldbank.org/servlet/
WDS_IBank_Servlet?pcont=details&eid=000094946_03092504152762 (accessed March
24, 2005).
Investing in Africa’s Future Final Report
68
World Bank Group. 2004. Annual Report. http://www.worldbank.org/annualreport/2004/
(accessed March 28, 2005).
World Bank Group. 2005. Africa: Active Projects. http://web.worldbank.org/external/default/
main?menuPK=258671&pagePK=146740&pagesize=20&pagetitle=Active%20Projects
&piPK=146810&status=A&theSitePK=258644 (accessed April 3, 2004).
World Bank Group. n.d. The World Bank Group Home Page. http://www.worldbank.org/
(accessed March 28, 2005).

Investing in Africa’s Future Final Report
69
Notes: CFO = chief financial officer, GDA = Global Development Alliance, CIO = chief information officer, ANF = Bureau for Africa, ANE = Bureau for Asia and the Near East, LAC = Bureau for Latin America and the Caribbean, E&E = Bureau for Europe and Eurasia, DCHA = Bureau for Democracy, Conflict, and Humanitarian Assistance. Source: USAID 2003.
Figure 2-1. USAID Organizational Chart
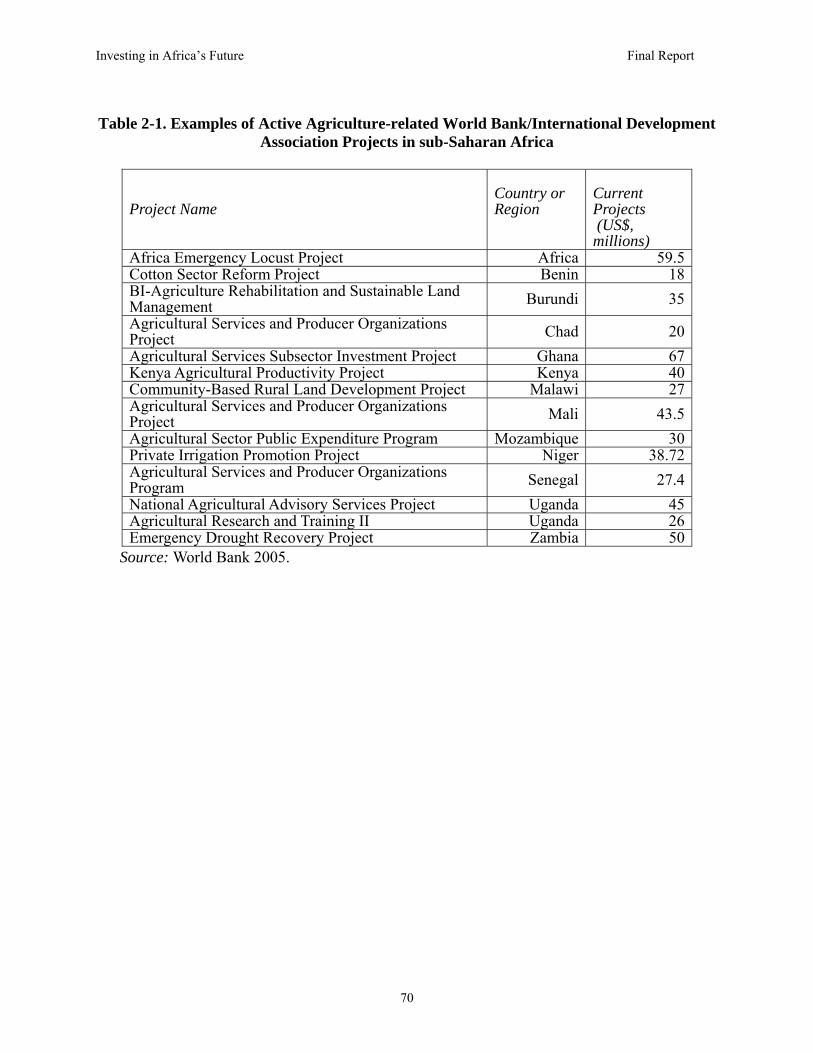
Investing in Africa’s Future Final Report
70
Table 2-1. Examples of Active Agriculture-related World Bank/International Development
Association Projects in sub-Saharan Africa
Project Name
Country or Region
Current Projects (US$, millions)
Africa Emergency Locust Project Africa 59.5Cotton Sector Reform Project Benin 18BI-Agriculture Rehabilitation and Sustainable Land Management Burundi 35Agricultural Services and Producer Organizations Project Chad 20Agricultural Services Subsector Investment Project Ghana 67Kenya Agricultural Productivity Project Kenya 40Community-Based Rural Land Development Project Malawi 27Agricultural Services and Producer Organizations Project Mali 43.5Agricultural Sector Public Expenditure Program Mozambique 30Private Irrigation Promotion Project Niger 38.72Agricultural Services and Producer Organizations Program Senegal 27.4National Agricultural Advisory Services Project Uganda 45Agricultural Research and Training II Uganda 26Emergency Drought Recovery Project Zambia 50
Source: World Bank 2005.

Investing in Africa’s Future Final Report
71
3
Recent Trends in U.S. Funding of Agricultural Development
Assistance for Africa
In this chapter, we report on how the institutions described in Chapter 2 have funded U.S.
agricultural development assistance for Africa over the period 2000–2004. Over the last quarter
of the twentieth century, the level of funding for African agriculture by all donors was a roller-
coaster ride, roughly doubling in real terms from 1975 to the late 1980s before retreating to mid-
1970s levels by 2000, as well described and documented by Eicher (2003). This up-and-down
trend is reflected in the statistics compiled by the Development Assistance Committee of the
OECD, the record of World Bank activity over the period, and the levels of U.S. assistance for
agriculture in Africa and other developing regions.
The decline in development assistance for agriculture leading up to 2000 has many
possible explanations, including the competing need to respond to short-term food crises, the
shift of priorities to the social sector (especially health and education), and questions about the
effectiveness of such assistance. While this history of agricultural assistance has some important
lessons to teach (Kumar 1995; Lele 1991), our purpose in preparing this report is to provide a
springboard for considering the future of U.S. assistance for African agriculture by describing
and analyzing current trends in U.S. funding.
Our analysis shows that based on a broad definition of agricultural development
assistance, overall U.S. funding for African agriculture has risen only slightly in absolute
terms—barely enough to keep up with inflation—and has lagged significantly behind growth in
U.S. foreign assistance globally and in U.S. assistance for health and other non-agricultural
sectors in Africa. In this chapter, we support and go beneath these broad observations to describe
and analyze the funding streams for African agriculture as they flow through a dozen bilateral
and multilateral agencies, with particular emphasis on USAID. The result is a quantitative
picture of the overall U.S. financial contribution to African agriculture sufficient to gauge the
magnitude of U.S. funding and observe trends; it is by no means an audit-quality documentation
of expenditures. The softness of some of the calculations in this report reflects limitations on the
Investing in Africa’s Future Final Report
72
available data. Each information source that we relied on for this analysis has limitations that
affect the precision, completeness, and comparability of the data on funding levels. Most
fundamentally, there is no single, accepted definition of agricultural development assistance, and
USAID—the lead funder of such assistance—does not use this term in describing its agriculture-
related spending levels and activities.
As explained in Chapter 1, we embrace a broad definition of agricultural development
assistance in this report; it includes support for any activity that as a primary purpose contributes
to the ability of agriculture to foster rural economic development and reduce poverty and hunger.
It thus includes the many activities that enhance productivity on the farm, including natural
resources management, as well as efforts to create an enabling policy and institutional
environment for agriculture (ranging from improved land tenure systems to liberalized trade
rules to applied agricultural research), develop markets for agricultural inputs and outputs, build
rural roads and other physical infrastructure necessary for market access, facilitate rural
employment through agribusiness and value-added processing of agricultural commodities, and
build agricultural export capacity and opportunity.
With this broad understanding of agricultural development assistance as the starting
point, we describe and quantify USAID and other U.S. assistance for agricultural development in
Africa, with the limitations duly noted. One goal of the report is to foster movement toward a
widely accepted and consistent way to describe and quantify agricultural development assistance.
In the meantime, our approach suffices to paint a quantitative picture of the current program and
its funding trends, something that previously has not been available and can usefully inform
stakeholders and policymakers alike.
We begin this chapter with funding levels and trends in the USAID program from 2000
to 2004. Then, we describe bilateral funding for agricultural assistance over this period by other
U.S. agencies, including the USDA, the TDA, and the ADF. Next, we present an overview of
U.S. funding for African agriculture through the multilateral institutions: the FOA of the United
Nations, the WFP, the World Bank, the IFAD, and the ADB/ADF. We conclude the chapter with
estimates of total U.S. funding for agricultural development assistance in Africa.
Investing in Africa’s Future Final Report
73
USAID’s Bureau for Africa Funding Levels and Trends
The majority of USAID’s funding for agricultural development assistance in Africa is funded
through the Bureau for Africa, which allocates resources to field offices and regional programs.
The most difficult analytical challenge that we faced in doing the research for this report is that
the Bureau for Africa, working within the USAID budgeting and programming system, does not
categorize or report on its agriculture-related development activities as “agricultural development
assistance” or any similar descriptor; instead, it uses strategic objectives (discussed in Chapter
2), any one of which may include both agriculture- and non-agriculture-related activities. This
approach to defining strategic objectives has advantages as an element of USAID’s results-
oriented management philosophy but it means that USAID provides no official estimate of the
resources it devotes annually to fostering agricultural-led economic growth in rural Africa or
elsewhere.
To fill this information gap, we used two measures of the Bureau for Africa’s resource
flows for agriculture that are reasonable indicators of USAID resource trends and priorities for
agricultural development assistance, in the broad sense in which we use the term. The first
indicator is based on the level of funding provided to USAID field offices and other operating
units in Africa in the sectoral categories that could be used for agricultural development
assistance purposes as we broadly define them. The second indicator is the estimated level of
those available resources that are actually used to support agriculture-related strategic objectives.
These two indicators are described in the next few paragraphs. The descriptions are followed by
a presentation and analysis of the relevant data on Africa Bureau funding of agriculture-related
strategic objectives, funding for agriculture in Africa through FFP and EGAT, and, finally, an
estimate of total USAID funding for agriculture-led economic growth in Africa.
As explained in Chapter 2, most of the funding that Congress provides for USAID’s non-
emergency development assistance programs in Africa—from maternal and child health to
agricultural development—is appropriated through four accounts: Child Survival and Health
(CSH), Development Assistance (DA), the Economic Support Fund (ESF), and Title II of P.L.
480. Funds appropriated in the CSH, DA, and ESF accounts are allocated by USAID’s Bureau of
Policy and Program Coordination to the Bureau for Africa and other regional and pillar bureaus
at USAID headquarters. The bureaus, in turn, allocate shares to operating units (such as the
Investing in Africa’s Future Final Report
74
country missions abroad), where the funds finance the operating unit’s strategic objectives. PPC
and FFP allocate Title II resources from headquarters to the country level for emergency and
non-emergency uses, including agricultural development.
Nearly all USAID agricultural development assistance in Africa is funded through non-
emergency Title II food aid and the DA account. The approximate share of Title II food aid that
is used specifically for agricultural development can be calculated for a particular African
country from information published in FFP’s annual reports (see Appendix 3-C). These reports
include country-specific estimated percentages of food aid allocations used for agricultural
development purposes from each cooperating sponsor’s annual food aid allotment. Our report
relies heavily on those USAID estimates. USAID makes no similar estimate for DA funds used
for agricultural development, reflecting the fact that field offices and other operating units pursue
agriculture-related initiatives through strategic objectives that are rarely labeled “agricultural
development” and often encompass multiple, related objectives.
When the Bureau for Africa allocates its DA resources to the field, however, it does so in
several categories or sectors, of which three—Agriculture, Economic Growth, and
Environment—can be used to fund strategic objectives intended to foster agriculture-led
economic growth, at least in part. In fact, with the exception of relatively minor ESF funding, the
DA funds allocated to these three sectors are the sole source of resources that are available to
USAID field units to fund agriculture-related strategic objectives in Africa, and according to our
estimates, as much as 90% of these funds go to agriculture-related projects. The patterns of DA
resource allocation among these three sectors and their levels of funding in relation to other
sectors are thus good indicators of resource trends and priorities associated with agricultural
development in Africa. These patterns and levels are indicators rather than direct measures of
resource trends, however, because not all of the resources allocated to these sectors are used to
foster agricultural development.
The second major indicator of resource allocation for agricultural development purposes
is the actual programming of resources (rather than simply having the resources available) to
agriculture-related strategic objectives at the operating-unit level, which comes closer to being a
direct measure than an indicator. However, it falls short as a direct or precise measure because
strategic objectives are not described in terms of inputs to development, such as agricultural
development assistance, but in terms of desired outcomes, such as “increased rural incomes” or

Investing in Africa’s Future Final Report
75
“accelerated economic growth,” which may be achieved by both agriculture- and non-
agriculture-related interventions. Thus, in some cases, it is necessary to estimate the percentage
of resources funding a particular strategic objective that can be fairly considered as assistance for
agriculture-led rural economic growth and poverty reduction.
Neither of these indicators alone provides a precise measure of agricultural development
assistance for African agriculture, but together they provide a reasonable and informative picture
of recent funding trends and priorities.
Indicator One: DA Account Funds Available22
USAID’s funding of agricultural development assistance in Africa is best understood first in
comparison with the agency’s overall funding, globally and in Africa. From FY2000 through
FY2004, total USAID funding available for all activities worldwide averaged $8.5 billion
annually, excluding wartime supplemental appropriations for Iraq and other nonrecurring
appropriations (Table 3.1). This total USAID funding supports long-term development activities,
short-term disaster relief, and other humanitarian assistance as well as more politically motivated
assistance.
As discussed earlier, USAID draws resources for its long-term development activities,
including agricultural assistance in Africa, from four appropriation accounts: CSH, DA, ESF,
and P.L. 480, Title II (of which the non-emergency food aid resources are relevant and reported
here). The development resources in these four accounts provide a sizable majority of the total
funds managed by USAID, 53–78% annually from 2000 to 2004. The annual allocations of funds
appropriated to these accounts globally and for Africa from FY2000 to FY2004 are presented in
Table 3-1.
Of these four accounts, ESF is by far the largest, comprising 45% of the total funds
available to USAID in these four accounts for non-emergency purposes from FY2000 to
FY2004. Co-managed by USAID and the Department of State, ESF funds are allocated primarily
on the basis of political and national security considerations. Although ESF is an important
source of USAID development funds globally, only 2.7% of ESF funds were allocated to
countries in sub-Saharan Africa from FY2000 through FY2004, averaging $90 million annually
22 In this section, USAID budget figures are drawn from USAID annual Congressional Budget Justifications for FY2000 through FY2004 (USAID various years) unless otherwise noted.

Investing in Africa’s Future Final Report
76
over the five years. Only a small portion of this allocation was used for agricultural development
purposes.23
The second largest of the accounts, CSH, funds only health-related activities. Thus,
beyond the one-quarter to one-third of agricultural development assistance funded by Title II
food aid, nearly all USAID funding for such activities in Africa is funded from the agency’s DA
account. Therefore, to understand trends in USAID funding of agricultural development, it is
important to analyze trends in the DA account, including funding allocations within the account
and comparisons of DA funding with the funding of other USAID accounts. The basic
information required for this analysis is provided in Tables 3-1 and 3-2, and funding trends are
depicted in Figure 3-1.
Analysis of USAID budget allocations reveals that over the five-year period from
FY2000 through FY2004, growth in funding for Africa in general and African agriculture in
particular has lagged behind growth in funding for other regions and sectors. More specifically:
• allocation of DA funds for use in sub-Saharan Africa grew more slowly than the funds
appropriated to the DA account globally;
• the CSH account grew substantially more quickly than the DA account, both globally and in
Africa;
• within the DA account, resources for non-agriculture sectors grew more rapidly than for
sectors used to fund agricultural development; and
• the President’s Initiative to End Hunger in Africa, which is funded from the DA account, has
not significantly increased funding available for agricultural development assistance in
Africa.
Lagging Overall Resource Growth
Excluding wartime supplemental allocations and other nonrecurring items, USAID’s overall
resources grew modestly (only 16%) from 2000 to 2004. Funding for the four accounts that
23 During fiscal years 2001–2004, Africa field offices reported allocating a total of $15.7 million of their ESF resources for purposes in the Agriculture sector, which was 4% of the total ESF funding for Africa in the period. They reported allocating a total of $68.2 million over the four years, or 17.5% of the total, for purposes in the three agriculture-related sectors—Agriculture, Economic Growth, and Environment—combined (Johnson 2005), which means the funds may have been used for purposes within the broad definition of agricultural development assistance adopted for this report. We have made no assessment of how the ESF funds were actually used.

Investing in Africa’s Future Final Report
77
support long-term development fared better, however, increasing from $4.98 billion to $6.84
billion (37%) over the five-year period. Funding from these accounts for sub-Saharan Africa
fared less well, increasing from $954 million to $1.23 billion (29%) over the same period.
The disparity in funding growth between Africa and the rest of the world is even sharper
in the DA account, which is critical for agriculture. Globally, DA funding increased from $981
million in FY2000 to $1.38 billion in FY2004 (40%). In sub-Saharan Africa, DA funding
increased from $447 million to $494 million (10.5%) over the same period, barely keeping pace
with inflation.24
CSH vs. DA Funding
Most of the recent gain in total development funding, globally and for sub-Saharan Africa, has
occurred in the CSH account, which grew much more rapidly than the DA account. Globally,
CSH grew 116% (from $844 million to $1.82 billion) from 2000 through 2004, compared with a
40% growth in global DA. The CSH increase in sub-Saharan Africa was only half as rapid but
still substantial at 61% (from $295 million to $474 million) compared with a 11.5% growth in
DA funding in sub-Saharan Africa.
The disparity in funding between USAID’s CSH and DA accounts tells only part of the
story about the priority accorded to health in the government’s international assistance budget.
President Bush has made a five-year, $15 billion dollar commitment to fight HIV/AIDS.
Globally, USAID allocates about $500 million annually to HIV/AIDS programs from its CSH
account, but a substantial and growing portion of the U.S. contribution for HIV/AIDS is funded
through the Department of State. More than $400 million from the State Department’s 2004
budget went to the Global HIV/AIDS Initiative, with more than $1.3 billion slated for 2005 and a
request of nearly $2 billion pending in the president’s FY2006 budget for the Department of
State.
Stagnant DA Funding for Agriculture-Related Sectors
Within the DA account, funding for activities to foster agriculture-led economic growth comes
from the agency’s allotments to three sectors: Agriculture (which, beginning in 2002, included
funding designated for IEHA), Economic Growth, and Environment. Total funding for these

Investing in Africa’s Future Final Report
78
sectors rose from $284 million in 2000 to $304 million in 2004, or a gain of 7% in absolute terms
(Table 3-2). After adjusting for inflation, however, approximately 3% less DA resource was
available for agricultural development in real terms, and the share of total DA funding in Africa
available for agriculture-related purposes decreased from 64% in 2000 to 61.5% in 2004. In
contrast, DA funding in the Education sector grew 35% in absolute terms over the period and
went from 21.4% to 25.9% of total DA funding allocations in Africa.
Effect of IEHA on DA Funds Available
Funding for IHEA began in FY2002 with an allotment of $5 million from the Bureau for
Africa’s DA funds, followed by $27 million in 2003, and $47 million in both 2004 and 2005.
Although reported separately, the IEHA funds come from the Agriculture sector of the DA
account. As shown in Table 3-2, the increasing funding allocations to IEHA were largely offset
by reductions in other DA sectors that USAID field offices use to fund agricultural development
activities in Africa. Thus, total funding in these sectors was only $9 million more in 2004 than it
had been in 2002, the year IEHA was initiated.
The IEHA allocations were offset specifically by reduced funding for non-IEHA
activities in the Agriculture sector, which declined by $20 million from 2002 to 2004, and the
Economic Growth sectors, which declined $18 million .Even in the eight countries and three
regional programs chosen to receive IEHA funding, the gains from IEHA were largely offset by
funding reductions in other Agriculture, Economic Growth, and Environment sectors (Figure 3-
2). Although total IEHA funding was $47 million in 2004, the total amount of DA funds
available for agriculture-related projects in IEHA countries and programs increased by $13
million (9%) in the two years of IEHA’s existence—not quite keeping pace with inflation—and
the total of such funding was lower in 2004 than in 2000.
The fact that IEHA resources are not additive does not mean that the IEHA initiative
lacks value. IEHA has been a vehicle for focusing efforts in a way that is intended to reduce
hunger by improving agricultural productivity and income generation with better technology and
access to markets, in keeping with the overall USAID agriculture strategy. However, IEHA has
not mobilized new DA resources to support agriculture-led economic growth and poverty
reduction in Africa. Of course, the Bureau for Africa’s DA account is not the only source of 24 According to the Bureau of Labor Statistics (BLS n.d.), total inflation adjustment between 2000 and 2004 was

Investing in Africa’s Future Final Report
79
USAID funding for activities to support agricultural development in Africa. The other two
primary sources are P.L. 480, Title II food aid and DA funds allocated to EGAT. However,
neither of these sources has significantly increased funding for agricultural development in
Africa since 2000: Title II food aid resources for this purpose grew from an estimated $86
million in FY2000 to $96 million in FY2004 and similar EGAT funding increased from an
estimated $23 million in 2000 to an estimated $31 million in 2004.
A Note on Africa Bureau Appropriations for 2005 and 2006
This report analyses USAID funding of agricultural development assistance through
FY2004 because that is the last year for which necessary information was available on USAID
programming of its DA and food aid resources and on the budgets of other relevant U.S. and
multilateral agencies. The FY2005 USAID budget and the president’s currently pending request
for USAID funding in his FY2006 budget submission are worth noting here, but they raise more
questions than they answer about future trends in USAID funding for agricultural development
assistance.
In the critical DA account for Africa, FY2005 funding increased to $547 million from
$494 in 2004, for a gain of almost 11%, but most of this gain was allocated to the Education and
Democracy/Conflict sectors (Table 3-2). This left a gain of less than 5% (about $13 million) in
allocation of resources to the three sectors from which agricultural development assistance is
funded; and funding for IEHA was flat at $47 million. In contrast, the Africa Bureau funding for
education increased in FY2005 by 16% over FY2004, driven at least in part by the $300 million
congressional earmark for basic education.25
The small 2005 increase over 2004 in funds available for agricultural development
reversed the decline that had occurred from 2003 to 2004, but the president’s FY2006 budget
submission for USAID and initial congressional action foreshadows at best static funding and
possibly another downturn. The president’s global DA request for USAID was $1.1 billion,
down 24% from 2005, while the Africa DA request was $428 million, down 22% from 2004.
10%. 25 CSH funding for Africa Bureau declined in FY2005 but this reflects the fact that approximately $600 million in HIV/AIDS funding allocated to focus countries in Africa and elsewhere was shifted to a Department of State account through which the president’s HIV/AIDS initiative is being managed.

Investing in Africa’s Future Final Report
80
The president proposed to maintain the global earmark for basic education, which comes out of
the DA account, at the same $300 million that was adopted by Congress in 2005.
At this writing, the House and Senate have passed differing versions of the Foreign
Operations appropriations bill (H.R. 3057), which will have to be reconciled in conference
committee. On June 28, 2005, the House approved global DA funding of $1.46 billion, well
above the president’s request but just about level with the 2005 appropriated level. On July 20,
the Senate passed a version of H.R. 3057 that included an increase to $1.675 billion in global DA
funding. Both the House and the Senate voted to increase the basic education earmark from $300
million in 2005 to $365 million and $350 million, respectively, in 2006.
Once Congress passes a final budget for USAID, it will remain to be seen how USAID
allocates its DA funding to Africa and other regions, how responsibility for meeting the
education earmark will be distributed among the regions and field programs, and how the
remaining DA budget will be allocated to the sectors that relate to agricultural development.
With DA funding for Africa unlikely to increase significantly, however, and the earmark for
education being increased, it is reasonable to expect that USAID funds available for agricultural
development assistance in Africa will at best remain stagnant in 2006.
As discussed in Chapter 2, the Millennium Challenge Account is likely over the next few
years to substantially alter the U.S. funding picture for African agriculture. As of this writing,
two of the four approved compacts involve African countries (Madagascar and Cape Verde) and
have a strong emphasis on poverty reduction through agriculture-led rural economic growth. The
Madagascar compact includes funding of $110 million over four years, while Cape Verde
receives the same amount over five years. These funding levels, averaged out annually, exceed
the estimated annual USAID funding of agriculture-related strategic objectives in any other sub-
Saharan African country (See Table 3-3). With six other Africa countries already eligible for
MCA funding and seven others in the “threshold” category, the MCA funding for agricultural
development could soon exceed USAID’s. Critical issues for the future include how the MCA
and USAID programs should relate to each other operationally and ensuring that MCA funding
for agriculture does not simply displace USAID funding.
Investing in Africa’s Future Final Report
81
Indicator Two: Resources Committed to Agriculture-Related Strategic Objectives
The first indicator of trends in USAID funding of agricultural development assistance measures
funds available for that purpose, which can be determined fairly precisely from data in USAID
budget documents. It is an indicator rather than a direct measure, however, because it measures
funds available for—rather than funds actually programmed for—agriculture-related activities.
The second indicator attempts to measure funds actually programmed but is labeled an
indicator here because it is based largely on estimates—rather than USAID reporting—of the
extent to which funds are programmed to support agriculture-led economic growth and poverty
reduction. These estimates were derived by reviewing the descriptions of the strategic objectives
being pursued by all the USAID field offices in Africa as presented in USAID’s Congressional
Budget Justification documents (USAID various years). Each office typically pursues several
strategic objectives related to key components of the overall USAID development strategy, such
as health, education, governance, economic growth, and poverty reduction. The objectives and
the specific activities the office funds to achieve them are defined by the field office according to
its assessment of local needs and opportunities. The Congressional Budget Justifications briefly
describe the activities and resources allocated to each strategic objective.
Strategic objectives devoted entirely to health care or basic education clearly do not
qualify as agricultural development assistance, so we exclude them in our estimates. Many
strategic objectives clearly do qualify because they focus entirely on fostering agriculture’s
contribution to economic growth and poverty reduction (e.g., the Rural Incomes strategic
objective adopted by USAID’s Mozambique Mission, which includes diverse activities to
improve agricultural production, expand rural business enterprises, and improve transport
infrastructure); we include 100% of their funding in our estimates. More problematic are the
strategic objectives that include both agriculture-related and agriculture-unrelated activities (e.g.,
addressing trade policy and other elements of the enabling environment for private-sector
economic activity in an effort to benefit both agricultural and non-agricultural sectors of the
country’s economy and the strategic objective on Sustainable Agriculture and Economic
Development in Nigeria, which is currently focused heavily on agriculture but previously also
included activities to support the privatization of hotels, airlines, and insurance companies).
The reality of how USAID allocates and publicly reports its field-level spending means
that deriving estimates of USAID’s agriculture-related expenditures requires making judgments.
Investing in Africa’s Future Final Report
82
For the strategic objectives that are not clearly classifiable as fully related or fully unrelated to
agricultural development, we assigned an estimated percentage of the share of each strategic
objective’s resources that could fairly be attributed to support for agricultural development based
on the Congressional Budget Justification descriptions of the strategic objectives from 2000 to
2004. This process was aided for 2003 and 2004 by greater detail on the allocation of a strategic
objective’s resources among specific activities, which was not available in the Congressional
Budget Justifications for 2000–2002.
Recognizing this limitation on publicly available information and the inherent
subjectivity of some of the judgments involved in determining the percentage of a strategic
objective’s resources that is fairly considered agricultural development assistance, we took two
approaches. First, to each strategic objective that was not 100% related or 100% unrelated to
agriculture, we assigned one of three percentage estimates of the portion of the strategic
objective’s funding that would be included: 25%, 50%, or 75%. Attempts at greater precision
seemed unjustified due to the relative generality of some of the available information. Then, we
calculated total agriculture-related assistance by country and region by applying those
percentages to the total reported funding for the strategic objective. The results of these
calculations are listed in Table 3-3.
Given the uncertainty of any point estimate, we also made range estimates by dividing
the spectrum of possible attributions to agriculture into thirds. Thus, in this approach, the 25%,
50%, and 75% estimates were replaced by range estimates of 0–33%, 33–67%, and 67–100%,
and calculations made accordingly (Table 3-3A). Appendix 3-A contains a list of all the strategic
objectives that appeared to have potential relevance to fostering agriculture’s role in economic
growth and poverty, with notes on the percentages assigned to each for purposes of calculating
the estimated levels of funding for agricultural development assistance reported in Tables 3-3
and 3-3A.
The estimates in Tables 3-3 and 3-3A are just that. They should not be misconstrued or
reported as hard numbers on actual USAID programming of funds for agricultural development
because, for reasons already discussed, such numbers are not available. However, these estimates
are a useful indicator of funding levels and trends and support several observations.
First, they verify the central role agriculture plays in USAID’s economic development
strategy in Africa. Whereas the majority of resources allocated to the Bureau for Africa from
Investing in Africa’s Future Final Report
83
USAID’s CSH and DA accounts (about 62% in FY2004) are committed by congressional
directive to health and education, most of the remainder of the DA account funding appears to be
used for agriculture-related purposes, as broadly construed for purposes of this report. Between
FY2000 and FY2004, funding for agriculture-related strategic objectives managed by USAID
field offices and programs consumed an estimated 71% of the available Agriculture/IEHA,
Economic Growth, and Environment sector funding in the DA account (as calculated from data
in Tables 3-2 and 3-3), with additional funds from these agriculture-related sectors being used
for agricultural purposes in centrally managed programs.
Second, the total estimated programming of funds for agriculture-related strategic
objectives is 21% greater in FY2004 than in FY2000 ($226 million versus $187 million), but the
trend is unclear. The estimate for FY2004 is less than for FY2003 ($226 million versus $243
million). The higher estimates for FY2002 and FY2003 coincide with the first budget years
under USAID Administrator Andrew S. Natsios (who stressed agriculture from the beginning of
his tenure) and are accompanied by modest increases in funds potentially available for
agriculture in the DA account (Table 3-2). The lower estimate for FY2004 is accompanied by a
slight decrease in available DA funds.
Third, the funding of agriculture-related strategic objectives was widely distributed
across 24 countries and four regional programs, with about 70% of the field-managed resources
being programmed at the country level ($6.2 million per year, on average) and 30% at the
regional level. However, the bulk of the country-level funds (two-thirds of the total estimated
funding), went to the top nine recipient countries, which averaged and $11.1 million total
annually (Table 3-4), whereas the remaining 15 countries received only $3.3 million annually on
average. This uneven distribution reflects the tendency of resources to be concentrated in
countries that show promise in improving their agricultural systems. In fact, seven of the top nine
recipient countries between FY2000 and FY2004 were the same seven that began receiving
IEHA allocations in FY2003.
The uneven distribution also raises the issue of resource fragmentation. Even in the top
nine countries, the allocations are modest compared with the magnitude of the task of building
productive, market-oriented agricultural systems in these countries, as called for by USAID’s
agriculture strategy. Moreover, in most of these countries, the resources available to fund the
agriculture-related strategic objectives are divided among multiple contractors and grantees, who

Investing in Africa’s Future Final Report
84
implement distinct activities to help achieve the strategic objective. The fragmentation issue is
even more acute in countries where the strategic objectives receive less funding. This issue is
addressed in more detail in the four country studies included this report (Appendices 4-A through
4-D).
Food Aid Funding
After the flow of resources through the Bureau for Africa, the next largest source of USAID
funds for agricultural development assistance in Africa is the P.L. 480, Title II food aid program
managed by FFP. Congress makes an annual appropriation of funds for Title II, which FFP uses
to purchase commodities that cooperating sponsors use for emergency feeding programs or non-
emergency development programs (e.g., through food-for-work or sale of the commodity to
generate local currency) in the receiving country. To help organizations implement such food aid
programs, Section 202(e) of Title II also provides for cash payments of 5–10% of the annual
appropriation.
FFP reports annually on its non-emergency Title II program, providing information by
country on the quantity and dollar value of the commodities granted to each cooperating sponsor
in a country together with an estimate of the portion of each grant that is devoted to Agriculture,
Health and Nutrition, Education, and other sectors. The resource levels we relied on in preparing
this report are from USAID data tables (reproduced in Appendix 3-B) that include the value of
the commodity and the dollar amount of Section 202(e) funds provided to each cooperating
sponsor.
It is important to note that the commodity values that FFP reports include the freight
costs to move the commodity to the receiving country. Although it is a fair way to express the
U.S. cost to provide the food aid, it overstates the value of the development assistance actually
received on the ground. Freight costs vary, but the rough estimation adopted for this report is that
freight consumes about one-third of the stated value of the commodity.26 Table 3-5 includes both
FFP-reported values and values adjusted to exclude freight costs.
As indicated in Table 3-5 and based on FFP’s Title II annual reports, between FY2000
and FY2004 USAID distributed development food aid valued at a total of $804 million
(including Section 202(e) funds and the cost of freight) in sub-Saharan Africa. About $440

Investing in Africa’s Future Final Report
85
million of this amount (55%) was used for agricultural development purposes, thus averaging
$88 million annually. If estimated freight costs are excluded, Title II food aid used for
agricultural development purposes in Africa is valued at $290 million, or an average of $58
million annually.
The level of food aid used for agricultural development assistance (including freight)
increased from $86 million in FY2000 to $96 million in FY2004, but without any consistent
trend. This finding is not surprising in light of the constant but shifting pressures on FFP to
address emergency as well as development uses of food aid. The percentage of development
food aid used for agricultural purposes has remained fairly stable (except in FY2001) but
decreased from 56% in FY2000 to 52% in FY2004.
From FY2000 to FY2004, Title II food aid was distributed to 22 countries in sub-Saharan
Africa and USAID’s West Africa Regional Program. In all but three of the recipient countries
(Benin, Gambia, and Liberia), at least some portion of the assistance was used for agricultural
development purposes over this five-year period. In the countries that received at least some such
food aid, the average annual value was $4.6 million including and $3.1 million excluding the
cost of freight (Table 3-6).
Like agricultural development assistance from the Bureau for Africa’s DA account, Title
II food aid is distributed unevenly across the 19 countries that receive it (Table 3-7). Ethiopia
and Mozambique are by far the largest recipients, receiving 20% and 16% of the total,
respectively, from FY2000 to FY2004. The top 10 recipient countries received 90% of the total.
Thus, on average, the top 10 countries received annual food aid for agricultural development that
was valued at $7.9 million (including freight cost), whereas the remaining nine recipient
countries received $1 million each. The assistance was somewhat concentrated among countries
that received IEHA funding, but not as markedly as strategic objective funding for agricultural
development assistance discussed earlier. Four of the top six recipients of Title II food aid used
for agricultural development (Mozambique, Uganda, Kenya, and Ghana) are countries that
receive IEHA funding, but two countries that receive IEHA funding (Nigeria and South Africa)
received no Title II-financed agricultural development assistance and two others (Mali and
Zambia) are low on the development food aid recipient list. It is important to note that the
26 This estimate is based on freight costs associated with food aid shipments to Africa reported by the United States to the OECD)/DAC Creditor Reporting System (OECD various years).

Investing in Africa’s Future Final Report
86
ranking in Table 3-7 can change rapidly as the nature of the Title II program in a country
changes from emergency relief to longer term development and as funding levels change from
year to year.
Fragmentation of development food aid is as serious an issue for this kind of distribution
of development assistance as it is for the Bureau for Africa’s DA account. Of the 22 countries
receiving Title II food aid for agricultural or other development purposes, seven have programs
managed by a single cooperating sponsor. In the remaining countries, more than one cooperating
sponsor means more than one program, and in some countries several organizations run different
development food aid programs (e.g., six cooperating sponsors per country operate in Kenya and
Mozambique, and five per country operate in Ethiopia and Uganda).
EGAT Funding
EGAT is a pillar bureau in USAID that provides technical expertise to the regional bureaus and
field missions and manages its own cross-cutting portfolio of programs to foster economic
growth that places heavy emphasis on research and technology development. For example,
EGAT is the primary conduit for USAID’s support of the Consultative Group on International
Agricultural Research (CGIAR) network of research facilities and the Collaborative Research
Support Programs (CRSPs) that fund U.S. universities to undertake research of value to
developing countries.
Like the Bureau for Africa and the field offices, EGAT plans and reports on its activities
within a set of strategic objectives. The agency currently has 10 strategic objectives, of which
Agriculture, Poverty Reduction, Economic Growth, and Environment and Science Policy entail
activities to support agriculture-led economic growth and poverty reduction. However, like the
Bureau for Africa and the field offices, EGAT does not report its agriculture-related expenditures
for strategic objectives under the heading “agricultural development assistance” nor does it
ordinarily track its public expenditures by region. For example, CGIAR funding supports
laboratories worldwide, including but not limited to those located in and serving development
interests of sub-Saharan Africa. For these reasons, it is not possible to even estimate the amount
of EGAT’s program funds that is devoted to agricultural development assistance for Africa from
public reports.

Investing in Africa’s Future Final Report
87
To fill this information gap, EGAT provided its own estimates for FY2000 to FY2004
(Table 3-8). These data required estimating, for example, how much of CGIAR funding is fairly
attributable to Africa. EGAT estimates that its funding for agriculture in Africa hovered around
the $25 million level during FY2000 to FY2003, then increased to about $31 million in FY2004.
Over this period, CGIAR and CRSPs consumed the majority of EGAT’s funding for agricultural
development in Africa, averaging about $11.6 million and $8.8 million, respectively (86% of
total EGAT funding African agriculture in FY2000 and 65% in FY2004). In FY2004, however,
about $5 million more was devoted to crop-specific agricultural research and training and
another $1.2 million to the development of regulatory frameworks and mechanisms to support
the adoption of agricultural biotechnology in Africa.
EGAT funding for African agriculture is thus predominately focused on science and
technology. However, EGAT also funds the Farmer-to-Farmer Program ($2.1 million for activity
in Africa in FY2004), which sends mostly retired U.S. farmers to share their expertise with
farmers in developing countries, and the International Fertilizer Development Center, which
receives $805,000 annually for work in various African countries pursuant to a congressional
earmark.
Summary and Analysis: FY2000 through FY2004
The foregoing discussion paints a picture of the major elements of USAID funding for
agricultural development assistance in Africa. It provides the basis for understanding the relative
magnitude of these elements and how the scale of the overall program relates to other major
USAID programs and priorities.
As emphasized at the outset, however, the estimated levels of resources that USAID
invests in fostering agriculture-led economic growth and poverty reduction in Africa are not
precise; the USAID system simply is not set up to provide that information. Part of the reason is
that we adopted a particular, fairly inclusive definition of agricultural development assistance for
this report, but more fundamentally responsible is USAID’s strategic objective approach to
reporting on its programs and resource allocation. Strategic objectives tend to be expressed in
terms of broad outcomes (e.g., “Increased Rural Incomes” or “Accelerated Economic Growth”)
rather than the role or success of agriculture in fostering economic growth. USAID has good
reasons for its approach, but the approach makes it difficult to assess how the agency’s resource

Investing in Africa’s Future Final Report
88
allocation relates to its declared strategy of focusing on agriculture as a key driver of economic
growth and poverty reduction in Africa.
Although the estimates in this report could be refined with more effort, they will remain
estimates as long as the design of the USAID reporting system does not include an accounting of
resources actually committed to agriculture-led economic growth. Our confidence in the
estimates is bolstered, however, by their congruence with two facts: Administrator Natsios
pushed agriculture as a development priority, explaining the increase over 2000, but there was no
real growth in funding of the relevant sectors in the DA account, explaining why the increase
was relatively small.
The results of our information gathering and analysis of USAID funding for agricultural
development in Africa are summarized in Tables 3-9 and 3-9A. Table 3-9 lists the point
estimates of the percentage of agriculture-related strategic objectives resources that are used for
agricultural development purposes (as reported in Table 3-3), and Table 3-9A lists the range
estimates (from Table 3-3A). The data in Tables 3-9 and 3-10 (which present funding for African
agriculture in relation to other USAID-managed development funding) are the focus of the
following observations.
USAID’s estimated total funding of agricultural development in Africa has increased
19% over the past five years, from $296 million in FY2000 to $353 million in FY2004 (Tables
3-9 and 3-10). After adjustment for 10% total inflation over that period, this increase is about
9%—real but modest. However, the trend is unclear because the estimated funding level declined
slightly in FY2004, from $359 million in FY2003 to $353 million in 2004. Moreover, funding
available for agricultural development in the Bureau for Africa’s DA account has been
essentially flat in real terms and already is used predominately for agricultural purposes (Tables
3-2 and 3-3), suggesting the difficulty of further increases within current budget constraints.
Despite increased funding since FY2000 and increased attention to agriculture as a key to
Africa’s development over recent years, such funding makes up a small share of total USAID-
managed foreign assistance—less than 4% over the past five years. Even within the context of
non-emergency development assistance to Africa, agriculture receives less than one-third of the
USAID total, and agriculture’s share of total development funding in Africa has declined slightly
since 2000. African agriculture’s estimated share of USAID’s global development funding has
declined more quickly since 2000, by a total of 12% (from 5.9% to 5.2%).

Investing in Africa’s Future Final Report
89
Table 3-10 includes range estimates that reflect the uncertainty in the estimated
percentages of funding devoted to agriculture for certain African field office and regional
program strategic objectives as well as the difference in the value of Title II development food
aid with freight costs included and excluded. Our range estimates show the same basic trends as
the point estimates, which consistently fall toward the high end of the range—consistent with our
intent to avoid understating assistance levels.
The downward pressure on USAID funding for long-term agricultural development in
Africa stems from the combination of tightening DA resources worldwide and the demand for
development resources to address immediate needs elsewhere, such as in Afghanistan and Iraq.
The appropriation for USAID’s worldwide DA account declined in 2004 by $100 million, to
$1.38 billion from $1.48 billion the year before (USAID 2005). However, the allocation of DA
resources to Afghanistan increased by $58 million, from $92 million in 2003 to $150 million in
2004. New funding for USAID’s agriculture-related strategic objective in Afghanistan consumed
most of this increase, increasing from zero in 2003 to $48 million in 2004.
Emergencies also affect the allocation of DA funding within Africa. DA funding for the
Sudan grew from $18 million in 2003 to $50 million in 2004, despite the total DA funding for
Africa decreasing by only $28 million from 2003 to 2004 and total estimated spending for
agricultural development also declining. Finally, although it does not come directly out of
USAID’s DA account, the Iraq Relief and Reconstruction Fund consumed $1.53 billion and
$2.44 billion in appropriated assistance resources in 2003 and 2004, respectively.
Finally, the data indicate that almost three-quarters of the total estimated USAID
spending for African agriculture is funded through the budgets of the Bureau for Africa and
EGAT. These bureaus are pursuing compatible, highly market- and technology-oriented
strategies for agriculture’s role in development, as expressed in USAID’s overall agriculture
strategy and IEHA’s governing principles. However, more than one-quarter of the funding comes
through Title II food aid and is managed by FFP under the 1995 policy that emphasizes food
security and agriculture’s role in achieving it. These different orientations are not in direct
conflict and are arguably complementary. Moreover, at least some USAID field offices in Africa
are making efforts to integrate the use of the development food aid resource with agriculture-
related programs funded through the DA account. Nevertheless, the policy and administration of
these two major limbs of USAID’s assistance for African agriculture are managed from different
Investing in Africa’s Future Final Report
90
headquarters offices, and there remain questions in some quarters about whether the FFP and
Bureau for Africa programs are as integrated and complementary as they could or should be.
Among U.S. government agencies, USAID is by far the largest single contributor to
agricultural development in Africa. However, other agencies are involved in this arena, either on
a bilateral basis or as funders of multilateral institutions. The funding contributions of these
agencies are discussed in the next sections.
Agriculture Funding by Other Bilateral U.S. Agencies
USDA’s Foreign Agricultural Service
As discussed in Chapter 2, USDA’s Foreign Agricultural Service manages two food aid
programs that contribute resources to agricultural development in Africa. Funding trends and
estimates of the amounts of USDA-managed food aid that are devoted to agricultural
development assistance in Africa are listed in Table 3-11.
The information in Table 3-11 is derived from FAS Food Aid Tables (FAS various
years). Unlike USAID, however, USDA’s annual reporting does not include estimated
percentages of its food aid resources applied to agriculture. Although Food for Progress
resources are intended by law to be used for agriculture-related purposes, such is not the case for
Section 416(b). Thus, for the purposes of this analysis, we assumed that 100% of the Food for
Progress resources and 50% of the Section 416(b) resources contribute in some way to
agricultural development. These assumptions are accompanied by uncertainty because some
Food for Progress resources are used for HIV/AIDS prevention and 50% is a rough
approximation (Rubas 2005). Again in contrast to USAID, USDA does not include freight costs
when it reports the value of food aid contributions in its food aid tables. Table 3-11 thus includes
figures adjusted to include an approximation of freight costs for better comparison with data
from the USAID-managed food aid program
Based on these assumptions, Food for Progress and Section 416(b) programs together
have contributed an estimated $217 million in commodities for agricultural development use in
Africa from FY2000 to FY2004, averaging $34 million per year. After adjustment for freight
costs, the estimated values are $326 million total and $51 million annually, on average. Over this

Investing in Africa’s Future Final Report
91
five-year period, about 7% of total USDA-managed food aid has been used in Africa for
agricultural development purposes.
Like the funding trend in USDA’s overall food aid program, the level of food aid being
used for agricultural development in Africa also has decreased—37% from FY2000 to FY2004.
African Development Foundation
The ADF receives an annual appropriation from Congress; it was $14.3 million in FY2000 and
$18.7 million in FY2004 (Table 3-12). As discussed in Chapter 2, these resources are used to
fund small grants (most well under $250,000) for locally developed and managed and
community-based projects in sub-Saharan Africa. In FY2002–2003, about one-third of the new
projects were related to agriculture but they consumed about three fifths of the resources and
throughout 2000–2004, about 66% of the dollar value of the foundation’s new grants was
awarded to agriculture-related projects. The level of this funding has fluctuated over this five-
year period but was only slightly greater in FY2004 than it was in FY2000.
Trade and Development Agency
The most complete source of data on projects funded by TDA during 2000–2003 is the OECD
Creditor Reporting System (OECD various years). The comparability of these data with the
annual TDA appropriations is imperfect because OECD reports data by a calendar year, whereas
the U.S. government reports by fiscal year. Nevertheless, the data provide a reasonable picture of
actual TDA expenditures on projects in Africa, including ones related to agriculture (Table 3-
13).
TDA’s total annual appropriation is small; the agency funds few projects in sub-Saharan
Africa and even fewer that relate to agriculture in Africa (averaging less than $1 million per year
from 2000–2003). Most of the latter involve small-scale feasibility studies or site visits to
explore agribusiness opportunities for American investors.
U.S. Funding through Multilateral Agencies
A complete picture of U.S. agricultural development assistance to Africa must include the
funding that is channeled through multilateral development agencies. Two such agencies
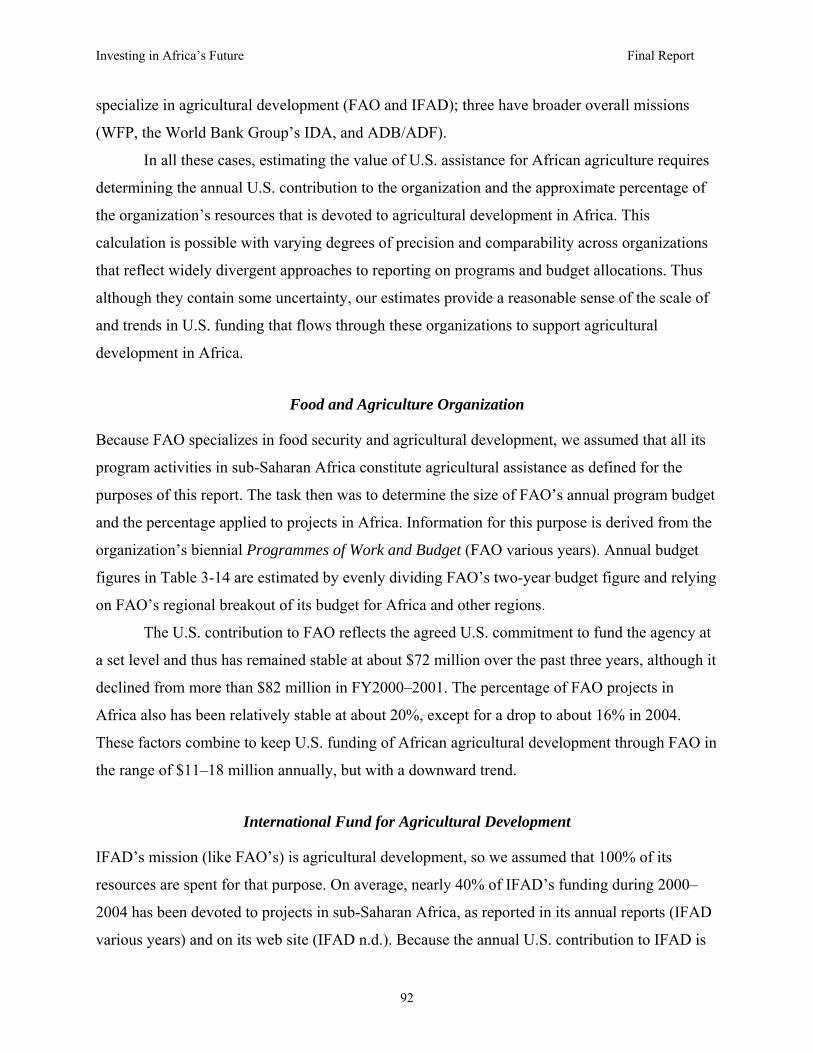
Investing in Africa’s Future Final Report
92
specialize in agricultural development (FAO and IFAD); three have broader overall missions
(WFP, the World Bank Group’s IDA, and ADB/ADF).
In all these cases, estimating the value of U.S. assistance for African agriculture requires
determining the annual U.S. contribution to the organization and the approximate percentage of
the organization’s resources that is devoted to agricultural development in Africa. This
calculation is possible with varying degrees of precision and comparability across organizations
that reflect widely divergent approaches to reporting on programs and budget allocations. Thus
although they contain some uncertainty, our estimates provide a reasonable sense of the scale of
and trends in U.S. funding that flows through these organizations to support agricultural
development in Africa.
Food and Agriculture Organization
Because FAO specializes in food security and agricultural development, we assumed that all its
program activities in sub-Saharan Africa constitute agricultural assistance as defined for the
purposes of this report. The task then was to determine the size of FAO’s annual program budget
and the percentage applied to projects in Africa. Information for this purpose is derived from the
organization’s biennial Programmes of Work and Budget (FAO various years). Annual budget
figures in Table 3-14 are estimated by evenly dividing FAO’s two-year budget figure and relying
on FAO’s regional breakout of its budget for Africa and other regions.
The U.S. contribution to FAO reflects the agreed U.S. commitment to fund the agency at
a set level and thus has remained stable at about $72 million over the past three years, although it
declined from more than $82 million in FY2000–2001. The percentage of FAO projects in
Africa also has been relatively stable at about 20%, except for a drop to about 16% in 2004.
These factors combine to keep U.S. funding of African agricultural development through FAO in
the range of $11–18 million annually, but with a downward trend.
International Fund for Agricultural Development
IFAD’s mission (like FAO’s) is agricultural development, so we assumed that 100% of its
resources are spent for that purpose. On average, nearly 40% of IFAD’s funding during 2000–
2004 has been devoted to projects in sub-Saharan Africa, as reported in its annual reports (IFAD
various years) and on its web site (IFAD n.d.). Because the annual U.S. contribution to IFAD is

Investing in Africa’s Future Final Report
93
small ($5–20 million during this five-year period), the annual U.S. contribution to agricultural
development in Africa through IFAD is very small, peaking at $ 7.2 million in 2002 and only
about $2 million in 2000 and 2001 (Table 3-15).
World Food Programme
As discussed in Chapter 2, about 90% of WFP’s operational expenditures typically are devoted
to emergency or humanitarian feeding programs. The remainder is used for various development
purposes, including agriculture. WFP does not specify the amount of its resources devoted to
agricultural development in Africa. However, annual reports (WFP various years) provide
information about WFP’s total development expenditures worldwide and in sub-Saharan Africa,
and country-specific Current Operations documents (WFP 2005) describe development activities
at a level of detail sufficient to estimate the approximate percentage of WFP development
expenditures in sub-Saharan Africa that are related to agriculture (Table 3-16).
We conservatively estimate that as much as 25% of WFP development resources in sub-
Saharan Africa are used for agriculture-related purposes, with the balance used predominately
for education and health projects. With this estimate, it is possible to calculate the percentage of
total WFP development resources used for agriculture-related projects in Africa, apply that
percentage to WFP-reported figures for the dollar value of each country’s contribution to WFP
development programs, and thereby estimate each country’s contribution to agricultural
development in Africa through WFP.
The results for the United States are listed in Table 3-16. Although the United States is
the largest contributor to WFP (averaging more than $1 billion annually), the U.S. contribution
to agricultural development in Africa through this channel is relatively small. From 2000 to 2003
(data for 2004 are not yet available), it averaged about $8 million annually (less than 1% of the
total U.S. contribution to WFP) because long-term development is a relatively small part of the
WFP mission and program. The 2003 figure is higher than 2000, but there is no discernible trend
because it is lower than in 2001 and about the same as in 2002.
International Development Association
All of the World Bank’s current agriculture-related projects in Africa are financed
primarily or entirely through IDA, the bank’s concessional arm, to which the U.S. has

Investing in Africa’s Future Final Report
94
contributed an average of $816 million annually from 2000 to 2004. As presented in the Interim
Report, IDA’s normal reporting system shows investment in the Agriculture, Fishing and
Forestry sector in Africa (in the form of new commitments of concessional loans and grants)
rising since 2000, from about $186 million to $288 million. This does not, however, reflect all
IDA funding for agriculture-related purposes, as construed broadly for this report. The authors
have since received more complete information from the Rural Development Department at the
World Bank that is reflected in the revised Table 3-17. This information includes the core
agriculture funding but also funding for agro-industry, agricultural markets and trade, as well as
rural micro-credit, small and medium enterprises, and rural roads and highways. With these
figures included, total IDA funding for all agriculture-related purposes increased significantly
from $166 million in 2000 to $577 million in 2004. As Table 3-17 indicates, almost two-thirds of
the gain went to increased finding for rural roads and highway, which is an important element of
the infrastructure required for agricultural development. These gains also result in an increase
from $30 million to $58 million in the IDA funding for African agriculture attributable to the
United States.
African Development Fund of the African Development Bank
Just as the World Bank Group has IDA as its concessionary loan and grantmaking arm, the
African Development Bank the ADF. Through the U.S. Department of the Treasury, the United
States makes annual contributions of appropriated funds to ADB/ADF that are used to support
ADB/ADF’s loan and grant programs. The U.S. contribution averaged about $104 million
annually from FY2000 to FY2004 and was $112.7 million in FY2004.
ADB/ADF reports its activity in terms of annual loan and grant approvals and
disbursements as well as by sector, including Agriculture and Rural Development; Table 3-18
includes both approvals and disbursements. The percentage of approvals for Agriculture and
Rural Development runs consistently higher than the percentage of disbursements, suggesting an
increasing priority on agriculture that may increase future disbursements. In 2003 (data are not
yet available for 2004), 22.7% of the approvals value and 16.8% of the disbursements value was
for Agriculture and Rural Development. The estimated value of the annual U.S. contribution to
African agriculture through ADB/ADF is $17.5 to $26.6 million for approvals and $13.2 to $25.5
million for disbursements. These values vary as a function of fluctuation in ADB/ADF’s total

Investing in Africa’s Future Final Report
95
approval and disbursement activity and the percentage of that activity devoted to Agriculture and
Rural Development.
Total U.S. Funding
As discussed earlier in this chapter, USAID’s estimated investment in agricultural development
assistance in Africa increased by about 19% from 2000 to 2004—about 9% after adjusting for
inflation over that period—despite the resources potentially available for African agriculture in
USAID’s DA account being flat. This increase suggests an effort by USAID to increase funding
despite budget constraints, even though the rate of the modest apparent gains in funding for
African agriculture lags well behind gains in funding for the other sectors in Africa (mainly
health) and in overall USAID development assistance globally. It is thus difficult to argue that
African agriculture has been a high funding priority since 2000, especially considering that
estimated USAID spending in this sector actually declined in absolute terms from 2003 to 2004.
The picture is even less positive for bilateral U.S. funding of agricultural development
assistance in Africa when non-USAID sources of assistance are considered (Tables 3-19 and 3-
19A). Estimated food aid funding of agriculture-related projects in Africa by USDA, the second-
largest source of U.S. funding for this purpose, declined by 17% from 2000 to 2004. As a result,
the overall increase in estimated U.S. bilateral assistance for African agriculture is in the range of
only 7–8%, which is more than offset by inflation over the period.
U.S. funding of agriculture through multilateral channels has, on the other hand,
increased somewhat, due almost entirely in increases in IDA commitments, especially for roads.
Multilateral funding through all channels comprises about 20% of total U.S. funding of
agricultural development assistance for Africa and increased by an estimated 34% in absolute
terms (24% in real terms) from 2000 to 2004. Thus, considering both bilateral and multilateral
channels, overall U.S. funding increased an estimated 12% from 2000 to 2004—or about 2%
after inflation.
Conclusion
As emphasized throughout this chapter, the data underlying this quantitative picture of U.S.
agricultural development assistance for Africa contain uncertainties, primarily because the

Investing in Africa’s Future Final Report
96
planning and reporting systems of most agencies are not designed to track how much the United
States invests annually to foster agriculture-led economic development and poverty reduction in
Africa. The trends, however, are unmistakable. Our analysis shows that the level of U.S.
investment may be higher than expected because we define agricultural development assistance
broadly, but the overall funding trend is flat because investment in African agriculture has barely
kept up with inflation and lags behind growing foreign assistance for other sectors in Africa and
elsewhere. Funding has yet to reach the expectations promised by the recent shift in support
among U.S. policy leaders for agriculture’s critical role in Africa’s development.

Investing in Africa’s Future Final Report
97
References
ADB/ADF (African Development Fund). n.d. Summary of Operations, 1974–2003 [Excel file].
Available from http://www.afdb.org/en/statistics/compendium_of_statistics/african_
development_fund/summary_of_operations_1974_2003 (accessed March 30, 2005).
ADF (African Development Foundation). 2003. Innovative Investments in Africa’s Future: ADF
Funded Projects Fiscal Years 2002–2003. http://www.adf.gov/ADF200203report.pdf
(accessed April 2, 2005).
BLS (Bureau of Labor Statistics). n.d. Consumer Price Indexes. U.S Department of Labor.
http://www.bls.gov/cpi/home.htm (accessed March 23, 2005).
Bogart, Brian J. 2004. Personal communication from Brian J. Bogart, Results and Information
Reporting, USAID/FFP/AMEX International, to Michael Taylor, Nov. 12.
Callahan, Bryan. 2005. Personal communication from Bryan Callahan, communications
manager, African Development Foundation, to the authors, March 8.
Eicher, Carl K. 2003. Flashback: Fifty Years of Donor Aid to African Agriculture. Presented at
Successes in African Agriculture: Building for the Future, Pretoria, South Africa, Dec. 1–
3. http://www.ifpri.org/events/conferences/2003/120103/papers/paper16.pdf (accessed
March 23, 2005).
FAO (Food and Agriculture Organization of the United Nations). Various years. Programmes of
Work and Budget (PWGs). Available from http://www.fao.org/pbe/en/intro.htm
(accessed March 30, 2005).
FAS (Foreign Agricultural Service). Various years. U.S. Food Aid Tables. Available from
http://www.fas.usda.gov/excredits/foodaid/reports/reports.html (accessed April 1, 2005).
Heller, Sonya. 2005. Personal communication from Sonya Heller, policy analyst, U.S. Agency
for International Development’s Bureau for Economic Growth, Agriculture, and Trade, to
the authors, March 17.
IFAD (International Fund for Agricultural Development). Various years. Annual Reports.
Available from http://www.ifad.org/pub/ar.htm (accessed March 30, 2005).
IFAD. n.d. IFAD Home Page: Enabling the Rural Poor to Overcome Poverty.
http://www.ifad.org/ (accessed March 30, 2005).

Investing in Africa’s Future Final Report
98
Johnson, Carrie. 2005. Personal communication from Carrie Johnson, Program Analyst, Program
Analysis and Budget Division, Office of Development Planning, Bureau for
Africa/USAID. May 19.
Kumar, Krishna. 1995. Generating Broad-Based Growth through Agribusiness Promotion:
Assessment of USAID Experience. USAID Program and Operations Assessment Report
No. 9. Washington, D.C.: U.S. Agency for International Development.
http://www.dec.org/pdf_docs/PNAAX295.pdf (accessed April 4, 2005).
Lele, Uma J. (Ed.). 1991. Aid to African Agriculture: Lessons from Two Decades of Donors’
Experience. Baltimore, MD: The Johns Hopkins University Press.
OECD (Organisation for Economic Co-operation and Development). Various years. CRS Online
Database on Aid Activities. In International Development Statistics (IDS) Online
Databases on Aid and Other Resource Flows. Available from
http://www.oecd.org/dac/stats/idsonline (accessed April 4, 2005).
Riemenschneider, Charles. 2005. Personal communication from Charles Riemenschneider,
director, Food and Agriculture Organization of the United Nations Liaison Office for
North America, March 3.
Rubas, Debbie. 2005. Personal communications from Debbie Rubas, Agricultural Economist,
Programming Division, Export Credits, FAS/USDA, to the authors, Feb. 14.
USAID (U.S. Agency for International Development). 2003. Country Overviews [one for each
country listed]. In Congressional Budget Justification, Annex I: Africa. Available from
http://www.usaid.gov/pubs/cbj2003/afr/ (accessed April 1, 2005).
USAID. 2005. Complete USAID/Country Programs [one for each country listed]. In
Congressional Budget Justification, Annex I: Africa. Available from
http://www.usaid.gov/policy/budget/cbj2005/afr/ (accessed April 1, 2005).
USAID (U.S. Agency for International Development). Various years. Congressional Budget
Justifications. Available from http://www.usaid.gov/policy/budget/ (accessed March 30,
2005).
USTDA (U.S. Trade and Development Agency). 2004. Annual Report. Available from
http://www.tda.gov/USTDA/About%20USTDA/eventspubs.htm (accessed March 30,
2005).

Investing in Africa’s Future Final Report
99
WFP (U.N. World Food Programme). 2005. Current Operations [Development programs,
Africa, for various countries]. Available from
http://www.wfp.org/operations/Current_Operations/index_country.asp?section=5&sub_s
ection=7 (accessed March 30, 2005).
WFP. Various years. Annual Reports. Available from http://www.wfp.org/policies/
Annual_Reports/index.asp?section=6&sub_section=3 (accessed March 30, 2005).
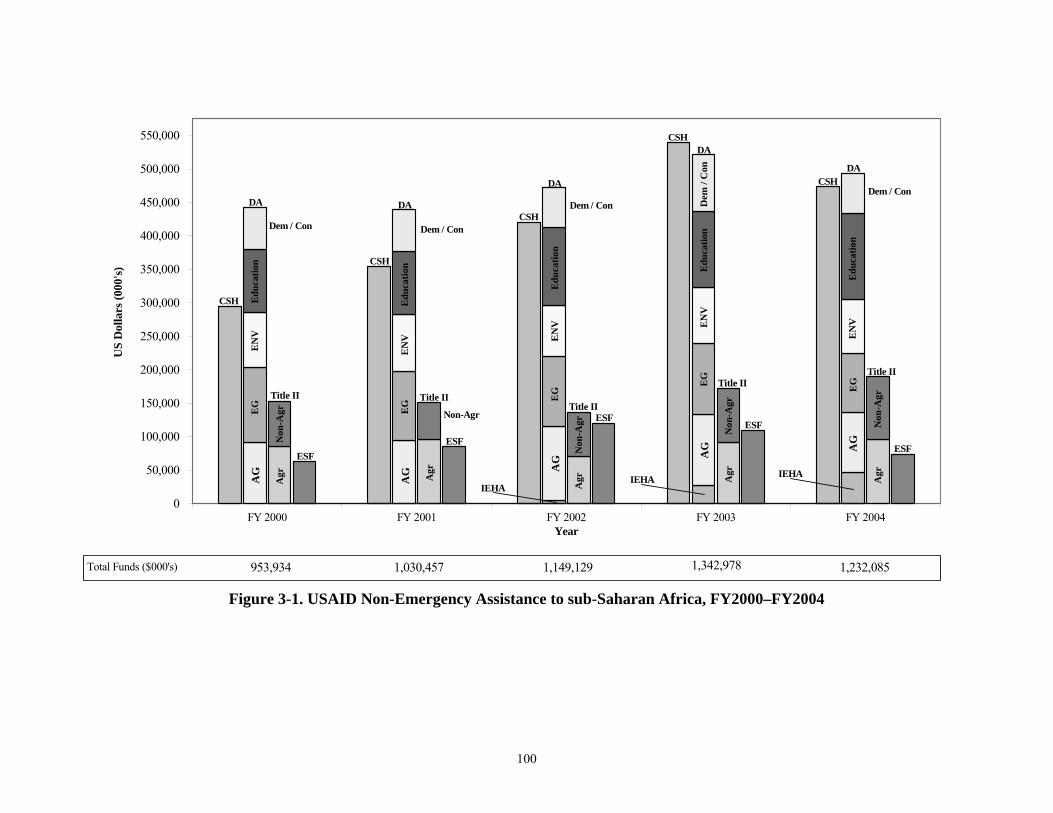
100
Figure 3-1. USAID Non-Emergency Assistance to sub-Saharan Africa, FY2000–FY2004
0
50,000
100,000
150,000
200,000
250,000
300,000
350,000
400,000
450,000
500,000
550,000
FY 2000 FY 2001 FY 2002 FY 2003 FY 2004Year
US
Dol
lars
(000
's)
953,934
CSH
DA
Title II
ESF
DA
DA
DADACSH
CSH
CSH
CSH
Title II Title IITitle II
Title II
ESF AG
EG
EN
VE
duca
tion
Edu
catio
n
Edu
catio
n
Edu
catio
n
Edu
catio
nE
NV
EN
V
EN
V EN
V
EG EG E
G
EG
AG
AG
AG
AG
AgrAgr
Agr Agr
Agr
ESFESF
ESF
Non
-Agr
Non
-Agr
Non
-Agr
Non
-Agr
Non-Agr
Total Funds ($000's) 1,030,457 1,149,129 1,342,978 1,232,085
IEHA IEHAIEHA
Dem / Con
Dem / Con
Dem
/ C
on
Dem / Con
Dem / Con

101
Figure 3-2. USAID Non-Emergency Assistance: Countries and Organizations that Received IEHA Funds, FY2000–FY2004 (appropriated program
funds allocated by account and sector)
0
50,000
100,000
150,000
200,000
250,000
300,000
FY 2000 FY 2001 FY 2002 FY 2003 FY 2004Year
US
Dol
lars
(000
's)
470,746
CSH
DA
Title II
ESF
DA
DADA
DA
CSH
CSH
CSH
CSH
Title II Title IITitle II
Title II
ESF
AG
EG
EN V
IEH
AE
d / O
therE
d / O
ther
Ed
/ Oth
er
Ed
/ Oth
er Ed
/ Oth
erE
NVE
NV
EN
V
EN
V
EG
EG
EG
EG
AG
AG
AGAG
AgrAgrAgr
Agr
Agr
ESFESF
ESF
Non-Agr
Non
-Agr
Non
-Agr
Non-Agr
Non-Agr
Total Funds ($000's) 482,937 519,822 622,673 548,718
IEH
A

Investing in Africa’s Future Final Report
102
Table 3-1. USAID Total Funding and Non-Emergency Program Funds with Non-Emergency Funding, by Account and Africa Allocation, FY2000–FY2005 (with
percent of total USAID allocation in parentheses) Allocation ($, millions)
Account FY2000 FY2001 FY2002 FY2003 FY2004 FY2005
Increase, FY2000– FY2004
(%) USAID Totala 7,616
(100%) 7,822
(100%) 8,853
(100%) 9,465
(100%) 8,837
(100%) 8, 954,
(100%) 16.0
CSH Global 844 (11.1%)
1,215 (15.5%)
1,469 (16.6%)
1, 939 (20.5%)
1,824 (20.6%)
1,538 (17.2%) 116.0
CSH Africa 295 (3.9%)
355 (4.5%)
421 (4.8%)
540 (5.7%)
474 (5.4%)
357 (4.0%) 60.7
DA Global 981 (12.9%)
1,029 (13.2%)
1,178 (13.3%)
1,480 (15.6%)
1,377 (15.6%)
1,448 (16.2%) 40.3
DA Africa 443 (5.8%)
439 (5.6%)
471 (5.3%)
522 (5.5%)
494 (5.6%)
547 (6.1%) 11.5
ESF Global 2,792 (36.7%)
2,315 (29.6%)
3,489 (39.4%)
2,280 (24.1%)
3,263 (37.0%)
2,483 (28.1%) 16.9
ESF Africa 63 (0.83%)
86 (1.10%)
120 (1.36)
109 (1.15%)
74 (0.84%)
104 (1.14%) 17.5
P.L. 480c Global 359 (4.7%)
390 (5.0%)
358 (4.0%)
403 (4.3%)
374 (4.2%)
NA 4.2
P.L. 480 Africa 153 (2.0%)
151 (1.9%)
137 (1.6%)
173 (1.8%)
190 (2.2%)
NA 24.2
Africa Total (CSH, DA, ESF, P.L. 480)
954 (12.5%)
1,031 (13.2%)
1,149 (13.0%)
1,343 (14.2%)
1,232 (13.9%)
NA 29.1
Global Total (CSH, DA, ESF, P.L. 480)
4,976 (65.3%)
4,949 (63.3%)
6,494 (73.3%)
6,102 (645)
6,838 (77.4%)
NA 37.4
Notes: CSH = Child Survival and Health, DA = Development Assistance, ESF = Economic Support Fund, P.L. 480 = Agricultural Trade Development and Food Assistance Act of 1954, NA = data not available. a USAID total excludes Emergency Response Fund and wartime supplemental allocations for Iraq. c Total P.L. 480, Title II allocation of non-emergency food aid regardless of use to which the food aid resources are put. Source: USAID Congressional Budget Justifications, FY2003, FY2005, FY2006 (USAID various years) and USAID/Africa Bureau Office of Development Planning table re “FY 00-05 Budget Levels by Sector: DA/CSH” (provided to authors by Carrie Johnson personal communication, May 19, 2005).

Investing in Africa’s Future Final Report
103
Table 3-2. USAID Development Assistance (DA) Account Allocation in Africa by Sector, FY2000–FY2004 (with percent of total DA allocation in parentheses)
Allocation ($, millions)
Account/Sector FY2000 FY2001 FY2002 FY2003 FY2004 FY2005
Increase, FY2000–
FY2004/05 (%)
Total DA for Africa 443 (100%)
439 (100%)
471 (100%)
522 (100%)
494 (100%)
547 (100%) 11.5/23.5
Education 95 (21.4%)
94 (21.4%)
116 (24.6%)
114 (21.9%)
128 (25.9%)
149 (27.2%) 34.7/56.8
Democracy/Conflict
63 (14.2%)
62 (14.1%)
60 (12.7%)
84 (16.1%)
61 (12.4%)
80 (14.6%) -3.2/27.0
Agriculture (without IEHA)
91 (20.5%)
95 (216%)
110 (23.4%)
106 (20.4%)
90 (18.6%)
104 (19.0%) 1.1
Economic Growth 112 (25.3%)
102 (23.2%)
105 (22.3%)
106 (20.4%)
87 (17.6%)
95 (17.4%) –22.3/-15.2
Environment 82 (18.5%)
86 (19.6%)
76 (16.1%)
84 (16.1)
81 (16.4%)
71 (13.0%) 1.2/-13.4
IEHA 0 0 5 (0.11%)
27 (5.5%)
47 (9.1%)
47 (8.6%) NA—
Agriculture/IEHA Total 91 (20.5%)
95 (21.6%)
115 (24.4%)
133 (25.5%)
137 (27.7%)
151 (27.6%) 50.6/65.9
Agriculture/IEHA, Economic Growth, Environment Total
284 (64.1)
283 (64.5%)
295 (62.6%)
323 (62.0%)
304 (61.5%)
318 (58.1%) 7.0/12.0
Notes: The sectoral allocations in this table are based on the “653(a)” reports that USAID must provide to Congress within 30 days of enactment of the annual appropriations bill informing Congress how the congressional appropriation in the DA and other accounts are to be allocated by the agency by region and sector. IEHA = Initiative to End Hunger in Africa. Source: USAID/Africa Bureau Office of Development Planning table re “FY 00-05 Budget Levels by Sector: DA/CSH” (provided to authors by Carrie Johnson, ABODP, May 19, 2005), and personal communication with Carrie Johnson, August 3, 2005.
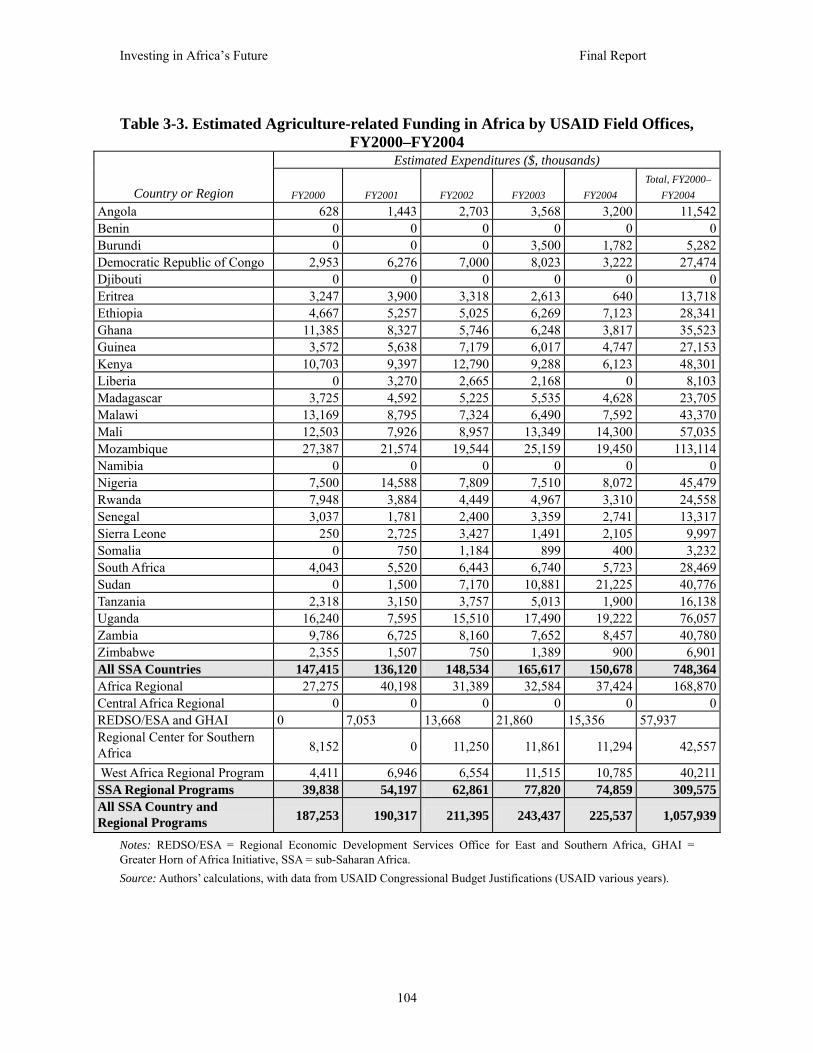
Investing in Africa’s Future Final Report
104
Table 3-3. Estimated Agriculture-related Funding in Africa by USAID Field Offices,
FY2000–FY2004 Estimated Expenditures ($, thousands)
Country or Region FY2000 FY2001 FY2002 FY2003 FY2004 Total, FY2000–
FY2004 Angola 628 1,443 2,703 3,568 3,200 11,542Benin 0 0 0 0 0 0Burundi 0 0 0 3,500 1,782 5,282Democratic Republic of Congo 2,953 6,276 7,000 8,023 3,222 27,474Djibouti 0 0 0 0 0 0Eritrea 3,247 3,900 3,318 2,613 640 13,718Ethiopia 4,667 5,257 5,025 6,269 7,123 28,341Ghana 11,385 8,327 5,746 6,248 3,817 35,523Guinea 3,572 5,638 7,179 6,017 4,747 27,153Kenya 10,703 9,397 12,790 9,288 6,123 48,301Liberia 0 3,270 2,665 2,168 0 8,103Madagascar 3,725 4,592 5,225 5,535 4,628 23,705Malawi 13,169 8,795 7,324 6,490 7,592 43,370Mali 12,503 7,926 8,957 13,349 14,300 57,035Mozambique 27,387 21,574 19,544 25,159 19,450 113,114Namibia 0 0 0 0 0 0Nigeria 7,500 14,588 7,809 7,510 8,072 45,479Rwanda 7,948 3,884 4,449 4,967 3,310 24,558Senegal 3,037 1,781 2,400 3,359 2,741 13,317Sierra Leone 250 2,725 3,427 1,491 2,105 9,997Somalia 0 750 1,184 899 400 3,232South Africa 4,043 5,520 6,443 6,740 5,723 28,469Sudan 0 1,500 7,170 10,881 21,225 40,776Tanzania 2,318 3,150 3,757 5,013 1,900 16,138Uganda 16,240 7,595 15,510 17,490 19,222 76,057Zambia 9,786 6,725 8,160 7,652 8,457 40,780Zimbabwe 2,355 1,507 750 1,389 900 6,901All SSA Countries 147,415 136,120 148,534 165,617 150,678 748,364Africa Regional 27,275 40,198 31,389 32,584 37,424 168,870Central Africa Regional 0 0 0 0 0 0REDSO/ESA and GHAI 0 7,053 13,668 21,860 15,356 57,937 Regional Center for Southern Africa 8,152 0 11,250 11,861 11,294 42,557
West Africa Regional Program 4,411 6,946 6,554 11,515 10,785 40,211SSA Regional Programs 39,838 54,197 62,861 77,820 74,859 309,575All SSA Country and Regional Programs 187,253 190,317 211,395 243,437 225,537 1,057,939
Notes: REDSO/ESA = Regional Economic Development Services Office for East and Southern Africa, GHAI = Greater Horn of Africa Initiative, SSA = sub-Saharan Africa. Source: Authors’ calculations, with data from USAID Congressional Budget Justifications (USAID various years).

Investing in Africa’s Future Final Report
105
Table 3-3A. Range Estimates of Agriculture-related Funding in Africa by USAID Field Offices, FY200–FY2004
Estimated Expenditures ($, thousands)
Country or Region FY2000 FY2001 FY2002 FY2003 FY2004
Total, FY2000– FY2004
Angola 414–842 1,443 2,703 3,568 3,200 11,328–11,758
Benin 0 0 0 0 0 0 Burundi 0 0 0 3,500 1,782 5,282 Democratic Republic of Congo
0–3,897 0–8,284 0–9,240 0–10,590 3,222 3,222–35,234
Djibouti 0 0 0 0 0 0 Eritrea 3,247 3,900 3,318 2,613 640 13,718
Ethiopia 4,667 5,002–5,512 4,764–5,285 6,047–6,490 6,888–7,358 27,368–29,312
Ghana 10,171–15,180 7,439–11,103 5,133–7,661 5,581–8,330 3,410–5,089 31,733–47,363
Guinea 3,572 5,638 7,179 6,017 4,747 27,153
Kenya 10,703 8,597–9,653 12,035–13,031 8,447–9,557 4,663–7,047 44,445–49,991
Liberia 0 3,270 2,665 2,168 0 8,103
Madagascar 2,459–4,992 3,030–6,153 3,449–7,002 4,163–6,906 3,224–6,032 16,325–31,083
Malawi 12,658–14,766 8,515–9,670 7,324 6,490 7,592 42,579–45,842
Mali 11,908–13,098 7,231–8,621 8,819–9,095 13,349 14,300 55,607–58,463
Mozambique 26,636–28,138 20,644–22,503 18,988–20,099 24,731–25,586 18,243–20,657 109,241–116,984
Namibia 0 0 0 0 0 0
Nigeria 6,700–10,000 13,032–19,451 6,976–10,412 6,709–10,013 8,072 41,489–57,948
Rwanda 7,948 3,884 4,449 4,967 3,310 24,558 Senegal 2,004–4,069 1,175–2,387 1,584–3,216 2,217–4,500 1,809–3,672 8,789–17,844 Sierra Leone 165–335 1,799–3,652 2,261–4,592 984–1,997 1,389–2,821 6,598–13,396 Somalia 0 495–1,005 781–1,586 593–1,205 264–535 2,133–4,331
South Africa 3,611–5,390 4,931–7,360 5,756–8,591 6,021–8,986 5,113–7,631 25,432–37,958
Sudan 0 1,500 7,170 10,881 18,961–28,300 38,512–47,851
Tanzania 2,318 3,150 3,757 5,013 1,900 16,138 Uganda 16,240 7,595 15,510 17,490 19,222 76,057 Zambia 9,786 6,725 8,160 7,652 8,457 40,780 Zimbabwe 2,104–3,140 1,349–2,009 670–1,000 1,241–1,852 804–1,200 6,165–9,201 All SSA Countries
137,311–162,328
120,342–154,467
133,451–163,044
150,441–179,721
141,212–166,786
682,756–826,345
Africa Regional 19,017–33,775 33,761–46,671 20,726–35,973 9,989–40,220 24,265–44,002 107,756–200,642
Central Africa Regional 0 0 0 0 0 0

Investing in Africa’s Future Final Report
106
Estimated Expenditures ($, thousands)
Country or Region FY2000 FY2001 FY2002 FY2003 FY2004
Total, FY2000– FY2004
REDSO/ESA and GHAI 0 7,053 13,668 21,860 15,356 57,937
Regional Center for Southern Africa
6,604–9,699 0 8,785–13,715 9,686–14,036 10,019–12,569 35,094–50,019
West Africa Regional Program
3,940–5,881 6,203–7,688 5,555–7,552 10,253–12,777 9,699–11,871 35,650–45,770
SSA Regional Programs 29,561–49,355 47,017–61,412 48,734–70,908 51,787–88,894 59,338–83,798 236,437–
354,367 All SSA Country and Regional Programs
166,872–211,682
167,359–215,879
182,184–233,953
202,228–268,615
200,551–250,584
919,193–1,180,713
Notes: REDSO/ESA = Regional Economic Development Services Office for East and Southern Africa, GHAI = Greater Horn of Africa Initiative, SSA = sub-Saharan Africa. Source: Authors’ calculations, with data from USAID Congressional Budget Justifications (USAID various years).
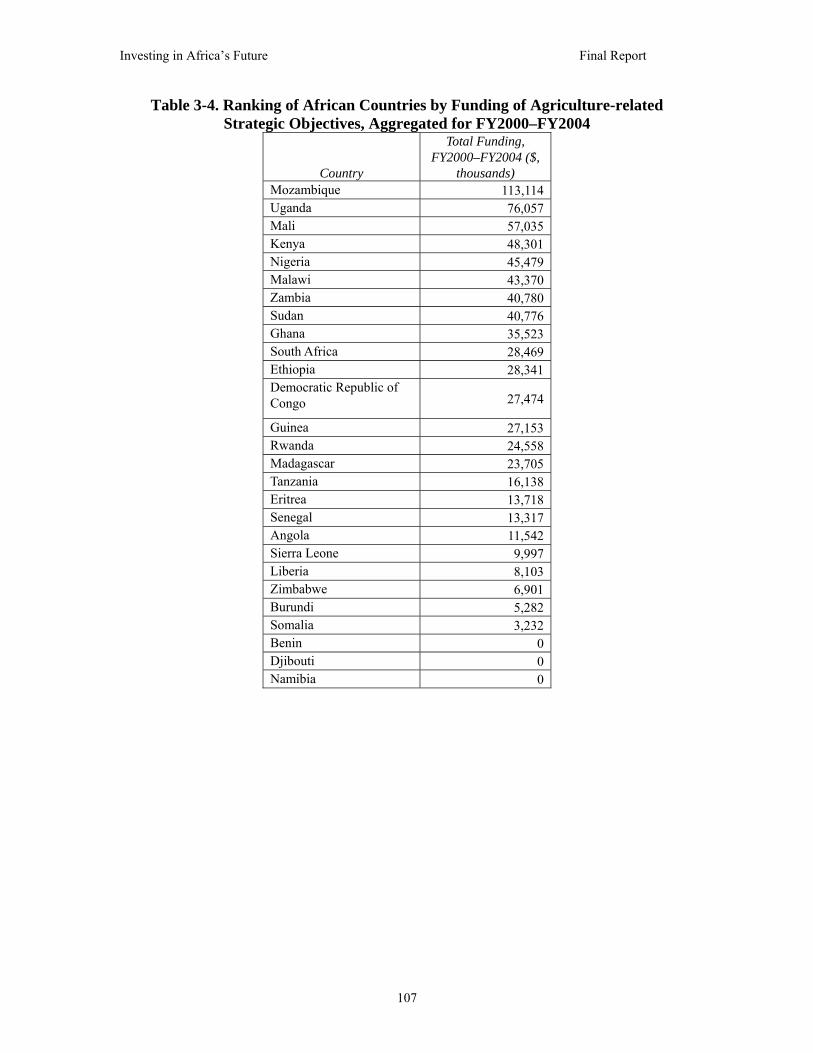
Investing in Africa’s Future Final Report
107
Table 3-4. Ranking of African Countries by Funding of Agriculture-related Strategic Objectives, Aggregated for FY2000–FY2004
Country
Total Funding, FY2000–FY2004 ($,
thousands) Mozambique 113,114 Uganda 76,057 Mali 57,035 Kenya 48,301 Nigeria 45,479 Malawi 43,370 Zambia 40,780 Sudan 40,776 Ghana 35,523 South Africa 28,469 Ethiopia 28,341 Democratic Republic of Congo 27,474
Guinea 27,153 Rwanda 24,558 Madagascar 23,705 Tanzania 16,138 Eritrea 13,718 Senegal 13,317 Angola 11,542 Sierra Leone 9,997 Liberia 8,103 Zimbabwe 6,901 Burundi 5,282 Somalia 3,232 Benin 0 Djibouti 0 Namibia 0

Investing in Africa’s Future Final Report
108
Table 3-5. P.L. 480, Title II Food Aid in Africa, Amount Used for Agricultural Development, FY2000–FY2004
Funding ($, millions)
Allocation FY2000 FY2001 FY2002 FY2003 FY2004
Increase, FY2000– FY2004
(%) Total Title II 800 835 959 1,810 1,192 49 Total Africa NA NA 514 1,166 405 Development Use 153 151 137 173 190 24 Agricultural Development Usea 86 96 71 91 96 12 Agricultural Development Use, Excluding Freightb 57 63 47 60 63 11
Agriculture Use as Percentage of Total Development Use 56% 64% 52% 53% 51% –9
Notes: NA = Data not available. a Calculated from Office of Food for Peace Annual Report Tables (Bogart 2004). b Calculated based on assumption that one-third of total commodity value covers freight cost. Source: USAID Congressional Budget Justifications, FY2003 and FY2005 (USAID various years), and Appendix 3-B.
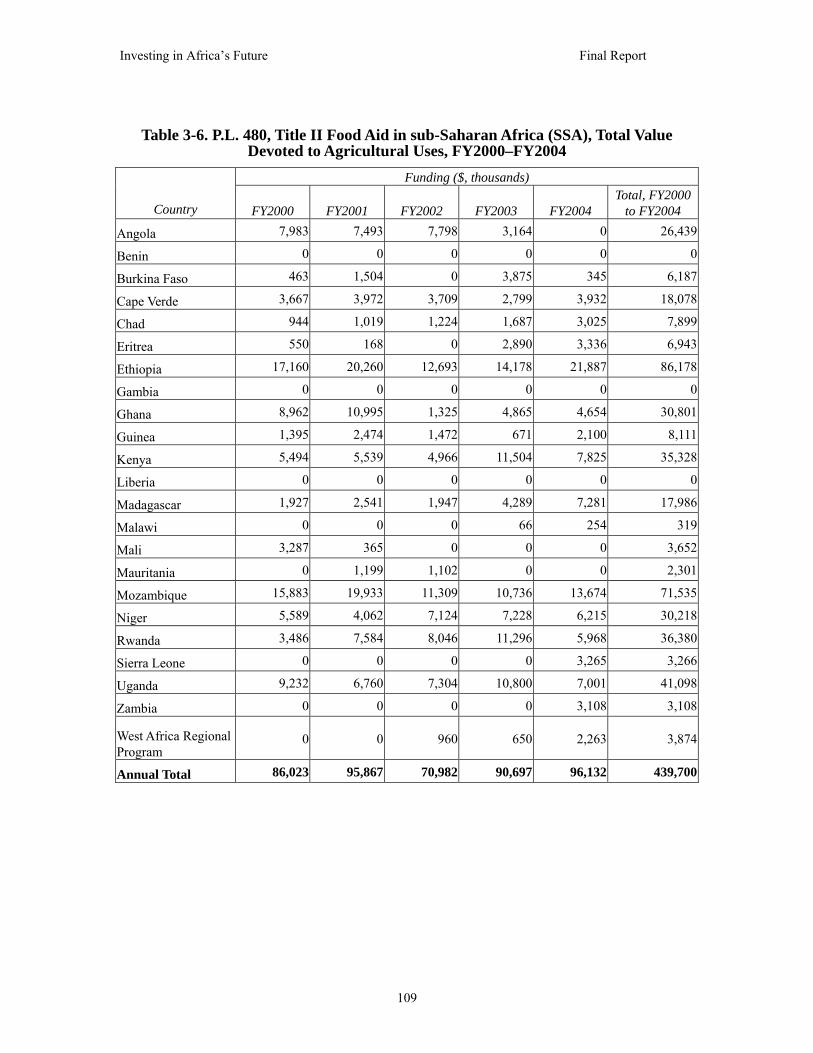
Investing in Africa’s Future Final Report
109
Table 3-6. P.L. 480, Title II Food Aid in sub-Saharan Africa (SSA), Total Value Devoted to Agricultural Uses, FY2000–FY2004
Funding ($, thousands)
Country FY2000 FY2001 FY2002 FY2003 FY2004 Total, FY2000
to FY2004
Angola 7,983 7,493 7,798 3,164 0 26,439
Benin 0 0 0 0 0 0
Burkina Faso 463 1,504 0 3,875 345 6,187
Cape Verde 3,667 3,972 3,709 2,799 3,932 18,078
Chad 944 1,019 1,224 1,687 3,025 7,899
Eritrea 550 168 0 2,890 3,336 6,943
Ethiopia 17,160 20,260 12,693 14,178 21,887 86,178
Gambia 0 0 0 0 0 0
Ghana 8,962 10,995 1,325 4,865 4,654 30,801
Guinea 1,395 2,474 1,472 671 2,100 8,111
Kenya 5,494 5,539 4,966 11,504 7,825 35,328
Liberia 0 0 0 0 0 0
Madagascar 1,927 2,541 1,947 4,289 7,281 17,986
Malawi 0 0 0 66 254 319
Mali 3,287 365 0 0 0 3,652
Mauritania 0 1,199 1,102 0 0 2,301
Mozambique 15,883 19,933 11,309 10,736 13,674 71,535
Niger 5,589 4,062 7,124 7,228 6,215 30,218
Rwanda 3,486 7,584 8,046 11,296 5,968 36,380
Sierra Leone 0 0 0 0 3,265 3,266
Uganda 9,232 6,760 7,304 10,800 7,001 41,098
Zambia 0 0 0 0 3,108 3,108
West Africa Regional Program
0 0 960 650 2,263 3,874
Annual Total 86,023 95,867 70,982 90,697 96,132 439,700

Investing in Africa’s Future Final Report
110
Table 3-7. P.L. 480, Title II Food Aid in sub-Saharan Africa (SSA), Country Ranking by Aggregate Values Received, FY2000–FY2004
Country or ProgramTotal Funding ($,
thousands)
Ethiopia 86,178
Mozambique 71,535
Uganda 41,098
Rwanda 36,380
Kenya 35,328
Ghana 30,801
Niger 30,218
Angola 26,439
Cape Verde 18,078
Madagascar 17,986
Guinea 8,111
Chad 7,899
Eritrea 6,943
Burkina Faso 6,187
West Africa Regional Program
3,874
Mali 3,652
Sierra Leone 3,266
Zambia 3,108
Mauritania 2,301
Malawi 319
Benin 0
Gambia 0Liberia 0

Investing in Africa’s Future Final Report
111
Table 3-8. Bureau for Economic Growth, Agriculture, and Trade (EGAT) Funding of Agricultural Development in sub-Saharan Africa (SSA), FY2000–FY2004
Funding ($, millions) Program FY2000 FY2001 FY2002 FY2003 FY2004
Total EGAT NA NA 182.3 182.8 150.8 EGAT, Related to Agriculture in SSA 22.7 24.4 27.3 25.4 31.3
Notes: NA, Data not available. Source: USAID Congressional Budget Justification for FY2005 (USAID various years), Heller 2005.
Table 3-9. Estimated Total USAID Assistance for African Agriculture, FY2000–FY2004
Estimated Funding ($, millions)
Account FY2000 FY2001 FY2002 FY2003 FY2004
Total, FY2000– FY2004
% of Total
Increase, FY2000–
FY2004 (%) Africa Bureau 187 190 211 243 226 1,058 65 21
Title II Food Aid 86 96 71 91 96 440 27 12
EGAT 23 24 27 25 31 130 8 35 Total 296 310 309 359 353 1,628 100 19 Note: EGAT = Bureau for Economic Growth, Agriculture, and Trade. Source: Tables 3-3, 3-5, and 3-8. Table 3-9A. Total USAID Assistance for African Agriculture, Range Estimates, FY
2000–2004 Estimated Funding ($, millions)
Source FY2000 FY2001 FY2002 FY2003 FY2004 Total, FY2000–
FY2004 Increase, FY2000–
FY2004 (%) Africa Bureau
167–212
167–215
182–234
202–267
201–251 919–1,179 20–18
Title II Food Aid
57–86 63–96 47–71 60–91 63–96 290–440 11–12
EGAT 23 24 27 25 31 130 35
Total 247–321
254–335
257–332
287–383
295–378 1,340–1,749 19–18
Note: EGAT = Bureau for Economic Growth, Agriculture, and Trade. Sources: Tables 3-3, 3-5, and 3-8.

Investing in Africa’s Future Final Report
112
Table 3-10. Estimated USAID Funding for African Agriculture Relative to Other USAID-Managed Programs, FY2000–FY2004 (with percentage of USAID total in
parentheses) Estimated Funding ($, millions)
Funding Use FY2000 FY2001 FY2002 FY2003 FY2004
Increase, FY2000 to
FY2004 (%) USAID Totala
7,616 (100%)
7,822 (100%)
8,853 (100%)
9,465 (100%)
8,837 (100%) 15.7
Global Development Total (CSH, DA, ESF, P.L. 480b)
4,976 (65.3%)
4,949 (63.3%)
6,494 (73.4%)
6,102 (64.5%)
6,838 (77.6%) 37.4
Africa Development Total (CSH, DA, ESF, P.L. 480)
954 (12.5%)
1,031 (13.2%)
1,149 (13.0%)
1,344 (14.2%)
1,232 (14.0%) 28.9
Estimated African Agriculture Total: Point Estimates
296 (3.9%)
310 (4.0%)
309 (3.5%)
359 (3.8%)
353 (4.0%) 19
Estimated African Agriculture Total: Range Estimates
247–321 (3.2–4.2%)
254–335 (3.2–4.3%)
257–332 (2.9–3.7%)
287–383 (3.0–4.1%)
295–378 (3.4–4.3%) 19–18
African Agriculture as Percent of Global Development Total: Point (and Range Estimates)
5.9% (5.09–6.5%)
6.3% (5.1–6.7%)
4.8% (3.9–5.1%)
5.9% (4.7–6.3%)
5.2% (4.3–5.5%)
–12 (–12 to–14)
African Agriculture as Percent of Africa Development Total: Point (and Range Estimates)
31% (26–34%)
30% (25–32%)
27% (22–29%)
27% (21–28%)
29% (24–31%)
–6.5 (–7.7 to–8.8)
Notes: CSH = Child Survival and Health, DA = Development Assistance, ESF = Economic Support Fund, P.L. 480 = Agricultural Trade Development and Food Assistance Act of 1954. a USAID total excludes Emergency Response Fund and wartime supplemental appropriations for Iraq. b Includes only the portion of the P.L 480 Title II appropriation used for non-emergency (i.e., development) purposes. Source: USAID Congressional Budget Justifications, FY2003 and FY2005 (USAID various years), and USAID/Africa Bureau Office of Development Planning table re “FY 00–05 Budget Levels by Sector: DA/CSH” (provided to authors by Carrie Johnson personal communication, May 19, 2005)
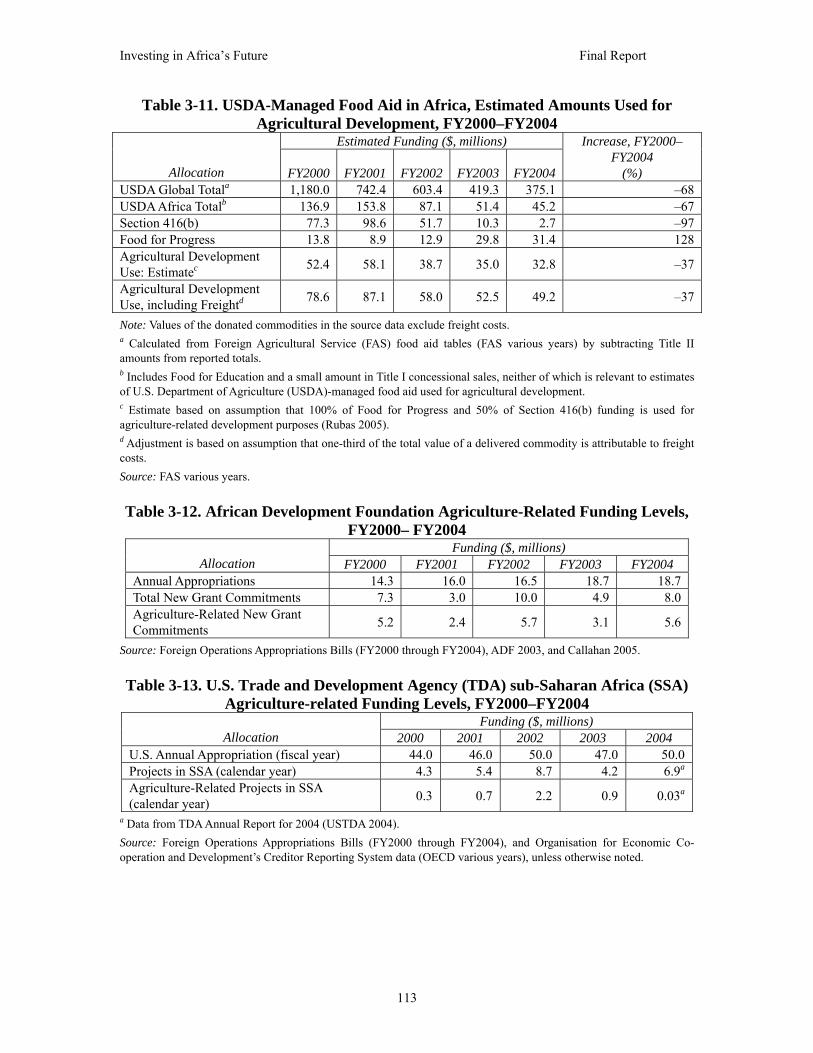
Investing in Africa’s Future Final Report
113
Table 3-11. USDA-Managed Food Aid in Africa, Estimated Amounts Used for Agricultural Development, FY2000–FY2004
Estimated Funding ($, millions)
Allocation FY2000 FY2001 FY2002 FY2003 FY2004
Increase, FY2000– FY2004
(%) USDA Global Totala 1,180.0 742.4 603.4 419.3 375.1 –68 USDA Africa Totalb 136.9 153.8 87.1 51.4 45.2 –67 Section 416(b) 77.3 98.6 51.7 10.3 2.7 –97 Food for Progress 13.8 8.9 12.9 29.8 31.4 128 Agricultural Development Use: Estimatec 52.4 58.1 38.7 35.0 32.8 –37
Agricultural Development Use, including Freightd 78.6 87.1 58.0 52.5 49.2 –37
Note: Values of the donated commodities in the source data exclude freight costs. a Calculated from Foreign Agricultural Service (FAS) food aid tables (FAS various years) by subtracting Title II amounts from reported totals. b Includes Food for Education and a small amount in Title I concessional sales, neither of which is relevant to estimates of U.S. Department of Agriculture (USDA)-managed food aid used for agricultural development. c Estimate based on assumption that 100% of Food for Progress and 50% of Section 416(b) funding is used for agriculture-related development purposes (Rubas 2005). d Adjustment is based on assumption that one-third of the total value of a delivered commodity is attributable to freight costs. Source: FAS various years. Table 3-12. African Development Foundation Agriculture-Related Funding Levels,
FY2000– FY2004 Funding ($, millions)
Allocation FY2000 FY2001 FY2002 FY2003 FY2004 Annual Appropriations 14.3 16.0 16.5 18.7 18.7 Total New Grant Commitments 7.3 3.0 10.0 4.9 8.0 Agriculture-Related New Grant Commitments 5.2 2.4 5.7 3.1 5.6
Source: Foreign Operations Appropriations Bills (FY2000 through FY2004), ADF 2003, and Callahan 2005. Table 3-13. U.S. Trade and Development Agency (TDA) sub-Saharan Africa (SSA)
Agriculture-related Funding Levels, FY2000–FY2004 Funding ($, millions)
Allocation 2000 2001 2002 2003 2004 U.S. Annual Appropriation (fiscal year) 44.0 46.0 50.0 47.0 50.0 Projects in SSA (calendar year) 4.3 5.4 8.7 4.2 6.9a Agriculture-Related Projects in SSA (calendar year) 0.3 0.7 2.2 0.9 0.03a
a Data from TDA Annual Report for 2004 (USTDA 2004). Source: Foreign Operations Appropriations Bills (FY2000 through FY2004), and Organisation for Economic Co-operation and Development’s Creditor Reporting System data (OECD various years), unless otherwise noted.

Investing in Africa’s Future Final Report
114
Table 3-14. Food and Agriculture Organization of the United Nations (FAO), U.S. Contribution to Funding in sub-Saharan Africa (SSA), FY2000–2004
Funding ($, millions) Allocation FY2000 FY2001 FY2002 FY2003 FY2004
Major Programs Total 391.8 391.8 445.0 445.0 429.3 Major Programs in SSA (% of Major Programs)
81.7a
(20.9%) 81.7a
(20.9%) 90.5
(20.3%) 90.5
(20.3%) 67.5
(15.7%) Annual U.S. Contribution b 82.4 82.4 72.7 72.5 72.5 Estimated U.S. Contribution to Major Programs in SSA 17.2 17.2 14.8 14.7 11.4
Notes: U.S. contributions are for FY2000 to FY2004; FAO budget data in this table are for calendar years 2000–2004. a Estimates do not include the Programme Management portion of each major program, which was not disaggregated regionally in FAO’s 2000–2001 Programme of Work and Budget (FAO various years). b Data from Riemenschneider (2005). Sources: FAO Programmes of Work and Budget (FAO various years) for the two-year periods 2000–2001, 2002–2003, and 2004–2005, unless otherwise noted. Table 3-15. International Fund for Agricultural Development (IFAD), sub-Saharan
Africa (SSA) Funding Levels and U.S. Contribution, FY2000–2004 Funding ($, millions)
Allocation FY2000 FY2001 FY2002 FY2003 FY2004 IFAD Projects Total 409.0 403.1 365.9 403.6 NA Projects in SSA (% of Total Projects)
156.5(38.3%)
174.0(43.2%)
132.0(36.1%)
159.4(39.5%) NA
Annual U.S. Contribution 5.0 5.0 20.0 15.0 15.0 Estimated U.S. Contribution to Projects in SSA 1.9 2.2 7.2 5.9 NA
Note: NA = Data not available on new 2004 IFAD projects. Sources: IFAD Annual Reports for 2000–2003 (IFAD various years), which report by calendar year, and Foreign Operations Appropriations Bills (FY2000 through FY2004).

Investing in Africa’s Future Final Report
115
Table 3-16. World Food Programme (WFP) of the United Nations, sub-Saharan Africa (SSA) Agriculture-related Funding Levels and U.S. Contributions, 2000–
2004 Funding ($, millions)
Allocation 2000 2001 2002 2003 2004 Total WFP Operational Expenditures 1,158 1,776 1,592 3,275 NA Total WFP Development Expenditures 185.0 231.1 194.7 228.7 NA WFP Development Expenditures in SSA (Estimated % Related to Agriculture)
55.3(25%)
99.3(25%)
89.1(25%)
125.4 (25%) NA
Estimated Amount of Development Expenditures in SSA Related to Agriculture (Estimated % Related to Agriculture)
13.8(7.5%)
24.8(10.7%)
22.3(11.5%)
31.4 (13.7%) NA
Total U.S. Contribution to WFP Development Programs 51.1 110.2 65.8 63.4 NA
Estimated Amount of U.S. Contribution to WFP Development Programs Related to Agriculture in SSA
3.8 11.8 7.6 8.7 NA
Notes: NA = Data are not available. WFP reports contributions and expenditures by calendar year. Sources: WFP Annual Reports 2000–2003 (WFP various years) and country-specific Current Operations documents for countries in sub-Saharan Africa (WFP 2005).
Table 3-17. International Development Association (IDA), sub-Saharan Africa (SSA) Agriculture-related Funding Levels and U.S. Contribution, FY2000–FY2004
Funding ($, millions) Allocation FY2000 FY2001 FY2002 FY2003 FY2004
New IDA Commitments Global Total 4,358 6,764 8,068 7,283 9,034 New IDA Commitments in SSA (%of IDA New Commitments in SSA Related to Agriculturea)
2,061(9%)
3,370(12%)
3,752(6%)
3,722 (8%)
4,116(7%)
New IDA Commitments Related to Agriculture in SSAb (% of Total New IDA Commitments Related to Agriculture in SSA)
166.(3.8%)
405(6.0%)
503(6.2%)
579 (8.0%)
577(6.4%)
New IDA Commitments to Rural Roads & Highways In SSA 18 115 193 254 280
Annual U.S. Contribution to IDA 775.0 750.0 792.4 850.0 913.2 Estimated U.S. Contribution to Agriculture in SSA through IDA 29.5 45.0 47.5 68.0 58.4
a As reported in World Bank’s annual reports. Percentages reflect both IDA and International Bank for Reconstruction and Development (IBRD) commitments, but because IBRD commitments in Africa are zero in most years and negligible in others, the percentages are assumed to reflect IDA allocations in Africa standing alone. In 2000 and 2001, the percentage listed is for Agriculture and Environment; in 2002–2004, the percentage listed is for Agriculture, Fishing, and Forestry. b Based on personal communication and table received from Sanjiva Cooke, Operations Analyst/Rural Development, World Bank May 6, 2005). “Commitments Related to Agriculture” include commitments specifically to the Agriculture, Fishing and Forestry Sector (including agro-industry, markets and trade) as well as commitments to rural microcredit, small and medium-size enterprises, and rural roads and highways. Commitments for “Rural Roads & Highways” are also reported separately to show the substantial increase in IDA commitments for this purpose. Source: World Bank Annual Reports for 2000–2004 (WFP various years) and Foreign Operations Appropriations Bills (FY2000 through FY2004).
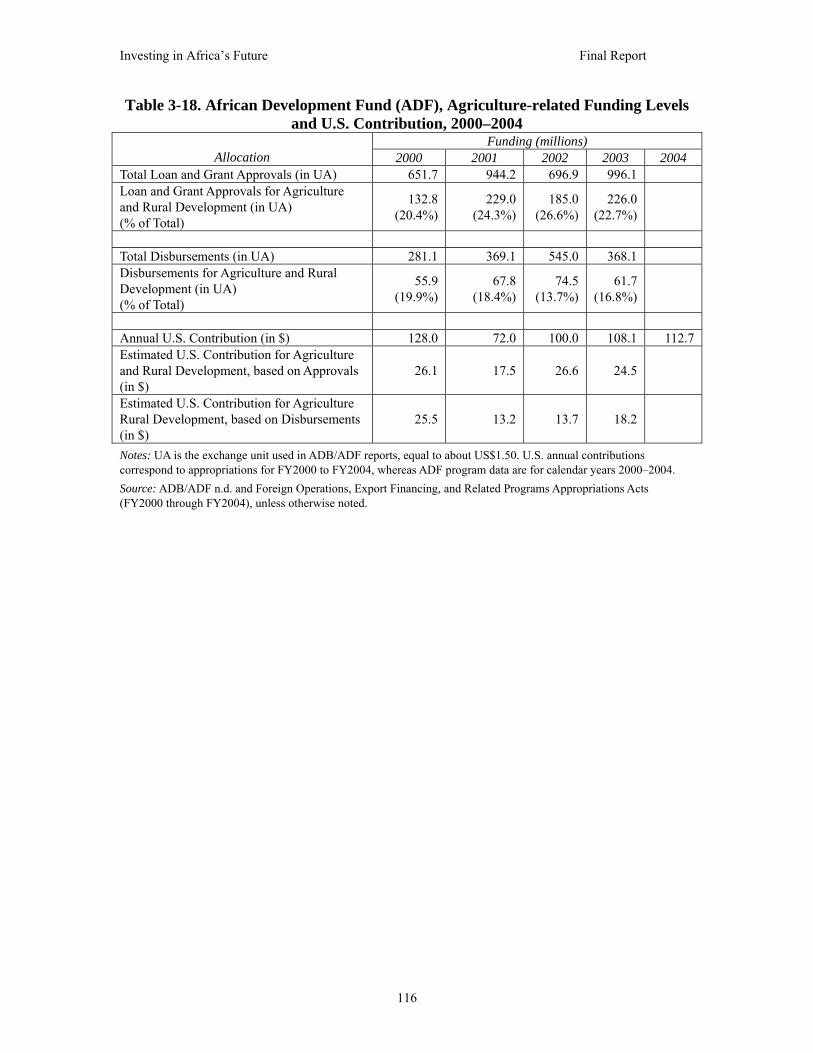
Investing in Africa’s Future Final Report
116
Table 3-18. African Development Fund (ADF), Agriculture-related Funding Levels and U.S. Contribution, 2000–2004
Funding (millions) Allocation 2000 2001 2002 2003 2004
Total Loan and Grant Approvals (in UA) 651.7 944.2 696.9 996.1 Loan and Grant Approvals for Agriculture and Rural Development (in UA) (% of Total)
132.8 (20.4%)
229.0 (24.3%)
185.0 (26.6%)
226.0 (22.7%)
Total Disbursements (in UA) 281.1 369.1 545.0 368.1 Disbursements for Agriculture and Rural Development (in UA) (% of Total)
55.9 (19.9%)
67.8 (18.4%)
74.5 (13.7%)
61.7 (16.8%)
Annual U.S. Contribution (in $) 128.0 72.0 100.0 108.1 112.7 Estimated U.S. Contribution for Agriculture and Rural Development, based on Approvals (in $)
26.1 17.5 26.6 24.5
Estimated U.S. Contribution for Agriculture Rural Development, based on Disbursements (in $)
25.5 13.2 13.7 18.2
Notes: UA is the exchange unit used in ADB/ADF reports, equal to about US$1.50. U.S. annual contributions correspond to appropriations for FY2000 to FY2004, whereas ADF program data are for calendar years 2000–2004. Source: ADB/ADF n.d. and Foreign Operations, Export Financing, and Related Programs Appropriations Acts (FY2000 through FY2004), unless otherwise noted.

Investing in Africa’s Future Final Report
117
Table 3-19. Estimate of Total U.S. Agricultural Development Assistance for sub-Saharan Africa (SSA), 2000–2004
Funding ($, millions) Source 2000 2001 2002 2003 2004 Average
Increase, 2000–2004
Bilateral USAID 296 310 309 359 353 325 19% USDAa 78.6 87.1 58.0 52.5 49.2 65.0 –37.4% ADF 5.2 2.4 5.7 3.1 5.6 4.4 7.7% TDA 0.3 0.7 3.2 0.9 0.03 1.0 –90% Subtotalb 380 400 376 416 408 396 7.4%
Multilateral FAO 17.2 17.2 14.8 14.7 11.4 15.1 –34% IFAD 1.9 2.2 7.2 5.9 NA 4.3 NA WFP 3.8 11.8 7.6 8.7 NA 8.0 NA IDAd 29.5 45.0 47.5 68.0 58.4 49.7 98% ADB/ADFb 26.1 17.5 26.6 24.5 NA 23.7 NA Subtotalb 79 94 104 122 106 101 34% Totalb 459 494 480 538 514 497 12%
Notes: For the U.S. bilateral agencies, estimates are derived on the basis of U.S. fiscal year appropriations and expenditures, except that the best available data on expenditures by TDA were calendar year data from the Organisation for Economic Co-operation and Development/Development Assistance Committee Creditor Reporting System. For the multilateral agencies, the estimated U.S. contribution is based on fiscal year U.S. contributions and the percentage of total agency funds devoted to agriculture-related projects in Africa, which are reported by those multilateral agencies on a calendar year basis. USDA = U.S. Department of Agriculture, ADF = African Development Foundation, TDA= U.S. Trade and Development Agency, FAO = U.N. Food and Agriculture Organization, IFAD = International Fund for Agricultural Development, WFP = U.N. World Food Programme, IDA = World Bank’s International Development Association, ADB/ADF = African Development Bank’s African Development Fund, NA = data not available. Subtotals and totals are rounded to the nearest million and assume that the 2004 figures for IFAD, WFP, and African Development Foundation are at the preceding four-year average. a USDA-managed food aid with adjustment to include freight costs. b Based on new commitments (IDA) or approvals (ADB/ADF). Source: Extracted from Tables 3-9, 3-11, 3-12, 3-13, 3-14, 3-15, 3-16, 3-17, and 3-18 in this chapter.
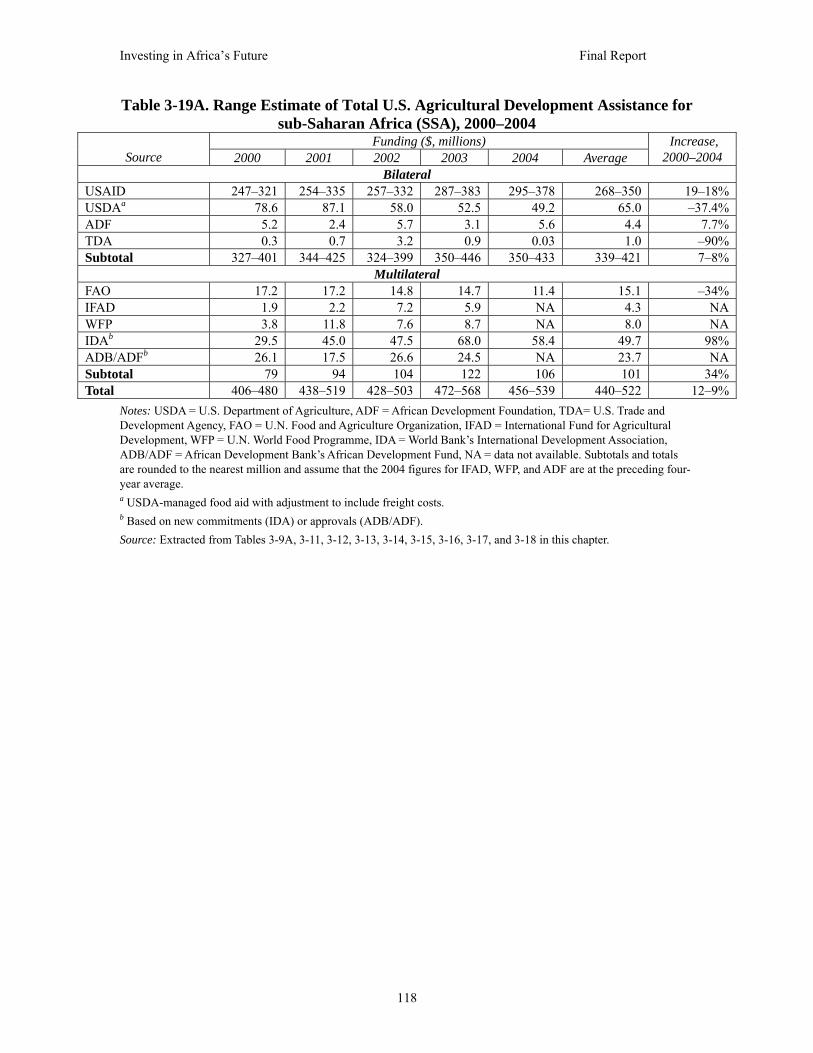
Investing in Africa’s Future Final Report
118
Table 3-19A. Range Estimate of Total U.S. Agricultural Development Assistance for sub-Saharan Africa (SSA), 2000–2004
Funding ($, millions) Source 2000 2001 2002 2003 2004 Average
Increase, 2000–2004
Bilateral USAID 247–321 254–335 257–332 287–383 295–378 268–350 19–18% USDAa 78.6 87.1 58.0 52.5 49.2 65.0 –37.4% ADF 5.2 2.4 5.7 3.1 5.6 4.4 7.7% TDA 0.3 0.7 3.2 0.9 0.03 1.0 –90% Subtotal 327–401 344–425 324–399 350–446 350–433 339–421 7–8%
Multilateral FAO 17.2 17.2 14.8 14.7 11.4 15.1 –34% IFAD 1.9 2.2 7.2 5.9 NA 4.3 NA WFP 3.8 11.8 7.6 8.7 NA 8.0 NA IDAb 29.5 45.0 47.5 68.0 58.4 49.7 98% ADB/ADFb 26.1 17.5 26.6 24.5 NA 23.7 NA Subtotal 79 94 104 122 106 101 34% Total 406–480 438–519 428–503 472–568 456–539 440–522 12–9%
Notes: USDA = U.S. Department of Agriculture, ADF = African Development Foundation, TDA= U.S. Trade and Development Agency, FAO = U.N. Food and Agriculture Organization, IFAD = International Fund for Agricultural Development, WFP = U.N. World Food Programme, IDA = World Bank’s International Development Association, ADB/ADF = African Development Bank’s African Development Fund, NA = data not available. Subtotals and totals are rounded to the nearest million and assume that the 2004 figures for IFAD, WFP, and ADF are at the preceding four-year average. a USDA-managed food aid with adjustment to include freight costs. b Based on new commitments (IDA) or approvals (ADB/ADF). Source: Extracted from Tables 3-9A, 3-11, 3-12, 3-13, 3-14, 3-15, 3-16, 3-17, and 3-18 in this chapter.

Investing in Africa’s Future Final Report
119
Appendix 3-A: USAID Strategic Objectives Related to African
Agriculture
We reviewed Congressional Budget Justifications for 2003 and 2005 to determine all the
strategic objectives that appear to foster agriculture’s role in economic growth and
poverty in sub-Saharan Africa. Such strategic objectives for 24 countries as well as
several regions are listed below, with the percentages we assigned to each for purposes of
calculating the estimated levels of funding for agricultural development assistance
reported in Tables 3-3 and 3-3A.
Agriculture (%) Country or Region Most Recent Strategic Objective Title Former Strategic Objective Title Quartile Range
Angola 654-001 Increased Resettlement, Rehabilitation, and Food-Crop Self-
Reliance in War-Torn Angola 50 33–67
654-005 Improved Food Security 100 100Burundi 695-007 Food Security 100 100Democratic Republic of Congo
660-001 Health, Agriculture, and Conflict Mitigation
660-001 The Congolese People Are Assisted to Solve National, Provincial,
and Community Problems through Participatory Processes
25 0–33
660-004 Livelihoods 100 100
Eritrea 661-002 Rural Enterprise Investment
Partnership
661-002 Increased Income of Enterprises, Primarily Rural, with
Emphasis on Exports 100 100
Ethiopia 663-001 Increased Availability of Selected Domestically Produced Food
Grains 100 100
663-005 Enhanced Household Food Security in Target Areas 100 100
663-007 Food Security 663-007 Rural Household Production
and Productivity Increased 100 100
663-012 Southern Tier Initiative
663-012 Improved Livelihoods for Pastoralists and Agro-Pastoralists in
Southern Ethiopia 50 33–67
Ghana 641-001 Economic Growth 641-001 Increased Private-Sector
Growth 75 67–100
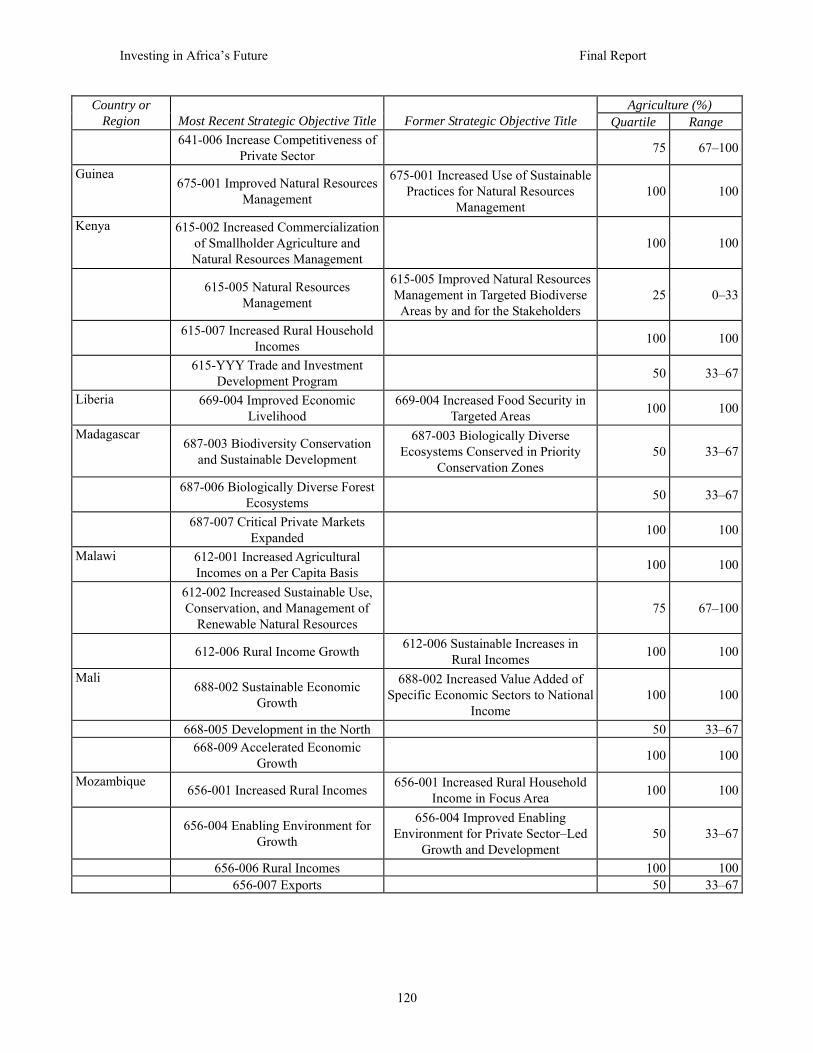
Investing in Africa’s Future Final Report
120
Agriculture (%) Country or Region Most Recent Strategic Objective Title Former Strategic Objective Title Quartile Range
641-006 Increase Competitiveness of Private Sector 75 67–100
Guinea 675-001 Improved Natural Resources
Management
675-001 Increased Use of Sustainable Practices for Natural Resources
Management 100 100
Kenya 615-002 Increased Commercialization of Smallholder Agriculture and Natural Resources Management
100 100
615-005 Natural Resources
Management
615-005 Improved Natural Resources Management in Targeted Biodiverse Areas by and for the Stakeholders
25 0–33
615-007 Increased Rural Household Incomes 100 100
615-YYY Trade and Investment Development Program 50 33–67
Liberia 669-004 Improved Economic Livelihood
669-004 Increased Food Security in Targeted Areas 100 100
Madagascar 687-003 Biodiversity Conservation
and Sustainable Development
687-003 Biologically Diverse Ecosystems Conserved in Priority
Conservation Zones 50 33–67
687-006 Biologically Diverse Forest Ecosystems 50 33–67
687-007 Critical Private Markets Expanded 100 100
Malawi 612-001 Increased Agricultural Incomes on a Per Capita Basis 100 100
612-002 Increased Sustainable Use, Conservation, and Management of
Renewable Natural Resources 75 67–100
612-006 Rural Income Growth 612-006 Sustainable Increases in
Rural Incomes 100 100
Mali 688-002 Sustainable Economic
Growth
688-002 Increased Value Added of Specific Economic Sectors to National
Income 100 100
668-005 Development in the North 50 33–67 668-009 Accelerated Economic
Growth 100 100
Mozambique 656-001 Increased Rural Incomes 656-001 Increased Rural Household
Income in Focus Area 100 100
656-004 Enabling Environment for
Growth
656-004 Improved Enabling Environment for Private Sector–Led
Growth and Development 50 33–67
656-006 Rural Incomes 100 100 656-007 Exports 50 33–67

Investing in Africa’s Future Final Report
121
Agriculture (%) Country or Region Most Recent Strategic Objective Title Former Strategic Objective Title Quartile Range
Nigeria 620-007 Sustainable Agriculture and
Economic Growth
620-007 Strengthen Institutional Capacity for Economic Reform and
Enhance Capacity to Revive Agricultural Growth
75 67–100
620-012 Sustainable Agriculture and Economic Growth 100 100
Rwanda 696-003 Food Security and Economic
Growth
696-003 Increased Ability of Rural Families in Targeted Communities to Improve Household Food Security
100 100
696-007 Rural Economic Growth 100 100Senegal
685-001 Private Enterprise 685-001 Sustainable Increases in
Private-Sector Income-Generating Activities in Selected Sectors
50 33–67
Sierra Leone 636-001 Reintegration
636-001 Advancement of Reintegration Process for War-Torn
Populations in Targeted Communities 50 33–67
Somalia 649-005 Productive Livelihoods 649-005 Increased Opportunities for
Productive Livelihoods 50 33–67
South Africa 674-009 Employment Creation 674-009 Increased Market-Driven
Employment Opportunities 75 67–100
Sudan 650-002 Food Security
650-002 Enhanced Food Security through Greater Reliance on Local
Resources 100 100
650-008 Economic Recovery 75 67–100Tanzania 621-005 Rural roads improved in a
sustainable manner 100 100
621-009 Economic Growth
621-009 Increased Micro and Small Enterprise Participation in the
Economy II 100 100
Uganda 617-001 Increased Rural Household Income 100 100
617-007 Economic Development
617-007 Expanded Sustainable Economic Opportunities for Rural-
Sector Growth 100 100
Zambia 611-001 Rural Income Growth 611-001 Increased Incomes of
Selected Rural Groups 100 100
611-005 Increased Competitiveness 100 100Zimbabwe
613-010 Increased Access to Economic Opportunities
613-010 Access to Economic Opportunities for Disadvantaged
Groups Expanded 75 67–100
Africa Regional 698-001 Support for Cross-Cutting Programs
698-001 Broad-Based Support for Africa 25 0–33
698-014 African Economic Growth
698-014 Adoption of Improved Strategies, Programs, and Activities
for Accelerated, Sustainable, and Equitable Economic Growth
75 67–100

Investing in Africa’s Future Final Report
122
Agriculture (%) Country or Region Most Recent Strategic Objective Title Former Strategic Objective Title Quartile Range
698-015 Improving African
Agriculture
698-015 Adoption of Improved Agricultural Policies, Programs, and
Strategies 100 100
698-017 Improved Environmental and Natural Resources Management
698-017 Accelerate Progress in the Spread of Environmental
Management Systems That Are Strategically Viable and Environmentally Sound
25 0–33
698-023 Environmental Assessment For Sound Development
698-023 Adoption Of Effective Tools, Methods, And Approaches For Improving The Application Of Environmental Procedures And
Strategies
25 0–33
Regional Economic Development Services Office for East and Southern Africa and Greater Horn of Africa Initiative
623-005 Regional Food Security 623-005 Enhanced African Capacity To Achieve Regional Food Security 100 100
Regional Center for Southern Africa
690-002 Southern Africa Trade Development
690-002 A More Integrated Regional Market 50 33–67
690-013 Expanded Trade in Farm
Technologies and Products
690-013 Expanded Commercial Markets for Agricultural Technologies
and Commodities in the SADC 100 100
690-014 A More Competitive Southern African Economy 50 33–67
690-015 Improved Rural Livelihoods 100 100
West African Regional Program
624-004 Regional Economic Integration Strengthened
624-004 Regional Economic Integration Strengthened In West
Africa 50 33–67
624-006 Food Security and Natural
Resources Management
624-006 Food security and ENV/NRM policies and programs strengthened and implemented in
West Africa
100 100
625-003 Decision Makers Have Ready Access to Relevant Information on Food Security, Population, and the
Environment
75 67–100
Notes: SADC = Southern African Development Community, ENV/NRM= Environment and Natural Resources Management. Source: USAID 2005, USAID 2003, and the authors’ estimates.

Investing in Africa’s Future Final Report
123
Appendix 3-B: USAID Title II Non-Emergency Food Aid Non-Emergency Program Summaries, 2000–2004
This appendix contains the raw data that we used to start our estimations and calculations
on the use of Title II non-emergency food aid for agricultural development purposes: the
value of food aid commodities and the dollar amounts of Section 202(e) funds that were
provided to each cooperating sponsor, in Africa and other regions worldwide. Only the
data on sub-Saharan Africa are relevant for our purposes, but the remaining data are
included as they appeared in the original reports for readers’ reference. These data tables
were created as part of the Food for Peace Information System, compiled by USAID’s
Office of Food for Peace and were only slightly modified (consistent formatting, added
notes) for presentation in this report.
For all the tables in this appendix, the following definitions may apply: ACDI =
Agriculture Cooperation Development International; ACDI/VOCA = Agriculture
Cooperation Development International/Volunteers in Overseas Cooperative Assistance;
ADRA = Adventist Development and Relief Agency International; AF/CAR/CRS =
Consortium of Africare, CARE, and Catholic Relief Services; CARE = Cooperative for
Assistance and Relief Everywhere, Inc.; Caritas = Caritas Internationalis; CRS = Catholic
Relief Services; DAP = Development Assistance Program; EOC = Ethiopian Orthodox
Church; FHI = Family Health International; OICI = Opportunities Industrialization
Centers International, Inc.; PCI = Project Concern International; PRISMA = El Programa
Salvadoreño de Investigación sobre Desarrollo y Medio Ambiente; REST = Relief
Society of Tigray; SCF = Save the Children; SHARE = a conglomeration of international
nongovernmental organizations operating in Guatemala, India, and elsewhere; WV =
World Vision; WVI = World Vision International; WVUS = World Vision U.S.;
WV/WIN = World Vision and Winrock International; 202(e) = Section 202(e) of P.L.
480, Title II (Agricultural Trade Development and Food Assistance Act of 1954, as
amended), which authorizes cash payments to the organizations (cooperating sponsors)
that implement food aid programs.
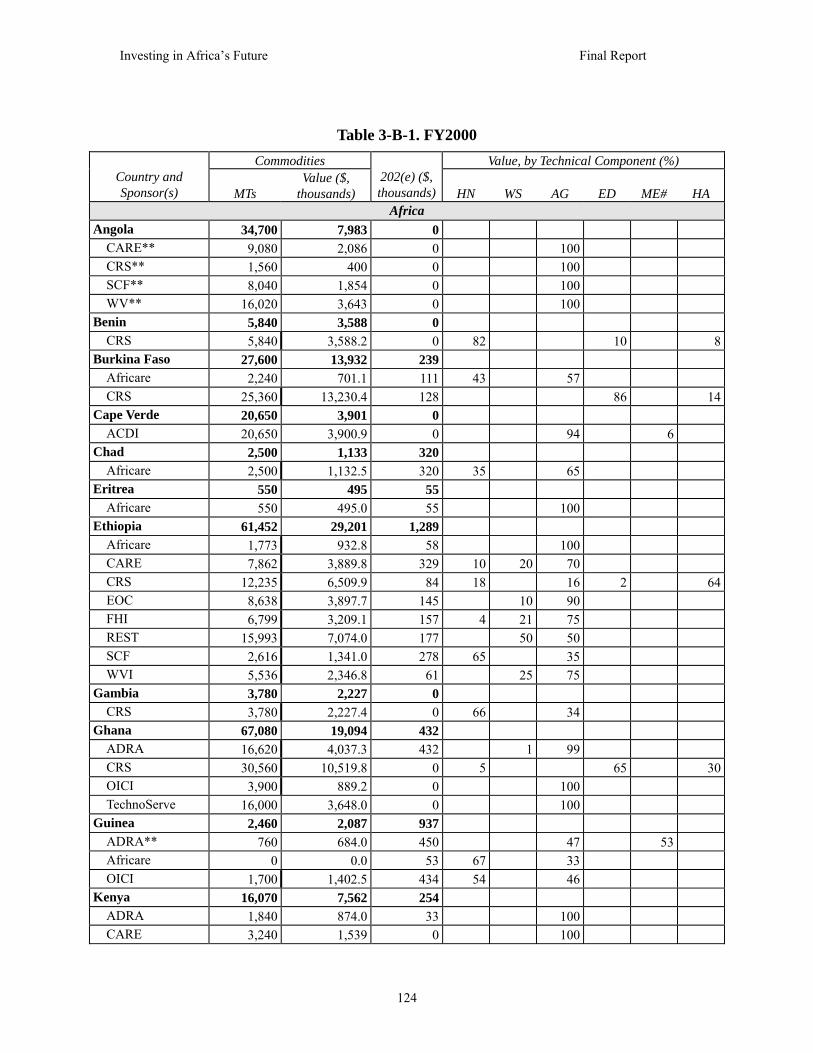
Investing in Africa’s Future Final Report
124
Table 3-B-1. FY2000 Commodities Value, by Technical Component (%)
Country and Sponsor(s) MTs
Value ($, thousands)
202(e) ($, thousands) HN WS AG ED ME# HA
Africa Angola 34,700 7,983 0 CARE** 9,080 2,086 0 100 CRS** 1,560 400 0 100 SCF** 8,040 1,854 0 100 WV** 16,020 3,643 0 100 Benin 5,840 3,588 0 CRS 5,840 3,588.2 0 82 10 8Burkina Faso 27,600 13,932 239 Africare 2,240 701.1 111 43 57 CRS 25,360 13,230.4 128 86 14Cape Verde 20,650 3,901 0 ACDI 20,650 3,900.9 0 94 6Chad 2,500 1,133 320 Africare 2,500 1,132.5 320 35 65 Eritrea 550 495 55 Africare 550 495.0 55 100 Ethiopia 61,452 29,201 1,289 Africare 1,773 932.8 58 100 CARE 7,862 3,889.8 329 10 20 70 CRS 12,235 6,509.9 84 18 16 2 64 EOC 8,638 3,897.7 145 10 90 FHI 6,799 3,209.1 157 4 21 75 REST 15,993 7,074.0 177 50 50 SCF 2,616 1,341.0 278 65 35 WVI 5,536 2,346.8 61 25 75 Gambia 3,780 2,227 0 CRS 3,780 2,227.4 0 66 34 Ghana 67,080 19,094 432 ADRA 16,620 4,037.3 432 1 99 CRS 30,560 10,519.8 0 5 65 30 OICI 3,900 889.2 0 100 TechnoServe 16,000 3,648.0 0 100 Guinea 2,460 2,087 937 ADRA** 760 684.0 450 47 53 Africare 0 0.0 53 67 33 OICI 1,700 1,402.5 434 54 46 Kenya 16,070 7,562 254 ADRA 1,840 874.0 33 100 CARE 3,240 1,539 0 100
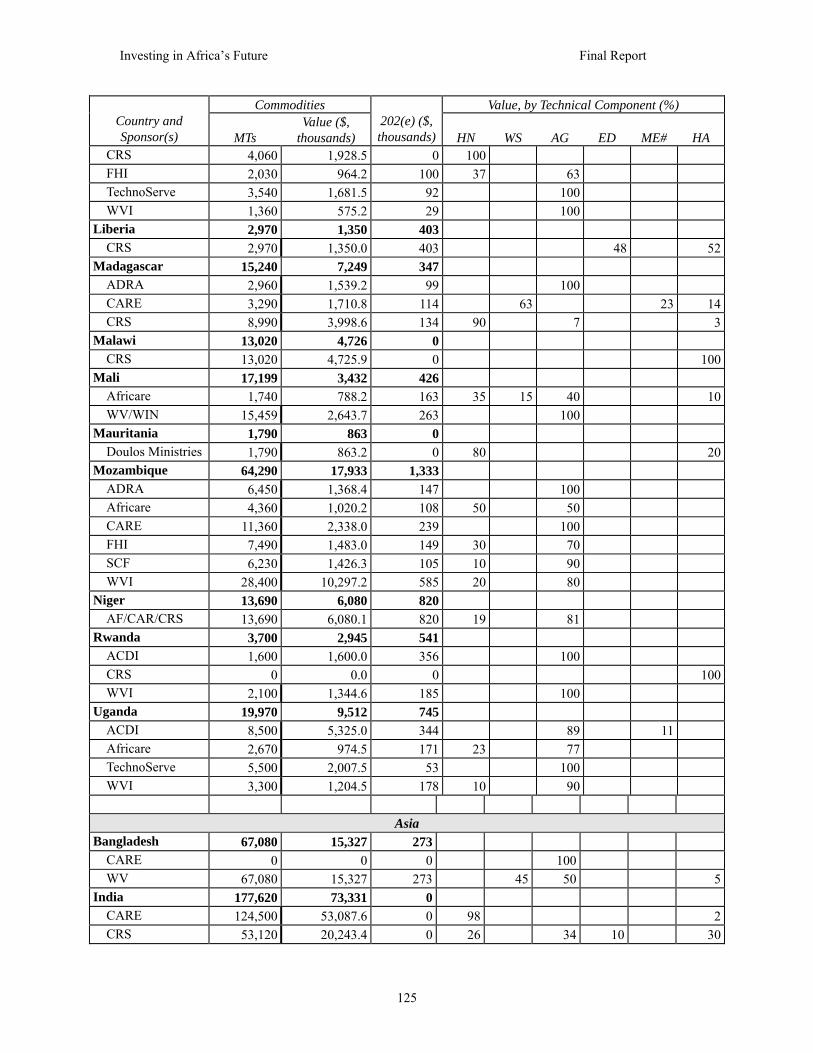
Investing in Africa’s Future Final Report
125
Commodities Value, by Technical Component (%) Country and Sponsor(s) MTs
Value ($, thousands)
202(e) ($, thousands) HN WS AG ED ME# HA
CRS 4,060 1,928.5 0 100 FHI 2,030 964.2 100 37 63 TechnoServe 3,540 1,681.5 92 100 WVI 1,360 575.2 29 100 Liberia 2,970 1,350 403 CRS 2,970 1,350.0 403 48 52Madagascar 15,240 7,249 347 ADRA 2,960 1,539.2 99 100 CARE 3,290 1,710.8 114 63 23 14 CRS 8,990 3,998.6 134 90 7 3Malawi 13,020 4,726 0 CRS 13,020 4,725.9 0 100Mali 17,199 3,432 426 Africare 1,740 788.2 163 35 15 40 10 WV/WIN 15,459 2,643.7 263 100 Mauritania 1,790 863 0 Doulos Ministries 1,790 863.2 0 80 20Mozambique 64,290 17,933 1,333 ADRA 6,450 1,368.4 147 100 Africare 4,360 1,020.2 108 50 50 CARE 11,360 2,338.0 239 100 FHI 7,490 1,483.0 149 30 70 SCF 6,230 1,426.3 105 10 90 WVI 28,400 10,297.2 585 20 80 Niger 13,690 6,080 820 AF/CAR/CRS 13,690 6,080.1 820 19 81 Rwanda 3,700 2,945 541 ACDI 1,600 1,600.0 356 100 CRS 0 0.0 0 100 WVI 2,100 1,344.6 185 100 Uganda 19,970 9,512 745 ACDI 8,500 5,325.0 344 89 11 Africare 2,670 974.5 171 23 77 TechnoServe 5,500 2,007.5 53 100 WVI 3,300 1,204.5 178 10 90
Asia Bangladesh 67,080 15,327 273 CARE 0 0 0 100 WV 67,080 15,327 273 45 50 5India 177,620 73,331 0 CARE 124,500 53,087.6 0 98 2 CRS 53,120 20,243.4 0 26 34 10 30

Investing in Africa’s Future Final Report
126
Commodities Value, by Technical Component (%) Country and Sponsor(s) MTs
Value ($, thousands)
202(e) ($, thousands) HN WS AG ED ME# HA
Latin America and Caribbean
Bolivia 44,920 20,779 771 ADRA 12,870 5,945.7 250 36 43 13 8 CARE 10,170 4,794.5 171 62 8 30 FHI 11,100 5,093.3 0 18 17 38 27 PCI 10,780 4,945.3 350 10 11 46 33 Guatemala 73,160 18,438 897 CARE 15,200 3,913.1 159 59 28 13 CRS 35,300 7,440.9 318 33 57 10 SCF 13,440 3,836.7 174 25 70 5 SHARE 9,220 3,247.2 245 69 31 Haiti 79,330 21,328 0 CARE 40,900 10,427.2 0 15 8 5 69 3 CRS 38,430 10,900.3 0 25 58 17Honduras 25,810 7,345 0 CARE 17,430 5,127.2 0 38 62 CRS 8,380 2,217.8 0 100 Nicaragua 19,740 5,424 582 ADRA 4,830 1,301.6 191 58 7 21 14 PCI 6,210 1,759.2 191 14 16 28 42 SCF 8,700 2,362.8 200 39 13 23 25Peru 74,620 45,006 0 ADRA 18,440 9,850.6 0 52 48 CARE 19,730 12,332.1 0 43 57 Caritas 21,810 13,072.7 0 88 12 CRS 2,350 1,565.1 0 100 PRISMA 10,390 6,919.7 0 100 TechnoServe 1,900 1,265.4 0 100 Grand Total 939,481 348,276 10,663
Notes: MTs = metric tons, HN = health and nutrition, WS = water and sanitation, AG = agriculture and natural resources management, ED = education, HA = humanitarian assistance, ME = microenterprise (if not part of AG component). * Received incremental FY1999 202(e) funding. ** FY2000 DAP approval pending. Source: Title II DAP tables, Food for Peace Information System, USAID Office of Food for Peace (Bogart 2004).

Investing in Africa’s Future Final Report
127
Table 3-B-2. FY2001 Commodities Value by Technical Component (%)
Country and Sponsor(s) MTs Value ($,
thousands) 202(e)
($, thousands) HN AG ED ME HA Africa
Angola 22,800 7,493 0 CARE 5,880 1,933 0 100 CRS 1,850 607 0 100 SCF 5,450 1,790 0 100 WV 9,620 3,163 0 100 Benin 8,664 3,453 110,350 CRS + 8,664 3,453 110,350 69 10 15 6Burkina Faso 19,182 10,101 340,244 Africare 4,700 2,337 211,487 41 59 CRS 14,482 7,764 128,757 89 3 8Cape Verde 17,780 3,569 403,106 ACDI 17,780 3,569 403,106 100 Chad 2,290 1,310 387,569 Africare 2,290 1,310 387,569 40 60 Eritrea — — 167,523 Africare* — — 167,523 100 Ethiopia 87,689 28,121 1,508,544 Africare 3,680 926 0 100 CARE 13,450 4,286 366,527 16 84 CRS 15,169 5,471 194,249 22 28 50 EOC 10,390 3,346 41,000 5 95 FHI 12,360 3,389 183,571 15 85 REST 17,260 5,913 155,896 25 75 SCF 7,340 2,264 547,501 60 40 WVI 8,040 2,526 19,800 25 75 Gambia 0 0 0 CRS** 0 0 0 66 34 Ghana 70,629 17,904 591,758 ADRA 35,980 8,439 244,041 70 30 CRS 14,549 4,822 73,470 5 72 23 OICI 4,100 947 274,247 100 TechnoServe 16,000 3,696 0 100 Guinea 4,000 3,132 1,244,398 ADRA 1,120 877 398,946 48 52 Africare 1,880 1,472 379,640 44 56 OICI 1,000 783 465,812 34 66 Kenya 36,860 8,173 267,326 ADRA 4,950 1,089 14,628 100 CARE 8,400 1,848 0 100 CRS 11,030 2,474 73,762 100 FHI 4,440 977 34,493 35 65 TechnoServe 3,330 733 105,418 100

Investing in Africa’s Future Final Report
128
Commodities Value by Technical Component (%)
Country and Sponsor(s) MTs Value ($,
thousands) 202(e)
($, thousands) HN AG ED ME HA WVI 4,710 1,052 39,025 100 Liberia 4,427 1,834 264,717 CRS 4,427 1,834 264,717 39 61Madagascar 12,868 5,328 140,716 ADRA 3,540 1,430 100,076 100 CARE 2,800 1,131 0 77 23 CRS 6,528 2,767 40,640 81 5 14Malawi 6,782 2,653 0 CRS 6,782 2,653 0 17 83Mali 2,600 564 165,823 Africare 2,600 564 165,823 50 50 Mauritania 8,085 2,152 198,384 WV-Doulos 8,085 2,152 198,384 49 51 Mozambique 98,400 22,868 1,293,266 ADRA 7,560 1,774 146,092 100 Africare 3,660 829 72,327 50 50 CARE 12,340 2,887 228,137 100 FHI 13,290 3,133 156,083 30 70 SCF 8,080 1,856 105,306 10 90 WV 53,470 12,389 585,321 20 80 Niger 9,600 4,631 383,566 Africare 9,600 4,631 383,566 19 81 Rwanda 13,155 9,140 354,103 ACDI 1,600 1,568 242,917 100 CRS + 5,545 3,461 — 57 43 WV 6,010 4,111 111,186 10 90 Uganda 21,180 9,762 649,481 ACDI 7,910 4,627 480,924 35 65 Africare 1,210 468 110,166 30 30 40 CRS 3,500 1,355 0 TechnoServe 5,860 2,268 58,391 100 WV + 2,700 1,045 — 10 90 Total Africa 446,991 142,187 8,470,874
Asia Bangladesh 294,690 62,861 338,091 CARE 227,630 46,664 0 100 WV 67,060 16,197 338,091 45 55 India 144,408 62,930 171,693 CARE + 106,690 47,273 — 95 5 CRS ++ 37,718 15,657 171,693 25 50 5 20Indonesia 25,496 10,452 0 CARE 5,110 2,073 0 16 84 CRS 4,653 1,796 0 7 93 CWS 2,100 918 0 22 78
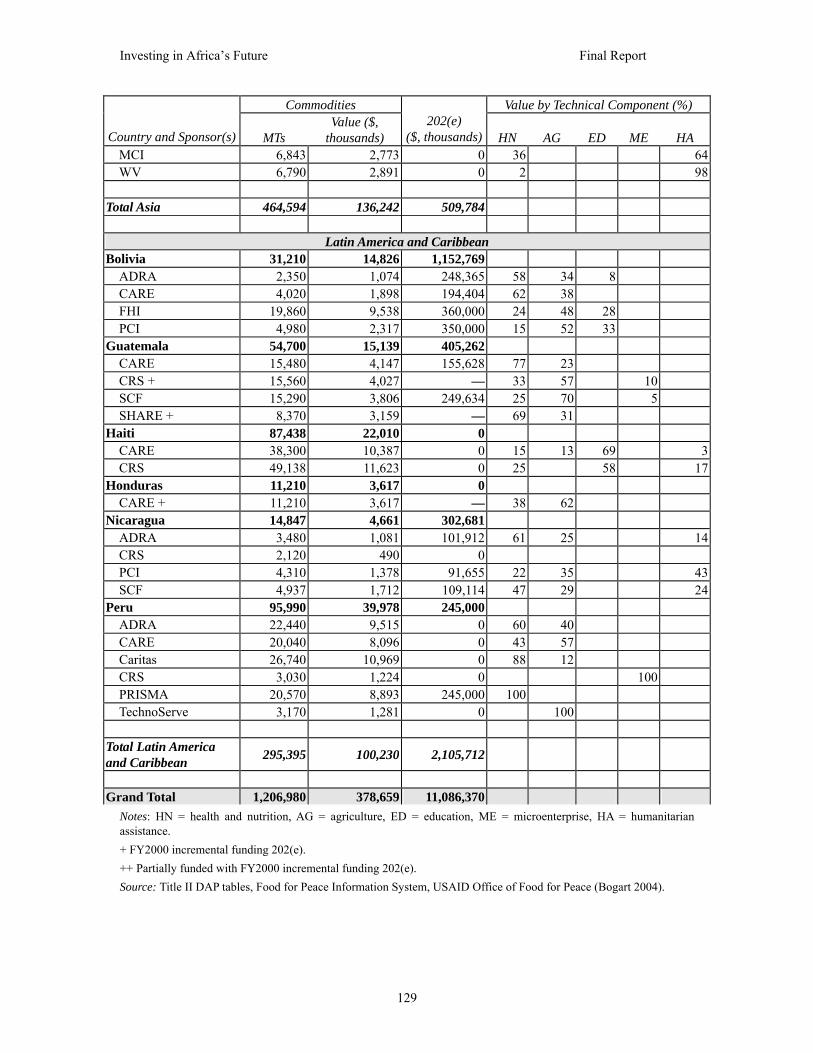
Investing in Africa’s Future Final Report
129
Commodities Value by Technical Component (%)
Country and Sponsor(s) MTs Value ($,
thousands) 202(e)
($, thousands) HN AG ED ME HA MCI 6,843 2,773 0 36 64 WV 6,790 2,891 0 2 98 Total Asia 464,594 136,242 509,784
Latin America and Caribbean Bolivia 31,210 14,826 1,152,769 ADRA 2,350 1,074 248,365 58 34 8 CARE 4,020 1,898 194,404 62 38 FHI 19,860 9,538 360,000 24 48 28 PCI 4,980 2,317 350,000 15 52 33 Guatemala 54,700 15,139 405,262 CARE 15,480 4,147 155,628 77 23 CRS + 15,560 4,027 — 33 57 10 SCF 15,290 3,806 249,634 25 70 5 SHARE + 8,370 3,159 — 69 31 Haiti 87,438 22,010 0 CARE 38,300 10,387 0 15 13 69 3 CRS 49,138 11,623 0 25 58 17Honduras 11,210 3,617 0 CARE + 11,210 3,617 — 38 62 Nicaragua 14,847 4,661 302,681 ADRA 3,480 1,081 101,912 61 25 14 CRS 2,120 490 0 PCI 4,310 1,378 91,655 22 35 43 SCF 4,937 1,712 109,114 47 29 24Peru 95,990 39,978 245,000 ADRA 22,440 9,515 0 60 40 CARE 20,040 8,096 0 43 57 Caritas 26,740 10,969 0 88 12 CRS 3,030 1,224 0 100 PRISMA 20,570 8,893 245,000 100 TechnoServe 3,170 1,281 0 100 Total Latin America and Caribbean 295,395 100,230 2,105,712
Grand Total 1,206,980 378,659 11,086,370
Notes: HN = health and nutrition, AG = agriculture, ED = education, ME = microenterprise, HA = humanitarian assistance. + FY2000 incremental funding 202(e). ++ Partially funded with FY2000 incremental funding 202(e). Source: Title II DAP tables, Food for Peace Information System, USAID Office of Food for Peace (Bogart 2004).
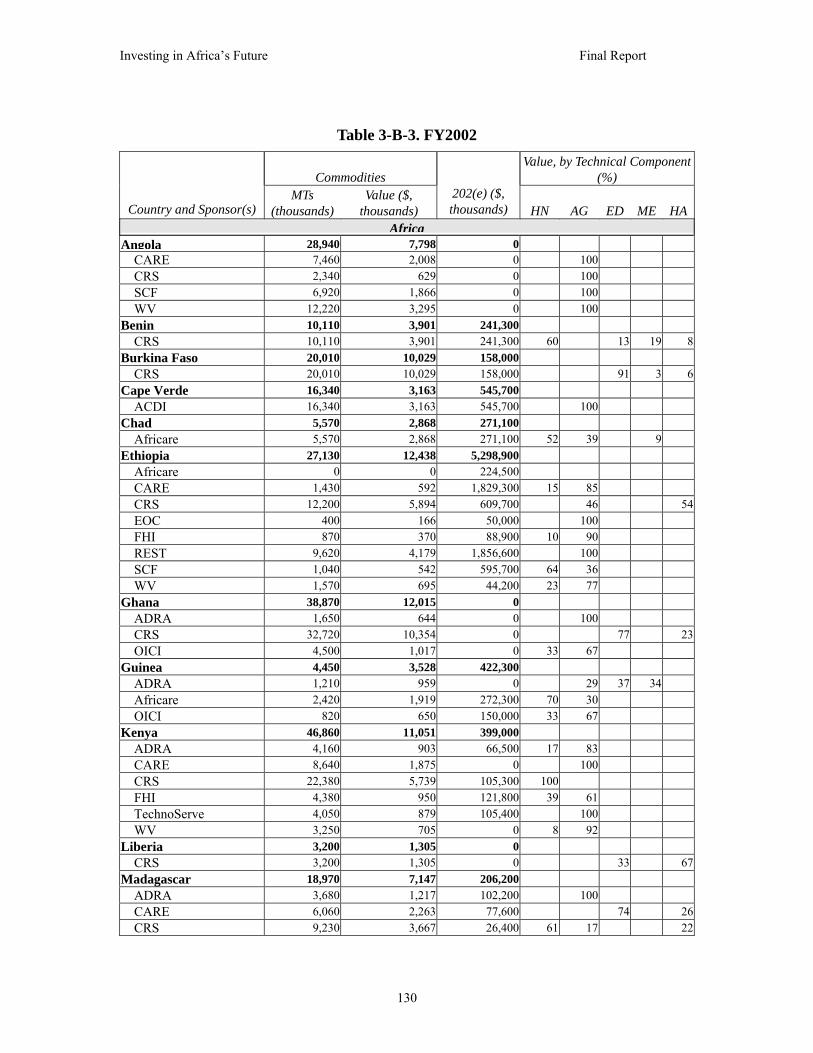
Investing in Africa’s Future Final Report
130
Table 3-B-3. FY2002
Commodities Value, by Technical Component
(%)
Country and Sponsor(s) MTs
(thousands)Value ($,
thousands) 202(e) ($, thousands) HN AG ED ME HA
AfricaAngola 28,940 7,798 0 CARE 7,460 2,008 0 100 CRS 2,340 629 0 100 SCF 6,920 1,866 0 100 WV 12,220 3,295 0 100 Benin 10,110 3,901 241,300 CRS 10,110 3,901 241,300 60 13 19 8Burkina Faso 20,010 10,029 158,000 CRS 20,010 10,029 158,000 91 3 6Cape Verde 16,340 3,163 545,700 ACDI 16,340 3,163 545,700 100 Chad 5,570 2,868 271,100 Africare 5,570 2,868 271,100 52 39 9 Ethiopia 27,130 12,438 5,298,900 Africare 0 0 224,500 CARE 1,430 592 1,829,300 15 85 CRS 12,200 5,894 609,700 46 54 EOC 400 166 50,000 100 FHI 870 370 88,900 10 90 REST 9,620 4,179 1,856,600 100 SCF 1,040 542 595,700 64 36 WV 1,570 695 44,200 23 77 Ghana 38,870 12,015 0 ADRA 1,650 644 0 100 CRS 32,720 10,354 0 77 23 OICI 4,500 1,017 0 33 67 Guinea 4,450 3,528 422,300 ADRA 1,210 959 0 29 37 34 Africare 2,420 1,919 272,300 70 30 OICI 820 650 150,000 33 67 Kenya 46,860 11,051 399,000 ADRA 4,160 903 66,500 17 83 CARE 8,640 1,875 0 100 CRS 22,380 5,739 105,300 100 FHI 4,380 950 121,800 39 61 TechnoServe 4,050 879 105,400 100 WV 3,250 705 0 8 92 Liberia 3,200 1,305 0 CRS 3,200 1,305 0 33 67Madagascar 18,970 7,147 206,200 ADRA 3,680 1,217 102,200 100 CARE 6,060 2,263 77,600 74 26 CRS 9,230 3,667 26,400 61 17 22

Investing in Africa’s Future Final Report
131
Commodities Value, by Technical Component
(%)
Country and Sponsor(s) MTs
(thousands)Value ($,
thousands) 202(e) ($, thousands) HN AG ED ME HA
Malawi 8,900 3,868 85,100 CRS 8,900 3,868 85,100 22 78Mali 0 0 186,700 Africare 0 0 186,700 Mauritania 7,340 2,179 383,500 WV-Doulos 7,340 2,179 383,500 57 43 Mozambique 60,400 13,263 1,440,900 ADRA 5,880 1,287 181,000 17 83 Africare 5,500 1,206 54,200 47 53 CARE 12,060 2,644 132,600 100 FHI 6,570 1,442 117,300 35 65 SCF 5,960 1,310 425,200 51 49 WV 24,430 5,374 530,600 19 81 Niger 17,850 9,374 0 Africare 17,850 9,374 0 24 76 Rwanda 12,870 9,800 800,900 ACDI 800 788 388,800 100 CRS 5,870 4,420 399,700 47 53 WV 6,200 4,592 12,400 100 Uganda 24,030 10,941 649,400 ACDI 12,880 6,628 397,200 48 52 Africare 2,650 1,018 135,600 66 34 CRS 220 116 0 100 TechnoServe 5,580 2,142 62,900 100 WV 2,700 1,037 53,700 14 86 WAR (Senegambia) 1,900 1,173 199,000 CRS 1,900 1,173 199,000 70 30 Total Africa 353,740 125,841 11,288,000
AsiaBangladesh 67,100 16,068 0 WV 67,100 16,068 0 45 55 India 187,270 86,899 1,268,700 CARE 131,090 63,039 0 100 CRS 56,180 23,860 1,268,700 23 34 32 11Indonesia 15,150 5,670 0 CARE 2,520 886 0 17 83 CRS 4,890 1,668 0 9 91 CWS 1,800 728 0 100 MCI 2,380 871 0 36 54 10 WV 3,560 1,517 0 49 49 2 Total Asia 269,520 108,637 1,268,700
Latin America and CaribbeanBolivia 34,650 17,373 849,900
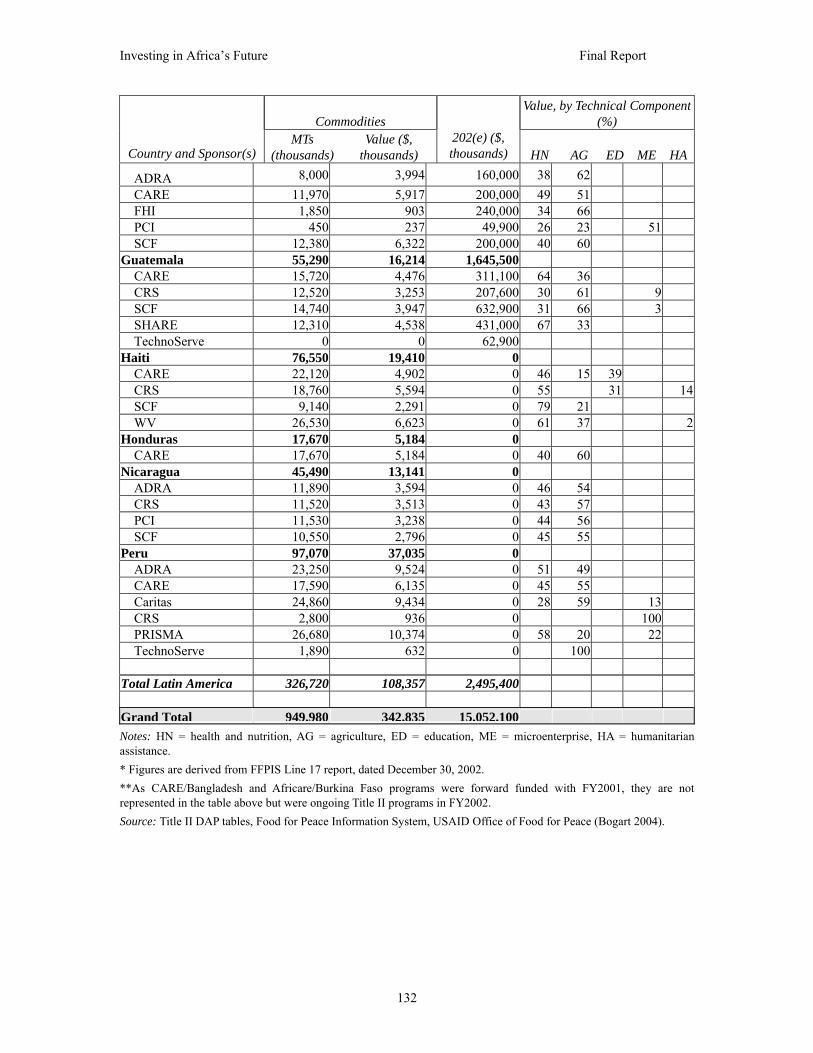
Investing in Africa’s Future Final Report
132
Commodities Value, by Technical Component
(%)
Country and Sponsor(s) MTs
(thousands)Value ($,
thousands) 202(e) ($, thousands) HN AG ED ME HA
ADRA 8,000 3,994 160,000 38 62 CARE 11,970 5,917 200,000 49 51 FHI 1,850 903 240,000 34 66 PCI 450 237 49,900 26 23 51 SCF 12,380 6,322 200,000 40 60 Guatemala 55,290 16,214 1,645,500 CARE 15,720 4,476 311,100 64 36 CRS 12,520 3,253 207,600 30 61 9 SCF 14,740 3,947 632,900 31 66 3 SHARE 12,310 4,538 431,000 67 33 TechnoServe 0 0 62,900 Haiti 76,550 19,410 0 CARE 22,120 4,902 0 46 15 39 CRS 18,760 5,594 0 55 31 14 SCF 9,140 2,291 0 79 21 WV 26,530 6,623 0 61 37 2Honduras 17,670 5,184 0 CARE 17,670 5,184 0 40 60 Nicaragua 45,490 13,141 0 ADRA 11,890 3,594 0 46 54 CRS 11,520 3,513 0 43 57 PCI 11,530 3,238 0 44 56 SCF 10,550 2,796 0 45 55 Peru 97,070 37,035 0 ADRA 23,250 9,524 0 51 49 CARE 17,590 6,135 0 45 55 Caritas 24,860 9,434 0 28 59 13 CRS 2,800 936 0 100 PRISMA 26,680 10,374 0 58 20 22 TechnoServe 1,890 632 0 100 Total Latin America 326,720 108,357 2,495,400 Grand Total 949,980 342,835 15,052,100 Notes: HN = health and nutrition, AG = agriculture, ED = education, ME = microenterprise, HA = humanitarian assistance. * Figures are derived from FFPIS Line 17 report, dated December 30, 2002. **As CARE/Bangladesh and Africare/Burkina Faso programs were forward funded with FY2001, they are not represented in the table above but were ongoing Title II programs in FY2002. Source: Title II DAP tables, Food for Peace Information System, USAID Office of Food for Peace (Bogart 2004).
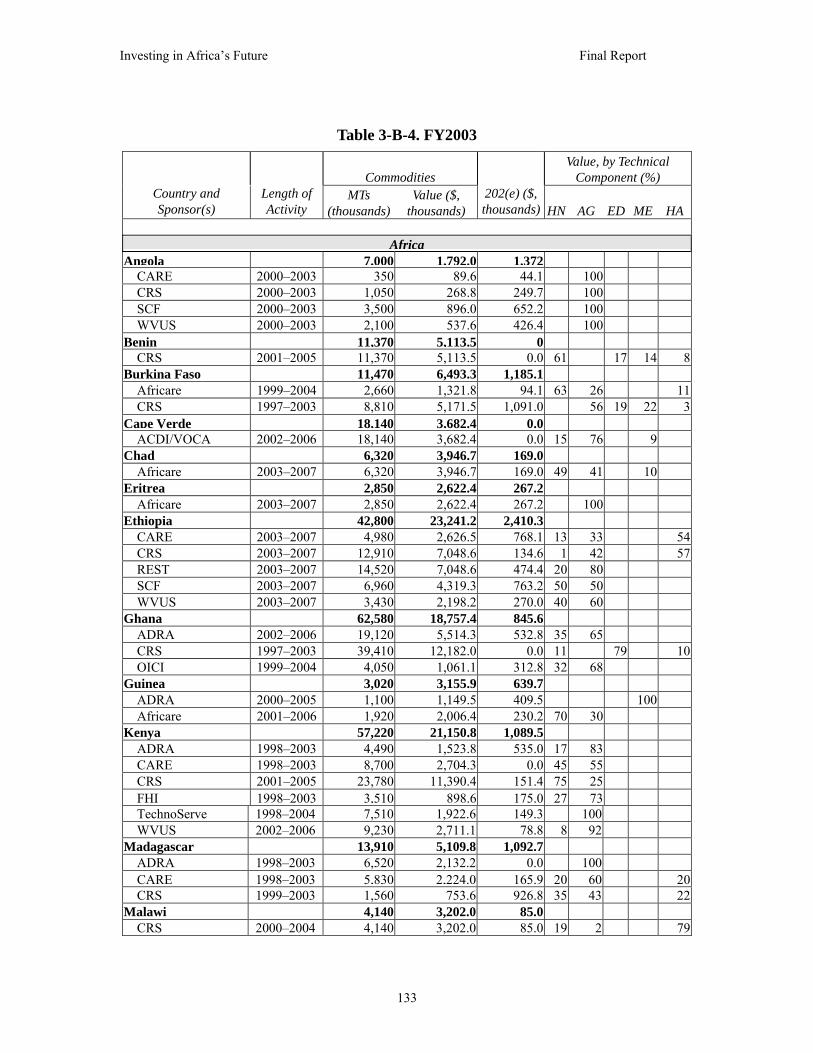
Investing in Africa’s Future Final Report
133
Table 3-B-4. FY2003
Commodities Value, by Technical
Component (%) Country and Sponsor(s)
Length of Activity
MTs (thousands)
Value ($, thousands)
202(e) ($, thousands) HN AG ED ME HA
Africa
Angola 7,000 1,792.0 1,372 CARE 2000–2003 350 89.6 44.1 100 CRS 2000–2003 1,050 268.8 249.7 100 SCF 2000–2003 3,500 896.0 652.2 100 WVUS 2000–2003 2,100 537.6 426.4 100 Benin 11,370 5,113.5 0 CRS 2001–2005 11,370 5,113.5 0.0 61 17 14 8Burkina Faso 11,470 6,493.3 1,185.1 Africare 1999–2004 2,660 1,321.8 94.1 63 26 11 CRS 1997–2003 8,810 5,171.5 1,091.0 56 19 22 3Cape Verde 18,140 3,682.4 0.0 ACDI/VOCA 2002–2006 18,140 3,682.4 0.0 15 76 9 Chad 6,320 3,946.7 169.0 Africare 2003–2007 6,320 3,946.7 169.0 49 41 10 Eritrea 2,850 2,622.4 267.2 Africare 2003–2007 2,850 2,622.4 267.2 100 Ethiopia 42,800 23,241.2 2,410.3 CARE 2003–2007 4,980 2,626.5 768.1 13 33 54 CRS 2003–2007 12,910 7,048.6 134.6 1 42 57 REST 2003–2007 14,520 7,048.6 474.4 20 80 SCF 2003–2007 6,960 4,319.3 763.2 50 50 WVUS 2003–2007 3,430 2,198.2 270.0 40 60 Ghana 62,580 18,757.4 845.6 ADRA 2002–2006 19,120 5,514.3 532.8 35 65 CRS 1997–2003 39,410 12,182.0 0.0 11 79 10 OICI 1999–2004 4,050 1,061.1 312.8 32 68 Guinea 3,020 3,155.9 639.7 ADRA 2000–2005 1,100 1,149.5 409.5 100 Africare 2001–2006 1,920 2,006.4 230.2 70 30 Kenya 57,220 21,150.8 1,089.5 ADRA 1998–2003 4,490 1,523.8 535.0 17 83 CARE 1998–2003 8,700 2,704.3 0.0 45 55 CRS 2001–2005 23,780 11,390.4 151.4 75 25 FHI 1998–2003 3,510 898.6 175.0 27 73 TechnoServe 1998–2004 7,510 1,922.6 149.3 100 WVUS 2002–2006 9,230 2,711.1 78.8 8 92 Madagascar 13,910 5,109.8 1,092.7 ADRA 1998–2003 6,520 2,132.2 0.0 100 CARE 1998–2003 5,830 2,224.0 165.9 20 60 20 CRS 1999–2003 1,560 753.6 926.8 35 43 22Malawi 4,140 3,202.0 85.0 CRS 2000–2004 4,140 3,202.0 85.0 19 2 79

Investing in Africa’s Future Final Report
134
Commodities Value, by Technical
Component (%) Country and Sponsor(s)
Length of Activity
MTs (thousands)
Value ($, thousands)
202(e) ($, thousands) HN AG ED ME HA
Mauritania 14,420 4,271.1 126.2 WVUS 2001–2005 14,420 4,271.1 126.2 75 25 Mozambique 61,700 15,999.1 1,284.8 ADRA 2002–2006 4,100 1,067.0 198.5 17 83 Africare 2002–2006 3,340 869.7 97.5 50 50 CARE 2002–2006 9,770 2,531.2 134.3 100 FHI 2002–2006 8,600 2,225.1 180.9 35 65 SCF 2002–2006 5,940 1,538.6 223.6 51 49 WVUS 2002–2006 29,950 7,767.5 450.0 50 50 Niger 13,110 8,493.2 430.0 Africare 2000–2004 13,110 8,493.2 430.0 19 81 Rwanda 19,530 14,642.6 0.0 ACDI/VOCA 2000–2005 1,630 2,004.9 0.0 100 CRS 2000–2005 8,970 6,436.2 0.0 48 52 WVUS 2000–2005 8,930 6,201.5 0.0 100 Uganda 30,740 17,719.1 1,007.1 ACDI/VOCA 2002–2006 21,490 13,503.9 379.3 48 52 Africare 2002–2006 2,650 1,189.8 321.6 67 33 CRS 2001–2006 3,500 1,571.5 215.3 100 SCF 2004–2008 200 138.9 0.0 99 1 TechnoServe 1999–2004 1,200 538.8 66.1 100 WVUS 1998–2003 1,700 776.2 24.8 14 86 West Africa Regional 1,630 1,140.5 0.0 CRS 2002–2006 1,630 1,140.5 0.0 57 43 Total Africa 381,950 160,533.0 12,004.6
Asia and Near EastBangladesh 150,080 38,576.5 0.0 CARE 1999–2004 83,000 19,588.0 0.0 15 82 3 WVUS 2000–2005 67,080 18,988.5 0.0 45 55India 64,200 44,849.3 0.0 CARE 2002–2006 29,690 27,403.5 0.0 100 CRS 2002–2006 34,510 17,445.8 0.0 25 29 34 12Indonesia 34,880 14,384.7 0.0 CARE 2001–2004 2,700 1,156.5 0.0 100 CRS 2001–2004 9,680 3,695.3 0.0 45 55 CWS 2001–2004 3,380 1,574.4 0.0 40 40 20 MCI 2001–2004 7,510 3,028.5 0.0 63 27 10 WVUS 2001–2004 11,610 4,930.0 0.0 99 1 Total Asia 249,160 97,810.5 0.0
Latin America and CaribbeanBolivia 54,470 29,434.7 0.0 ADRA 2002–2006 10,260 5,558.0 0.0 30 63 7 CARE 2002–2006 16,540 8,972.0 0.0 55 5 40

Investing in Africa’s Future Final Report
135
Commodities Value, by Technical
Component (%) Country and Sponsor(s)
Length of Activity
MTs (thousands)
Value ($, thousands)
202(e) ($, thousands) HN AG ED ME HA
FHI 2002–2006 13,960 7,523.8 0.0 31 11 58 SCF 2002–2006 13,710 7,380.9 0.0 41 59 Guatemala 20,370 10,995.6 7,990.4 CARE 2001–2005 6,540 3,593.5 1,216.2 64 36 CRS 2002–2006 4,900 2,661.3 3,639.9 46 40 14 SCF 2000–2004 4,250 2,201.4 2,063.3 51 26 23 SHARE 2001–2005 4,680 2,539.4 1,071.0 9 63 28 Haiti 95,550 33,008.4 110.0 CARE 2002–2006 20,700 7,254.4 0.0 15 18 67 CRS 2002–2006 29,350 10,505.4 110.0 40 27 33 SCF 2002–2006 14,360 5,261.8 0.0 79 21 WVUS 2002–2006 31,140 9,986.8 0.0 92 8 Honduras 20,490 6,778.7 185.0 CARE 2001–2005 20,490 6,778.7 185.0 60 40 Nicaragua 53,380 17,468.9 0.0 ADRA 2002–2006 21,680 7,551.3 0.0 55 45 CRS 2002–2006 9,700 3,093.1 0.0 45 55 PCI 2002–2006 11,870 3,696.6 0.0 44 56 SCF 2002–2006 10,130 3,127.9 0.0 35 65 Peru 43,110 26,678.0 0.0 ADRA 2002–2007 12,510 7,899.0 0.0 84 16 CARE 2002–2006 8,030 5,002.7 0.0 57 43 Caritas 2002–2008 8,910 5,514.3 0.0 37 42 21 PRISMA 2002–2008 13,660 8,262.0 0.0 70 17 13 Total Latin America 287,370 124,364.3 8,285.4 Grand Total 918,480 382,707.8 20,290.0 Notes: HN = health and nutrition, AG = agriculture, ED = education, ME = microenterprise, HA = humanitarian assistance. Source: Title II DAP tables, Food for Peace Information System, USAID Office of Food for Peace (Bogart 2004).
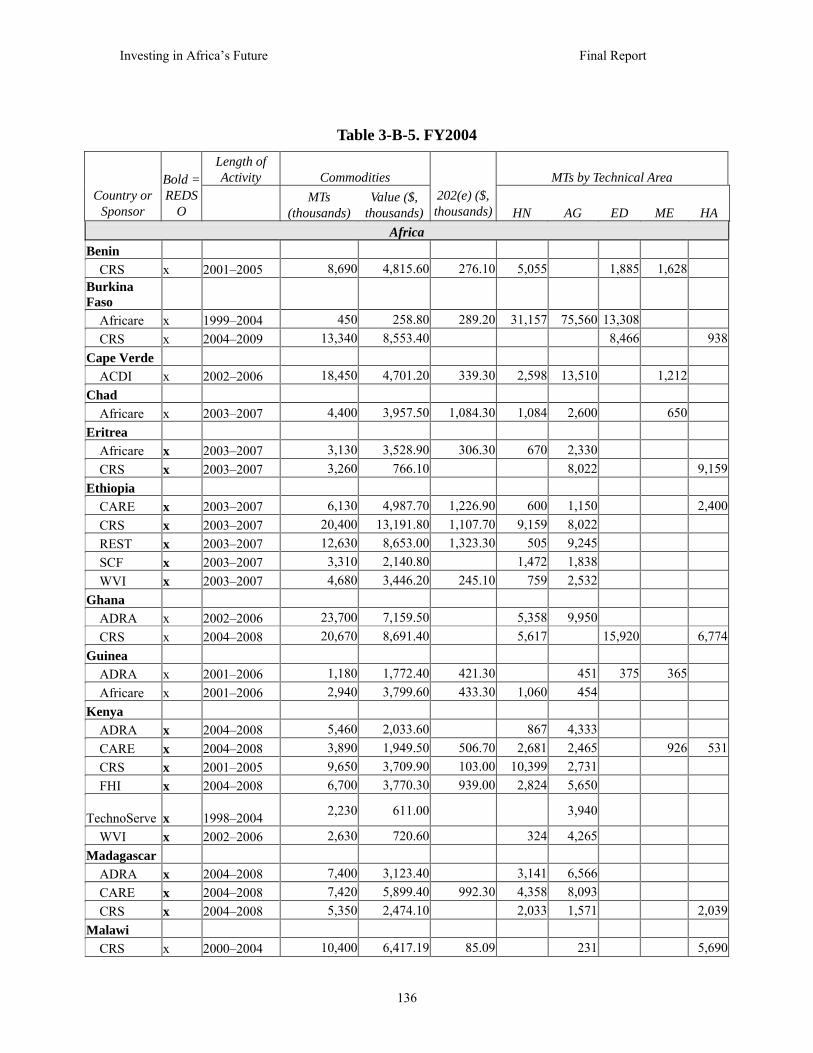
Investing in Africa’s Future Final Report
136
Table 3-B-5. FY2004 Length of Activity Commodities MTs by Technical Area
Country or Sponsor
Bold = REDS
O MTs (thousands)
Value ($, thousands)
202(e) ($, thousands) HN AG ED ME HA
Africa Benin CRS x 2001–2005 8,690 4,815.60 276.10 5,055 1,885 1,628 Burkina Faso
Africare x 1999–2004 450 258.80 289.20 31,157 75,560 13,308 CRS x 2004–2009 13,340 8,553.40 8,466 938 Cape Verde ACDI x 2002–2006 18,450 4,701.20 339.30 2,598 13,510 1,212 Chad Africare x 2003–2007 4,400 3,957.50 1,084.30 1,084 2,600 650 Eritrea Africare x 2003–2007 3,130 3,528.90 306.30 670 2,330 CRS x 2003–2007 3,260 766.10 8,022 9,159 Ethiopia CARE x 2003–2007 6,130 4,987.70 1,226.90 600 1,150 2,400 CRS x 2003–2007 20,400 13,191.80 1,107.70 9,159 8,022 REST x 2003–2007 12,630 8,653.00 1,323.30 505 9,245 SCF x 2003–2007 3,310 2,140.80 1,472 1,838 WVI x 2003–2007 4,680 3,446.20 245.10 759 2,532 Ghana ADRA x 2002–2006 23,700 7,159.50 5,358 9,950 CRS x 2004–2008 20,670 8,691.40 5,617 15,920 6,774 Guinea ADRA x 2001–2006 1,180 1,772.40 421.30 451 375 365 Africare x 2001–2006 2,940 3,799.60 433.30 1,060 454 Kenya ADRA x 2004–2008 5,460 2,033.60 867 4,333 CARE x 2004–2008 3,890 1,949.50 506.70 2,681 2,465 926 531 CRS x 2001–2005 9,650 3,709.90 103.00 10,399 2,731 FHI x 2004–2008 6,700 3,770.30 939.00 2,824 5,650 TechnoServe x 1998–2004 2,230 611.00 3,940
WVI x 2002–2006 2,630 720.60 324 4,265 Madagascar ADRA x 2004–2008 7,400 3,123.40 3,141 6,566 CARE x 2004–2008 7,420 5,899.40 992.30 4,358 8,093 CRS x 2004–2008 5,350 2,474.10 2,033 1,571 2,039 Malawi CRS x 2000–2004 10,400 6,417.19 85.09 231 5,690
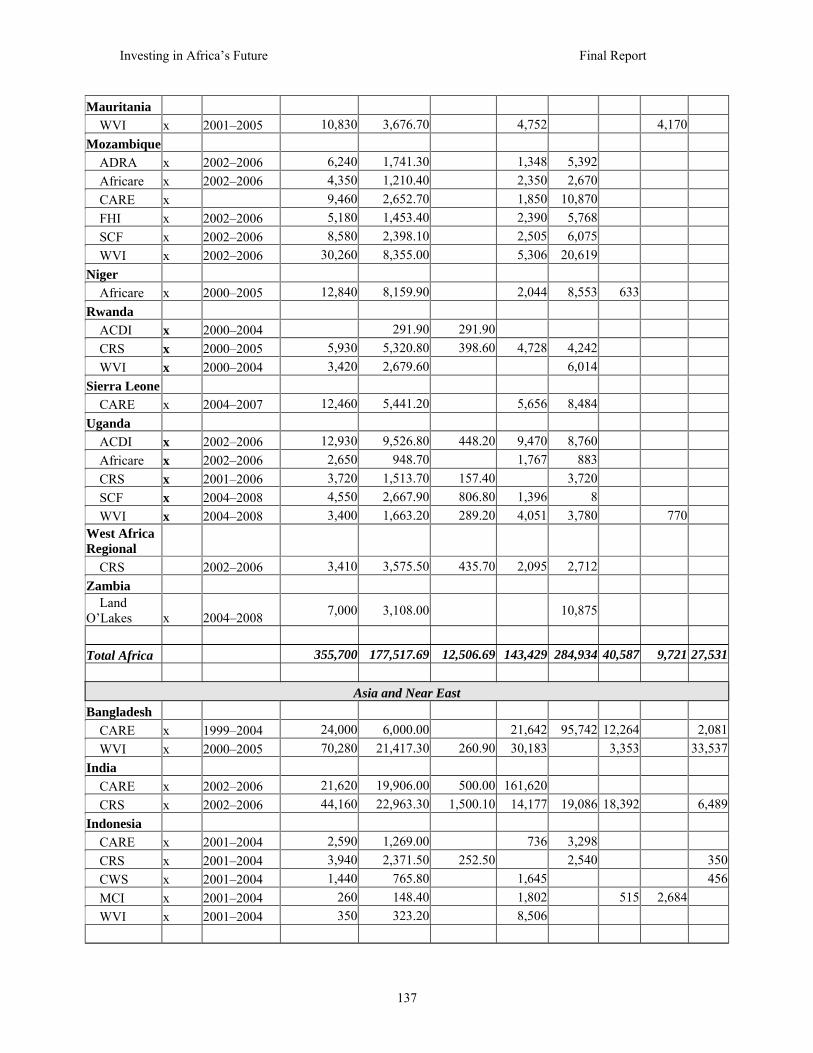
Investing in Africa’s Future Final Report
137
Mauritania WVI x 2001–2005 10,830 3,676.70 4,752 4,170 Mozambique ADRA x 2002–2006 6,240 1,741.30 1,348 5,392 Africare x 2002–2006 4,350 1,210.40 2,350 2,670 CARE x 9,460 2,652.70 1,850 10,870 FHI x 2002–2006 5,180 1,453.40 2,390 5,768 SCF x 2002–2006 8,580 2,398.10 2,505 6,075 WVI x 2002–2006 30,260 8,355.00 5,306 20,619 Niger Africare x 2000–2005 12,840 8,159.90 2,044 8,553 633 Rwanda ACDI x 2000–2004 291.90 291.90 CRS x 2000–2005 5,930 5,320.80 398.60 4,728 4,242 WVI x 2000–2004 3,420 2,679.60 6,014 Sierra Leone CARE x 2004–2007 12,460 5,441.20 5,656 8,484 Uganda ACDI x 2002–2006 12,930 9,526.80 448.20 9,470 8,760 Africare x 2002–2006 2,650 948.70 1,767 883 CRS x 2001–2006 3,720 1,513.70 157.40 3,720 SCF x 2004–2008 4,550 2,667.90 806.80 1,396 8 WVI x 2004–2008 3,400 1,663.20 289.20 4,051 3,780 770 West Africa Regional
CRS 2002–2006 3,410 3,575.50 435.70 2,095 2,712 Zambia Land O’Lakes x 2004–2008 7,000 3,108.00 10,875
Total Africa 355,700 177,517.69 12,506.69 143,429 284,934 40,587 9,721 27,531
Asia and Near East Bangladesh CARE x 1999–2004 24,000 6,000.00 21,642 95,742 12,264 2,081 WVI x 2000–2005 70,280 21,417.30 260.90 30,183 3,353 33,537India CARE x 2002–2006 21,620 19,906.00 500.00 161,620 CRS x 2002–2006 44,160 22,963.30 1,500.10 14,177 19,086 18,392 6,489Indonesia CARE x 2001–2004 2,590 1,269.00 736 3,298 CRS x 2001–2004 3,940 2,371.50 252.50 2,540 350 CWS x 2001–2004 1,440 765.80 1,645 456 MCI x 2001–2004 260 148.40 1,802 515 2,684 WVI x 2001–2004 350 323.20 8,506

Investing in Africa’s Future Final Report
138
Total Asia 168,640 75,164.50 2,513.50 240,311 120,666 34,524 2,684 42,913
Latin America and Caribbean Bolivia ADRA x 2002–2006 8,800.00 4,770.80 80.00 1,772 1,440 701 CARE x 2002–2006 13,040.00 6,684.00 100.00 2,705 395 1,952 FHI x 2002–2006 10,340.00 5,285.90 120.00 3,480 1,214 6,431 SCF x 2002–2006 9,130.00 4,867.80 100.00 4,265 6,179 Guatemala CARE x 2001–2006 5,830.00 4,071.50 155.40 10,284 5,813 CRS x 2002–2006 5,370.00 3,801.90 205.50 1,094 9,066 SCF x 2000–2004 5,370.00 3,811.30 300.00 9,602 9,602 2,302 SHARE x 2001–2006 6,370.00 4,307.00 272.00 7,129 3,230 1,080Haiti CARE x 2002–2006 23,720.00 7,802.10 944.50 10,419 9,387 8,544 CRS x 2002–2006 18,050.00 8,474.40 2,055.40 2,345 1,584 1,912 SCF x 2002–2006 11,490.00 5,321.90 238.80 1,998 WVI x 2002–2006 23,300.00 8,588.10 761.30 4,398 Honduras CARE x 2001–2005 16,360.00 5,288.60 185.00 6,317 2,875 7,135Nicaragua ADRA x 2002–2006 5,030.00 1,987.00 4,465 3,623 1,667 CRS x 2002–2006 4,240.00 1,587.20 813 1,012 PCI x 2002–2006 4,340.00 1,752.60 300.00 4,408 5,707 SCF x 2002–2006 3,330.00 1,225.20 4,605 5,515 Peru ADRA x 2002–2007 6,600.00 4,851.80 8,833 3,434 CARE x 2002–2006 15,770.00 7,091.90 9,547 7,202 Caritas x 2002–2008 7,520.00 5,691.90 4,518 4,081 7,805 PRISMA x 2002–2008 8,270.00 6,533.30 5,456 1,661 9,420 Total Latin America and Caribbean 212,270.00 103,796.20 5,817.90 108,453 81,436 12,496 27,910 10,127
Grand Total 736,610.00 356,478.39 20,838.09 492,193 487,036 87,607 40,315 80,571
Notes: REDSO = Regional Economic Development Services Office, MT = metric ton, HN = health and nutrition, AG = agriculture, ED = education, ME = microenterprise, HA = humanitarian assistance. Source: Title II DAP tables, Food for Peace Information System, USAID Office of Food for Peace (Bogart 2004).

Investing in Africa’s Future Final Report
139
4
Lessons from the Country Studies
A key component of this study is to examine how the array of U.S. agricultural
development programs and projects are aligned with the agricultural programs, priorities,
and public investments of recipient countries. This chapter reviews the results of
qualitative case studies carried out in four purposefully selected countries across sub-
Saharan Africa: Ghana, Mali, Mozambique, and Uganda.1 The country case studies
provide a snapshot of agricultural development policies and assistance from 2000 to 2004
and a synthesis of views by knowledgeable stakeholders about the effectiveness of
assistance under some of the best prevailing conditions for agriculture and rural sector
development on the continent. The case studies are not a comprehensive analysis of
agricultural policies and development assistance to each country nor do they attempt to
analyze the impact of this assistance.
The case studies are based on a desk review of relevant policy and program
documents from the countries, U.S. agencies and their collaborators, and multilateral
agencies and stakeholder interviews carried out by the report co-authors and national
consultants2 during visits to each country in January 2005. Through the case studies, we
sought to understand how U.S. development assistance programs and funding levels
relate to the country’s agricultural programs, priorities, and public investments; how U.S.
assistance is coordinated with assistance from other donors; and the views of stakeholders
on how U.S. development assistance, and public investment in agriculture in general,
could be improved.
1 The full country reports for Ghana, Mali, Mozambique, and Uganda are contained in Appendices 4-A through 4-D. Each report summarizes current conditions related to agriculture and food security in each country, the country’s governance structure as it affects decisions about agriculture, and the role of agriculture in the country’s development strategy. It then provides an overview of public investment in agriculture by the government and external donors as a context for the U.S. program, followed by information on the current purposes, levels, and trends of U.S. funding. 2 The national consultants who contributed to this study were: Dr. Sam Asuming-Brempong (Ghana), Mr. Bakary Kante (Mali), Mr. Victorino Xavier (Mozambique), and Dr. Peter Ngategize (Uganda).

Investing in Africa’s Future Final Report
140
The country studies reveal that agriculture and rural development play a central
role in the PRSPs and related agricultural development strategies of all four countries.
Yet despite the priority given to rural-led economic growth in policies and strategic plans,
domestic public resources are scarce and agriculture competes unfavorably with other
sectors for PRSP funding, notably education and health.
Since the countries are heavily reliant on external donors to implement the
PRSPs, coordination of country and donor strategies and programs is essential to meet
agriculture and rural sector development goals. However, under 10% of total OECD
bilateral assistance to the countries was directed to core agriculture and rural sector
development programs.
USAID country and sector plan priorities are highly consistent with PRSPs and
country sectoral strategies, underscoring the priority on rural-led economic growth, but
this is not reflected in U.S. assistance allocations. Agriculture activities received only
15% of USAID/Ghana’s budget and approximately 33–45% of the budgets in
Mozambique, Uganda, and Mali in FY2004.
Between 2000 and 2004, U.S. bilateral assistance to agriculture declined in
Ghana, Mali, and Mozambique and rose only slightly in Uganda, despite the fact that all
four countries are designated priority countries for the presidential IEHA. By contrast,
USAID spending on health and basic education has ballooned, consuming 45–74% of
USAID’s 2004 annual budget in the case countries.
Country Policies and Programs Related to Agriculture and Rural
Development
Ghana, Mali, Mozambique, and Uganda embody near “laboratory conditions” for
reducing poverty and hunger in the coming decade through agriculture and rural sector-
led economic growth. Like most of sub-Saharan Africa, they are predominantly rural and
poor. But these countries stand out because they are among the continent’s top economic
performers, they have made important progress on political decentralization, and because
their presidents have made significant personal and institutional commitments to
Investing in Africa’s Future Final Report
141
agriculture and rural sector-led economic growth. All are focal countries for the U.S.
IEHA and receive amounts of U.S. agriculture sector assistance that are well above the
average for sub-Saharan Africa. Three of the four have qualified for funding
consideration through the Millennium Challenge Corporation.
Agriculture in Poverty Reduction and Sector Strategies
Agriculture and rural development play a central role in the PRSPs and related
agricultural development strategies of all four countries. The PRSPs embrace similar
visions of “changing archaic, near-subsistence agricultural economies into progressive,
dynamic, entrepreneurial and profitable businesses …[which] will act as a stepping stone
to widespread industrialization.”(GPRS 2003, 36). They recognize that “the dynamics of
human development and broad-based growth are interdependent” (Mozambique 2001,
30), and place a high priority on a market-oriented approach and the promotion of
thriving agribusinesses alongside a multidimensional approach to ensure food and
nutrition security and improved access to health services. Table 4-1 summarizes the main
objectives and target investment areas for the individual country PRSPs.
In addition to the general PRSPs, each country also has developed specific
sectoral plans for agriculture and rural development, summarized in Table 4-2. Each plan
demonstrates that the understanding of how to facilitate rural-led economic growth and
poverty reduction has evolved from the traditional that focused on improving
productivity on the farm. The sector plans call for a broad array of investments needed to
improve infrastructure; increase productivity on and off the farm; reform land tenure;
assist farmers and agribusinesses to access inputs and financial services, improve agro-
processing, and find markets for raw and processed goods; and improve crisis prevention
and response, education, health, and environmental measures. The strategies place a high
priority on improving governance and on creating a policy climate that will stimulate the
private sector to increase income-generating opportunities.
The case study countries rely heavily on external donors for the investments to
implement the PRSPs and agriculture/rural development strategies. In Mali, for example,
external financing is required to fund 37% of PRSP activities, while in Ghana it is
Investing in Africa’s Future Final Report
142
required to fund 90% of activities. Given this dependence on external funding,
coordination of country and donor strategies and programs is essential to meet agriculture
and rural sector development goals.
Coordination of U.S. Assistance with Country Strategies and
Agricultural Development Programs
In all of the case study countries, U.S. assistance for agriculture and rural sector
development is provided through several U.S. agencies (including USAID, USDA,
USTDA, and the U.S. African Development Foundation), and through U.S. contributions
to multilateral agencies, including the World Bank, FAO, IFAD, and ADB. USAID
programs are by far the largest single component of U.S. assistance at the country level,
representing 80% of assistance in Ghana, 75% in Mozambique, and more than 90% of
assistance in Mali and Uganda.
USAID’s Country Strategy Plans in all four countries were developed in a
participatory process with key country government stakeholders and NGO development
partners and are highly consistent with PRSPs, as the comparison of PRSPs and USAID
Country Strategy Plans in Table 4-1 shows.
Likewise, USAID strategic objectives focusing on rural development also are
developed in collaboration with country stakeholders and address a subset of the
country’s sectoral objectives, as Table 4-2 demonstrates. In each of the case study
countries, USAID economic growth programs primarily focus on private-sector
development, enhancing trade, and developing facilitative policies and institutions. U.S.
NGO efforts funded through the Food for Peace program, which are coordinated with the
USAID Mission strategy, have a broader mandate to increase food security for vulnerable
populations.

Investing in Africa’s Future Final Report
143
Funding Trends for Agriculture
The PRSPs in each of the case study countries place a high priority on investments to
reduce poverty by accelerating rural and agricultural-led economic growth. However,
public resources are scarce and in general agriculture competes unfavorably with other
sectors, notably education and health, for PRSP funding.
USAID Country Strategy Plans also underscore the priority on rural-led economic
growth, but this is not reflected in U.S. assistance allocations. Agriculture activities
received only 15% of USAID/Ghana’s budget and approximately 33% to 45% of
Mozambique, Uganda, and Mali’s budget in FY2004. Total U.S. bilateral assistance to
agriculture declined between FY2000 and FY2004 in three of the four countries—Ghana,
Mali, and Mozambique—and rose only slightly in Uganda, despite the fact that all four
countries are designated priority countries for IEHA.
Ghana
The broad goal of USAID/Ghana’s Country Strategy Plan is “equitable economic growth
and accelerated poverty reduction within a system of sound democratic governance”
(USAID/Ghana 2003, 2) but only an estimated 10–15% of the annual USAID/Ghana
budget (approximately $54 million) is used for fostering agriculture’s role in economic
growth and poverty reduction. Total U.S. bilateral assistance for agriculture declined by
two-thirds between FY2000 and FY2004, from $24 to $8 million. In contrast, USAID
spending on health and basic education ballooned, consuming 74% of USAID’s annual
budget in 2004 (Figure 4-1).
It is impossible to determine precisely the total amount of annual public
investment going to agriculture in Ghana or any of the case study countries, whether from
domestic or external sources, due to the lack of any standardized definition or reporting
system for such investment and the fact that many projects are funded on a multi-year
basis. A reasonable approximation of the annual public investment in traditional
agricultural development activities in Ghana is $100–$125 million, virtually all of which
is from external sources. This includes annual bilateral assistance from OECD countries

Investing in Africa’s Future Final Report
144
for core agriculture, forestry, and rural development purposes of $27.5 million annually
(6% of total annual bilateral assistance of $466 million) and multilateral commitments.
As noted above, Ghana and the other countries are heavily dependent on external
funding for PRSP activities. Ghana’s 2003 Annual Progress Report on the GPRS
indicates that the actual share of GPRS investment going to traditional agriculture
activities declined from 7.1% of total discretionary expenditures in 2001 to 4% in 2003,
while infrastructure investments increased from 11.6% to 15.5% (NDPC 2004).
Mali
Mali’s Country Strategy Plan emphasizes that “in Mali, achieving a higher growth in
agriculture will be absolutely essential for increasing incomes and employment and for
reducing poverty” (USAID/Mali 2002, 58). But half of FY2004’s Country Strategy Plan
funding was allocated to health and education programs, compared to 37% for
agriculture-related programs (Figure 4-2). In addition, total U.S. bilateral funding for
agriculture and rural development has declined slightly since 2000 from $16 to $14
million in 2004.
Mali’s total annual public investment in traditional agricultural development
activities between 2000–2003 is estimated at $225–$275 million. This includes annual
bilateral assistance from OECD countries of $26.3 million annually for core agriculture,
forestry, and rural development activities (10% of total annual bilateral assistance of
$266 million) and multilateral commitments.
Within Mali’s overall government budget, agriculture had the second largest
budget allocation of any single sector over the 2002–2005 period at 11.9%. However,
while total PRSP expenditures were projected to rise by one-third over the period,
agriculture expenditures were expected to decline by 13% (from $205 to $178 million),
with domestic agriculture funding decreasing from $89 to $62 million. Over the same
period, health and education expenditures were anticipated to rise by 26% and 28%,
respectively (Mali 2002).

Investing in Africa’s Future Final Report
145
Mozambique
USAID/Mozambique singles out the strategic objective related to agriculture as the
mission’s priority strategic objective, noting that “it would be impossible to address the
problems of poverty and malnutrition without addressing agricultural development and
growth given that more than 80% of the population is engaged in agriculture. The fact
that this huge proportion of the population accounts for approximately one-quarter of
GDP demonstrates that poverty is predominantly, though not exclusively, rural in nature”
(USAID/Mozambique 2003, 8). Nevertheless, the proportion of USAID funding for rural
economic growth activities draws just even with funding for HIV/AIDS and Maternal and
Child Health programs, each with 45% of funding in FY2004 (Figure 4-3). Total U.S.
bilateral funding for Mozambican agriculture has declined by one-quarter since 2000,
from $49 million to $37 million (Table 4-3).
Mozambique’s annual public investment in agricultural development is estimated
at $150–$200 million, including the Ministry of Agriculture’s anticipated spending on
ProAgri II, annual bilateral assistance from OECD countries of $47 million for core
programs related to agriculture, forestry, and rural development (5% of total annual
bilateral assistance of $1 billion), and multilateral commitments.
Mozambique spent an estimated $11.3 million per year over 1999–2002 to
implement ProAgri I. Importantly, Mozambique’s government also invests in roads,
which are essential to agricultural development. In 2003 alone, the government spent
$103 million, or 7.3% of total government spending, on roads (Mozambique 2004), and
external donors have committed $1.7 billion over ten years beginning in 2002, much of
which will directly benefit agricultural development (Mabombo 2005)
Uganda
USAID/Uganda emphasizes that “the rural economy supports 85% of Ugandans and must
be the development target if broad-based economic growth is to be achieved”
(USAID/Uganda 2000). However, in FY2004, two-thirds of USAID strategic objective
funding was allocated to Improved Human Capacity, which encompasses health,
education, and HIV/AIDS activities, and 31% was provided for agriculture-related

Investing in Africa’s Future Final Report
146
economic development (Figure 4-4). Total U.S. bilateral assistance provided to Ugandan
agriculture rose only slightly between FY2000 and FY2004, from $25 million to $26
million.
A benchmark estimate of Uganda’s annual public investment in traditional
agricultural development activities is $100–$150 million. This includes annual bilateral
assistance from OECD countries of $34.7 million annually for core agriculture, forestry,
and rural development activities (7.5% of total annual assistance of $462 million annually
from 2000 through 2003), and multilateral commitments.
Total approved spending under Uganda’s Medium Term Expenditure Framework
(2001/02 to 2004/05) for agriculture and rural development was about $119 million in
2000–2001, or about 9.9% of total government investment to eradicate poverty (MFPED
2000). Of this amount, about $53 million (5%) went to the Ministry of Agriculture,
Animal Industry and Fisheries (MAAIF), with the rest going to rural roads and water
programs, local government capacity building, land and environment, trade and industry,
and other grants (MFPED 2000). In 2003–2004, the total approved spending was up to
$141 million, while spending for agriculture through MAAIF remained at $53 million, a
nearly 15% decrease. In 2003, the government’s report on the Second Review of the Plan
for Modernisation of Agriculture citied the tight funding of the agriculture sector as a
“present and future concern” for the successful implementation of the Plan for
Modernisation of Agriculture (Uganda 2003, 73). Funding likely will continue to be
constrained by the MFPED’s effort to close the government’s substantial budget deficit
and by competing budget priorities. Education, for example, currently receives about
25% of total spending.
Other Key Issues Raised by Stakeholders
Stronger Engagement Needed by Ministries of Finance
Country PRSPs and agricultural development strategies strongly commit countries to
rural and agriculture sector development, but this commitment has not resulted in
Investing in Africa’s Future Final Report
147
increased resources at the country level. Stakeholders felt that ministers of finance need
to be engaged and play a much stronger leadership role to ensure that resource
commitments to the sector are fulfilled and to ensure program coherence among the
several ministries active in the rural sector. Agriculture and rural development
traditionally has been viewed as the province of ministries of agriculture, but there is now
widespread recognition that effective rural development will require coordinated
planning and oversight by a number of ministries, including roads and transport, health,
and education.
Country-level Reporting System
There is no consistent reporting system for agriculture and rural development sector
expenditures by African governments. This will make it extremely difficult to track
commitments to fulfill the 2003 Maputo Commitment by African heads of state to
increase spending on agriculture and rural development to 10% of national budgets.
Donor contributions currently fund a large part of agricultural sector spending. Because
significant donor assistance is channeled directly through NGOs, overall expenditure
levels are unknown and it is difficult to coordinate public- and private-sector investments
in the sector.
Impact of U.S. Earmarks
The examples in the previous section illustrate the serious constraints that USAID
country missions face in programming resources according to mission- and host country-
defined priorities. In the case study countries, mission and host country development
strategies and priorities regarding rural-led economic development are congruent. But
programming actual resources and commitments made to host country partners are
constrained by pre-defined congressional earmarks and by year-to-year uncertainty and
fluctuations in funding levels. The earmarks affect not only allocations between sectors,
as previously discussed, but according to stakeholders dramatically reduce the flexibility
of resource allocation within the agriculture sector. Missions must carry out an intricate

Investing in Africa’s Future Final Report
148
calculus with each funding cycle to respond as best they can to the country’s priorities
with program funding that is restricted to programs such as dairy, trade capacity building,
or biotechnology, restrictions that may bear little relation to the priorities agreed to by the
country and mission.
Lack of Coherence Among U.S. Programs
The lack of coherence and coordination among policies and programs implemented by
U.S. agencies within a single country or region is confusing to host countries and
undermines the effectiveness of development assistance.
• Mali’s government estimates that the financial impact of U.S. domestic cotton
subsidies on Mali farmers dwarfs the impact of development assistance from USAID
and other agencies.
• Stakeholders strongly acknowledge the importance of food aid for humanitarian
assistance but raised questions about the lost opportunity of procuring food aid locally
or regionally to help strengthen continental markets. They also raised questions about
the cost implications of requiring food aid to be shipped in U.S. ship bottoms and of
limiting other procurement to U.S. sources. They felt that the effects of imported,
monetized food aid on local and regional market development, and on the formation
of consumption preferences, required fuller assessment.
• The objectives of the U.S. Trade Representative (USTR), USAID, and USDA trade
policies and programs are not well harmonized, constraining program impact. USTR
exerts influence to steer regional USAID and USDA trade program funding to
programs that increase African exports to the U.S. USAID country programs largely
focus on strengthening national and regional markets based on analysis showing the
important poverty and development impacts from this approach.
• USDA and USAID manage separate, and often not coordinated, biotechnology
outreach and training programs in the same countries.
• A number of complementary USAID programs today are managed separately, but
there are potentially great effectiveness gains if their objectives and implementation
were better harmonized or even merged. These include two major USAID

Investing in Africa’s Future Final Report
149
initiatives—Trade and IEHA—and the USAID Food for Peace programs that are
managed directly from Washington and informally coordinated with mission
agriculture and rural sector programs.
Investing in Government and Public Goods
U.S. agricultural assistance programs in the case study countries are in general regarded
very positively by country stakeholders. But observers voiced concern at the increasing
trend of U.S. programs to work with private-sector and NGO collaborators in isolation
from governments and the implications for scaling up successful local projects. They
noted that governments were not receiving the technical assistance needed to strengthen
regulatory, judicial, and other institutions vital to creating an enabling environment for
private investment. Greatly expanded investments in public infrastructure, such as
transportation, communication and power, are also vital to provide a foundation for
private investment as well as the expansion of social services.
Deterioration of Public Research Systems and Technology Transfer
The inability of research systems to supply and extend new technology will affect
the competitiveness of commodity export on the international market. For example,
Ghanaian pineapple producers currently enjoy a good market for their green pineapples in
Europe but are already facing stiff competition from new Latin American varieties of
golden pineapple that are gaining favor among consumers. In 2004, researchers at one of
Mozambique’s premier national research stations did not bother to develop a research
plan for the coming year because there was no money available for research activities.
Donor agencies and governments in Mozambique and Uganda are increasingly
outsourcing agricultural extension work to private companies and NGOs as a promising
alternative to the state-run extension services. Stakeholders noted that this is beginning to
pay off in terms of improved management and the responsiveness of extensions to local
needs. But they questioned where extension agents in either the public or private sector
Investing in Africa’s Future Final Report
150
would obtain technical recommendations if there is no public research system to test
varieties and recommendations locally.
Accountability and Decentralization
Donor and private-sector confidence in centralized agriculture agencies has declined after
disappointing experiences with sector-specific budget support programs. But there are
examples where major U.S. and donor collaborations with public agencies has worked
well with important implications for U.S. programs, including the Millennium Challenge
Account, which will rely heavily on the establishment of successful monitoring systems
in the field. For example, stakeholders attribute positive results achieved from U.S.
support for road and other infrastructure programs to the Ministry of Transportation in
Mozambique to strong accountability and oversight measures put into place by the
recipient agency, to good coordination among donors, and to a strong capacity-building
program for local managers.
Decentralization of public functions in some countries already has led to
improvements in political and financial accountability for public agriculture and rural-
sector program implementation, such as at the provincial and district levels in Ghana and
Uganda. Other donors are beginning to provide budget or program support directly to
decentralized offices with encouraging results.
Capacity Building for Local Organizations and Strengthening Technical Institutions
and Universities
Stakeholders viewed past U.S. assistance as critical to building human and overall
societal capacity and strengthening technical schools, community colleges, and
universities vital for training future private- and public-sector leaders. They perceived a
shift in current U.S. agriculture and rural-sector assistance programs toward shorter term,
concrete objectives with a finite set of actors and away from building local capacity and
institutions.

Investing in Africa’s Future Final Report
151
Local NGO representatives voiced frustration that U.S. assistance programs
focused so heavily on funding U.S. NGOs to carry out programs rather than building
capacity among local organizations.
Strengthening Industry Associations and Local Public–Private Partnerships
Stakeholders felt that U.S. programs were making significant progress in developing
opportunities for private-sector agribusiness in their countries. Continuing mutual distrust
and communication difficulties between the public and private sectors is perceived as a
significant constraint to agricultural and rural sector development. Given the United
State’s experience and capacities, stakeholders wondered how U.S. programs could play
a stronger role in facilitating communication and public–private collaboration in priority
agriculture/rural sector areas.
Industry associations and civil society groups are beginning to emerge. These
include rural farmer associations and higher-level fora in Ghana and Mozambique and
sector-specific groups for industries such as cashews and pineapples. In Mozambique,
industry associations and farmer fora are grouped within the Confederation of Technical
Associations. These organizations can carry out important independent research and
policy analysis, communicate the needs of their constituents to public agencies and
leaders, and focus attention on priority investments.

Investing in Africa’s Future Final Report
152
Strengthen Democratic Governance
7%
Increase Competitiveness of Private Sector (non-
Agriculture-related)4%
Increase Competitiveness of Private Sector
(Agriculture-related) 11%
Improve Quality of and Acess to Basic Education
24%
Improve Health Status 54%
Figure 4-1. USAID Ghana Strategic Objective Funding Distribution, FY2004

Investing in Africa’s Future Final Report
153
Communications for Development
4%
Shared Governance through Decentralization
11%
Improving Quality of Basic Education
13%
High Impact Health Services
35%
Accelerated Economic Growth (100% Agriculture-
related) 37%
Figure 4-2. USAID Mali Strategic Objective Funding Distribution, FY2004

Investing in Africa’s Future Final Report
154
HIV/AIDS23%
Rural Incomes (100% Agriculture-related)
36%
Exports (Agriculture-related)
8%
Exports (non-Agriculture- related)
8%
Maternal and Child Health 22%
Municipal Governance 3%
Figure 4-3. USAID Mozambique Strategic Objective Funding Distribution, FY2004
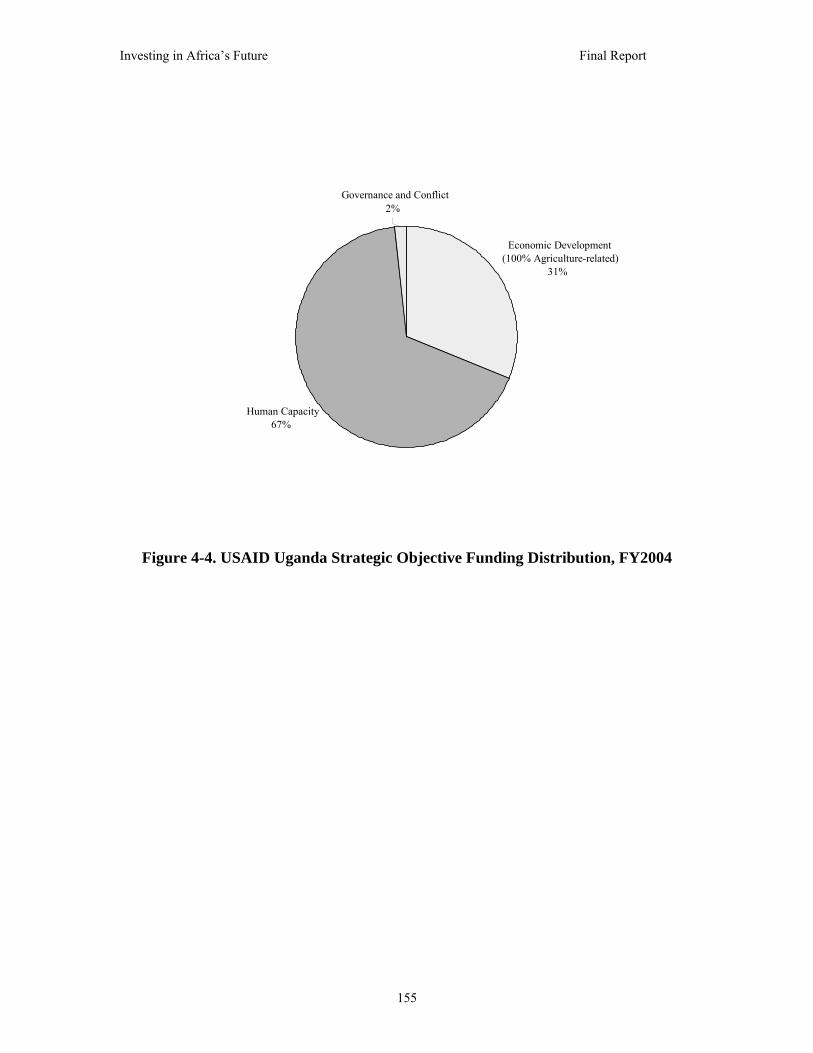
Investing in Africa’s Future Final Report
155
Economic Development (100% Agriculture-related)
31%
Human Capacity 67%
Governance and Conflict2%
Figure 4-4. USAID Uganda Strategic Objective Funding Distribution, FY2004

Investing in Africa’s Future Final Report
156
Table 4-1. Comparison of Country and U.S. Agency for International Development (USAID) Strategic Investment Priorities
Ghana’s Poverty Reduction Strategic Plan (PRSP) 2003–2005
USAID/Ghana’s Country Strategic Plan (CSP) 2004–2010
Achieve growth, accelerated poverty reduction and the protection of the vulnerable and excluded by: • Ensuring sound economic management for
accelerated growth; • Increasing production and promoting sustainable
livelihoods and gainful employment; • Direct support for human development and the
provision of basic services; • Providing special programs in support of the
vulnerable and excluded; • Ensuring good governance and increased capacity
of the public sector; and • Active involvement of the private sector as the
main engine of growth and partner in nation building (Ghana 2003, 30).
Achieve equitable economic growth and accelerated poverty reduction within a system of sound democratic governance through: • Strengthened democratic and decentralized
governance through civic involvement; • Increased competitiveness of Ghanaian private
sector in world markets; • Improved health status; and • Improved quality and access to education
(USAID/Ghana 2003).
Mali’s PRSP USAID/Mali’s CSP Strategic Objectives 2003–2012 Promote strong and sustainable growth that is poverty-reducing through: • Institutional development and improved
governance and participation; • Human development and strengthening access to
basic social services; and • Development of infrastructure and support for
key productive sectors (Mali 2002, 85).
• High impact health services; • Improved quality of basic education; • Shared governance through decentralization; • Accelerated economic growth; and • Communications for development (special
objective) (USAID/Mali 2002).
Mozambique’s PRSP
USAID/Mozambique’s CSP Strategic Objectives 2004–2010
Goal: Promote human development and create a favorable environment for rapid, inclusive and broad-based growth. Six priority areas for action: • Education; • Health; • Agriculture and rural development; • Basic infrastructure; • Good governance; and • Macroeconomic and financial management
(Mozambique 2001, 3).
Foster sustained, poverty-reducing economic growth that reaches average Mozambicans through: • Agricultural development and increased
international trade; • Stemming the spread and impact of HIV/AIDS; • Improving maternal and child health; and • Establishing models of good governance among
municipalities while attacking corruption where it most affects average citizens (USAID/Mozambique n.d.).
Uganda’s Poverty Eradication Action Plan pillars
USAID/Uganda’s Integrated Strategic Plan Strategic Objectives 2002–2007
• Economic management; • Enhancing production, competitiveness, and
incomes; • Security, conflict resolution and disaster
management; • Good governance; and • Human Development (MFPED 2004).
Assist Uganda to reduce mass poverty through: • Expanded sustainable economic opportunities for
rural sector growth • Improved human capacity; and • More effective and participatory governance
(USAID/Uganda 2001).

Investing in Africa’s Future Final Report
157
Table 4-2. Comparison of Country and U.S. Agency for International Development (USAID) Agricultural Development Priorities
Ghana’s Food and Agriculture Sector Development Policy
USAID/Ghana’s Private Sector Competitiveness Strategic Objective (SO)
Contribute to poverty reduction in Ghana by promoting sustainable agriculture and thriving agribusiness through a holistic, market-oriented approach that includes facilitation of: • Production of agricultural raw materials for
industry; • Production of agricultural commodities for
export; • Effective and efficient input supply and
distribution systems; and • Effective and efficient output processing and
marketing systems (MOFA 2002).
• Improve the enabling environment for the private sector;
• Increase the capacity of the private sector to respond to export opportunities;
Food aid program will work with the agriculture and agribusiness to : • Connect smallholder producers to domestic and
export markets; and • Improve agricultural productivity through projects
including agro-forestry extension, post-harvest loss reduction, microenterprise, credit for agricultural inputs (USAID/Ghana 2003).
Mali’s Rural Development Strategy USAID/Mali’s Economic Growth SO • Food security; • Restoration and maintenance of soil fertility; • Development of hydro-agricultural facilities; • Development of agricultural, animal, forestry, and
fisheries production; and • Development of support functions (research,
training, communication, finance) (Mali 2002).
Increase productivity and incomes in selected agricultural sub-sectors through: • Increasing sustainable production of selected
agricultural products in targeted areas; • Increasing trade of selected agricultural products;
and • Increasing access to finance food security
(USAID/Mali 2002).
Mozambique’s ProAgri I and II USAID/Mozambique’s Economic Growth SO ProAgri I Improve the Ministry of Agriculture and Rural Development’s capabilities as an institution. ProAgri II Support smallholders, private sector, government agencies and non-governmental organizations to increase agricultural productivity, agro-industry, and marketing within the principles of sustainable exploitation of natural resources. Pillar areas: • Input and output markets; • Rural finance; • Rural infrastructure; and • Enabling policy and regulatory environment (MADER 2004, 60).
• Increase smallholder sales of agricultural production;
• Expand rural enterprises, including rural trading networks, rural agro-industries, and rural finance; and
• Increase marketing through improving transport infrastructure, focusing on rural roads to increase physical access to markets (USAID 2003).
Uganda’s Plan for the Modernization of Agriculture
USAID/Uganda’s Rural Sector Growth SO
Eradicate poverty by transforming subsistence agriculture to commercial agriculture. Pillar areas:
• Research and technology; • Agricultural advisory services; • Agricultural education; • Rural finance; • Agro-processing and marketing; • Sustainable natural resource utilization and
management; and • Physical infrastructure (Uganda 2000).
• Increase food security for vulnerable populations; • Increased productivity of agriculture and natural
resource systems in selected regions; • Increased competitiveness of enterprises in
selected sectors (e.g., financial sector); and • Improved enabling environment for broad-based
economic growth (e.g., supporting institutional and structural reforms) (USAID/Uganda 2000).

Investing in Africa’s Future Final Report
158
Table 4-3. Summary of Bilateral U.S. Assistance for Agriculture, Major Elements, FY2000–FY2004
Funding ($, thousands)
Country FY2000 Actual
FY2001 Actual
FY2002 Actual
FY2003 Actual
FY2004 Actual
Ghana 23,790 19,240 8,777 11,511 8,414Mali 15,782 8.291 8,957 13,349 14,300 Mozambique 49,485 46,227 30,866 44,322 37,379Uganda 25,471 14,362 22,812 28,351 26,251Note: Includes U.S. Agency for International Development (USAID)/Development Assistance agriculture-related strategic objectives, USAID/Food Aid PL480 Title II, and U.S. Department of Agriculture/Food Aid Food for Progress. All food aid estimates include freight costs. Source: Extracted from Table 7 in Appendix 4-A through 4-D.

Investing in Africa’s Future Final Report
159
5
Conclusions and Recommendations
This report documents the current U.S. agricultural development assistance program for
sub-Saharan Africa. It analyzes current resource trends and program activities in some
detail, but it is neither an audit of resource flows nor an evaluation of the effectiveness of
the U.S. program. It is rather a primer and overview, intended to broadly describe the
multiple dimensions of U.S. efforts on African agriculture and how they relate to one
another. The purpose of this report is to inform debate about future funding directions
and ways to improve the program’s effectiveness.
The report defines agricultural development assistance broadly to include the
wide range of investments and activities that have as a primary purpose contributing to
the ability of agriculture to foster rural economic development and reduce poverty and
hunger in Africa. It includes natural resources management and the many other activities
that contribute to improved productivity on the farm, but it also includes efforts to create
an enabling policy and institutional environment for agriculture in Africa (ranging from
improved land tenure systems to liberalized trade rules to applied agricultural research),
develop markets for agricultural inputs and outputs, build rural roads and other physical
infrastructure necessary for market access, facilitate rural employment through
agribusiness and value-added processing of agricultural commodities, and build
agricultural export capacity and opportunities.
U.S. investment in the public goods required to foster agriculture-led economic
growth is just one way that the programs and policies of the U.S. government affect
agriculture and the prospects for poverty and hunger reduction in sub-Saharan Africa.
U.S. agricultural subsidies and trade policies, food safety and other phytosanitary
requirements, and intellectual property policies are among the features of the policy
landscape that affect African agriculture, perhaps unintentionally, but often negatively.
Agricultural development assistance is, however, the one program of the U.S.

Investing in Africa’s Future Final Report
160
government that attempts to act directly to foster agriculture-led economic growth and
thereby help reduce poverty and hunger in rural Africa. At a time when this goal has
achieved new prominence internationally and among U.S. policymakers, the U.S.
assistance program is an important subject for study, understanding, and improvement.
The analysis of agricultural development assistance in this report also provides a
window into U.S. development assistance more broadly. Foreign assistance—and how it
can be improved—is very much on the public policy agenda in the United States as
national security and the achievement of poverty reduction sought in the MDGs have
become linked in the post-September 11 world and as the Bush administration pursues
important policy and institutional change as reflected most prominently in the
Millennium Development Account. Lessons learned from the analysis of agricultural
development assistance, especially its governance and the institutional landscape, may
thus have broader applications.
This final chapter presents conclusions and recommendations concerning U.S.
agricultural development assistance for sub-Saharan Africa based on the research
conducted for this report in the United States and in visits to the four countries examined
in detail in the appended country studies: Ghana , Mali, Mozambique, and Uganda. They
are offered not as the last word from the authors or the Partnership to Cut Hunger and
Poverty in Africa but to stimulate thought and debate within the policy and stakeholder
community working to improve the U.S. assistance program and the contribution that
agriculture can make to poverty and hunger reduction in Africa.
Conclusions
The following conclusions address agriculture’s role as a vehicle for development,
current resource levels and trends in the U.S. assistance program, and issues affecting the
governance of the program. While agriculture is increasingly embraced as a high priority
in country poverty-reduction strategies and among development agencies worldwide, it
competes unfavorably for assistance resources with other sectors that are important to
development, such as basic education and health, and features of the U.S. governance
system undermine the effectiveness of current assistance programs.

Investing in Africa’s Future Final Report
161
The Role of Agriculture in Africa’s Development
• Since the late 1990s, there has been a strong resurgence in the recognition of
agriculture’s central role in economic development and poverty reduction in Africa.
This recognition is widespread both in the United States and in many African
countries. It is shared by senior government policymakers and managers,
development experts and practitioners, and by farmers, traders, and agribusiness men
and women working on the ground in Africa.
• Because 70% of sub-Saharan Africans live and work in rural areas, agriculture is
recognized as essential not only for its traditional role in meeting the immediate food
security needs of smallholder and subsistence farmers but also as a key source of
income and a generator of employment both on and off the farm in rural
communities.
• Agriculture is embraced by NEPAD, the ADB, and many national governments in
their PRSPs as the key driver of economic development and an essential part of the
economic foundation for health, education, and other services that sustain growth and
social well-being.
• There is also widespread recognition that agriculture can fulfill its role only by
becoming a more market-oriented enterprise. For many farmers, this means getting
more return from local markets; for others, it means competing and succeeding in
regional and international markets and building businesses based both on traditional
and non-traditional commodities and exports. Farmers need to increase their
productivity and their incomes.
• To transform African agriculture in this fashion will require substantial public and
private investment, as emphasized in the African Union/NEPAD’s Comprehensive
Africa Agriculture Development Programme and the Maputo Declaration pledge by
Investing in Africa’s Future Final Report
162
African leaders to commit 10% of their national budgets to agriculture and rural
development.
• Private investment and entrepreneurship is required to finance and operate specific
enterprises successfully. However, private efforts will not be attractive and rewarding
without public investment, which provides essential foundation investments,
including supportive policy frameworks, rural finance mechanisms, market
information and other market-facilitating services, rural transport and other physical
infrastructure, human capacity building through training and extension, and
appropriate research and technology development. These public goods are key to the
success of any market-oriented agricultural system.
• Achieving adequate public investment in African agriculture will require both internal
African resources from national budgets and external resources from developed
country donors and international institutions.
• Despite the widespread recognition of agriculture’s role in Africa’s development,
reflected in country PRSPs and the policy and program plans of development
agencies worldwide, it often takes a back seat to other sectors in the national budgets
of both African and donor countries.
Resource Levels and Trends in U.S. Development Assistance for African Agriculture
In the United States, the heightened recognition of agriculture’s role in Africa has
manifested itself in statements and program definitions at the policy level—for example,
in USAID’s agriculture strategy and in the principles guiding the president’s IEHA—but
this has not translated into increased budgets. In general since 2000, there has been no
significant increase in U.S. resources devoted to agricultural development assistance in
Africa. • While the concept of agriculture-led economic growth and poverty reduction in
Africa is widely embraced, as is the need to be broadly inclusive in defining what

Investing in Africa’s Future Final Report
163
constitutes agricultural development assistance, there is no mechanism in place today
for accurately quantifying the level of resources used for this purpose. This is due
largely to the fact that USAID, the largest U.S. source of agricultural development
assistance, does not report most of its agriculture-related activities in terms directly
related to its agriculture strategy.
• It is possible, however, to gain a meaningful understanding of current U.S. resource
levels and trends for assistance to support agriculture-led economic growth by
looking at the resources available to USAID’s Africa Bureau for agricultural-related
assistance programs and by estimating the actual programming of resources for that
purpose by USAID and other agencies.
• The amount of funding in USAID’s DA account that potentially could be used for
agricultural development assistance in Africa grew by 7% from FY 2000 to 2004,
from $284 million to $304 million, which means a 3% decrease in real terms after
adjusting for inflation. IEHA has not resulted in increased USAID resources for
agricultural development assistance in Africa. In contrast, USAID funding available
for health-related activities in Africa grew by 61% during the period to $474 million.
• Estimates of actual USAID funding for agricultural development in Africa, including
both traditional development assistance programs and Title II food aid resources,
indicate a total gain over the period of about 19% in absolute terms (9% after
inflation), to a range of $295–378 million. Most of this gain occurred between FY
2002 and 2003, with estimated expenditures essentially unchanged from 2003 to
2004. In 2005, the Africa DA budget increased by $53 million over 2004, but $40
million of this gain was allocated to the Education and Democracy/Conflict sectors. It
is too early to estimate how the remaining small gain in funds available for
agricultural assistance development (about $13 million) will translate into actual
expenditures in 2005.

Investing in Africa’s Future Final Report
164
• When funding for African agricultural development from other U.S. bilateral
sources—USDA-managed food aid, the African Development Foundation, and the
TDA—is considered, U.S. bilateral assistance increased by 7–8% over the five-year
period, in the range of $350–433 million, which amounts to a slight decline in real
terms after inflation. This level of funding for agriculture-led economic growth in
Africa amounts to about 4% of total USAID-managed assistance programs
worldwide. • U.S. funding for agricultural development in Africa through multilateral channels—
the FAO, IFAD, WFP, World Bank/IDA, and the African Development Fund—which
comprises about 20% of total funding, grew by 34%, from $79 million to $106
million, due almost entirely to in a commendable increase in World Bank/IDA
funding for rural roads. • These figures show that the emphasis placed on agriculture as a key to economic
development and poverty reduction by administration leaders has yet to be reflected
in substantial budget gains for agricultural development assistance in Africa.
Governance and the Politics of Assistance
Funding levels and trends tell only part of the story of U.S. agricultural development
assistance for Africa. The level of available funding, the purposes for which it can be
used, and the efficiency with which resources reach the ground where they can have an
impact in Africa are all influenced by complicated interactions among U.S. government
agencies, their constituents, and a broad range of international considerations.
There are two key issues. First, competing policy and political considerations
have led to an increasing imbalance in the resources available for agriculture-led
economic growth relative to assistance for the health and education sectors. Second, even
within the funding available for agriculture, strong congressional earmarks severely limit
the flexibility of assistance programs to respond to needs identified at the country level.
At least 90% of USAID’s DA account is pre-allocated to specific areas through earmarks,

Investing in Africa’s Future Final Report
165
including trade capacity, microenterprise, biodiversity, and plant biotechnology. These
are important areas in general for agricultural development but may not match specific
country priorities. The effect of these earmarks is to reduce the flexibility of development
assistance programs to respond to the most important needs at the field level and, thus,
undermine the effectiveness of assistance.
• The big decisions about how much U.S. development assistance funding is available
and for what purposes are inherently and actively political in the sense that they are
shaped by competing policy and political considerations and interest groups and made
to a large extent by elected officials rather than development experts. One practical
consequence is that decisions and priorities established by USAID officials, including
the administrator, are not translated easily into new budget allocations. The flat
funding of agriculture in Africa reflects this reality.
• Since September 11, 2001, long-term development initiatives, such as support for
agricultural development in Africa, have competed with immediate assistance needs
in Afghanistan and Iraq, as well as with other short-term crises, like Darfur in Sudan.
In his first congressional budget testimony in the spring of 2001, Administrator
Natsios’ priorities were the three program pillars of Economic Growth and
Agriculture, Global Health, and Conflict Prevention and Developmental Relief. By
2004, his budget testimony gave priority to the emergencies of the day and the war on
terrorism. This is a natural and not new phenomenon in our democratic political
system, but it puts initiatives with longer term investment horizons and payoffs at a
disadvantage in the competition for resources. • Intense competition from crises of the day and high priorities in the health and
education sectors, along with general budget constraints, explain why the slice of the
USAID budget pie available for agricultural development assistance in Africa has
remained essentially flat since 2000 despite resurgent support for agriculture at a
policy level. The Millennium Challenge Account has the potential to avoid these
constraints. If MCA-eligible countries make agriculture-led economic growth a

Investing in Africa’s Future Final Report
166
priority, MCA will be able to fund them for that purpose at levels well beyond what
could ever be achieved through the USAID budget. • In addition to crises of the day, other competing policy and political considerations
limit the total amount of resources available for agricultural development assistance
and how those resources can be allocated. Strong congressional earmarks direct in
broad terms how at least 90% of USAID’s DA account must be spent, with
significant earmarks in areas that relate indirectly but in specific ways to agriculture’s
potential role in development. These include large earmarks for trade capacity,
microenterprise, biodiversity, and plant biotechnology. Each of these earmarks has its
political patrons and advocates and each has its own legitimate justification, but their
cumulative effect is to force many of USAID’s agricultural assistance projects into
particular models (such as support for specific microenterprises that seek to expand
their export markets or work on export policy reform), which may be more or less
appropriate in a particular country based on that country’s needs and priorities. By
laying claim to most of the available resource, the earmarks also crowd out
investments in transport and other forms of rural infrastructure that USAID and many
African countries consider high priority but that do not have any earmark support in
the USAID budget. • The nature of the U.S. budget process is that it rewards well-meaning, politically
active groups that can persuade members of Congress that their particular cause
deserves a guaranteed level of funding. Since the starting point for next year’s budget
is often this year’s allocations, earmarks have staying power and accumulate over
time. While individual earmarks may have merit, their cumulative impact is the
development assistance equivalent of the committee-designed camel, not a coherent
strategy, and they largely preempt the flexibility of USAID and partners in Africa to
develop and implement coherent, partner-led strategies that will be effective in the
diversity of situations that African countries face.
● The first development compact to be entered into by the MCC, with Madagascar,
illustrates how different an earmark-driven public investment strategy might be from

Investing in Africa’s Future Final Report
167
a strategy driven by a country’s judgment about how to reduce poverty and promote
economic growth. USAID’s 2004 CSH and DA portfolio in Madagascar was
budgeted at about $19.5 million, of which $10 million was for health services and
products, $8.3 million was for biologically diverse forest ecosystems, $0.7 million
was for improved governance, and only $0.5 million was related to agriculture-led
economic growth. The Madagascar-driven compact is focused entirely on efforts that
will foster agriculture-led rural economic growth and poverty reduction: securing
improved property rights to land, improving rural finance and credit skills, and
helping Malagasy farmers and rural entrepreneurs identify and exploit new market
opportunities. The compact, which was signed in April 2005, will provide
Madagascar with $110 million dollars over four years. • Another governance factor undermining the effectiveness of agricultural assistance is
that the current planning and reporting system biases the agency toward projects that
can report quantifiable, relatively near-term results through the USAID internal
management system. These pressures may contribute to USAID’s dwindling portfolio
of human and institutional capacity-building programs and infrastructure projects and
its emerging focus on relatively small-scale projects that can produce concrete results.
These include working with a specific firm or group of producers to increase income
from the export of a particular commodity or value-added product. Picking and
supporting specific, potential agribusiness winners has its own value but may or may
not have as large and as broad-based an impact as longer term investments in
infrastructure, training, and institutional development. • Limited funding for agriculture, the results-driven bias toward small-scale projects,
and other features of the political and governance system have resulted in the
fragmentation of agricultural development assistance into a large number of modest-
sized projects across the region. Estimated programming of funds for agriculture-
related strategic objectives at the field office level in sub-Saharan Africa, which
averaged about $200 million per year from 2000 through 2004, was spread widely
across 24 countries and four regional programs, resulting in average annual funding at
the country level of about $6 million per year. This money is typically subdivided
Investing in Africa’s Future Final Report
168
further within each country among multiple contractors and grantees. As an arm of
the U.S. foreign policy apparatus, USAID is expected for diplomatic and political
purposes to have some presence in many countries and the need to satisfy diverse
earmarks, along with other factors, pressures USAID field offices to involve multiple
implementing organizations in diverse projects. This raises the issues, however, of
whether funding for projects is sufficient to have a lasting effect, how well they can
be coordinated, and how their effects add up. • Fragmentation also gives rise to questions about the coordination of agricultural
development assistance within USAID, among U.S. agencies, and with other donor
countries and international institutions. Within USAID, the Africa Bureau and Office
of Food for Peace have traditionally operated in parallel but independently, with FFP
Title II cooperating sponsors in Africa contracting with and reporting to Washington,
while other implementing organizations work directly with the local USAID field
offices. Recently, many missions have worked to coordinate and even integrate these
activities, and, at least on the surface, there is considerable convergence within
USAID on the general approach taken to agricultural development in Africa. There is,
however, no established mechanism for coordinating agricultural development
strategy, resource allocation, or on-the-ground activity with USDA (the other major
bilateral funder of agricultural development assistance) or with the multilateral
development institutions. Because there is wide agreement internationally on the
general approach to agriculture-led economic growth and poverty reduction, the key
implementation issues include priority-setting, resource allocation, and aggregation of
efforts so that the maximum, sustainable development benefit is achieved.
• Finally, domestic political and policy considerations impose a “political overhead” on
U.S. development assistance that reduces the level of resource that actually reaches
the ground in Africa. This includes the costs incurred in procuring food in the U.S.
and shipping it to Africa in predominately U.S. ships, tying aid to procurement from
U.S. sources, and using predominately U.S. contractors to implement development
projects in Africa. It is beyond the scope of this report to quantify the dollar cost of
this political overhead, but it is substantial. The political forces shaping U.S.
Investing in Africa’s Future Final Report
169
development assistance can also have consequences in the recipient country beyond
diminished resources reaching the ground. Food aid can disrupt local markets; the
tying of procurement cuts out local suppliers; and the predominance of U.S.-based
project designers and implementers undermines local ownership of the development
process.
Recommendations
The fact that policymakers widely recognize the essential role of broad-based, market-
oriented agricultural development in achieving economic growth and poverty reduction is
an important shift and accomplishment. The issue now is how best to make the public
investment and create the public goods required to turn the vision into reality. The
recommendations and questions in this section are a partial response. They address
funding priorities and levels, opportunities to improve effectiveness, and possible
structural change in the program. But they are only a starting point. Fulfilling the vision
will require commitment, creativity, and willingness to change on the part of the broad
policy and stakeholder community.
Funding Levels and Priorities
Because U.S. funding for agricultural development assistance in Africa has lagged
significantly behind other sectors and regions, the United States should: • Invest More in Economic Growth, Making African Agriculture a Real Budget Priority
– It is critical that overall development assistance grow significantly. As part of a
major increase, African economic development in general and agriculture-led growth
and poverty reduction in particular should be made true budget priorities for Congress
and USAID. Assistance to African agriculture should grow at least as fast as overall
foreign development assistance, and, by 2009, at least double to 10% or more as a
percentage of USAID-managed development assistance. Creating a better balance
between spending on social services and investments for economic development is
critical. Food, economic development, and health are interdependent. If people cannot

Investing in Africa’s Future Final Report
170
produce adequate food, they will never be healthy; without economic growth in rural
communities, African nations will remain dependent on external assistance to sustain
their health systems and meet other basic human needs.
Resource Use and Effectiveness
Because the level of resources actually reaching the ground in Africa and their effective
application are diminished by correctable policy and structural features of the aid system,
the United States should:
• Reduce Political Overhead – Congress and the administration should review and
reform the policies governing sourcing and shipping of food aid, U.S. procurement
preferences, and reliance on U.S.-based vendors so that more of the resources
appropriated for agricultural development assistance reach the ground in Africa.
• Reduce Fragmentation – USAID should take the lead among U.S. agencies to mount
larger and more focused programs within countries and within the region, taking
advantage of all available U.S. resources (Development Assistance, Title II food aid,
and USDA-managed food aid) and managed by fewer vendors, to ensure that the U.S.
investment adds up to meaningful improvement in the public goods required to build
a successful agricultural system. • Improve Donor Coordination and Pooling of Resources – To further improve the use
and effectiveness of resources, USAID should intensify its efforts to both coordinate
programs and pool resources with other donor agencies so that the donor community
as a whole can be a coherent, meaningful component of the recipient country’s
agricultural development and investment strategy. • Foster Local Ownership of the Development Process – USAID should expand its
program and budget support funding for agricultural development in countries that
have committed to a clearly defined development strategy and have installed the
systems required to manage resources with transparency and accountability.

Investing in Africa’s Future Final Report
171
Planning and Reporting
• Develop a Coordinated U.S. Strategy for Supporting Agriculture-Led Economic
Growth in Africa – To support growth in funding for agriculture-led economic growth
in Africa and a more strategic use of available funds, the USAID administrator should
lead the development of and propose to Congress a comprehensive cross-agency plan
that defines funding needs and priorities for this purpose and outlines how
agricultural development resources will be spent, in a coordinated manner, to foster
broad-based economic growth and poverty reduction. • Improve Transparency, Accountability, and Incentives for Local Ownership and for
Potentially High-Impact Programs with Longer Time Horizons to Achievement – As a
key part of the comprehensive agricultural development support strategy, the USAID
administrator should develop and implement a consistent reporting mechanism that
reveals, on an annual basis and for all agencies with programs related to African
agricultural development:
o Levels and trends in U.S. assistance for agriculture-led economic growth
and poverty reduction in Africa;
o Progress against indicators of substantive progress established in the
comprehensive cross-agency plan;
o Assessment of the projected long-term impact of projects, including
standardized projected returns to the investment beyond external funding
and assessment of the probability that the gains can be sustained by the
host country following withdrawal of external assistance.
Investing in Africa’s Future Final Report
172
Fund for African Agriculture
To provide a budget vehicle for increased investment in African agriculture and poverty-
reducing economic growth, the United States should: • Develop a New Funding Mechanism – The principles underlying the MCA go a long
way toward insulating long-term investment for development from the congressional
earmark process and competition with the crisis or political priority of the day but its
scope remains limited. Congress and the administration should create a similar,
unearmarked fund specifically for Africa targeted at supporting rural economic
growth in countries that meet specific criteria.

Investing in Africa’s Future Final Report
A-1
Appendix 4-A: U.S. Agricultural Development
Assistance in Ghana
By Michael R. Taylor, Julie A. Howard, and Nicole M. Mason1
Overview of the Economy, Agriculture, and Food Security in Ghana2
The former British colony of the Gold Coast became the sovereign, independent nation of
Ghana in 1957 after nearly five centuries of control of the coastal regions by European
imperial powers. Independence leader Kwame Nkrumah, head of the Convention’s
People’s Party, was elected Ghana’s first prime minister. Although Nkrumah sought to
unify the new nation under a socialist regime, challenges to the party’s control were met
with censorship and “preventive detention.” Nkrumah was ousted in a coup by the
Ghanaian army in 1966.
The National Liberation Council, the group responsible for the coup, called for
greater accountability and civilian authority and the country eventually elected a prime
minister and a president. Economic instability was the undoing of this regime, and Ghana
saw its second bloodless coup in 1974, led by Colonel I.K. Acheampong. The colonel’s
promises of a better quality of life and economic development went unrealized, however,
and mismanagement and rampant corruption plagued Ghana. Acheampong was
overthrown in a palace coup by General Akuffo, who was eventually overthrown by Flt.
Lt. Jerry John Rawlings in June 1979. Even though Rawlings and his Armed Forces
Revolutionary Council handed power over to a civilian government led by Dr. Hilla 1 Michael R. Taylor is a Senior Fellow at Resources for the Future in Washington, DC. Julie A. Howard is Executive Director of the Partnership to Cut Hunger & Poverty in Africa in Washington, DC. Nicole M. Mason is a graduate student in the Department of Agricultural Economics at Michigan State University. Sam Asuming-Brempong, a Senior Lecturer in the Department of Agricultural Economics and Agribusiness at the University of Ghana, served as a consultant for this report. The authors acknowledge him for his contributions to their substantive understanding of the issues related to U.S. agricultural development assistance in Ghana and for facilitating their meetings with a broad cross section of government actors and private-sector stakeholders.

Investing in Africa’s Future Final Report
A-2
Linmann in September 1979, Rawlings came back in a coup to overthrow the Linmann
government on December 31, 1981, and set up the Provisional National Defence Council
(PNDC) (Asuming-Brempong 2005).
For more than a decade, Rawlings attempted to root out corruption through force
and intimidation, but eventually in the early 1990s the PNDC lifted the ban on political
parties. Rawlings formed and led the National Democratic Congress and was
democratically elected president in 1992 (Asuming-Brempong 2005). Rawlings was re-
elected in 1996 and power was finally transferred peacefully in January 2001 to John
Agyekum Kufuor of the New Patriotic Party. President Kufuor, who was re-elected in
December 2004, is constitutionally limited to two terms.
Twelve years of civilian rule has been insufficient to lift Ghana out of poverty; in
fact, poverty deepened among some communities in Ghana, especially in the north, over
the period 1993–2003 (Ghana 2003). Although adult literacy is among the highest in sub-
Saharan Africa (SSA) at 72.6% (due to nine years of free, public, compulsory education)
and AIDS prevalence is relatively low at 3.6%, 40% of Ghana’s population of 19.7
million lives in poverty, with 27% living in extreme poverty (1999) (Ghana 2003). Staple
crop farmers are disproportionately affected by poverty in Ghana and make up 59% of
the country’s poor (Ghana 2003). Regional poverty disparities exist as well, with rates as
high as 88% (1998–1999) in Upper West Ghana and as low as 5% (1998–1999) in the
Greater Accra region. Infant mortality is lower (55/1,000) and life expectancy is higher
(56.9 years) than in many other SSA countries but these figures remain high and low,
respectively, relative to higher income countries.
After repeated post-independence coups wreaked havoc on the Ghanaian
economy, an economic recovery program was launched in 1983 in conjunction with the
International Monetary Fund (IMF) to help stabilize Ghana’s economy. Price
liberalization and structural adjustment under the IMF plan and debt relief through the
Heavily Indebted Poor Country (HIPC) Initiative have done little, however, to stimulate
the economy (Ghana 2003). Economic growth in Ghana has stagnated at 5.2% (2003),
2 Information in this section is drawn from the U.S. Department of State’s “Background Note: Ghana” unless otherwise noted (U.S. Department of State 2004).

Investing in Africa’s Future Final Report
A-3
and at $320 (2003) (World Bank 2003), per capita gross domestic product (GDP) is lower
than it was at independence (Ghana 2003).
Ghana’s rich and varied resource base has the potential to generate significant
wealth, but over-reliance on traditional exports—cocoa, timber, gold, and other raw,
unprocessed materials—has left the economy vulnerable to price fluctuations on the
world market. With 54.7% of the workforce engaged in agriculture and fishing,
Ghanaians are affected profoundly by these oscillations.
Ghanaian exports totaled $1.6 billion in 2001, with cocoa accounting for nearly
one-third of exports; aluminum, gold, timber, diamonds, manganese, coconuts and palm
products, coffee, shea nuts, pineapples, cashews, peppers, and rubber made up the
remaining two-thirds of export revenue. The major Ghanaian staple food crops are
cassava, yams, plantains, corn, rice, peanuts, millet, and sorghum. Although the majority
of Ghanaians work in the agricultural sector, the industrial sector is advanced relative to
other SSA countries and employs 18.7% of the workforce; sales and clerical jobs
(15.2%); services, transportation, and communications jobs (7.7%); and professional jobs
(3.7%) employ most of the remainder of the workforce.
Despite a 40% poverty rate and a stagnant economy, Ghana has made significant
progress in combating hunger. The Food and Agriculture Organization of the United
Nations (FAO) reports that undernourishment in Ghana declined from 37% in the period
1990–1992 to 18% in the period 1995–1997 (FAO 2004).3 Undernourishment declined
further to 13% in the period 2000–2002, though the rate of decrease has slowed
significantly.
Ghana’s Governance Structure for Agricultural Development
Ghana’s democratic government includes at the national level a popularly elected
president, a unicameral Parliament, and an independent Supreme Court. The national
government works through ten regional sub-divisions. At the local level, however, there
3 The term “undernourishment” refers only to the failure to meet dietary energy needs and not to the problem of malnutrition, which includes the failure to consume the micronutrients, protein, and other dietary components needed for good health. Nevertheless, FAO uses undernourishment interchangeably with “food insecurity,” which FAO defines as the condition in which people in a society lack physical and economic access to the safe and nutritious food they need to thrive (FAO 2004).
Investing in Africa’s Future Final Report
A-4
are 138 district governments, each with its own elected District Assembly. The district
chief executive is appointed by the president, and, together with the District Assembly,
plays a significant role in developing and implementing policies adopted by the national
government.
Agriculture and rural-based agribusiness are central to Ghana’s economic
development and poverty reduction plans, which are in turn among the highest priorities
of Ghana’s government. The key development policy framework for Ghana is the Ghana
Poverty Reduction Strategy (GPRS) 2003–2005 (Ghana 2003), which was developed and
is implemented through the efforts of numerous government bodies at the national and
local levels.
At the top level of the government, President Kufuor has been involved
personally in providing leadership and policy direction to Ghana’s poverty reduction and
agricultural development strategies. To oversee development of the GPRS, he appointed
his senior minister, a long-time and widely respected figure in Ghanaian government, to
chair the constitutionally mandated National Development Planning Commission
(NDPC). The NDPC coordinates the development and implementation of the GPRS. He
also has identified himself with presidential special initiatives to promote agricultural
development in a number of commodity sectors, including cassava, oil of palm, and
cotton.
Because the GPRS addresses both the social services and economic components
of the development process, virtually every ministry in the government has been involved
in its development and implementation. At least seven ministries played important roles
in developing the agriculture-related elements of the GPRS, with the Ministry of Food
and Agriculture (MOFA) contributing the core agricultural development components in
the form of its 2002 Food and Agriculture Sector Development Policy (FASDEP)
(discussed further below). Parliament also participated in the development of the strategy
through dialogue with the NDPC and had the final say in approving the GPRS following
extensive hearings and deliberations. The District Assemblies contributed to the
formulation of the GPRS by providing comments through the relevant ministries and play
a critical role in frontline implementation because they must approve any specific
projects proposed within their districts in pursuit of the strategy.

Investing in Africa’s Future Final Report
A-5
Because the ability of agriculture to contribute to economic growth depends on a
host of factors beyond the mandate of MOFA, other ministries and agencies also
contribute to the GPRS in ways related to agriculture, including the Ministry of Transport
and Highways; the Ministry of Local Government and Rural Development; the Ministry
of Environment, Science and Technology; the Ministry of Trade and Industry; the
Ministry of Private Sector Development and Presidential Special Initiatives; the Ministry
of Women and Children’s Affairs; and the National Board for Small Scale Industries.
Finally, the Ministry of Finance and Economic Planning plays a critical role in allocating
scarce government resources among many competing bodies and priorities.
Ghana’s governance system for development policy provides the private sector
and other elements of society with opportunities to participate through the normal process
of expressing views to elected members of Parliament and District Assemblies. In
addition, Ghana conducts an annual National Economic Dialogue that is designed to
involve civil society in discussion of development policy. Due at least in part to this and
other efforts to be inclusive in the development of the GPRS, the strategy enjoys wide
support in Ghana, including the endorsement of the opposition party. The differences of
opinion about the GPRS concern the feasibility of meeting some of its specific
development goals on time rather than the general thrust of the strategy.
The Role of Agriculture in Ghana’s Development Strategy
The GPRS is a broad framework for achieving “growth, accelerated poverty reduction
and the protection of the vulnerable and excluded” by:
• Ensuring sound economic management for accelerated growth;
• Increasing production and promoting sustainable livelihoods and gainful
employment;
• Direct support for human development and the provision of basic services;
• Providing special programs in support of the vulnerable and excluded;
• Ensuring good governance and increased capacity of the public sector; and

Investing in Africa’s Future Final Report
A-6
• The active involvement of the private sector as the main engine of growth and partner
in nation building (Ghana 2003, 30).
Agriculture has a central role in the GPRS, reflecting the high percentage of the
Ghanaian workforce engaged in agriculture and the high rates of poverty among farmers.
Based on the belief that changing “the archaic, near-subsistence agricultural economy
into a progressive, dynamic, entrepreneurial and profitable business … will act as a
stepping stone to widespread industrialization (Ghana 2003, 36),” the GPRS makes
“modernized agriculture based on rural development” one of its medium-term priorities,
with the objective “to develop the country to become an agro-industrial economy by the
year 2010” (Ghana 2003, 144).
The GPRS recognizes that achieving these ambitious goals in agriculture requires
a broad array of measures to improve infrastructure for irrigation, storage, and transport;
to improve the marketing opportunities of farmers by removing government-imposed
obstacles and supporting producer organizations; and to increase productivity through
extension services that help farmers with crop and livestock development and new
technologies. It also calls for reform of the land tenure system in Ghana so farmers can
have title to their land, which is “an essential prerequisite to attracting entrepreneurship
into farming and the promotion of agricultural industry” (Ghana 2003, 40).
Further details on how Ghana plans to achieve the agricultural modernization goal
of the GPRS are provided in the FASDEP (MOFA 2002). According to this policy, the
MOFA will contribute to poverty reduction in Ghana by promoting “sustainable
agriculture and thriving agribusiness” through a holistic and market-oriented approach
that includes facilitation of: 1) the production of agricultural raw materials for industry;
2) the production of agricultural commodities for export; 3) effective and efficient input
supply and distribution systems; and 4) effective and efficient output processing and
marketing systems (MOFA 2002).
The GPRS recognizes that significant investment will be necessary if Ghana is to
achieve its overall GDP growth rate target of 8% by 2010 and its agricultural sector
growth rate target of 4.8% by 2005. To address this need, the strategy calls for increased
public financing of development from both internal and external sources. This includes

Investing in Africa’s Future Final Report
A-7
improving the efficiency with which taxes are raised and government expenditures are
made by Ghana’s government, reducing the non-concessionary component of external
loans, and devoting HIPC initiative savings to poverty reduction programs after domestic
debt is reduced.
Overview of Public Investment in Ghana’s Agriculture
While the focus of this study is U.S. agricultural development assistance to Ghana, the
U.S. program is best understood in the context of overall public investment in Ghanaian
agriculture, which is summarized in this section.
As used here, the term “public investment” refers to expenditures by the
government of Ghana or by external donor governments and multilateral institutions.
Public investment in agriculture includes expenditures that have as a primary purpose
improving the capacity of agriculture to contribute to economic growth and a reduction in
poverty and hunger. It thus includes expenditures for the core agricultural purpose of
increasing productivity through improved access to technology, extension, and other
services farmers need to produce, as well as the broader purpose of linking farmers to
markets so they can earn income from increased production.
In many cases, such as spending on rural roads or trade policy, public investments
have multiple purposes, and it may not be possible to identify a primary purpose. Thus,
the broader view of public investment in agriculture taken here makes it impossible to
produce a single figure that can be said with confidence to represent total public
investment in agriculture in any country. The only remedy is to describe relevant
spending in ways that are as clear, transparent, and comparable country-to-country as
available information permits.
The GPRS projects in some detail the cost of implementation of Ghana’s poverty-
reduction strategy over the three-year period 2003–2005 (Ghana 2003). Ghana projects
the total cost to be $5.28 billion above the baseline costs of government operations to be
allocated over five thematic areas: macro-economic stability (8%), production and
gainful employment (27%), human development and provision of basic services (58%),
special programs for the vulnerable and excluded (3%), and governance (4%). When the
GPRS identifies medium-term priority programs, however, which are projected to cost

Investing in Africa’s Future Final Report
A-8
$2.52 billion over the three years, the two-to-one ratio between the social sector
(primarily health and education) and economic sector (which includes agriculture, rural
development, and infrastructure) is almost exactly reversed, with 56.2 % being allocated
to the economic sector and 29.8% to the social sector (Ghana 2003).
Agriculture per se (as funded through the Ministry of Food and Agriculture) does
not fare well, however, in the priority scheme. Of the $80 million the GPRS projected for
the modernization of agriculture over the three years, $23 million was projected for 2003,
but less than $1 million of this made the medium-term priority cut. These efforts, which
included mechanization, irrigation and fisheries investments, instead were deemed a
supplementary priority program that would be implemented “if additional funds can be
secured” (Ghana 2003, Volume II, 14). Infrastructure investments related to agriculture
fared better, with actual expenditures for feeder roads reaching $303 million in 2003,
which was even greater than the $242 million that had been planned (NDPC 2004).
For all of its investments to implement the GPRS, Ghana depends heavily on
external donors, with 90% of the projected $444 million in 2003 GPRS investments
coming from external sources. According to the Organisation for Economic Co-operation
and Development (OECD) (Table 1), external assistance for all purposes totaled more
than $900 million in 2003, or about 12% of Ghana’s national income, with the top four
donors being the World Bank’s International Development Association, the United
Kingdom, the Netherlands, and the United States.
Ghana’s 2003 annual progress report on the GPRS (NDPC 2004) reports actual
spending patterns in the first year of implementation. It shows that considering both
government of Ghana and donor resources, the actual share of GPRS investment going to
agriculture per se declined by 45% between 2001 and 2003 (from 7.17% to 3.91% of
total discretionary expenditures). The report acknowledges that this “has negative
implications for the poor” (NDPC 2004, 33). However, spending for infrastructure
(primarily roads) was substantial at 15.5% of the total. This was below the GPRS target
of 17.2% but above the 2001 level of 11.6%. Despite the GPRS’s expression of medium-
term priorities, social investments through the Ministries of Education and Health
continued to receive the largest share (38.7%) of discretionary GPRS spending.
Interestingly, the donor contribution to Ghana’s GPRS investments was skewed in a

Investing in Africa’s Future Final Report
A-9
different direction, with 10.7% going to agriculture per se, 51.5% going to infrastructure,
and 16.7% going to the social sectors (NDPC 2004).
According to OECD’s Creditor Reporting System, bilateral assistance from the
OECD countries (including the United States) averaged $466 million annually from 2000
through 2003, with reported funding for core agriculture, forestry, and rural development
purposes averaging about $27.5 million annually (Table 2). Reported OECD country
funding for road transport averaged $33 million over the period, but 90% of this was in
one year (2003), and the data do not specify whether the assistance was for rural or urban
road transport.
Significant public investment in Ghanaian agriculture also comes from the
multilateral development organizations, including:
• The World Bank. The World Bank portfolio in Ghana includes 28 active projects with
a commitment value of about $1,084 million (World Bank 2005). These projects
involve health, education, infrastructure, governance, natural resource management,
and other sectors related to achieving the goals of the bank’s Country Assistance
Strategy for Ghana, which include improving access to services for poor Ghanaians
as well as land titling and public-sector management reform (World Bank 2000).
Eight active World Bank projects relate directly to agriculture, with a value of about
$125.2 million (Table 3).
• Food and Agriculture Organization. In 2004, FAO was involved in 27 active, mostly
multi-year projects in Ghana, with a total contribution valued at $4.4 million (FAO
2005). FAO’s projects focus primarily on improving productivity and food security at
the household level, but they involve a wide range of activities, including
strengthening the organizational capacity of producer organizations, fostering access
to needed inputs, capacity building for agricultural product processing, improving
irrigation policy and regulatory measures, training, and developing agriculture-related
industries and bankable projects.
• International Fund for Agricultural Development (IFAD). The IFAD is financing five
ongoing projects in Ghana with loans totaling approximately $41.3 million (IFAD
2005). The projects are: 1) a project to foster the development, enhancement, and
empowerment of new and existing micro- and small enterprises; 2) a poverty

Investing in Africa’s Future Final Report
A-10
reduction project focused on women and the rural poor in the Northern Region of
Ghana; 3) a rural finances project; 4) a five-year project in the Upper East Region of
Ghana to improve women’s access to credit and land, develop rural infrastructure,
and empower producer organizations; and 5) a six-year program to increase
smallholder agricultural productivity through root and tuber crop systems.
• African Development Bank (ADB). In 2003, ADB loans and grant disbursements in
Ghana totaled 49.8 UA or approximately $74.6 million (ADBG 2005). While
agriculture is a priority sector for investment in the ADB’s strategic plan, project- and
sector-specific information was not available for this report.
It is impossible to determine precisely the total amount of annual public
investment in Ghanaian agriculture, whether from domestic or external sources, due to
the lack of any standardized definition or reporting system for such investment and the
fact that many projects are funded on a multi-year basis. Nevertheless, for the sole
purpose of putting U.S. assistance in context, a reasonable approximation of the annual
public investment in traditional agricultural development activities in Ghana is $100–125
million, virtually all of which is from external sources. This includes annual bilateral
assistance from OECD countries and multilateral commitments (assuming an average
three-year project life). This does not include the anticipated investment of about $300
million per year over the 2003–2005 period in roads to improve rural and urban market
access.
The U.S. Assistance Program for Agriculture in Ghana
The U.S. agricultural development program in Ghana is best understood in the context of
the overall U.S. assistance program in the country. The United States is one of Ghana’s
largest bilateral donors, consistently ranking among the top three donor countries. As
reported to the OECD, total U.S. bilateral assistance to Ghana from all agencies for all
purposes during the period 2000–2003 averaged about $66 million per year (Table 2).
About 80% of this assistance is funded and managed through the U.S. Agency for
International Development (USAID), with the balance coming through the Peace Corps,

Investing in Africa’s Future Final Report
A-11
the U.S. Department of Agriculture (USDA), the Trade and Development Agency
(TDA), and the Departments of State, Treasury, and Interior.
In the fiscal years 2000–2004, the total annual USAID appropriation targeted
specifically to assist Ghana averaged about $54 million, including a high of $60.7 million
in FY2003 and an appropriation of $47.7 million in FY2004 (Table 4). USAID’s FY2005
budget request for Ghana was $47.2 million, the eight largest in the Africa region. These
figures do not include funds appropriated for Economic Growth, Agriculture, and Trade
and the Africa regional programs that may have been used for activities in Ghana.
USAID’s Strategy for Agriculture
USAID’s overall strategy in Ghana, including its strategy for agriculture, is described in
the agency’s Ghana Country Strategic Plan (CSP) FY2004–2010 (USAID 2003). The
broad goal of the CSP is “equitable economic growth and accelerated poverty reduction
within a system of sound democratic governance” (USAID 2003, 2). This goal was
identified after stakeholder consultations revealed “weak governance and slow growth”
as the main constraints to poverty reduction in Ghana (USAID 2003, 2). A subsequent
participatory planning process involving government and non-governmental organization
partners helped to formulate four strategic objectives to accomplish the program goal:
• Strengthened Democratic and Decentralized Governance through Civic Involvement;
• Competitiveness of Ghanaian Private Sector in World Markets Increased;
• Health Status Improved; and
• Improved Quality and Access to Education.
In its overall country strategy, the USAID Mission in Ghana stresses that “all
elements of the proposed strategy support [the GPRS]” and that USAID’s strategic
objectives are consistent with the six objectives of the Ghana’s poverty reduction strategy
(USAID 2003, 25). Mechanized agriculture is emphasized in the GPRS and thus features
more prominently in the 2004–2010 CSP than the 1997–2004 version. Nonetheless, the
CSP describes the agriculture strategy mostly in general terms, with agriculture’s
importance implied but rarely explicitly emphasized. Agriculture is explicitly given a
Investing in Africa’s Future Final Report
A-12
high priority in the CSP only in reference to the Food for Peace (Title II) food aid
program. As discussed below, a declining share of strategic objective funding in Ghana
(about 15% in FY2004) goes to the strategic objective that includes agriculture and other
economic development activities; most of the rest goes to health and basic education.
Agriculture is included in strategic objective 641-006 (Increased Competitiveness
of Private Sector), which embodies USAID/Ghana’s economic growth strategy, the
ultimate goal of which is poverty reduction. The strategic objective emphasizes improved
competitiveness in overseas markets because domestic markets are “too small at present
to kick start rapid growth” and “regional markets are still poorly integrated” (USAID
2003, 45). The USAID/Ghana strategy will help Ghanaian exports become more
competitive in overseas markets by “improving the enabling environment for the private
sector” and “increasing the capacity of the private sector to respond to export
opportunities” (USAID 2003, 47).
The near-term goals of the economic growth strategy (intermediate results in
USAID terms) are expressed as:
• Enabling environment supportive of private sector competitiveness strengthened, with
illustrative activities including:
o Providing long-term advisors in the Ministry of Finance and other entities
to assist in policy reform and/or capacity building;
o Providing technical assistance and training to strengthen public sector
fiscal, monetary, and budgetary capacity as well as energy and
telecommunications regulatory bodies;
o Conducting sector policy studies of areas such as agriculture to assess
opportunities for involvement;
o Enhancing Ghana’s integration with Economic Community Of West
African States through collaboration with the West African Regional
Program and the West Africa Trade Hub; and
o Providing grants to strengthen the policy analysis and advocacy capacity
of businesses, labor organizations, and civil society.

Investing in Africa’s Future Final Report
A-13
• Capacity of private-sector enterprises to compete in selected product categories
strengthened, with illustrative activities including:
o Enhancing management and market information access to expand existing
markets and find new markets;
o Improving production and processing technology;
o Developing market-driven strategic partnerships between multinational
companies, Ghanaian exporters, and local out-growers; and
o Promoting environmentally sustainable agricultural practices and build
capacity to meet European Union and American market standards (USAID
2003).
In addition to these activities, the CSP calls for the Food for Peace food aid
program to be integrated into the overall USAID economic growth program for Ghana.
This is to be accomplished by working in the agriculture and agribusiness sectors to help
connect smallholder producers to domestic and export markets, as well as working on
more traditional agricultural productivity projects, such as agro-forestry extension, post-
harvest loss reduction, microenterprise, and credit for agricultural inputs, including
fertilizers and pesticides (USAID 2003).
USAID’s Agricultural Development Program
Funds Available for Agricultural Development Assistance
USAID’s agricultural development assistance for Ghana is funded and managed
primarily through the USAID Mission in Accra out of its Development Assistance (DA)
and PL 480 Title II accounts. The other major account through which the activities of the
USAID Mission in Ghana are funded is Child Survival and Health (CSH). As indicated in
Table 4 and Figure 1, the funds available through the DA and Title II accounts have
declined since FY2000, and the CSH account has grown such that CSH is now the largest
of the three, whereas the DA account was the largest in FY2000. The DA allocation for
Ghana is slated for a further decrease in FY2005.
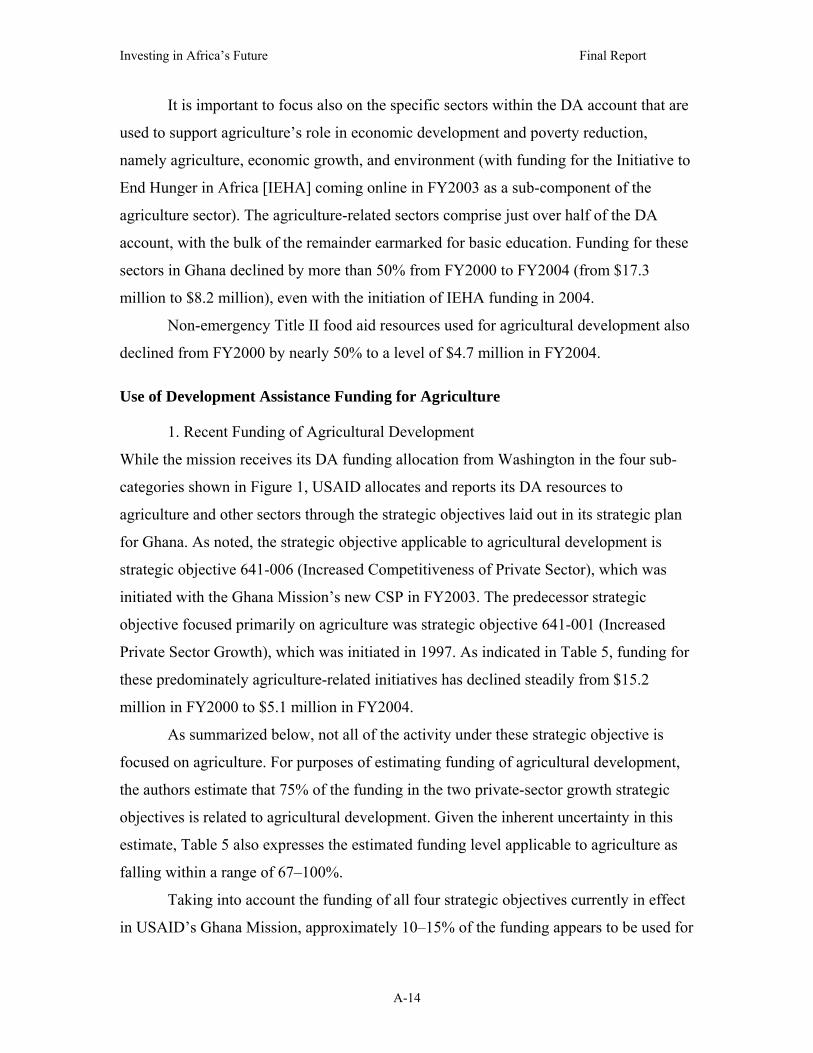
Investing in Africa’s Future Final Report
A-14
It is important to focus also on the specific sectors within the DA account that are
used to support agriculture’s role in economic development and poverty reduction,
namely agriculture, economic growth, and environment (with funding for the Initiative to
End Hunger in Africa [IEHA] coming online in FY2003 as a sub-component of the
agriculture sector). The agriculture-related sectors comprise just over half of the DA
account, with the bulk of the remainder earmarked for basic education. Funding for these
sectors in Ghana declined by more than 50% from FY2000 to FY2004 (from $17.3
million to $8.2 million), even with the initiation of IEHA funding in 2004.
Non-emergency Title II food aid resources used for agricultural development also
declined from FY2000 by nearly 50% to a level of $4.7 million in FY2004.
Use of Development Assistance Funding for Agriculture
1. Recent Funding of Agricultural Development
While the mission receives its DA funding allocation from Washington in the four sub-
categories shown in Figure 1, USAID allocates and reports its DA resources to
agriculture and other sectors through the strategic objectives laid out in its strategic plan
for Ghana. As noted, the strategic objective applicable to agricultural development is
strategic objective 641-006 (Increased Competitiveness of Private Sector), which was
initiated with the Ghana Mission’s new CSP in FY2003. The predecessor strategic
objective focused primarily on agriculture was strategic objective 641-001 (Increased
Private Sector Growth), which was initiated in 1997. As indicated in Table 5, funding for
these predominately agriculture-related initiatives has declined steadily from $15.2
million in FY2000 to $5.1 million in FY2004.
As summarized below, not all of the activity under these strategic objective is
focused on agriculture. For purposes of estimating funding of agricultural development,
the authors estimate that 75% of the funding in the two private-sector growth strategic
objectives is related to agricultural development. Given the inherent uncertainty in this
estimate, Table 5 also expresses the estimated funding level applicable to agriculture as
falling within a range of 67–100%.
Taking into account the funding of all four strategic objectives currently in effect
in USAID’s Ghana Mission, approximately 10–15% of the funding appears to be used for
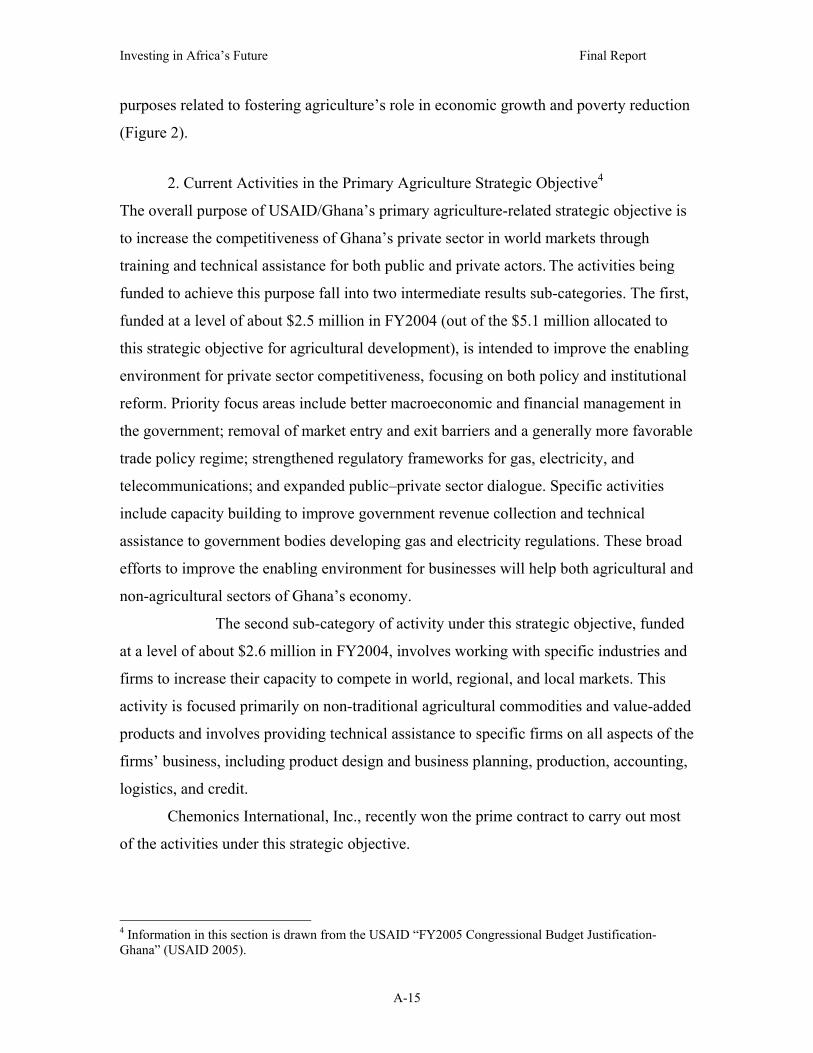
Investing in Africa’s Future Final Report
A-15
purposes related to fostering agriculture’s role in economic growth and poverty reduction
(Figure 2).
2. Current Activities in the Primary Agriculture Strategic Objective4
The overall purpose of USAID/Ghana’s primary agriculture-related strategic objective is
to increase the competitiveness of Ghana’s private sector in world markets through
training and technical assistance for both public and private actors. The activities being
funded to achieve this purpose fall into two intermediate results sub-categories. The first,
funded at a level of about $2.5 million in FY2004 (out of the $5.1 million allocated to
this strategic objective for agricultural development), is intended to improve the enabling
environment for private sector competitiveness, focusing on both policy and institutional
reform. Priority focus areas include better macroeconomic and financial management in
the government; removal of market entry and exit barriers and a generally more favorable
trade policy regime; strengthened regulatory frameworks for gas, electricity, and
telecommunications; and expanded public–private sector dialogue. Specific activities
include capacity building to improve government revenue collection and technical
assistance to government bodies developing gas and electricity regulations. These broad
efforts to improve the enabling environment for businesses will help both agricultural and
non-agricultural sectors of Ghana’s economy.
The second sub-category of activity under this strategic objective, funded
at a level of about $2.6 million in FY2004, involves working with specific industries and
firms to increase their capacity to compete in world, regional, and local markets. This
activity is focused primarily on non-traditional agricultural commodities and value-added
products and involves providing technical assistance to specific firms on all aspects of the
firms’ business, including product design and business planning, production, accounting,
logistics, and credit.
Chemonics International, Inc., recently won the prime contract to carry out most
of the activities under this strategic objective.
4 Information in this section is drawn from the USAID “FY2005 Congressional Budget Justification-Ghana” (USAID 2005).

Investing in Africa’s Future Final Report
A-16
Use of PL 480 Title II Food Aid Resources for Agricultural Development
A significant portion of the overall U.S. investment in agricultural development in Ghana
is financed through development (non-emergency) food aid from USAID and USDA,
which is normally channeled through private voluntary organizations working in the
country as Title II cooperating sponsors (CSs). These organizations use the proceeds
from the sale (monetization) of the commodities to carry out their projects involving
agriculture, health, education, and other needs. Determining the dollar amount of the food
aid resource that is applied to agriculture requires considering both USAID and USDA
non-emergency food aid flows through USAID’s Title II program (Food for Peace) and
USDA’s 416(b) and Food for Progress programs; related cash assistance to the private
voluntary organizations through section 202(e) of PL 480; and estimates of the
percentage of each private voluntary organization’s program that is devoted to
agricultural development5 (Table 6).
The USAID-managed Title II food aid is discussed in this section. The USDA
food aid program is discussed in the next section.
1. Funding
During the period 2000–2004, the value of USAID’s Title II non-emergency food
aid shipments to Ghana averaged $16.7 million annually, including freight costs from the
United States (Table 6). Excluding freight costs, the value of the commodities themselves
averaged $11.1 million. Total payments under section 202(e) to all CSs working in
Ghana averaged $374,000 per year, with payments being made to one or more of these
organizations in three of the five years. The estimated percentage of each CS’s activity
that was devoted to agriculture varies from zero to 100%. Based on USAID’s reported
estimates, the percentages of overall Title II non-emergency food aid used for agriculture
in Ghana varied from 11% in FY2002 to 59% in FY2001, with the average percentage of
agriculture use over the entire five-year period being 34%.
Thus, if freight costs are included, Title II food aid-financed agricultural
assistance for Ghana from FY2000 through FY2004, including 202(e) payments,

Investing in Africa’s Future Final Report
A-17
averaged $6.1 million annually, with the levels fluctuating between $11 million in
FY2001 and $1.3 million in FY2002. The trend, however, is strongly downward, with the
FY2004 value of $4.6 million being 49% lower than the FY2000 level. If freight costs are
excluded, agricultural assistance financed by Title II food aid averaged $4.1 million
annually.
2. Title II-Funded Development Activities
Catholic Relief Services manages the largest volume of non-emergency Title II food aid
among CSs working in Ghana, but its primary focus has been education. The principal
organizations managing Title II-financed agricultural development projects in Ghana are
Adventist Development and Relief Agency International (ADRA) and Opportunities
Industrialization Centers International, Inc. (OICI), with ADRA having by far the largest
agriculture-related program (Bogart 2004).
Like USAID-managed food aid programs in general, the ADRA program is
focused on the goal of food security as called for by USAID’s 1995 food aid policy
statement (USAID/FFP 1995). Specifically, the ADRA program is built on two strategic
objectives: 1) increased agricultural productivity and income for 20,000 resource-poor
farmer households and their dependents in targeted areas; and 2) increased access by
300,000 rural dwellers in the targeted communities to health and nutrition education,
sanitation facilities, and year-round adequate and safe water (ADRA 2001). Both of these
objectives target food-insecure households new to ADRA programs as well as individuals
who engaged actively and successfully in previous ADRA Development Activity
Programs.
The intermediate results sought under the agriculture-related strategic objective
include increased sustainable agricultural production through increased access to farm
inputs, enhanced soil fertility, and increased community reforestation and conservation,
as well as increased agricultural incomes as a result of reduced post-harvest loss,
increased product value-added, and better access to and utilization of markets and market
information (a key element of which is rural road development) (ADRA 2001).
5 The development food aid reported here does not include USAID or USDA food aid contributions to the U.N.’ World Food Programme, which are used predominately for emergency feeding, or the USDA contributions for the Food for Education program.

Investing in Africa’s Future Final Report
A-18
Diversification, technical information transfer, and market competitiveness are three key
elements of the ADRA strategic objective for agricultural productivity and farmer
incomes. This strategic objective reflects the goals of both Ghana’s GPRS and the
USAID Mission to increase agricultural production; improve market access, information,
and competitiveness; and bolster the private sector’s role in achieving those goals. The
strategic objective has consumed about three-quarters of ADRA’s non-emergency Title II
resources in Ghana over the past five years (ADRA 2001).
ADRA works closely with OICI, the other major implementer of Title II-financed
agriculture projects in Ghana. OICI projects include training initiatives related to post-
harvest processing and storage, pump, and well development and maintenance and
sanitation in the northern region of the country (OICI 1998). Other activities included in
the OICI Development Activity Program, entitled “Food Security Training and Outreach
Services Initiative,” include training farmers in marketing and basic business
management skills and training women in practices such as beekeeping, pottery,
agroforestry, and cassava production and processing. About two-thirds of OICI’s Title II
development work in Ghana is agriculture related (OICI 1998).
USDA’s Agricultural Development Activities in Ghana
Non-Food Aid Activities
As discussed in Chapter Two, USDA has no appropriation specifically for agricultural
development assistance in Africa, but USDA employees provide technical assistance and
manage programs that are funded by USAID through the International Cooperation and
Development (ICD) program in USDA’s Foreign Agricultural Service. Ten USDA
agricultural advisors are on reimbursable details at USAID working on the Presidential
Initiative to End Hunger in Africa.
In addition, USDA funds occasional projects that relate to agricultural
development in specific African countries, amounting to about $1 million annually across
the continent, through ICD’s Food Industry Division and Scientific Cooperation Research
Program (Brown 2005). Projects of this kind that have had some connection with Ghana
include the Cochran Fellowship Program, which through the end of FY2003 has given a

Investing in Africa’s Future Final Report
A-19
total of 33 Ghanaian scientists 2 to 6 weeks of agricultural training in the United States.
USDA also has provided technical assistance to Ghanaian efforts to build leadership
capacity for agricultural cooperatives and to meet the food safety standards of U.S. and
European importers.
Food Aid for Agricultural Development Purposes
In resource terms, USDA’s largest contribution to agricultural development in Africa
comes through its management of food aid programs, including the Food for Progress and
the 416 (b) programs.
1. Funding
USDA’s 416(b) and Food for Progress shipments of development food aid are generally
on a smaller scale than the values associated with USAID’s Title II Food for Peace
Program and, in the case of Ghana, were made sporadically during the period FY2000–
2004 (Table 6). Section 416(b) contributed to Ghana in only one of those years (FY2002)
and Food for Progress in two of those years (FY2000 and FY2003) for a combined
average of $1.44 million per year including the estimated cost of freight.
It is important to note that in contrast to USAID, USDA’s tables reporting the
values of its Food for Progress and 416(b) commodity allocations do not include the cost
of freight. Freight costs normally comprise about one-third of the total value of a food aid
shipment. Thus, as reflected in Table 6 the estimated freight-inclusive value of the USDA
food aid allocations is about 50% greater than the values reported in the USDA food aid
tables. Excluding freight, USDA shipments of 416 (b) and Food for Progress food aid
averaged $960,000 annually over the five-year period.
As a general rule, Food for Progress resources are used for agriculture-related
projects, while 416 (b) resources are used for a range of purposes, including agriculture,
education, HIV/AIDS, and other health purposes (Rubas 2005). USDA does not provide
project-by-project estimates of the percentage of food aid resources that is devoted to
agriculture or other purposes. The working assumption for purposes of this report is that
100% of Food for Progress resources and 50% of 416(b) resources are used for
agricultural purposes.

Investing in Africa’s Future Final Report
A-20
On this basis, the USDA-managed food aid resources made available in Ghana for
agricultural development purposes in the FY2001–2004 period averaged $1.1 million per
year with freight costs included and $732,000 without freight costs included (Table 6).
The USDA allocations are too irregular to reveal a clear trend, but the donations
to Ghana were at their largest in FY2000 and FY2002 and were zero in FY2004.
2. Activities
The uses of USDA-managed food aid in Ghana during 2000–2004 included projects to
improve on-farm productivity and employment, rural microfinance, and market
development, as well as to promote HIV/AIDS prevention and education in rural
communities.
Other United States Agencies
The ADF and the TDA have only limited agriculture-related activities underway in
Ghana.
African Development Foundation
The ADF approved ten projects in Ghana in 2002 and 2003, three of which related to
agricultural development according to the 2002–2003 ADF annual report, which is the
most current source of readily available information on ADF activities (ADF 2003).
Funding for these three projects, all of which are ongoing, totals approximately $580,200
and supports: 1) a program to increase the production capacity, revenues, employee
annual incomes, and dividends of a vegetable processing enterprise; 2) a project to
increase the revenues and production of a 60-member fish processors and marketers
cooperative; and 3) a Ghanaian non-governmental organization to provide credit and
business development services to first-time borrowers and to expand income generating
activities such as shea butter processing, oil extraction, rice processing, and petty trading.

Investing in Africa’s Future Final Report
A-21
Trade and Development Agency
Twenty-one TDA projects are reported in Ghana during the FY2000–FY2004 period
(OECD n.d.; USTDA 2004). None of the projects funded by TDA in Ghana in FY2000
(two projects totaling $471,000), FY2001 (four projects totaling $413,000), or FY2004
(three projects totaling $7,500) were related to agricultural development. However, one
of TDA’s seven projects in FY2002 (totaling $645,000) was a biomass power desk study
funded at $3,000. Two of the agency’s five projects in FY2003 (totaling $529,000) were
also on biomass power generation and included a feasibility study ($246,000) and a desk
study ($3,000).
Trends in Bilateral U.S. Agricultural Development Assistance in Ghana
The great majority of U.S. agricultural development assistance for Ghana is funded
through the USAID Development Assistance account or through the USAID and USDA
food aid programs, as presented in Table 7. Total funding through these vehicles has
fluctuated over the five-year period FY2000–2004 within the range of $23.8 million to
$8.4 million, with the changes year-to-year affected by variation in both DA and food aid
funding levels. Overall, the level of bilateral U.S. assistance for agricultural development
in Ghana is substantially lower in FY2004 than it was in FY2000.

Investing in Africa’s Future Final Report
A-22
Notes: CSH=Child Survival and Health, AG=Agriculture, EG=Economic Growth, ENV=Environment, Ed=Education, DA=Development Assistance, Agr=Agriculture, Non-Agr=Non-agriculture, ESF=Economic Support Fund, IEHA=Initiative to End Hunger in Africa
Figure 1. USAID Non-Emergency Assistance to Ghana, FY2000–FY2004:
Allocation of Appropriated Program Funds by Account and Sector
0
5,000
10,000
15,000
20,000
25,000
FY 2000 FY 2001 FY 2002 FY 2003 FY 2004Year
US
Dol
lars
(000
's)
CSH
DA
Title II
ESF
DA
DA
DA
DA
CSH
CSHCSH
CSHTitle II
Title II
Title II
Title II
ESF
AG
EG
EN
VIE
HA
Ed
/ Oth
er
Ed
/ Oth
er
Ed
/ Oth
er
Ed
/ Oth
er
Ed
/ Oth
erE
NV
EN
V
EN
V
EN
V
EG
EG
EG EG
AGAG
AG
AG
AgrAgr
Agr
Agr
AgrNo ESF No ESFNo ESF
Non
-Agr
Non
-AgrN
on-A
gr
Non
-Agr
Non
-Agr
Total Funds ($000's) 58,27357,127 46,633 59,999 49,350
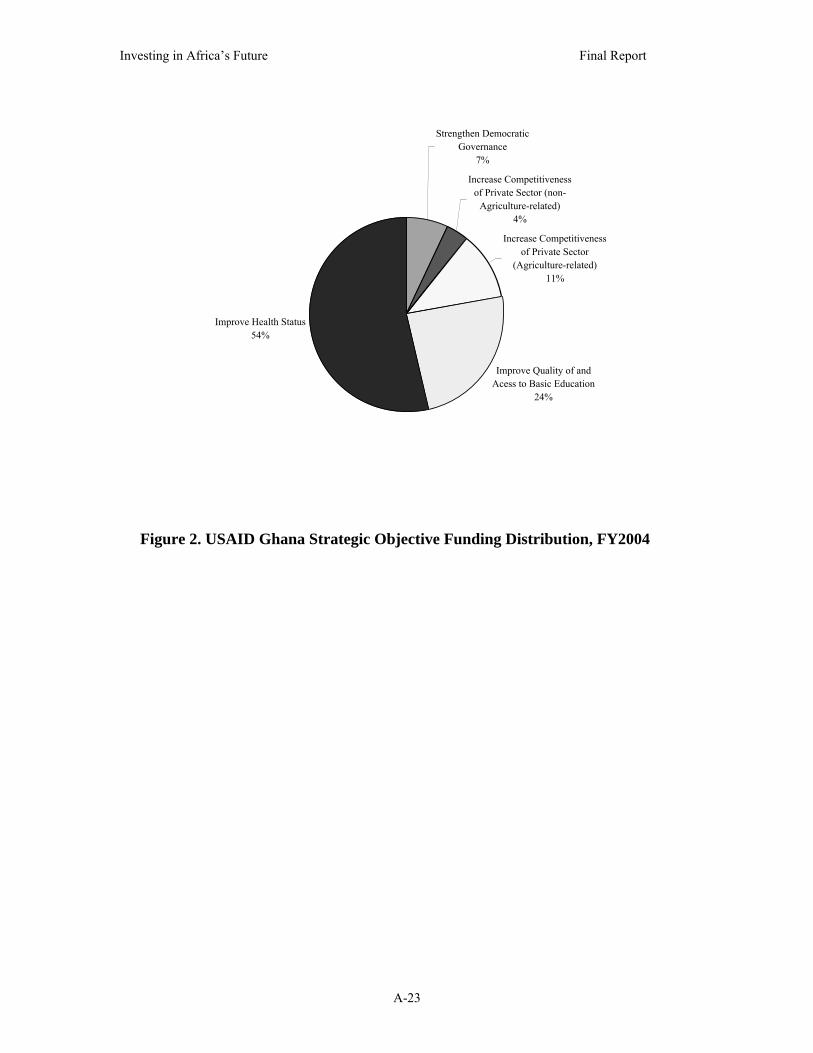
Investing in Africa’s Future Final Report
A-23
Strengthen Democratic Governance
7%
Increase Competitiveness of Private Sector (non-
Agriculture-related)4%
Increase Competitiveness of Private Sector
(Agriculture-related)11%
Improve Quality of and Acess to Basic Education
24%
Improve Health Status54%
Figure 2. USAID Ghana Strategic Objective Funding Distribution, FY2004
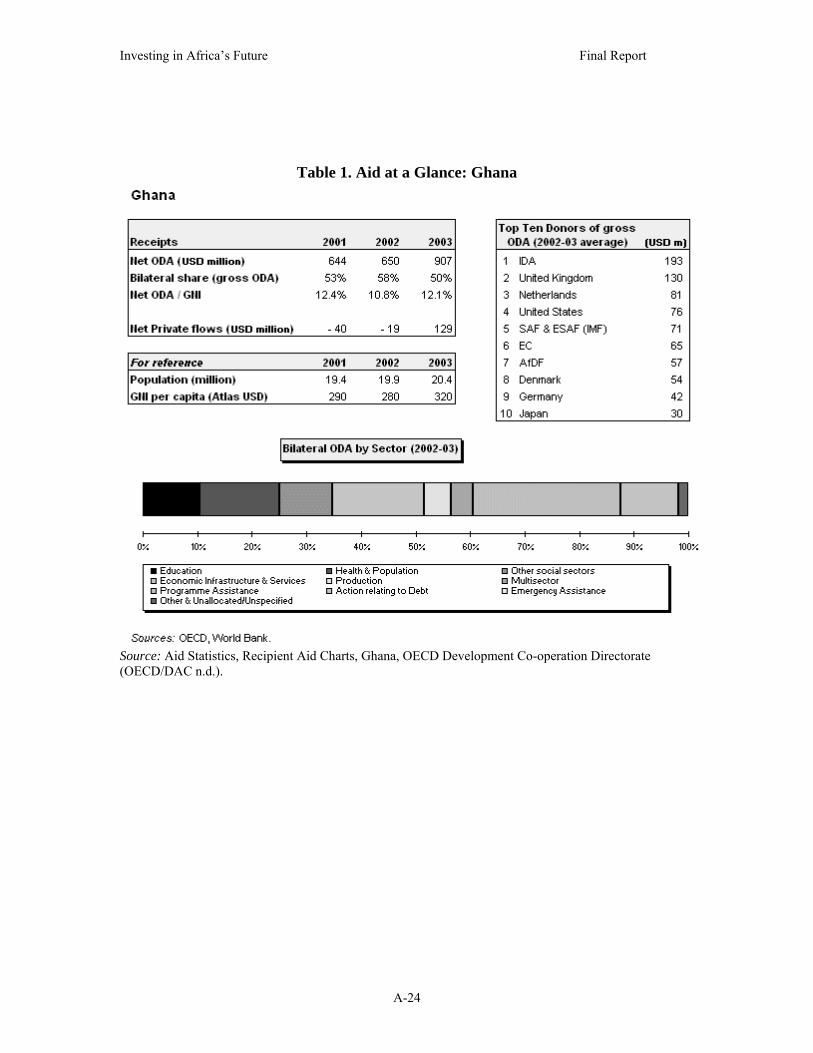
Investing in Africa’s Future Final Report
A-24
Table 1. Aid at a Glance: Ghana
Source: Aid Statistics, Recipient Aid Charts, Ghana, OECD Development Co-operation Directorate (OECD/DAC n.d.).

Investing in Africa’s Future Final Report
A-25
Table 2. OECD Agriculture-related Assistance to Ghanaa as Reported to the OECD/CRS from all OECD Countries Combined, 2000–2003b (U.S. contributions in parentheses)
Sector ($, thousands)
Year Core
Agriculturec Forestry & Fisheriesd
Rural Developmente
Road Transportf
Trade Policy &
Facilitationg Development
Food Aidh All Other Aid Total 2000 18,165 (7,000) 16,358 (1,660) 834 15 101 26,112 (23,470) 345,172 (33,196) 406,757 (65,326) 2001 16,476 (3,775) 15,252 (764) 9,810 12,240 355 21,467 (19,162) 241,763 (38,204) 317,363 (61,905) 2002 5,987 (130) 314 38 975 10,186 23,628 (18,356) 337,396 (38,110) 378,524 (56,596) 2003 17,770 (249) 8,765 (26) 705 118,598 1,705 (99) 27,121 (26,946) 587,548 (52,084) 762,212 (79,404) Total 58,399 (11,154) 40,689 (2,450) 11,386 131,827 12,346 (99) 98,327 (87,934) 1,511,879 (161,594)1,864,855 (263,231) Notes: aRecipients included in our definition of sub-Saharan Africa (SSA) include individual SSA countries, “South of Sahara Unallocated,” and “Africa Unspecified.” bAll years (2000–2003) refer to calendar years. cCore Agriculture includes all purpose codes beginning with 311 (Agriculture) and purpose codes 32165 (Fertilizer Plants), 32267 (Fertilizer Minerals), 23070 (Biomass), and 32161 (Agro-Industries). dForestry & Fisheries includes all purpose codes beginning with 312 (Forestry) and 313 (Fisheries) along with purpose code 32162 (Forest Industries). eRural Development includes purpose code 43040 (Rural Development). 6Road Transport includes purpose code 21020 (Road Transport). fTrade Policy & Facilitation includes all purpose codes beginning with 331 (Trade). gDevelopment Food Aid includes purpose codes 52000 (Development Food Aid/Food Security Assistance) and 52010 (Food Security Programmes/Food Aid). Source: OECD CRS Online Database on Aid Activities (OECD n.d.).

Investing in Africa’s Future Final Report
A-26
Table 3. World Bank Active Agriculture-related Projects in Ghana
Notes: Unless otherwise noted, World Bank funding for the projects listed above is in the form of International Development Association loans. Projects noted with a * indicate World Bank funding in the form of grants. Agriculture-related funding amounts were calculated by multiplying the total World Bank funding amounts by the percentage of the project related to agriculture as listed by the World Bank. Source: World Bank Ghana: Active Projects (World Bank 2005).
Funding ($, millions)
Project Name Agriculture-
related Total Project Description Agricultural Services Subsector Investment Project 67.0 67.0 Agricultural technology and education; Ministry of Food and Agriculture and
farmer-based organization capacity building and reform. Northern Savanna Biodiversity Conservation Project
7.0* 7.9* Harvesting policy, biodiversity management, and land management; project management, monitoring and evaluation.
GH-GEF Forest Biodiversity SIL (FY98) 8.9* 8.9* No additional information available.
Community-Based Rural development 36.0 60.0 Institutional and natural resource management capacity building, rural
infrastructure development, and rural and microenterprise development. GH-Community-Based Integrated Natural Resources Management
0.9* 0.9* Combining traditional Okyeman and modern natural resource management and biodiversity conservation concepts to address deforestation, water pollution, and wildlife over-harvesting.
SAC II 0.7 5.7 No additional information available. SAC II 1.0 8.3 No additional information available. Land Administration Project 3.7 20.5 Land tenure and land market reform. Total 125.2 179.2

Investing in Africa’s Future Final Report
A-27
Table 4. USAID Appropriation of Program Funds for Ghana, FY2000–FY2004
Appropriation ($, thousands)
Account FY2000 Actual
FY2001 Actual
FY2002 Actual
FY2003 Actual
FY2004 Actual
FY2005 Requested
Development Assistance Total 22,381 19,858 15,963 20,716 14,879 11,500 Agriculture 7,000 3,775 3,671 3,375 1,872 Economic Growth 8,620 5,264 2,300 3,208 2,049 Environment 1,660 2,064 1,690 2,471 1,250 IEHA 0 0 0 0 3,000 Child Survival & Health 15,220 15,419 18,655 19,150 18,620 18,560Economic Support Fund 0 4,500 0 530 0 0Total PL 480 Title II Non-Emergency 19,526 18,496 12,015 19,603 15,851
Non-Emergency Agricultural Use 8,962 10,995 1,325 4,865 4,654
Non-Emergency Non-Agricultural Use 10,564 7,500 10,690 14,738 11,197
TOTAL NON-EMERGENCY PROGRAM FUNDS 57,127 58,273 46,633 59,999 49,350 30,060
Total PL 480 Title II (Emergency + Development) 20,879 18,027 12,407 20,345 14,177 17,189
TOTAL PROGRAM FUNDS 58,480 57,804 47,025 60,741 47,676 47,429Notes: IEHA=Initiative to End Hunger in Africa Source: USAID Congressional Budget Justifications (USAID various years) and personal communication with Fenton B. Sands, Chief, Economic Growth, Environment & Agriculture Division, Office of Sustainable Development, Bureau for Africa, USAID (Sands 2005).

Investing in Africa’s Future Final Report
A-28
Table 5. USAID Agriculture-related Strategic Objectives and Funding Levels, Ghana, FY2000–FY2004
Source: Authors’ calculations, with data from USAID Congressional Budget Justifications-Ghana (USAID various years).
Funding ($, thousands)
Title Former Title % related to Agriculture FY2000 FY2001 FY2002 FY2003 FY2004
Total, FY2000– FY2004
641-001 Economic Growth 641-001 Increased Private Sector Growth
75(67-100)
11,385(10,171-15,180)
8,327(7,439-11,103)
5,746(5,133-7,661)
1,650(1,474-2,200)
0(0)
27,108(24,217-36,144)
641-006 Increase Competitiveness of Private Sector
75(67-100)
0 (0)
0(0)
0(0)
4,598(4,107-6,130)
3,817(3,410-5,089)
8,415(7,517-11,219)
Total 11,385(10,171-15,180)
8,327(7,439-11,103)
5,746(5,133-7,661)
6,248(5,581-8,330)
3,817(3,410-5,089)
35,523(31,734-47,363)

Investing in Africa’s Future Final Report
A-29
Table 6. U.S. Non-Emergency Food Aid Estimated Value Applied for Agricultural Development Purposes, Ghana, FY2000–FY2004
Notes: * Calculated based on the assumption that freight costs consume one-third of the total value. ** Calculated based on estimates in USAID annual reports on non-emergency food aid of the percentages of each cooperating sponsor program in Ghana that is devoted to agricultural development. Source: USAID Office of Food for Peace Annual Reports, FY2000–FY2004 (USAID/FFP various years) and the USDA/Foreign Agricultural Service web site (USDA/FAS n.d.).
Funding ($, thousands)
Allocation FY2000 FY2001 FY2002 FY2003 FY2004 Average Increase, FY2000– FY2004 (%)
USAID Title II Value With Freight 19,094 17,904 12,015 18,757 15,851 16,724 -17%
Title II Value w/o Freight* 12,717 11,937 8,009 12,503 10,566 11,146 -17%
202(e) Payment 432 592 0 846 0 374 --------USAID Total With Freight 19,526 18,496 12,015 19,603 15,851 17,098 -19%
USAID Total w/o Freight 13,149 12,529 8,009 13,349 10,566 11,520 -20%
% Used for Agriculture** 46% 59% 11% 25% 29% 34% -22%
Total USAID Agriculture Value With Freight
8,982 10,913 1,322 4,901 4,597 6,143 -49%
Total USAID Agriculture Value w/o Freight
6.049 7,392 881 3,337 3,064 4,145 -49%
USDA 416(b) Value With Freight 0 0 3,417 0 0 683 --------
416(b) Value w/o Freight 0 0 2,278 0 0 456 --------
Food for Progress Value w/ Freight* 3,423 0 0 362 0 757 --------
Food for Progress Value w/o Freight 2,282 0 0 241 0 505 --------
Total USDA Agriculture Value With Freight*
3,423 0 1,709 362 0 1,099 --------
Total USDA Agriculture Value w/o Freight
2,282 0 1,139 241 0 732 --------
TOTAL U.S. Agr. Value With Freight
12,405 10,913 3,031 5,263 4,597 7,242 -63%
TOTAL U.S. Agr. Value w/o Freight
8,331 7,392 2,020 3,578 3,064 4,877 -63%
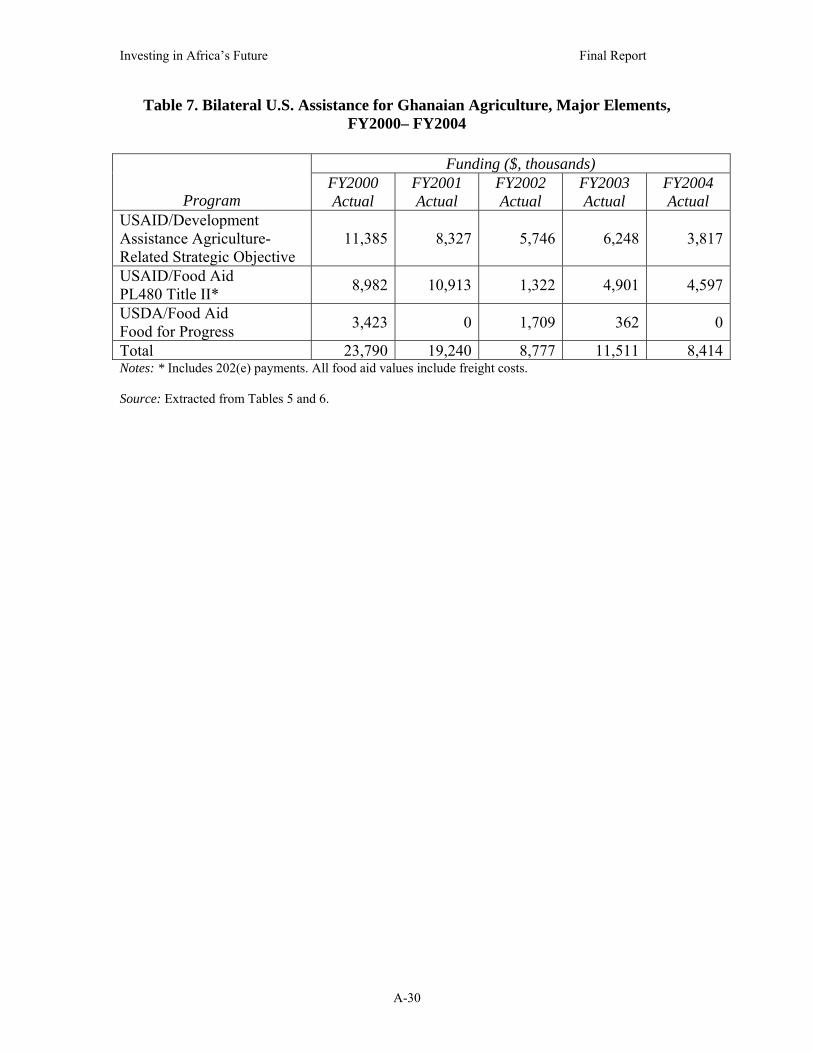
Investing in Africa’s Future Final Report
A-30
Table 7. Bilateral U.S. Assistance for Ghanaian Agriculture, Major Elements, FY2000– FY2004
Funding ($, thousands)
Program FY2000 Actual
FY2001 Actual
FY2002 Actual
FY2003 Actual
FY2004 Actual
USAID/Development Assistance Agriculture-Related Strategic Objective
11,385 8,327 5,746 6,248 3,817
USAID/Food Aid PL480 Title II* 8,982 10,913 1,322 4,901 4,597
USDA/Food Aid Food for Progress 3,423 0 1,709 362 0
Total 23,790 19,240 8,777 11,511 8,414Notes: * Includes 202(e) payments. All food aid values include freight costs. Source: Extracted from Tables 5 and 6.

Investing in Africa’s Future Final Report
A-31
References
ADBG (African Development Bank Group). 2005. Summary of Operations for the
Republic of Ghana. http://www.afdb.org/en/country_operations/african_
countries/ghana (accessed February 13, 2005).
ADF (African Development Foundation). 2003. Innovative Investments in Africa’s
Future: ADF Funded Projects Fiscal Years 2002–2003. http://www.adf.gov/
ADF200203report.pdf (accessed April 2, 2005).
ADRA (Adventist Development and Relief Agency International). 2001. FY2002-2006
Development Activity Program Proposal.
Asuming-Brempong, Sam. 2005. Personal communication with Sam Asuming-
Brempong, Senior Lecturer, Department of Agricultural Economics and
Agribusiness, University of Ghana, to the authors, July 28.
Bogart, Brian J. 2004. Personal communication from Brian J. Bogart, Results and
Information Reporting, USAID/FFP/AMEX International, to Michael Taylor,
Nov. 12.
Brown, Jocelyn. 2005. Personal communication from Jocelyn Brown, assistant deputy
administrator, ICD/FAS/USDA, to the authors, Feb. 4.
FAO (Food and Agriculture Organization of the United Nations). 2004. The State of
Food Security in the World, 2004. Available from http://www.fao.org/
documents/show_cdr.asp?url_file=/docrep/007/y5650e/y5650e00.htm (accessed
June 20, 2005).
FAO (Food and Agriculture Organization of the United Nations). 2005. List of
Operationally Active projects for all Organizational Units in Ghana by funding
source. https://extranet.fao.org/fpmis/FPMISReportServlet.jsp?sel_country=
GH&div=&type=countryprofileopen&language=EN&countryId=GH (accessed
June 20, 2005).
Ghana (Government of the Republic of Ghana). 2003. Ghana: Poverty Reduction
Strategy Paper. http://www.imf.org/external/pubs/ft/scr/2003/cr0356.pdf
(accessed June 28, 2005).
IFAD (International Fund for Agricultural Development). 2005. Approved Projects for

Investing in Africa’s Future Final Report
A-32
Ghana. http://www.ifad.org/operations/projects/regions/PA/GH_all.htm (accessed
February 13, 2005).
MOFA (Republic of Ghana Ministry of Food and Agriculture). 2002. Food and
Agriculture Sector Development Policy.
NDPC (National Development Planning Commission). 2004. Ghana Poverty Reduction
Strategy 2003 Annual Progress Report. http://www.imf.org/external/pubs/ft/scr/
2004/cr04207.pdf (accessed June 28, 2005).
OECD (Organisation for Economic Co-operation and Development). n.d. CRS Online
Database on Aid Activities. Available from http//:www.oecd.org/dac/stats/
idsonline (accessed April 3, 2005).
OECD/DAC (Organisation for Economic Co-operation and Development-Development
Co-operation Directorate). n.d. Aid Statistics, Recipient Aid Charts, Ghana.
http://www.oecd.org/dataoecd/21/40/1881076.gif (accessed June 21, 2005).
OICI (Opportunities Industrialization Centers International, Inc.). 1998. Title II
Development Activity Proposal, Food Security Training and Outreach Services
Initiative, Ghana, FY1999–FY2003.
Rubas, Debbie. 2005. Personal communication from Debbie Rubas, Agricultural
Economist, Programming Division, Export Credits, FAS/USDA, to the authors,
February 3.
Sands, Fenton B. 2005. Personal communication from Fenton Sands, Chief, Economic
Growth, Environment & Agriculture Division, Bureau for Africa, USAID, to the
authors, February 8.
USAID (U.S. Agency for International Development). 2003. USAID/Ghana Country
Strategic Plan, 2004-2010. http://www.dec.org/pdf_docs/PDABY444.pdf
(accessed June 20, 2005).
USAID. 2005. FY2005 CongressionalBudget Justification–Ghana. http://www.usaid.gov/
policy/budget/cbj2005/afr/pdf/gh_cbj_fy05.pdf (accessed June 20, 2005).
USAID. Various years. Congressional Budget Justification - Ghana. Available from
http://www.usaid.gov/policy/budget/ (accessed March 30, 2005).
USAID/FFP (U.S. Agency for International Development/Office of Food for Peace).
1995. Food Aid and Food Security Policy Paper. Feb. 27. http://www.usaid.gov/

Investing in Africa’s Future Final Report
A-33
policy/ads/200/foodsec/foodsec.pdf (accessed March 25, 2005).
USAID/FFP. Various Years. Food for Peace Annual Reports, FY2000 to FY2004.
USDA/FAS (U.S. Department of Agriculture/Foreign Agricultural Service). n.d. Food
Aid Reports. Available from http://www.fas.usda.gov/excredits/FoodAid/Reports/
reports.html (accessed July 25, 2005).
U.S. Department of State. 2004. Background Note: Ghana. http://www.state.gov/r/
pa/ei/bgn/2860.htm (accessed on December 14, 2004).
USTDA (U.S. Trade and Development Agency). 2004. Annual Report. Available from
http://www.tda.gov/USTDA/About%20USTDA/eventspubs.htm (accessed March
30, 2005).
World Bank Group. 2000. Memorandum of the President of the International
Development Association and the International Finance Corporation to the
Executive Directors on a Country Assistance Strategy of the World Bank Group
for the Republic of Ghana.
http://wds.worldbank.org/servlet/WDSContentServer/WDSP/IB/2000/07/28/
000094946_00031605303272/Rendered/PDF/multi_page.pdf (accessed June 20,
2005).
World Bank Group. 2003. Ghana Country Brief. Available from http://web.worldbank.
org/WBSITE/EXTERNAL/COUNTRIES/AFRICAEXT/
GHANAEXTN/0,,menuPK:351960~pagePK:141132~piPK:141121~theSitePK:3
51952,00.html (accessed October 15, 2004).
World Bank Group. 2005. Ghana: Active Projects. http://web.worldbank.org/external/
default/main?menuPK=351984&pagePK=141155&piPK=141124&theSitePK=35
1952 (accessed May 25, 2005).

Investing in Africa’s Future Final Report
A-34
Appendix 4-B: U.S. Agricultural Development
Assistance in Mali
By Michael R. Taylor, Julie A. Howard, and Nicole M. Mason1
Overview of the Economy, Agriculture, and Food Security in Mali2
After forming the short-lived Mali Federation with Senegal in 1959, the former French
colony of Soudan withdrew from the French community and established itself as the
Republic of Mali in 1960. The post-independence government was led by President
Modibo Keita’s socialist Union Soudanaise du Rassemblement until a bloodless coup led
by Lt. Moussa Traoré in 1968. As president, Traoré approved a new constitution and
survived several coup attempts but resisted calls for greater democracy in Mali. An
uprising in 1991 removed Traoré and his military government from power and installed
the predominately civilian Transitional Committee for the Salvation of the People
(CTSP). Political parties were free to form under CTSP’s new constitution, and in less
than a year, Mali held presidential, national assembly, and municipal council elections.
Alpha Oumar Konaré, the victorious candidate of the Alliance for Democracy in Mali,
served the maximum of two terms as president, and in 2002, an independent, Amadou
Toumani Touré, was elected to office.
Despite gains in democratic governance under Konaré and Touré, Mali remains
one of the 10 poorest countries in the world, with a per capita gross domestic product
(GDP) of $250 (2002); Mali is ranked 174 out of 177 countries in the world according to
the United Nations Human Development Index (2004) (UNDP 2004). Only 31% of its
1 Michael R. Taylor is a Senior Fellow at Resources for the Future in Washington, DC. Julie A. Howard is Executive Director of the Partnership to Cut Hunger & Poverty in Africa in Washington, DC. Nicole M. Mason is a graduate student in the Department of Agricultural Economics at Michigan State University. Bakary Kanté served as a consultant for this report. The authors acknowledge him for his contributions to their substantive understanding of the issues related to U.S. agricultural development assistance in Mali and for facilitating their meetings with a broad cross section of government actors and private-sector stakeholders. 2 Information in this section is drawn from the U.S. Department of State’s “Background Note: Mali” unless otherwise noted (U.S. Department of State 2004).
Investing in Africa’s Future Final Report
A-35
population of 10.5 million is literate. The infant mortality rate (121/1,000) and life
expectancy rate (47 years) are high and low, respectively; AIDS prevalence, however, is
quite low at 1.7% (Mali 2002). Nearly two-thirds of the population lives in poverty, with
21% of the total population living in extreme poverty (Mali 2002).
Much of the country’s potential to mitigate such poverty lies in Mali’s significant
agricultural and mining resources. Indeed, 80–90% of total Malian export earnings in
2003 ($1.06 billion) came from cotton, gold, and livestock. Mali’s economy has proved
to be resilient in the early years of the twenty-first century as real GDP growth rates
increased from 3.5% in 2001 to almost 6% in 2003 despite rising oil prices, reduced
prices for gold and cotton on the international market, and a temporary closure of its main
trade route to the port of Abidjan. Much of this economic growth can be attributed to a
two-fold increase in cotton production as well as to ramped up gold and cereals output.
Seventy percent of the Malian work force is engaged in agriculture, which,
combined with livestock and fisheries, accounts for 36% of GDP. Most land under
cultivation (90%) is used for smallholder, subsistence farming of cereals, predominately
sorghum, millet, and maize. Nonetheless, Mali does have a substantial cash crop export
market for peanuts, cotton, and cotton products. Further expansion of industrial and
export-oriented agriculture has been constrained by drought, poor infrastructure and
access to ports, inadequate training and finance, and mediocre functioning of agricultural
services and producer organizations (Mali 2002).
The mining and industrial sectors in Mali are expanding but currently engage just
15% of the workforce; nevertheless, food processing, textiles, cigarettes, metalworking,
light manufacturing, plastics, and beverage bottling contribute 22% of GDP, and in 2002,
gold supplanted cotton and livestock as Mali’s primary export.
Hunger is widespread in Mali. In the years 2000–2002, the Food and Agriculture
Organization of the United Nations (FAO) estimates that 29% of Malians were
undernourished, meaning their basic food energy needs were not being met (FAO 2004).3
This number is back to the 1990–1992 undernourishment level after a slight increase to 3 The term “undernourishment” refers only to the failure to meet dietary energy needs and not to the problem of malnutrition, which includes the failure to consume the micronutrients, protein, and other dietary components needed for good health. Nevertheless, FAO uses undernourishment interchangeably

Investing in Africa’s Future Final Report
A-36
32% in the period of 1995–1997. These figures place Mali in the FAO’s second highest
undernourishment category (20–34% undernourished); the only West African countries
to fall into a worse undernourishment category are war-torn Sierra Leone and Liberia
(FAO 2004). Large food security stocks have helped to prevent undernourishment from
deepening in Mali, particularly during food deficits, as in 2002.
Mali’s Governance Structure for Agricultural Development
The Republic of Mali is governed under a constitution adopted by popular referendum in
1992 that provides for a multi-party democracy. The president, who serves as chief of
state and commander-in-chief of the armed forces, is popularly elected for a five-year
term, with a two-term limit. The president appoints a prime minister, who serves as head
of government. The president also chairs the Council of Ministers, which proposes laws
for adoption by the National Assembly. The government operates administratively
through eight regions, which are divided into five to nine districts each (for a total of 48
districts) plus the capital district of Bamako. Each region has an appointed governor who
oversees the activities of the central government ministries within the region.
The National Assembly holds all legislative power in Mali. Representation is
apportioned at the district level based on population. The National Assembly’s 147
members are elected for five-year terms by party slate, with the party winning a majority
of the votes being awarded all of the district’s seats. Currently, 16 parties are represented
in the National Assembly.
Below the district level are 703 local government units that elect a mayor and a
Commune Council. These local governments do not have taxing or legislative power but
represent local interests and work with the central government ministries on local
development issues. A process of decentralization is underway that is intended to reduce
central government administrative control and increase local control over finances.
The key ministries for purposes of agriculture and rural development include the
Ministry of Agriculture, Ministry of Health, Ministry of Economy and Finance, Ministry with “food insecurity,” which FAO defines as the condition in which people in a society lack physical and economic access to the safe and nutritious food they need to thrive (FAO 2004).

Investing in Africa’s Future Final Report
A-37
of Planning and National Development, Ministry of Infrastructure and Transportation,
and Ministry of Industry and Commerce. The Mali Poverty Reduction Strategy Paper
(PRSP) (Mali 2002), which is the “sole reference framework” for development policies
and strategies in Mali, was adopted by the Council of Ministers in May 2002 following a
broadly participatory process that included in the deliberations not only the key ministries
at the national level but also regional representatives, civil society stakeholders, and
external development partners. The PRSP also was adopted by the National Assembly.
While the PRSP gained wide buy-in from the groups that participated in its formulation,
the document itself acknowledges candidly that public dialogue is still being established
as a method of managing public affairs and that the dialogue on the PRSP did not reach
the poor in a sustained way.
The Role of Agriculture in Mali’s Development Strategy
Mali’s PRSP outlines the country’s development strategy and is drawn from Mali 2025:
National Perspective Study and the National Strategy for Poverty Reduction (Mali 2002).
The basis of the strategy is the recognition that “no overall strategy can succeed without a
favorable macroeconomic framework that promotes growth” (Mali 2002, 36).
Accelerated and redistributive growth is considered a prerequisite for the success of the
overall strategy and macroeconomic reforms are intended to promote sustainable growth,
reduce poverty, improve living conditions, and strengthen financial viability (Mali 2002,
40).
Building on this solid macroeconomic foundation, the Mali PRSP focuses on
three priority areas or “strategic pillars” to promote “strong and sustainable growth that is
poverty reducing” (Mali 2002, 85). They are:
• Institutional development and improved governance and participation;
• Human development and strengthening the access to basic social services; and
• Development of infrastructure and support for key productive sectors (Mali 2002).
The third pillar, which is focused on economic development, emphasizes “a plan
for balanced regional development and a policy of suitable infrastructure,” “a new vision
Investing in Africa’s Future Final Report
A-38
for rural development and a multidimensional approach to food and nutrition security,”
and “a new commercial policy and an integrated framework for development of the
private sector and key competitive product sectors” (Mali 2002, 3). Although the Mali
PRSP does not include a specific or separate agricultural strategy per se, agricultural
priorities are central to the rural development component of the third pillar and are also
important in the new commercial policy and integrated framework portion of this pillar.
Rural development and food security policies focus on “inputs, agricultural
equipment, land security, non-farm revenue-generating processes, crisis-prevention
measures, programs for emergency actions and education, health and environmental
measures” (Mali 2002, 3). The main objective of these policies is to improve the living
conditions of impoverished Malians in the context of sustainable development,
specifically by improving food security through increased production and productivity.
Mali has committed to applying 12.9% of its Heavily Indebted Poor Country Initiative
debt relief funds to rural development and natural resource management, including
agricultural development (Mali 2002).
Agricultural investment is central to both the national poverty reduction strategy
and the strategies for each of the eight outlying regions of Mali (i.e., excluding the capital
region of Bamako), with the specific focus of agricultural investment depending on each
region’s strengths and potential. In the Segou region, for example, the PRSP recommends
exploitation of the rice sector, intensification of vegetable cultivation, and the promotion
and processing of local agricultural products such as calabash, cotton, and cattle. By
contrast in the region of Mopti, the greatest potential for poverty reduction lies in the
development of the fishing, market gardening, irrigated farming, and livestock-meat
sectors (Mali 2002).
At the national level, the rural development strategy for the primary sector is
centered on:
• Food security, including cereal price and market liberalization, increased agricultural
production and diversification to mitigate vulnerability to climatic variability,
decreased regional inequalities, linking producers to markets and improving access to
cereals in areas with food deficits and by vulnerable social groups, protection of
purchasing power, and elimination of malnutrition.

Investing in Africa’s Future Final Report
A-39
• Restoration and maintenance of soil fertility through research and extension,
improved structures for management and support, and the integration of agriculture
and livestock into soil management.
• Development of hydro-agricultural facilities, including an irrigation research program
and capacity building of producers to manage hydro-agricultural facilities through
improved land titling and water resource accessibility.
• Development of agricultural, animal, forestry, and fisheries production, particularly
that which affects the poorest portions of the population, promotes value-added
processing, and contributes to sub-regional trade.
• Development of support functions, such as research, popularization/support and
advice, training, communication, agricultural financing, agricultural credit, and
promoting the role of women and children and disadvantaged groups (Mali 2002).
Particular emphasis is placed on the cotton sector in the rural development strategy given
the sector’s important contribution to the Malian economy.
Development of the agricultural and animal products trade portion of the tertiary
sector centers on increasing value-added products through improved transport,
communications, and processing infrastructure as well as enhanced knowledge of
markets. These developments are intended to augment revenue-generating activities.
Overview of Public Investment in Malian Agriculture
While the focus of this study is U.S. agricultural development assistance to Mali, the U.S.
program is best understood in the context of overall public investment in Malian
agriculture, which is summarized in this section. As used here, the term “public
investment” refers to expenditures by the government of Mali or by external donor
governments and multilateral institutions. Public investment in agriculture includes
expenditures that have as a primary purpose improving the capacity of agriculture to
contribute to economic growth and a reduction in poverty and hunger. It thus includes
expenditures for the core agricultural purpose of increasing productivity through

Investing in Africa’s Future Final Report
A-40
improved access to technology, extension, and other services farmers need to produce, as
well as the broader purpose of linking farmers to markets so they can earn income from
increased production.
In many cases, such as spending on rural roads or trade policy, public investments
have multiple purposes, and it may not be possible to identify a primary purpose. Thus,
the broader view of public investment in agriculture taken here makes it impossible to
produce a single figure that can be said with confidence to represent total public
investment in agriculture in any country. The only remedy is to describe relevant
spending in ways that are as clear, transparent, and comparable country-to-country as
available information permits.
The Malian government’s investment in agricultural development occurs in the
context of its overall investment plans for implementation of Mali’s PRSP, which
projected expenditures for the four-year period of 2002–2005. Planned expenditures for
all PRSP implementation activities totaled about $1.13 billion in 2002, with annual
increases of 10–11% projected for 2003–2005, resulting in projected spending of $1.5
billion in 2005.4 Of this, 37% was projected to be financed externally and 63% from
domestically generated revenues.
The PRSP projected that about 51% of the available funds would go to the social
sectors (including education, health, and “environment and living standards”) and 47% to
development of basic infrastructure and productive sectors, with the remainder to
institutional development, governance, and participation. Within the development pillar,
about one-third of the funding (or about $237 million as projected for 2005) was
designated for “rural development and natural resources” and two-thirds for “basic
infrastructure for development.” In its more specific sectoral allocation of budgetary
expenditures, the PRSP projected about $178 million for agriculture in 2005 and about
$56 million for transport.
Within the overall government budget, agriculture had the second largest budget
allocation of any single sector over the 2002–2005 period at 11.9%, with general
government administration first at 12.7%. However, while total PRSP expenditures were
4 Unless otherwise noted, the spending figures in this section are taken from text and tables in Part Four of the Mali PRSP (Mali 2002), with the dollar figures reflecting conversions from the CFA franc (the common currency of several West African countries) based on a conversion rate of 512 CFA francs to the dollar.
Investing in Africa’s Future Final Report
A-41
projected to rise by 32% over the period, agriculture expenditures were projected to
decline by 13% (from $205 million in 2002 to the $178 million projected for 2005), with
the amount of projected agriculture spending funded domestically declining from $89
million in 2002 to $62 million in 2005 (or from 43% to 35% of total agriculture
spending). Over the same period, health and education expenditures were projected to
rise by 26% and 28%, respectively.
Like many of Africa’s poorest countries, and as reflected in the PRSP, Mali relies
heavily on external assistance to finance its development program. According to the
Organisation for Economic Co-operation and Development (OECD) (Table 1), external
assistance to Mali from all sources for all purposes totaled about $528 million in 2003, or
about 13% of Mali’s national income, with the top four donors being the World Bank’s
International Development Association, France, the European Commission, and the
United States. Funding for education, health and population, and “other social services”
was just over 50% of the total, while funding for economic infrastructure and services
and “production” garnered about 12% of the total.
As reported through the OECD’s Creditor Reporting System, bilateral assistance
from the OECD countries (including the United States) averaged $266 million annually
from 2000 through 2003, with reported funding for core agriculture, forestry, and rural
development purposes averaging about $26.3 million annually (Table 2). Reported
OECD country funding for road transport averaged $2.4 million over the period, but the
data do not specify whether the assistance was for rural or urban road transport.
Significant public investment in Malian agriculture also comes from the
multilateral development organizations, including:
• The World Bank. As of June 2005, the World Bank portfolio in Mali included 14
active projects with a commitment value of about $546 million (World Bank 2005).
These projects involve education, energy and mining, governance, natural resource
management, health, infrastructure, and other sectors related to achieving the goals of
the bank’s Country Assistance Strategy for Mali, which include promoting growth,
developing human resources, and enhancing public finance management and
governance. Three active World Bank projects relate directly to agriculture, with a
value of about $135.4 million (Table 3).

Investing in Africa’s Future Final Report
A-42
• Food and Agriculture Organization. In 2004, FAO was involved in 13 active, mostly
multi-year projects in Mali, with a total FAO contribution valued at $6 million (FAO
2005). FAO’s projects focus primarily on improving productivity and food security at
the household level but they involve a wide range of activities, including locust
control and livestock vaccination, urban forestry, decentralization of natural resource
management, development of bankable projects, and irrigation.
• International Fund for Agricultural Development (IFAD). IFAD is financing two
ongoing projects in Mali with loans totaling approximately $24.3 million (IFAD
2005). The projects are: 1) a ten-year flexible lending program to support the
initiatives of rural communities in Segou and Koulikoro to improve household food
security, incomes, and well-being, including enhanced agricultural productivity and
marketing and social services; and 2) an irrigation project in the Lacustre Zone.
• African Development Bank (ADB). In 2003, ADB loans and grant disbursements in
Mali totaled 31.1 UA or approximately $46.6 million (ADBG 2005). While
agriculture is a priority sector for investment in the ADB’s strategic plan, project- and
sector-specific information was not available for this report.
It is impossible to determine precisely the total amount of annual public
investment in Malian agriculture, whether from domestic or external sources, due to the
lack of any standardized definition or reporting system for such investment and the fact
that many projects are funded on a multi-year basis. Nevertheless, for the sole purpose of
putting U.S. assistance in context, a reasonable approximation of the annual public
investment in traditional agricultural development activities is $225–275 million. This
includes annual bilateral assistance from OECD countries and multilateral commitments
(assuming an average three-year project life).

Investing in Africa’s Future Final Report
A-43
The U.S. Assistance Program for Agriculture in Mali
The U.S. agricultural development program in Mali is best understood in the context of
the overall U.S. assistance program in the country. France is consistently Mali’s largest
bilateral donor, with the United States typically ranking second or third along with the
Netherlands and Germany. As reported to the OECD, total U.S. bilateral assistance to
Mali from all agencies for all purposes during the period 2000–2003 averaged about $43
million per year (Table 2). About 90% of this assistance is funded and managed through
the U.S. Agency for International Development (USAID), with the balance coming
through the Peace Corps, the Trade and Development Agency (TDA), and the
Departments of Labor and State.
In the fiscal years 2000–2004, the total annual USAID appropriation targeted
specifically to assist Mali has been fairly stable in the range of $37.5 million (2001) to
$40.8 million (2003) and had averaged about $39 million per year (Table 4). USAID’s
FY2005 budget request for Mali was $34.8 million, the 11th largest in the Africa region.
These figures do not include funds appropriated for the Economic Growth, Agriculture,
and Trade and the Africa regional programs that may have been used for activities in
Mali.
Background and Strategy
The United States has worked in Mali for more than four decades, primarily through
USAID, and currently considers itself to have important strategic interests in common
with Mali. A predominately Muslim country, Mali is an important partner in the war on
terror, and poverty reduction and economic growth are top priorities for the governments
of both Mali and the United States. The United States has been a strong supporter of
Mali’s economic and structural adjustment over the last decade.
USAID’s overall strategy in Mali, including its strategy for agriculture, is
described in USAID’s Mali Country Strategic Plan (CSP) FY2003–2012 (USAID 2002).
The CSP includes four specific strategic objectives—High Impact Health Services,
Improved Quality of Basic Education, Shared Governance Through Decentralization, and

Investing in Africa’s Future Final Report
A-44
Accelerated Economic Growth—and one special objective, Communications for
Development.
A participatory planning process involving both governmental and non-
governmental stakeholders was used to select USAID’s strategic objectives for Mali, with
that country’s PRSP providing a framework and set of principles to which the CSP
adheres (USAID 2002). As a result, the CSP complements and contributes to Mali’s own
plan for poverty reduction; likewise, the USAID strategy is well integrated into the
Malian poverty reduction plan. The strategies share a focus on increased agricultural
productivity as a means of achieving economic growth and poverty reduction.
Although 56% of the FY2004 CSP funding was allocated for the High Impact
Health Services strategic objective (USAID 2005), poverty reduction and economic
growth, embodied in the Accelerated Economic Growth strategic objective, are
underscored as the highest priorities of the CSP (USAID 2002). Consistent with the
central role of agriculture in the Malian economy, the CSP emphasizes that “in Mali,
achieving a higher growth in agriculture will be absolutely essential for increasing
incomes and employment and for reducing poverty” (USAID 2002, 58). In fact, the stated
purpose of the Accelerated Economic Growth strategic objective is to “increase
productivity and incomes in selected agricultural subsectors” (USAID 2002, 59).
One agricultural theme of the CSP is cereals and specifically the need to continue
Mali’s transition from a deficit producer to a surplus producer and from a net importer to
a net exporter. This is to be accomplished by increased private sector investment,
agricultural market policy reform, and enhanced agricultural production (USAID 2002).
Another agriculture-related focus of the CSP is the production and trade of commodities
for which Mali has a comparative advantage, as well as diversification to mitigate
vulnerability to climatic fluctuations. Technical assistance for agribusiness and financing
are also critical aspects of the USAID/Mali strategy for accelerated economic growth
(USAID 2002).
Beyond these broad themes, the CSP identifies the following specific near-term
goals for the Accelerated Economic Growth strategic objective (intermediate results in
USAID terms):

Investing in Africa’s Future Final Report
A-45
• Sustainable production of selected agricultural products in targeted areas increased,
with illustrative activities including:
o Expanded production of least-cost feed rations for livestock;
o Business management training for livestock feed and enterprises;
o Training of farm producer groups in business and management practices;
o Financing of irrigation infrastructure and water points;
o Irrigated land tenure reform;
o Support for seed multiplication and distribution;
o Training and extension of Community Based Natural Resource
Management (CBNRM) techniques; and
o Improvement and dissemination of CBNRM regulations.
• Trade of selected agricultural products increased, with illustrative activities including:
o Strengthening and expansion of the Market Information System;
o Expansion of marketing infrastructure;
o Pursuit of trade policy reforms;
o Strengthening of the capacity of professional trade organizations; and
o Expansion of agriculture markets.
• Access to finance increased, with illustrative activities including:
o Creation of financial tools to facilitate agricultural investment;
o Establishment of microfinance institutions (MFIs); and
o Building MFI capacity to mitigate agricultural risk (USAID 2002).
Strategic partnerships are an important tool for accomplishing the goals of the
CSP in the context of the Accelerated Economic Growth strategic objective and other
strategic objectives. For example, the Accelerated Economic Growth initiative will
collaborate closely with the Food for Peace Program and the trade component of the West
African Regional Program (USAID 2002). The government of Mali, technical agencies
of the Ministry of Rural Development, local communities, and other public and private
entities also are key partners in stimulating economic growth.

Investing in Africa’s Future Final Report
A-46
USAID’s Agricultural Development Program
Funds Available for Agricultural Development Assistance
USAID’s agricultural development assistance for Mali is funded and managed primarily
through the USAID Mission in Bamako out of its Development Assistance (DA) account.
Mali received modest allocations of Title II food aid during FY2000–FY2002, about $3.3
million of which was used for agricultural development assistance in FY2000 (Table 4).
Food aid allocations declined sharply after that and were eliminated in FY2003, with
agricultural development uses reaching zero in FY2002. The other major account through
which the activities of the USAID Mission in Mali are funded is Child Survival and
Health (CSH). As indicated in Table 4 and Figure 1, total funding through the DA
account has remained fairly stable, standing at $24.3 million in FY2004 but with the
FY2005 request somewhat lower at $20.8 million. The CSH appropriation also has been
fairly stable, standing at $14.3 million in FY2004.
Within the DA account, it is important to focus on the specific sectoral allocations
that are used to support agriculture’s role in economic development and poverty
reduction, namely agriculture, economic growth, and environment (with funding for the
Initiative to End Hunger in Africa [IEHA] coming online in FY2003 as a sub-component
of the agriculture sector). The agriculture-related sectors comprised about 70% of the DA
account in FY2004, with the bulk of the remainder going for basic education and
governance (Figure 1). Between FY2000 and FY2004, funding for the agriculture-related
sectors in Mali increased by about 5% (less than $1 million) despite an IEHA allocation
to Mali in FY2004 of $5.5 million.
Use of Development Assistance Funding for Agriculture
1. Recent Funding of Agricultural Development
While the mission receives its allocation of DA funds that are potentially applicable to
agricultural development, as broadly construed for this report, in the four sectoral sub-
categories shown in Table 4, USAID allocates and reports its commitment of DA
resources to agriculture and other sectors through the strategic objectives laid out in its

Investing in Africa’s Future Final Report
A-47
Mali CSP. As noted earlier, the Mali Mission is currently pursuing four strategic
objectives, with strategic objective 688-009 (Accelerated Economic Growth) being the
one applicable to agricultural development (USAID 2005). Although some of the
activities under this strategic objective may benefit non-agricultural enterprises, the
activities are predominately agriculture-related, and the authors treated it as a 100%
agriculture-related strategic objective for the purposes of estimating the overall USAID
commitment of program funds to support agriculture-led economic growth. This strategic
objective was initiated in FY2002. Funding for it (and its predecessors related to
agricultural development) was $12.5 million in FY2000, dropped to $7.9 million in
FY2001, and then rose to $14.3 million in 2004 (Table 5).
Taking into account the funding of all four strategic objectives in effect in
USAID’s Mali Mission in FY2004, approximately 37% of the funding is used for
purposes related to fostering agriculture’s role in economic growth and poverty reduction
(Figure 2).
2. Current Activities in the Agriculture-Related Strategic Objective
USAID/Mali’s Accelerated Economic Growth strategic objective is organized around
targeted interventions intended to boost production and trade in commodities for which
Mali has a comparative advantage, including rice, potatoes, meat, mangos, and shea
butter (USAID 2005). Of the $14.3 million committed to this strategic objective in
FY2004, $8.1 million was devoted to the intermediate result of increasing sustainable
production of such crops through the expansion of land under irrigation, improved
production and marketing of animal feed, development of a legal framework for
biotechnology, and improved natural resource management. Also included were training
in basic business management and lobbying skills to enable farmers and agribusinesses to
advocate more effectively for policy reform (USAID 2005).
In addition, this strategic objective devoted $3.4 million in FY2004 to a wide
range of activities targeted to specific crops and aimed at improving the environment and
skills needed to compete in export markets (USAID 2005). These included promoting
international business linkages and investment in trade-related infrastructure, improving
the policy and institutional environment for trade, improving market information systems,

Investing in Africa’s Future Final Report
A-48
and training exporters in the skills needed to manage export operations efficiently and
thus reduce transaction costs.
Finally, this strategic objective included the commitment in FY2004 of $2.8
million to improve access to financing by small- and medium-sized businesses, as well as
to microfinance for rural people (USAID 2005). This involves working directly with
banks and microfinance institutions to improve their outreach and the services they
provide to these customers with the goal of increasing the volume of loan activity to
agribusinesses and other agriculture-related trading activity.
Chemonics International, Inc., is a key prime contractor for this strategic
objective, with sub-contractors including Associates for International Resources and
Development, International Business Initiatives, CARE, The Mitchell Group, Weideman
Associates, Making Cents, Bankworld, and Enterprising Solutions (USAID 2005).
Use of PL 480 Title II Food Aid Resources for Agricultural Development
As noted, Mali has not been a recipient of significant PL 480, Title II food aid over the
period FY2000–FY2005, except in FY2000, and the U.S. Department of Agriculture
(USDA) has provided no development food aid to Mali over this period. As in other
countries, when non-emergency (or development) food aid has been provided in Mali
under Title II, it has been channeled through private voluntary organizations working in
the country as Title II cooperating sponsors (CSs). In the case of Mali, these are Africare
and World Vision. These organizations use the proceeds from the sale (monetization) of
commodities to carry out their projects involving agriculture, health, education, and other
needs.
Determining the dollar amount of the food aid resource that is applied to
agriculture in Mali requires considering the total USAID non-emergency food aid flow
through the Title II program (Food for Peace), the related cash assistance to CSs through
section 202(e) of PL 480, and estimates of the percentage of each CS program that is
devoted to agricultural development5 (Table 6).
4 The development food aid reported here does not include USAID food aid contributions to the United Nations’ World Food Programme, which predominately are used for emergency feeding.

Investing in Africa’s Future Final Report
A-49
1. Funding
In FY2000, the value of USAID’s Title II non-emergency food aid shipment to Mali
totaled $3.4 million, including freight costs from the United States (Table 6). Excluding
freight costs, the value of the commodities themselves was an estimated $2.3 million.
Total payments under section 202(e) to the CSs working in Mali were $426,000 in
FY2000. USAID estimates that 85% of the value of the food aid programs in Mali in
FY2000 was applied to agricultural development activities, which means that about $3.3
million with freight costs included and $2.3 million without freight costs included was
used for agricultural development purposes in FY2000. In FY2001, these figures dropped
to $365,000 and $271,000, respectively, and to zero in FY2002–FY2004.
2. Title II-Funded Development Activities
Africare was the principal CS managing food aid-financed development projects in Mali
in FY2000 and FY2001, working under a program that concluded in 2001 (Bogart 2004).
Like USAID-sponsored food aid programs in general, the Africare program is focused on
the goal of food security as called for by USAID’s 1995 food aid policy statement
(USAID/FFP 1995). Africare’s FY1997–2002 Title II program, entitled the Goundam
Food Security Initiative, focused on 30 villages in FY2001, with its overarching goal
being “to enhance food security among the populations of Goundam Circle, Timbuktu
Region, Mali” (Africare 2002, 3). The program consisted of nutrition, agriculture, health
services delivery, and income-generating activity components and sought to achieve the
following objectives: 1) strengthened capacity of targeted communities to address food
security issues; 2) increased and diversified agricultural production; 3) improved
household nutrition; and 4) improved access to potable water (Africare 2003).
Achievement of the first objective was based on indicators such as the number of
participatory rural appraisals completed and communities’ “food security community
capacity index” (Africare 2003). For the second objective, the number of months
households had adequate food provisions and the number of hectares with improved
agricultural techniques related to irrigation and food crops were used to gauge progress.
To evaluate the effect of efforts under the third objective, the percentages of children
stunted and children enrolled in a growth monitoring program were monitored. Finally,

Investing in Africa’s Future Final Report
A-50
improvements in access to potable water were evaluated based on the percentage of
households having year-round access to potable water and the number of wells
maintained by communities (Africare 2003).
Examples of achievements detailed in the 2001 results report include 298 hectares
with improved agricultural techniques in 2001, up from zero hectares in 1998 (Africare
2003). The number of months households reported having adequate food provisions was
actually lower in 2001 (5.1 months) than it was in the 1998 baseline study (5.6 months).
USDA’s Agricultural Development Activities in Mali
As noted earlier, USDA did not provide food aid to Mali during the 2000–2004 period.
Beyond food aid, USDA has no appropriation specifically for agricultural development
assistance in Africa, but USDA employees provide technical assistance and manage
programs that are funded by USAID through the International Cooperation and
Development (ICD) program in USDA’s Foreign Agricultural Service. Ten USDA
agricultural advisors are on reimbursable details at USAID working on the Presidential
Initiative to End Hunger in Africa.
In addition, USDA funds occasional projects that relate to agricultural
development in specific African countries, amounting to about $1 million annually across
the continent, through ICD’s Food Industry Division and Scientific Cooperation Research
Program (Brown 2005). No data were available on USDA projects carried out
specifically in Mali.
Other United States Agencies
African Development Foundation
Four of eight projects in Mali approved in 2002 and 2003 by the ADF relate to
agricultural development according to the 2002–2003 ADF annual report, which is the
most current source of readily available information on ADF activities (ADF 2003).
Funding for these four projects, all of which are ongoing, totals approximately $688,500.

Investing in Africa’s Future Final Report
A-51
The projects are: 1) tomato processing; 2) rice processing and marketing support; 3)
traditional cereals processing and marketing; and 4) fruit juice processing.
Trade and Development Agency
The TDA funded one project in Mali per year in FY2000 ($203,000) and FY2001
($145,000); neither of these projects related to agricultural development and no TDA
projects are reported in Mali during the FY2002–FY2004 period (OECD n.d.; USTDA
2004).
Trends in Bilateral U.S. Agricultural Development Assistance in Mali
The great majority of U.S. agricultural development assistance for Mali is funded
bilaterally through the USAID Development Assistance account, with some Title II food
aid funding in FY2000 and FY2001 (Table 7). Total funding through these vehicles is
down from $15.8 million in FY2000 to $14.3 million in FY2004, a decline of nearly
10%. The level of assistance for agriculture was less than $9 million per year in FY2001
and 2002, reflecting drops from FY2000 in both the Development Assistance account and
food aid funding.
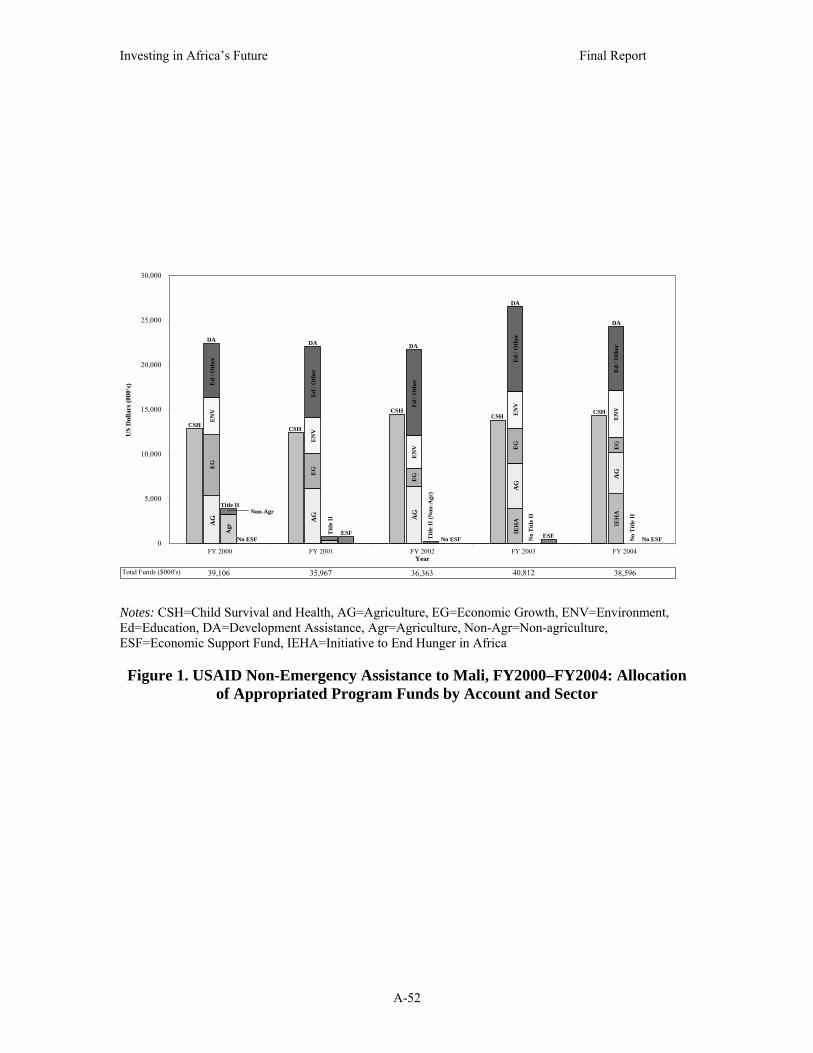
Investing in Africa’s Future Final Report
A-52
Notes: CSH=Child Survival and Health, AG=Agriculture, EG=Economic Growth, ENV=Environment, Ed=Education, DA=Development Assistance, Agr=Agriculture, Non-Agr=Non-agriculture, ESF=Economic Support Fund, IEHA=Initiative to End Hunger in Africa Figure 1. USAID Non-Emergency Assistance to Mali, FY2000–FY2004: Allocation
of Appropriated Program Funds by Account and Sector
0
5,000
10,000
15,000
20,000
25,000
30,000
FY 2000 FY 2001 FY 2002 FY 2003 FY 2004Year
US
Dol
lars
(000
's)
CSH
DA
ESF
DA
DADADA
CSH
CSHCSH
CSH
Title II
Titl
e II
ESF
AG
EG
EN
VIE
HA
Ed
/ Oth
er
Ed
/ Oth
er
Ed
/ Oth
er
Ed
/ Oth
er
Ed
/ Oth
erE
NV
EN
V
EN
V
EN
V
EG
EG
EG
EG
AG
AG
AG
AG
Agr
No ESF No ESFNo ESF
Non-Agr
Titl
e II
(Non
-Agr
)
Total Funds ($000's) 35,96739,106 36,363 40,812 38,596
IEH
A
No
Titl
e II
No
Titl
e II
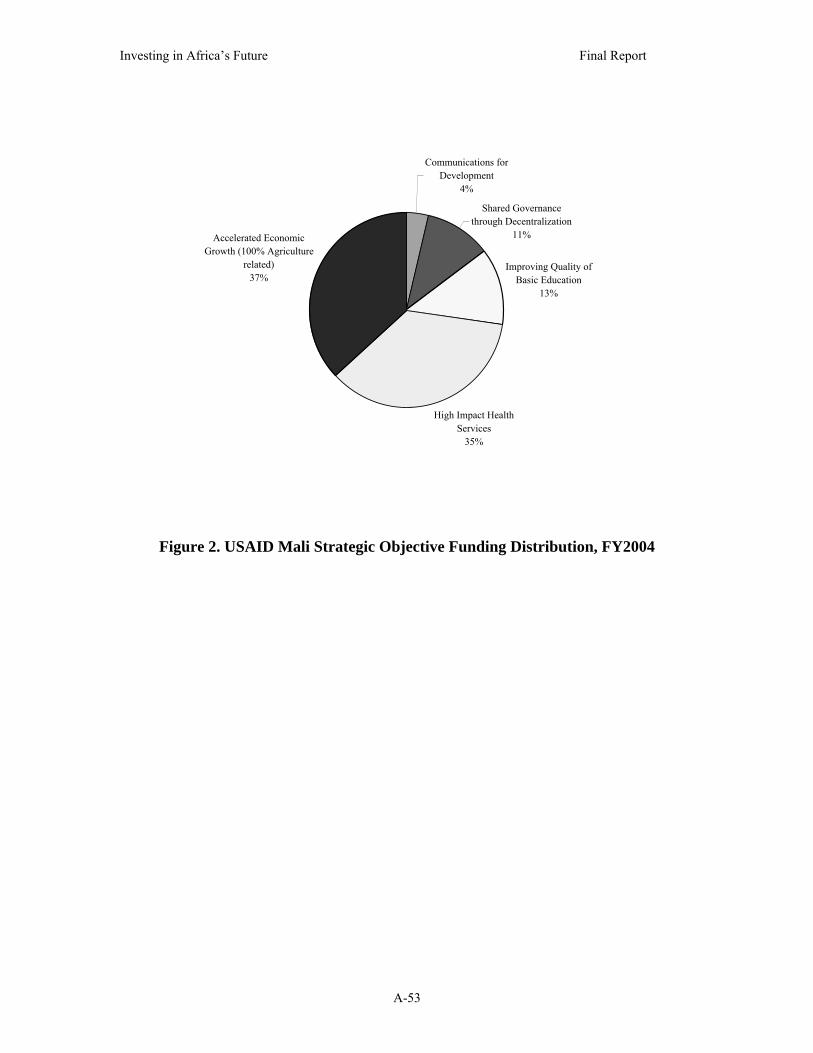
Investing in Africa’s Future Final Report
A-53
Communications for Development
4%
Shared Governance through Decentralization
11%
Improving Quality of Basic Education
13%
High Impact Health Services
35%
Accelerated Economic Growth (100% Agriculture-
related)37%
Figure 2. USAID Mali Strategic Objective Funding Distribution, FY2004

Investing in Africa’s Future Final Report
A-54
Table 1. Aid at a Glance: Mali
Source: Aid Statistics, Recipient Aid Charts, Mali, OECD Development Co-operation Directorate (OECD/DAC n.d.).
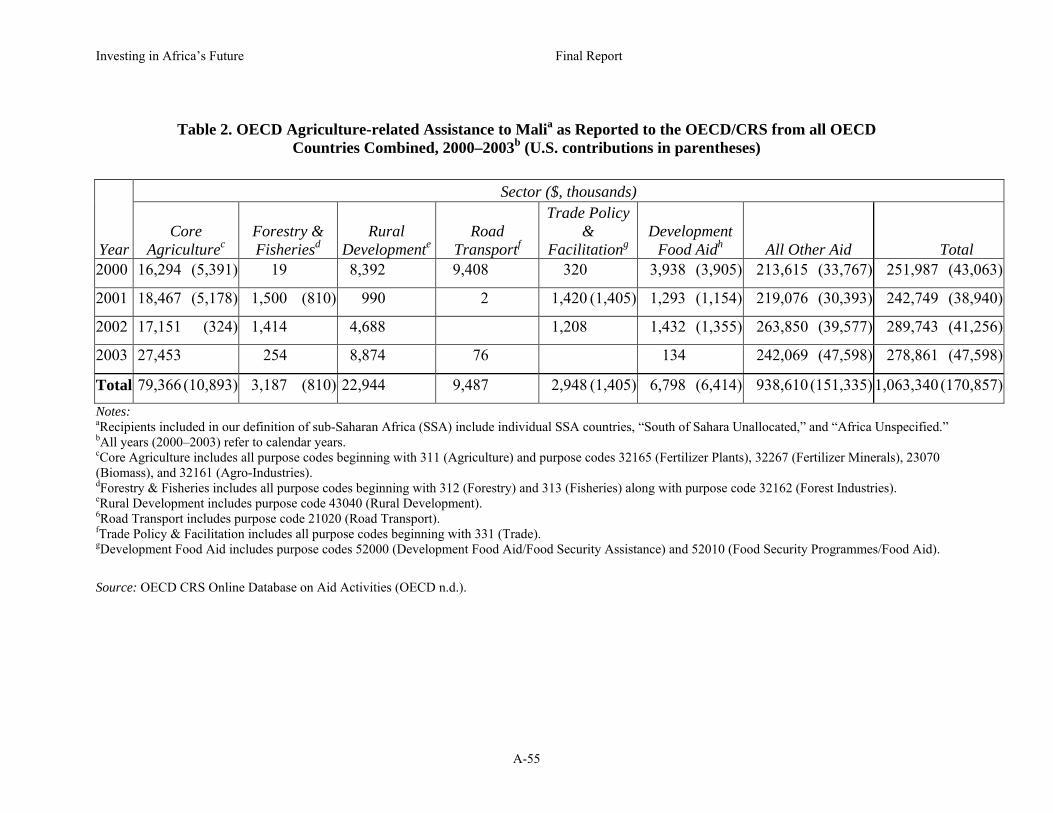
Investing in Africa’s Future Final Report
A-55
Table 2. OECD Agriculture-related Assistance to Malia as Reported to the OECD/CRS from all OECD Countries Combined, 2000–2003b (U.S. contributions in parentheses)
Sector ($, thousands)
Year Core
Agriculturec Forestry & Fisheriesd
Rural Developmente
Road Transportf
Trade Policy &
Facilitationg Development
Food Aidh All Other Aid Total 2000 16,294 (5,391) 19 8,392 9,408 320 3,938 (3,905) 213,615 (33,767) 251,987 (43,063)
2001 18,467 (5,178) 1,500 (810) 990 2 1,420 (1,405) 1,293 (1,154) 219,076 (30,393) 242,749 (38,940)
2002 17,151 (324) 1,414 4,688 1,208 1,432 (1,355) 263,850 (39,577) 289,743 (41,256)
2003 27,453 254 8,874 76 134 242,069 (47,598) 278,861 (47,598)
Total 79,366 (10,893) 3,187 (810) 22,944 9,487 2,948 (1,405) 6,798 (6,414) 938,610 (151,335)1,063,340 (170,857) Notes:
aRecipients included in our definition of sub-Saharan Africa (SSA) include individual SSA countries, “South of Sahara Unallocated,” and “Africa Unspecified.” bAll years (2000–2003) refer to calendar years. cCore Agriculture includes all purpose codes beginning with 311 (Agriculture) and purpose codes 32165 (Fertilizer Plants), 32267 (Fertilizer Minerals), 23070 (Biomass), and 32161 (Agro-Industries). dForestry & Fisheries includes all purpose codes beginning with 312 (Forestry) and 313 (Fisheries) along with purpose code 32162 (Forest Industries). eRural Development includes purpose code 43040 (Rural Development). 6Road Transport includes purpose code 21020 (Road Transport). fTrade Policy & Facilitation includes all purpose codes beginning with 331 (Trade). gDevelopment Food Aid includes purpose codes 52000 (Development Food Aid/Food Security Assistance) and 52010 (Food Security Programmes/Food Aid).
Source: OECD CRS Online Database on Aid Activities (OECD n.d.).
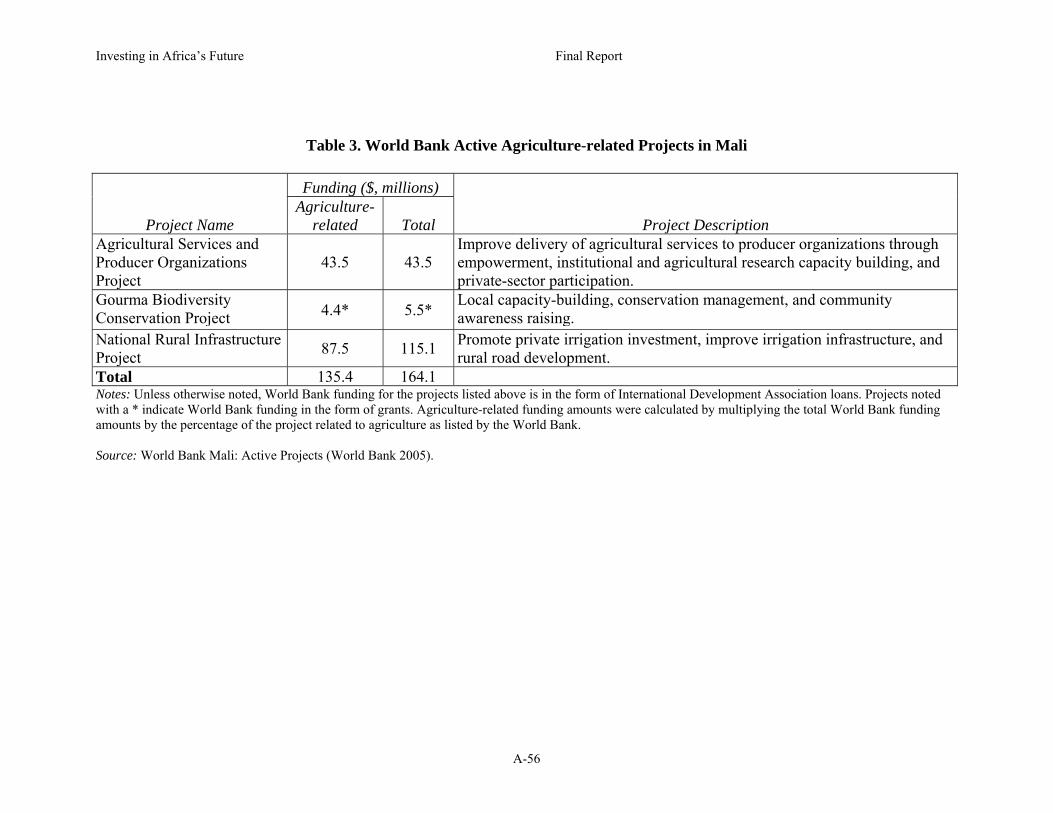
Investing in Africa’s Future Final Report
A-56
Table 3. World Bank Active Agriculture-related Projects in Mali
Notes: Unless otherwise noted, World Bank funding for the projects listed above is in the form of International Development Association loans. Projects noted with a * indicate World Bank funding in the form of grants. Agriculture-related funding amounts were calculated by multiplying the total World Bank funding amounts by the percentage of the project related to agriculture as listed by the World Bank. Source: World Bank Mali: Active Projects (World Bank 2005).
Funding ($, millions)
Project Name Agriculture-
related Total Project Description Agricultural Services and Producer Organizations Project
43.5 43.5 Improve delivery of agricultural services to producer organizations through empowerment, institutional and agricultural research capacity building, and private-sector participation.
Gourma Biodiversity Conservation Project 4.4* 5.5* Local capacity-building, conservation management, and community
awareness raising. National Rural Infrastructure Project 87.5 115.1 Promote private irrigation investment, improve irrigation infrastructure, and
rural road development. Total 135.4 164.1

Investing in Africa’s Future Final Report
A-57
Table 4. USAID Appropriation of Program Funds for Mali, FY2000–FY2004
Appropriation ($, thousands)
Account FY2000 Actual
FY2001 Actual
FY2002 Actual
FY2003 Actual
FY2004 Actual
FY2005 Requested
Development Assistance Total 22,370 22,054 21,688 26,581 24,296 20,793 Agriculture 5,315 6,179 6,373 5,100 4,600 Economic Growth 6,838 3,903 2,011 3,889 1,735 Environment 4,150 3,977 3,718 4,152 5,266 IEHA 0 0 0 3,900 5,550 Child Survival & Health 12,878 12,433 14,488 13,821 14,300 13,974Economic Support Fund 0 750 0 410 0 0Total PL 480 Title II Non-Emergency 3,858 730 187 0 0
Non-Emergency Agricultural Use 3,287 365 0 0 0
Non-Emergency Non-Agricultural Use 571 365 187 0 0
TOTAL NON-EMERGENCY PROGRAM FUNDS 39,106 35,967 36,363 40,812 38,596 34,767
Total PL 480 Title II (Emergency + Development) 3,905 2,372 1,355 0 0 0
TOTAL PROGRAM FUNDS 39,153 37,609 37,531 40,812 38,596 34,767Notes: IEHA=Initiative to End Hunger in Africa. Source: USAID Congressional Budget Justifications (USAID various years) and personal communication with Fenton B. Sands, Chief, Economic Growth, Environment & Agriculture Division, Office of Sustainable Development, Bureau for Africa, USAID (Sands 2005).

Investing in Africa’s Future Final Report
A-58
Table 5. USAID Agriculture-related Strategic Objectives and Funding Levels, Mali, FY2000–FY2004
Source: Authors’ calculations, with data from USAID Congressional Budget Justifications-Mali (USAID various years).
Funding ($, thousands)
Title Former Title % related to Agriculture FY2000 FY2001 FY2002 FY2003 FY2004
Total, FY2000– FY2004
688-002 Sustainable Economic Growth
688-022 Increased value-added of specific economic sectors to national income
100 10,753 5,881 3,330 0 0 19,964
668-005 Development in the North
50(33-67)
1,750(1,155-2,345)
2,045(1,350-2,740)
405(267-543) 0 0
4,200(2,772-5,628)
668-009 Accelerated Economic Growth
100 0 0 5,222 13,349 14,300 32,871
Total
12,503(11,908-13,098)
7,926(7,231-8,621)
8,957(8,819-9,095)
13,349 14,30057,035
(55,607-58,463)

Investing in Africa’s Future Final Report
A-59
Table 6. U.S. Non-Emergency Food Aid Estimated Value Applied for Agricultural Development Purposes, Mali, FY2000–FY2004
Funding ($, thousands)
Allocation FY2000 FY2001 FY2002 FY2003 FY2004 Average Increase, FY2000– FY2004 (%)
USAID Title II Value With Freight 3,432 564 0 0 0 799 -100%
Title II Value w/o Freight* 2,289 376 0 0 0 533 -100%
202(e) Payment 426 166 187 0 0 156 -100%USAID Total With Freight 3,858 730 187 0 0 955 -100%
USAID Total w/o Freight 2,715 542 187 0 0 689 -100%
% Used for Agriculture** 85% 50% 0% 0% 0% ----- -100%
Total USAID Agriculture Value With Freight
3,279 365 0 0 0 729 -100%
Total USAID Agriculture Value w/o Freight
2,308 271 0 0 0 516 -100%
Notes: * Calculated based on the assumption that freight costs consume one-third of the total value. ** Calculated based on estimates in USAID annual reports on non-emergency food aid of the percentages of each cooperating sponsor program in Mali that is devoted to agricultural development. Source: USAID Office of Food for Peace Annual Reports, FY2000–FY2004 (USAID/FFP various years) and the USDA/Foreign Agricultural Service website (USDA/FAS n.d.).

Investing in Africa’s Future Final Report
A-60
Table 7. Bilateral U.S. Assistance for Malian Agriculture, Major Elements, FY2000– FY2004
Funding ($, thousands)
Program FY2000 Actual
FY2001 Actual
FY2002 Actual
FY2003 Actual
FY2004 Actual
USAID/Development Assistance Rural Sector Growth Strategic Objective
12,503 7,926 8,957 13,349 14,300
USAID/Food Aid PL480 Title II* 3,279 365 0 0 0
Total 15,782 8,291 8,957 13,349 14,300Notes: * Includes 202(e) payments. All food aid values include freight costs. Source: Extracted from Tables 5 and 6.

Investing in Africa’s Future Final Report
A-61
References
ADBG (African Development Bank Group). 2005. Summary of Operations for the
Republic of Mali. http://www.afdb.org/en/country_operations/african_countries/
mali (accessed February 13, 2005).
ADF (African Development Foundation). 2003. Innovative Investments in Africa’s
Future: ADF Funded Projects Fiscal Years 2002–2003. http://www.adf.gov/
ADF200203report.pdf (accessed April 2, 2005).
Africare. 2002. Title II Development Program, the Goundam Food Security Initiative,
Africare/Mali, Fiscal Year 2001 Results Report.
Bogart, Brian J. 2004. Personal communication from Brian J. Bogart, Results and
Information Reporting, USAID/FFP/AMEX International, to Michael Taylor,
Nov. 12.
Brown, Jocelyn. 2005. Personal communication from Jocelyn Brown, assistant deputy
administrator, ICD/FAS/USDA, to the authors, Feb. 4.
FAO (Food and Agriculture Organization of the United Nations). 2004. The State of
Food Security in the World, 2004. Available from http://www.fao.org/documents/
show_cdr.asp?url_file=/docrep/007/y5650e/y5650e00.htm (accessed June 20,
2005).
FAO. 2005. List of Operationally Active projects for all Organizational Units in Mali by
funding source. https://extranet.fao.org/fpmis/FPMISReportServlet.jsp?sel_
country=ML&div=&type=countryprofileopen&language=EN&countryId=ML
(accessed June 22, 2005).
IFAD (International Fund for Agricultural Development). 2005. Approved Projects for
Mali. http://www.ifad.org/operations/projects/regions/PA/ML_all.htm (accessed
February 13, 2005).
Mali (Government of the Republic of Mali). 2002. Mali: Poverty Reduction Strategy
Paper. http://www.imf.org/external/pubs/ft/scr/2003/cr0339.pdf (accessed June
28, 2005).
OECD (Organisation for Economic Co-operation and Development). n.d. CRS Online
Database on Aid Activities. Available from http//:www.oecd.org/dac/stats/
idsonline (accessed April 3, 2005).

Investing in Africa’s Future Final Report
A-62
OECD/DAC (Organisation for Economic Co-operation and Development-Development
Co-operation Directorate). n.d. Aid Statistics, Recipient Aid Charts, Mali.
http://www.oecd.org/dataoecd/23/22/1882081.gif (accessed June 23, 2005).
Sands, Fenton B. 2005. Personal communication from Fenton Sands, Chief, Economic
Growth, Environment & Agriculture Division, Bureau for Africa, USAID, to the
authors, February 8.
UNDP (United Nations Development Programme). 2004. Human Development Report
2004. http://hdr.undp.org/reports/global/2004/pdf/hdr04_HDI.pdf (accessed June
28, 2005).
USAID (U.S. Agency for International Development). 2002. USAID/Mali Country
Strategic Plan, 2003-2012. http://www.dec.org/pdf_docs/PDABX109.pdf
(accessed June 22, 2005).
USAID. 2005. FY2005 Congressional Budget Justification – Mali. http://www.usaid.gov/
policy/budget/cbj2005/afr/pdf/ml_cbj_fy05.pdf (accessed June 22, 2005).
USAID. Various years. Congressional Budget Justification - Mali. Available from
http://www.usaid.gov/policy/budget/ (accessed March 30, 2005).
USAID/FFP (U.S. Agency for International Development/Office of Food for Peace).
1995. Food Aid and Food Security Policy Paper. Feb. 27. http://www.usaid.gov/
policy/ads/200/foodsec/foodsec.pdf (accessed March 25, 2005).
USAID/FFP. Various Years. Food for Peace Annual Reports, FY2000 to FY2004.
U.S. Department of State. 2004. Background Note: Mali. http://www.state.gov/r/pa/ei/
bgn/2828.htm (accessed December 14, 2004).
USTDA (U.S. Trade and Development Agency). 2004. Annual Report. Available from
http://www.tda.gov/USTDA/About%20USTDA/eventspubs.htm (accessed March
30, 2005).
World Bank Group. 2003. Mali - Country assistance strategy, Vol. 1 of 1. Available from
http://www-wds.worldbank.org/servlet/WDS_IBank_Servlet?pcont=details&eid
=000160016_20030723094726 (accessed June 22, 2005).
World Bank Group. 2005. Mali: Active Projects. http://web.worldbank.org/external/
default/main?menuPK=362215&pagePK=141155&piPK=141124&theSitePK=36
2183 (accessed May 25, 2005).
Investing in Africa’s Future Final Report
A-63
Appendix 4-C U.S. Agricultural Development
Assistance in Mozambique
By Michael R. Taylor, Julie A. Howard, and Nicole M. Mason1
The Economy, Agriculture, and Food Security in Mozambique2
Mozambique achieved independence from Portugal in 1975 after more than a decade of
armed struggle led by the Front for the Liberation of Mozambique (FRELIMO). The
colonial economy had operated on the typical extraction model, including the mining of
titanium, iron ore, and other mineral resources, with the vast majority of people relying
on subsistence agriculture for survival.
Following independence, FRELIMO aligned Mozambique with the Soviet Union
and adopted socialist economic policies. The result was a civil war in which neighboring
Rhodesia and South Africa financed armed rebellion by the Mozambican National
Resistance (RENAMO). More than a million Mozambicans were killed and several
million displaced during the civil war, with dire consequences for the economy. In 1983,
FRELIMO abandoned socialism and began a process of economic and political reform
that culminated in a 1990 constitution providing for a multi-party political system, a
market-based economy, and free elections. The civil war ended in 1992, and the first
democratic elections were held in 1994, in which FRELIMO’s Joaquim Chissano was
elected president.3
Mozambique emerged from the turmoil of independence and civil war as one of
the world’s poorest nations and remains so today. With a population of 18.5 million, its
1 Michael R. Taylor is a Senior Fellow at Resources for the Future in Washington, DC. Julie A. Howard is Executive Director of the Partnership to Cut Hunger & Poverty in Africa in Washington, DC. Nicole M. Mason is a graduate student in the Department of Agricultural Economics at Michigan State University. Victornio Xavier, Project Director of the Projecto Integrado de Desenvolvimento Agricola, served as a consultant for this report. The authors acknowledge him for his contributions to their substantive understanding of the issues related to U.S. agricultural development assistance in Mozambique and for facilitating their meetings with a broad cross section of government actors and private-sector stakeholders. 2 Information in this section is drawn from the U.S. Department of State’s “Background Note: Mozambique” unless otherwise noted (U.S. Department of State 2004). 3 In elections held in December 2004, FRELIMO’s candidate Armando Guebuza was elected with 64% of the vote to succeed President Chissano (U.S. Department of State 2005).

Investing in Africa’s Future Final Report
A-64
annual per capita income in 2003 was $226 (World Bank 2004). Infant mortality is high
(124/1000) and life expectancy is low at 41 years; adult literacy is 45%. AIDS prevalence
is 13%. Nearly 70% of the population lives in absolute poverty (Mozambique 2001).
With peace and the implementation of market-oriented economic reforms,
however, the economy of Mozambique has grown at relatively high rates in recent years,
exceeding 10% from 1997 to 1999. The severe floods of 2000 cut economic growth to
2.1% that year, but growth rebounded to 14.8% in 2001 and is expected to average in the
7–10% range for the next five years. Mining remains an important element of the
economy, and 31% of gross domestic product (GDP) is now derived from industrial
production, including aluminum, consumer goods, light machinery, garments, food
processing and beverages. Nevertheless, industry and commerce employ only 8.5% of
Mozambique’s workforce.
The majority of Mozambicans, 88%, work in the agriculture sector, with more
than 75% engaged in small-scale agriculture. Agriculture accounts for 23.3% of the GDP.
Export crops include cashews, corn, cotton, sugar, sorghum, copra, tea, citrus fruit,
bananas, and tobacco. In recent years, the agricultural sector has accounted for about 80%
of Mozambique’s exports, which totaled $910 million in 2003, but commercial
agriculture in Mozambique is severely hampered by inadequate physical infrastructure,
market networks, and investment (Mozambique PRSP).
The major crops consumed locally are corn, cassava, and rice, but productivity is
low due to limited use of modern equipment and other inputs. Less than 10% of
households sell surplus corn, cassava, or cotton. On the other hand, 88% of
Mozambique’s arable land is uncultivated, suggesting significant natural capacity for
growth in agricultural output. Mozambique also adjoins the relatively large South African
market and has an extensive coastline, providing some comparative advantage for
agricultural trade if obstacles to production can be overcome.
Hunger is a severe problem in Mozambique. The Food and Agriculture
Organization of the United Nations (FAO) estimates that in the years 2000–2002, 47% of
Mozambicans were undernourished, meaning their basic food energy needs were not

Investing in Africa’s Future Final Report
A-65
being met (FAO 2004).4 This number is down from the 66% and 58% that were estimated
to be undernourished in the periods 1990–1992 and 1995–1997, respectively, but only six
countries in the world are more food insecure than Mozambique.
Mozambique’s Governance Structure for Agricultural Development
Mozambique is a multi-party democracy in which FRELIMO and RENAMO remain the
leading parties, followed by numerous smaller ones. The government is headed by a
popularly-elected president, who appoints the prime minister and the 23 ministers who
head government departments, including the Ministry of Agriculture (MINAG). The
president is both head of state and head of government and chairs the Council of
Ministers.
Legislative power rests in a unicameral, 250-member National Assembly. The
assembly members are elected at the province level from party tickets, which means that
ballots are cast for the party rather than directly for individual candidates. Mozambique’s
11 provinces and 128 districts have no elected assembly or legislative power, though
Mozambique’s 33 cities have elected mayors and assemblies to handle municipal matters.
Mozambique is attempting to decentralize the national government’s functions.
Each of the national ministries is represented at the provincial level by an official who is
nominated by the national ministry and formally appointed by the provincial governor.
The governors, however, are appointed by the president. Because there are no provincial
or district assemblies and National Assembly members are elected by party ticket at the
provincial level, there is little direct accountability of elected officials to rural people.
The president plays a key role in the formulation of agricultural development
strategy, and MINAG is the key ministry. President Chissano committed the government
to poverty and hunger reduction as central goals and provided leadership in the
formulation and adoption of Mozambique’s Action Plan for the Reduction of Absolute
4 The term “undernourishment” refers only to the failure to meet dietary energy needs and not to the problem of malnutrition, which includes the failure to consume the micronutrients, protein, and other dietary components needed for good health. Nevertheless, FAO uses undernourishment interchangeably with “food insecurity,” which FAO defines as the condition in which people in a society lack physical and economic access to the safe and nutritious food they need to thrive (FAO 2004).

Investing in Africa’s Future Final Report
A-66
Poverty (2001–2005) (PARPA or Mozambique’s PRSP) (Mozambique 2001). The newly
elected President Guebuza is expected to maintain that commitment.
Because agricultural development is a key element of Mozambique’s PRSP, the
Ministry of Agriculture and Rural Development (MADER, now referred to as MINAG)
played a central role in its formulation, along with the numerous other ministries involved
in development and poverty reduction, including the ministries of Planning and Finance,
Industry and Commerce, Transport and Communications, Health, and Education. The
PRSP was drafted by an inter-sectoral group comprised of representatives of the
ministries and was adopted by the Council of Ministers following a process of
consultation with stakeholders at the national level and consultation meetings in each of
the provinces.
To build its own capacities and foster the progress in the agricultural sector
contemplated by the PRSP, MINAG has adopted two strategy documents of its own to
guide investment in Mozambican agriculture: ProAgri I and ProAgri II (MADER 2004).
These strategies were blessed by the prime minister and, in the case of ProAgri II,
developed on the basis of extensive consultations with both government and civil society
stakeholders at the national and provincial levels, as well as with substantial input from
donors and the international development agencies.
The Role of Agriculture in Mozambique’s Development Strategy
Mozambique’s Poverty Reduction Strategy Paper
Mozambique’s PRSP embraces the market-oriented principles of the economic
stabilization and structural adjustment program the country initiated in the late 1980s and
for which it credits the economic growth rates it has achieved in recent years. It also
recognizes that “the dynamics of human development and broad-based growth are
interdependent” and that a pro-poor growth strategy “requires a policy climate which
stimulates the private sector to accelerate job creation and increase income generating
opportunities through self-employment” (Mozambique 2001, 3).

Investing in Africa’s Future Final Report
A-67
With these principles in mind, Mozambique’s PRSP identifies six priorities (or
fundamental areas of action) that are aimed at “promoting human development and
creating a favourable environment for rapid, inclusive and broad-based growth”
(Mozambique 2001, 3). They are:
• Education;
• Health;
• Agriculture and rural development;
• Basic infrastructure;
• Good governance; and
• Macro-economic and financial management.
It is noteworthy that agriculture is the only productive sector of the private
economy included in these top-priority fundamental areas of action. The PRSP includes
other important sectors as other areas of action, including mining, fisheries, and tourism,
but agriculture is singled out for priority attention because the population is
predominately rural and dependent on agriculture and “[t]here is a great potential for the
agricultural sector to contribute to rising incomes” (Mozambique 2001, 62).
The PSRP’s Agriculture and Rural Development Program explicitly focuses on
poverty reduction and emphasizes the need to boost both the “family” sector and the
commercial sector of the agricultural economy. The program focuses on boosting the
productivity of Mozambique’s farmers through research, extension, natural resource
management, and other traditional services, while recognizing that “success depends on
measures to provide infrastructure and services outside the field of agriculture,” including
transport, communications, market expansion, finance, education and training, health and
nutrition (Mozambique 2001, 62).
ProAgri I and ProAgri II
MINAG’s first ProAgri strategy, ProAgri I, which pre-dated the PRSP, focused on
improving the ministry’s capabilities as an institution in area such as program planning,
Investing in Africa’s Future Final Report
A-68
budget planning and management, accounting, audit and financial control, procurement,
human resources management, organization of the research system, and coordination
across sectors (MADER 2004). This approach was driven in large part by donor countries
and institutions, which, prior to ProAgri, were reluctant to provide assistance directly to
MINAG due to lack of confidence in its financial controls and other capabilities. Prior to
the inception of ProAgri I in 1999, only two donors (the European Commission and the
United States) were willing to support the reform process directly through the
government’s budget. By 2001, that number had increased to 10, including the World
Bank (MADER 2004).
By 2002, however, it had become clear, based in part on an external evaluation of
ProAgri, that the progress toward improving MINAG’s capabilities had not resulted in
gains for the agricultural sector itself as called for by the PRSP. It was thus necessary to
move to Phase II by “transforming ProAgri into a true framework for agricultural
development in Mozambique, as opposed to a narrow public expenditure program
focused on institutional development” (MADER 2004, 1).
ProAgri II was adopted in March 2004. It reflects MINAG’s ongoing struggle to
redefine its role in agricultural development and poverty reduction in relation to other
government ministries and the private sector. ProAgri II emphasizes that MINAG can no
longer focus on the traditional supply-driven functions of an agriculture ministry. Rather,
it must coordinate its actions with other ministries with vital roles in agriculture and rural
development, such as Transport and Communications, Industry and Commerce, and
Education, and it must also be more demand-driven to better meet the needs of farmers
and other private-sector participants in the agricultural system.
ProAgri II candidly acknowledges that defining MINAG’s role within
government and with the private sector “is not straightforward” (MADER 2001, 51) and
is a work-in-progress. As a broad guide for that process, however, ProAgri II declares
MINAG’s mission to be to:
Contribute to improved food security and poverty reduction by supporting the
efforts of smallholders, the private sector, [and] governmental and non-
governmental agencies to increase agricultural productivity, agro-industry and

Investing in Africa’s Future Final Report
A-69
marketing within the principles of sustainable exploitation of natural resources.
(MADER 2004, 60)
To achieve this mission, MINAG intends to work within four “pillar” areas of
activity: 1) input and output markets; 2) rural finance; 3) rural infrastructure; and (4)
provision of an enabling policy and regulatory environment (MADER 2004).
MINAG also plans to take a horizontal approach to planning interventions in its
three strategic intervention areas: smallholder agricultural development, commercial
agriculture development, and sustainable natural resources management. Each of these
has a defined objective and is accompanied by strategic actions that add up to a sweeping
and ambitious reform agenda:
Smallholder agricultural development: “[T]o support smallholders to develop their
agriculture and natural resource related activities to enhance their livelihoods” (MADER
2004, 66).
Strategic actions include:
• Financial Services: Formulate and implement a plan to address smallholders’ needs
for financial services.
• Roads: Address important feeder road constraints to agriculture at province and
district levels.
• Markets for agricultural inputs, products, and services: Stimulate markets for key
inputs, products, and services.
• Access to agricultural technology and advice: Develop an effective research and
extension service.
• Farmers’ organization: Develop and implement a program for widespread facilitation
of sustainable farmers’ groups.
• Enabling environment for the development of the smallholders’ agricultural
businesses: Establish an enabling business environment for smallholder-sector
development.
• Access to forest and wildlife resources: Create the conditions and capacity for
sustainable forest and wildlife management by smallholders (MADER 2004, 66–74).

Investing in Africa’s Future Final Report
A-70
Commercial agriculture development: “[T]o stimulate increased agricultural and
natural resource based production, to ensure sufficient domestic production to meet basic
food needs of all Mozambicans, and increase income levels in rural areas. This should be
complemented with the promotion and development of agro-industries that add value to
the country’s agricultural products for domestic and export markets” (MADER 2004, 75).
Strategic actions include:
• Financial Services: Formulate and implement a plan to address commercial needs for
financial services.
• The Tax and Business Environment: Create an enabling tax and business environment
for the agricultural commercial sector.
• Infrastructure: Address key infrastructural constraints to agricultural sector business
[such as roads, storage, and irrigation].
• Access to Professional Services: Develop systems by which commercial actors can
access professional services [such as technical assistance for production and
marketing].
• Market for Inputs and Products: Stimulate markets for key inputs and products.
• Private-Sector Organization and Representation: Develop representative
organizations for the commercial agricultural sector which can adequately represent
their voice.
• Access to Forest and Wildlife Resources: Create the conditions for a competitive and
diversified commercial sector based on the sustainable management and use of forest
and wildlife resources (MADER 2004, 75–79).
Sustainable natural resources management: “To guarantee sustainable natural-
resource management that brings economics, social and environmental outcomes based
on appropriate management (access, security of tenure and rights) and conservation
plans, involving communities, public sector, and private-sector interests” (MADER 2004,
80).
Strategic actions include:

Investing in Africa’s Future Final Report
A-71
• Natural Resource Access, Security of Tenure and Rights: Development of a National
Land Cadastre infrastructure.5
• Planning and Management of Natural Resource Use: Develop and implement natural
resources planning.
• Monitoring Use of Natural Resources: Address key constraints to monitoring of use
of natural resources and the environment.
• Education and Information: Increase people-oriented approaches to sustainable use
and management of natural resources.
• Natural Resources Conservation: Prepare and implement a strategy for the
conservation of natural resources (MADER 2004, 80–83).
In addition to identifying these action areas, ProAgri II provides an illustrative,
but lengthy, list of targets and milestones for the institutional reforms and program
activities that must be completed during the 2005–2009 period to accomplish MINAG’s
mission (MADER 2004).
As written, ProAgri II makes good on MINAG’s goal of shifting its focus to
interventions that meet directly the needs of private-sector participants in agriculture and
agri-business. With its focus on interventions in multiple sectors related to but distinct
from traditional agriculture—such as finance, tax and other economic policies, rural
infrastructure and human capacity building, and market development—ProAgri II also
challenges MINAG to forge relationships and work in concert with a wide range of
public and private institutions. Without doubt, implementation of ProAgri II will be a
severe test for MINAG, with the principle question among most stakeholders being
whether the ministry has the human and financial resources necessary to make ProAgri II
a success.
5 “Cadastre is the [Mozambican] land registration procedure and archives. All land [in Mozambique] is public and there is a government body in the Ministry of Agriculture responsible for land allocation to businesses and individuals based on land laws and regulations. Development of a land cadastre is an attempt to update procedures, information technology and appropriate infrastructure to host the land allocation services and database” (Xavier 2005).

Investing in Africa’s Future Final Report
A-72
Overview of Public Investment in Mozambican Agriculture
Though Mozambique’s PRSP gives agriculture a central place in the country’s
development strategy, public resources are scarce and agriculture competes with other
sectors that have high priority in the PRSP, most notably education and health. According
to Mozambique’s PRSP Progress Report, spending on agriculture and rural development
under the PRSP amounted to about $94 million,6 which was about 6.6% of total
government spending (Mozambique 2004). This compares to 18.5% and 13.8% for
education and health, respectively.
Mozambique is heavily dependent on external assistance to fund the budget of the
national government, including making the necessary public investment in the
agricultural sector. Overall, about half of the government’s budget is funded by external
donors. According to the Organisation for Economic Co-operation and Development
(OECD) (Table 1), external assistance to Mozambique from all sources for all purposes
totaled about $1.03 billion in 2003, or about 25% of Mozambique’s national income, with
the top four donors being France, Italy, the World Bank’s International Development
Association, and the United States. Funding for education, health and population, and
other social services was just over 25% of the total, while economic infrastructure and
services and production garnered about 10%. Debt relief accounted for nearly 50% of
total external assistance (Table 1).
As reported through the OECD’s Creditor Reporting System, bilateral assistance
from the OECD countries (including the United States) averaged $1 billion annually from
2000 through 2003, with reported funding for core agriculture, forestry, and rural
development purposes averaging about $47 million annually (Table 2). Reported OECD
country funding for road transport averaged $20.4 million over the period, but the data do
not specify whether the assistance was for rural or urban road transport.
With respect to agriculture, MINAG reports that nearly 60% (or $63.1 million) of
the $108.3 million it spent over four years (1999–2002) to implement ProAgri I was
funded by external donors, including the United States, eight European donors, the World
Bank, the International Fund for Agricultural Development (IFAD), and the United
6 Based on an assumed meticais exchange rate of 20,000 Mt to one U.S. dollar.

Investing in Africa’s Future Final Report
A-73
Nations Development Bank. External contributions rose from $4.9 million in 1999 to
$31.4 million in 2002 (MADER 2004).
For implementation of ProAgri II, MINAG projects an implementation budget of
$275.2 million over the five-year period from 2005 through 2009, rising from $46.7
million in 2005 to $55.3 million in 2009. MINAG does not state in the ProAgri II strategy
document how much of this budget it expects donors to fund, but it does assume that
donors “will welcome and support the new ProAgri approach” (MADER 2004, 178).
The funding for ProAgri I and ProAgri II is only part of the public investment
being made in Mozambican agriculture. Importantly, Mozambique’s government invests
in roads, which are essential to agricultural development. In 2003, spending for roads
totaled about $104 million or 7.3% of government spending (Mozambique 2004).
Moreover, according to the director general of the National Roads Administration,
external donors have committed $1.7 billion over ten years (beginning in 2002) to road
construction, much of which will directly benefit agricultural development (Mabombo
2005).
Beyond these investments in roads and support to the government for
implementation of the ProAgri II strategy, much of the bilateral donor assistance for
agricultural development comes in the form of direct support for specific projects
typically implemented by foreign-based non-governmental organizations (NGOs) or for-
profit consulting firms. In the period 2000–2002, when total donor funding for ProAgri I
averaged $21.5 million annually, funding by OECD members for core agriculture,
forestry and fishery, and rural development purposes averaged about $47 million (Table
2).
Finally, significant public investment in Mozambican agriculture also comes from
the multilateral development organizations, including:
• The World Bank. The World Bank portfolio in Mozambique includes 22 active
projects with a commitment value of about $954 million. These projects involve
health, education, infrastructure, governance, and other sectors related to achieving
the goals of the bank’s Country Assistance Strategy for Mozambique, which include
improving the investment climate and strengthening the capabilities and
accountability of public institutions (World Bank 2003). Three active World Bank

Investing in Africa’s Future Final Report
A-74
projects relate directly to agriculture with a value of about $31.4 million, most of
which supports MINAG’s implementation of ProAgri II (Table 3). In addition, the
bank has been a major funder of road construction and rehabilitation, including an
active project for road and bridge construction and maintenance valued at $162
million that is part of the overall road program noted earlier.
• Food and Agriculture Organization. In 2004, FAO was involved in 28 active, mostly
multi-year projects in Mozambique, with a total FAO contribution valued at $22.2
million (FAO 2005). FAO’s projects focus primarily on improving productivity and
food security at the household level, but they involve a wide range of activities,
including training, fostering access to needed inputs, and improving irrigation and
market linkages for smallholders.
• International Fund for Agricultural Development. The IFAD is financing four
ongoing projects in Mozambique with loans totaling approximately $70 million
(IFAD 2005). The projects are: 1) support for artesian fishermen to improve and
diversify their fishing techniques and improve their incomes; 2) a seven-year project
to increase participation of smallholder farmers in the market economy on more
favorable terms; 3) a family sector livestock program; and 4) a program to foster
agricultural and rural development in the Niassa District.
• African Development Bank (ADB). In 2003, ADB loans and grant disbursements in
Mozambique totaled 21.1 UA or approximately $31.6 million (ADBG 2005). While
agriculture is a priority sector for investment in the ADB’s strategic plan, project- and
sector-specific information was not available for this report.
It is impossible to determine precisely the total amount of annual public
investment in Mozambican agriculture, whether from domestic or external sources, due
to the lack of any standardized definition or reporting system for such investment and the
fact that many projects are funded on a multi-year basis. Nevertheless, for the sole
purpose of putting U.S. assistance in context, a reasonable approximation of the annual
public investment in agricultural development is $150–200 million, taking into account
MINAG’s anticipated spending on ProAgri II, annual bilateral assistance from OECD
countries, and multilateral commitments (assuming an average three-year project life).

Investing in Africa’s Future Final Report
A-75
This does not include the investment in roads that is expected to average about $170
million per year beginning in 2002.
The U.S. Assistance Program for Agriculture in Mozambique
The U.S. agricultural development program in Mozambique is best understood in the
context of the overall U.S. assistance program in the country. The United States is one of
Mozambique’s largest bilateral donors, ranking consistently among the top five donor
countries (Table 1). Since FY2000, total U.S. bilateral assistance to Mozambique from all
agencies for all purposes has averaged about $85 million per year (excluding the $48
million in debt forgiveness that occurred in 2002) (Table 2). More than 75% of this
assistance is funded and managed through USAID, with the balance coming through the
Centers for Disease Control and Prevention, the U.S. Department of Agriculture (USDA),
the Peace Corps, the State Department, and the Department of the Interior.
In the fiscal years 2000–2004, the total annual USAID appropriations targeted
specifically to assist Mozambique averaged about $65 million, including a high of $73.6
million in FY2000 and an appropriation of $58.8 million in FY2004 (Table 4). USAID’s
FY2005 budget request for Mozambique was $56.9 million and the sixth largest in the
Africa region (USAID 2005). These figures do not include funds appropriated for the
Economic Growth, Agriculture, and Trade and the Africa regional programs that may
have been used for activities in Mozambique.
USAID’s Strategy for Agriculture
USAID plays by far the largest role in Mozambican agriculture among U.S. agencies and
has the most fully developed agriculture strategy. USAID’s overall development strategy
in Mozambique, including its strategy for agriculture, is described in the mission’s
Mozambique Country Strategic Plan (CSP) FY2004–2010 (USAID 2003). The CSP
includes five strategic objectives: Rapid Rural Income Growth Sustained in Target Areas;
Labor-Intensive Exports Increased; Increased Use of Child Survival and Reproductive
Health Services in Target Areas; Transmission of HIV Reduced and Impact of the AIDS
Epidemic Mitigated; and Municipal Governance Increasingly Democratic.

Investing in Africa’s Future Final Report
A-76
In its overall country strategy, the Mozambique Mission emphasizes collaboration
with the government of Mozambique and notes that all five of its strategic objectives
contribute to one or more of Mozambique’s six PRSP objectives. The strategy document
describes the participatory planning process, involving both government and NGO
development partners, through which the strategy was developed, and the close working
relationship the mission has with other donors and with ProAgri (USAID 2003).
The mission’s strategic objectives related to HIV/AIDS and maternal and child
health are important in the USAID strategy, consuming about 45% of the non-food aid
assistance allocated to Mozambique in FY2004. However, Rapid Rural Income Growth
Sustained in Target Areas, the strategic objective related to agriculture, is singled out as
the mission’s priority strategic objective, “highlighting the over-arching importance of
the agriculture sector to Mozambique’s economic growth and poverty reduction goals”
(USAID 2003, 1).
The mission justifies this focus on agriculture on the basis of the priority
Mozambique accords agriculture and rural development in its poverty-reduction strategy,
Mozambique’s potential comparative advantage in agriculture, and the reality that:
…it would be impossible to address the problems of poverty and malnutrition
without addressing agricultural development and growth given that more than
80% of the population is engaged in agriculture. The fact that this huge proportion
of the population accounts for approximately one-quarter of GDP demonstrates
that poverty is predominately, though not exclusively, rural in nature. (USAID
2003, 8)
Like Mozambique’s strategy for agriculture, the mission’s strategy is strikingly
market-oriented. The development hypothesis is that poverty is best reduced not just by
increasing the productivity of subsistence farmers but through the combination of
increased production and marketing in the agriculture sector. Thus, a pervasive theme of
the agriculture strategy is the need to link farmers with markets and harness market forces
to drive increased production. The near-term goals of the strategy for agriculture
(intermediate results in USAID terms) are expressed as:

Investing in Africa’s Future Final Report
A-77
• Increased smallholder sales of agricultural production, with illustrative activities
including:
o Improved research and extension for Mozambique’s smallholders;
o Improving the policy and regulatory environment for private sector-led
growth in agriculture;
o Capacity building to analyze and implement progressive and gender-aware
agricultural growth policies;
o Training of smallholders in application of improved technologies and use
of drought resistant crops; and
o Initiatives to secure lucrative markets, such as through contract farming.
• Expanded rural enterprises, including rural trading networks, rural agro-industries,
and rural finance, with illustrative activities including:
o Development of farmers’ associations and other farmer-owned marketing
infrastructure such as warehouse capacity;
o Support of business development services, including business plan and
new market development, adoption of appropriate technologies, and
certification and other measures
to comply with buyer and international standards;
o Supporting the financial sector in making financial products available at
less cost; and
o Pilot activities with creative financing tools for smallholders, such as
group lending, technical assistance to borrowers, and innovative insurance
tools.
• Increased marketing due to improved transport infrastructure, focusing on rural
roads to increase physical access to markets and reduce costs, with illustrative
activities including:
o Test pilots for private sector road maintenance concessions;
o Building capacity of local firms to maintain secondary and tertiary roads
with labor intensive methods; and
o Rehabilitating key primary and secondary roads (USAID 2003).
Investing in Africa’s Future Final Report
A-78
In keeping with the strategy’s market-orientation and the reality of finite
resources, its program activities will be targeted geographically and will “focus on the
provinces and districts most successful in attracting private investment” (USAID 2003,
12) based on criteria such as an existing agricultural production base, existing rural
enterprises, current or planned market infrastructure (especially roads), local buy-in and
commitment, and relatively high poverty levels. The goal of this targeting is to
demonstrate in practice the necessary conditions for growth and develop models that can
be adapted and applied elsewhere.
USAID’s Agricultural Development Program
USAID’s agricultural development assistance for Mozambique is funded and managed
primarily through the USAID Mission in Maputo out of its Development Assistance
(DA) and PL 480 Title II accounts. The other major account through which the activities
of the USAID Mission in Mozambique are funded is Child Survival and Health (CSH).
As indicated in Table 4 and Figure 1, the Development Assistance account is the largest
of the three, though it has declined in the FY2000–2004 period from a high of $37.6
million in FY2000 to $24.3 million in FY2004. PL 480 Title II funding has also declined
from $23.6 million in FY2000 to $14.9 million in FY2004, with a FY2005 request of
$18.8 million. In contrast, funding for the CSH account over the same period has
increased from $11.95 million in FY2000 to $19.7 million in FY2004.
Within the DA account, it is important to focus on the specific sectoral allocations
that are used to support agriculture’s role in economic development and poverty
reduction, namely agriculture, economic growth, and environment (with funding for the
Initiative to End Hunger in Africa [IEHA] coming online in 2003 as a sub-component of
the agriculture sector). Since FY2002, the agriculture-related sectors have comprised
more than 93% of the DA account (Table 4). Funding for these sectors in Mozambique
declined by about 23% from FY2000 to FY2004 (from $29.5 million to $22.8 million),
even with the initiation of IEHA funding in Mozambique in FY2003.

Investing in Africa’s Future Final Report
A-79
Use of Development Assistance Funding for Agriculture
1. Recent Funding of Agricultural Development
While the mission receives its DA funding allocation from Washington in the four sub-
categories shown in Table 4 and Figure 1, USAID allocates and reports its DA resources
to agriculture and other sectors through the strategic objectives laid out in its strategic
plan for Mozambique. The primary strategic objective applicable to agricultural
development is Rapid Rural Income Growth Sustained in Target Areas (SO 656-006),
which was initiated with the new strategic plan in FY2003. The predecessor strategic
objective primarily focused on agriculture was Increased Rural Incomes (SO 656-001),
which was initiated in FY1996. Funding for these agriculture-related initiatives has
declined from $25.2 million in FY2000 to $15.9 million in FY2004 (Table 5).
The mission also has funded in the FY2000–2004 period strategic objectives
related to the overall enabling environment for private-sector-led growth and
development (FY2000–2003) and for exports (FY2003–2004) at levels ranging from $2.5
million to $7.1 million (Table 5). These initiatives are intended to benefit the
Mozambican economy broadly but certainly will benefit agricultural producers and
exporters to some extent.
Taking into account the funding of all five strategic objectives currently in effect
in USAID’s Mozambique Mission, approximately 44% of the funding appears to be used
for purposes related to fostering agriculture’s role in economic growth and poverty
reduction (Figure 2).
2. Current Activities in the Primary Agriculture Strategic Objective
The activities USAID is funding in its primary agriculture strategic objective (Rapid
Rural Income Growth Sustained in Target Areas) fall into three major intermediate
results sub-categories (USAID 2005). The first, funded at a level of about $7 million in
FY2004 (out of the $15.9 million allocated to this strategic objective) is intended to
increase smallholder sales of agricultural products by increasing productivity through the
training of farmers in crop diversification, improved storage of products, and sound
environmental management practices. In 2004, this involved projects implemented by
Save the Children Federation, Food for the Hungry International, Adventist Development
Investing in Africa’s Future Final Report
A-80
Relief Agency, CARE, World Vision International, Africare, and Michigan State
University (USAID 2005).
This first sub-category of activity also includes direct budget support for ProAgri
(de Voest 2005). A total of $2 million was programmed for this purpose in FY2004,
which was down from the $5 million in direct support that the Mozambique Mission had
provided to MINAG and ProAgri annually from 2000 through 2003.
The second sub-category of activity under the Rapid Rural Income Growth
Sustained in Target Areas strategic objective is intended to expand rural enterprises
through partnerships with private traders, financial institutions, and processors of
agricultural commodities. This activity, which was funded in FY2004 at the level of $4.5
million, involves working with selected rural enterprises, such as cashew processors, to
provide technical and business skills training and financial support to support value-
added enterprises and the creation of trading networks and other vehicles for linking
agricultural producers to markets (USAID 2005). Principal implementers were
ACDI/VOCA, TechnoServe, and CLUSA.
The third sub-category of activity under Rapid Rural Income Growth Sustained in
Target Areas involves improving transport infrastructure, for which $4.4 million was
allocated in FY2004 (USAID 2005). This money was used to improve local capacity to
construct and maintain roads by providing technical and management training to local
firms.
3. Current Activities in the Broader Growth and Export Strategic Objectives
The Labor-Intensive Exports Increased strategic objective is a continuation of efforts
begun by the mission in 1996 to improve the enabling environment for private sector-led
growth and development. The current program, funded in FY2004 at a level of $7.1
million, devotes about half of its resources to working with government and industry to
improve trade policy and the legal framework for trade, promote public–private
partnerships, and reduce the red tape that can impede access to export markets (USAID
2005). This involves working with contractors, primarily Nathan and Associates, Booz-
Allen & Hamilton, the Confederation of Mozambican Business Associations, and the

Investing in Africa’s Future Final Report
A-81
Mozambican Ministry of Industry and Commerce. While not targeted to agriculture, this
activity will likely benefit agro-industrial exporters.
The other half of the resources for the Labor-Intensive Exports Increased strategic
objective is used to work with specific labor-intensive enterprises to help them enter and
succeed in domestic and international markets (USAID 2005). This work is aimed at the
manufacturing sector and is relevant to agriculture only to the extent that agribusiness
enterprises are selected. The primary contractor is TechnoServe.
Use of PL 480 Title II Food Aid Resources for Agricultural Development
A significant portion of the overall U.S. investment in agricultural development in
Mozambique is financed through development (non-emergency) food aid from USAID
and USDA, which is channeled through private voluntary organizations (PVOs) working
in the country. These organizations use the proceeds from the sale (monetization) of the
commodities to carry out their projects involving agriculture, health, education, and other
needs. Determining the dollar amount of the food aid resource that is applied to
agriculture requires considering both USAID and USDA non-emergency food aid flows
through USAID’s Title II program (Food for Peace) and USDA’s 416(b) and Food for
Progress programs, related cash assistance to the PVOs through section 202(e) of PL 480,
and estimates of the percentage of each PVO’s program that is devoted to agricultural
development.7
The USAID-managed Title II food aid is discussed in this section. The USDA
food aid program is discussed in the next section.
1. Funding
During the period FY2000–FY2004, the value of USAID’s Title II non-emergency food
aid shipments to Mozambique averaged $17.6 million annually, including freight costs
from the United States (Table 6). Excluding freight costs, the value of the commodities
themselves averaged $11.7 million. Total payments under section 202(e) to all food aid
7 The development food aid reported here does not include USAID or USDA food aid contributions to the U.N.’s World Food Programme, which are used predominately for emergency feeding, or the USDA contributions for the Food for Education program.
Investing in Africa’s Future Final Report
A-82
PVOs working in Mozambique averaged $1.07 million per year. As many as six
cooperating sponsors (CSs) have been managing Title II food aid programs in
Mozambique over the period 2000–2004. All have been involved in agricultural
development to some extent but with the level of activity varying from year to year and
ranging from 49% to 100% of their programs in Mozambique (Bogart 2004). Based on
USAID’s reported estimates, the share of overall Title II non-emergency food aid used
for agriculture in Mozambique from FY2000 through FY2004 averaged 76%.
Thus, if freight costs are included, Title II food aid-financed agricultural
assistance for Mozambique from FY2000 through FY2004, including 202(e) payments,
averaged $14.3 million annually, with the levels ranging from $10.7 million in FY2003 to
$19.8 million in FY2001 (Table 6). The trend, however, is downward, with the FY2004
level of $13.7 million being 13% lower than the FY2000 level. If freight costs are
excluded, U.S. agricultural assistance in Mozambique financed by Title II food aid
averaged $9.8 million annually.
2. Title II-Funded Activities
The principal PVOs managing food aid-financed projects in Mozambique are World
Vision, CARE, Africare, Family Health International, Save the Children, and the Adventist
Development and Relief Agency International (ADRA) (Bogart 2004). World Vision has by far
the largest Title II program in Mozambique, accounting for about 60% of total Title II
resources in FY2004 (or $8.4 million including freight), and its program is illustrative of
the trend in use of Title II funds (Bogart 2004).
Like USAID-managed food aid programs in general, the World Vision program is
focused on the goal of food security as called for by USAID’s 1995 food aid policy
statement (USAID/FFP 1995). It is also responsive to the market-oriented approach to
agricultural development embodied in Mozambique’s PRSP and the USAID Mission’s
agriculture-related strategic objective. It thus seeks to improve food security primarily by
pursuing the same combination of increased crop production and better linkages of
farmers to markets being pursued in the mission’s DA-funded projects. The Food for
Peace program estimates that in FY2004, 80% of the food aid resource provided to World

Investing in Africa’s Future Final Report
A-83
Vision was used for agricultural purposes and 20% for health and nutrition (World Vision
2001).
The World Vision program operates in 14 districts in two provinces. Planned
agriculture-related activities, as outlined in its Development Activity Program (DAP)
Proposal, include: 1) providing extension services to boost production of both food crops
(such as cassava) and cash crops (such as cashews); 2) working to improve soil fertility
and natural resource management in general; 3) improving MINAG’s extension program
and its linkages to research; 4) supporting farmer associations and training to increase
business skills and marketing opportunities for local farmers; and 5) improving market
access by rehabilitating roads and building the capacity of local contractors to carry out
labor-intensive road construction and rehabilitation projects (World Vision 2001).
The World Vision program’s health and nutrition activities address food security
by focusing on nutrition education to reduce malnutrition among children under five and
on HIV/AIDS awareness to reduce the prevalence of the disease and its impact on
productivity in the agricultural sector (World Vision 2001).
CARE’s FY1997–2001 Title II program in Mozambique includes an agricultural
module and a health module (CARE 1996). The agriculture component, “Viable
Initiatives in the Development of Agriculture,” consists of a Sustainable Agriculture
Component (SAC) and a Sustainable Oil Enterprises Component (SOEC). The goal of
the SAC is to “increase overall rural small-holder agricultural production, productivity,
and marketing” in five districts through activities such as training agricultural extension
agents, improving access to and storage of seeds, and promoting small-scale marketing of
agricultural products (CARE 1996, 2). The SOEC involves oilseed press and production
activities in Nampula Province.
Africare’s FY2002–2006 Title II program, the “Manica Expanded Food Security
Initiative,” focuses on two sub-objectives: 1) increasing food production and marketing
services; and 2) improving household nutrition practices and associated health services
including attention to HIV/AIDS in Manica Province (Africare 2001, 5). Key activities
under the first sub-objective include increased access to extension services and
information on agricultural best practices as well as facilitation of marketing and
augmented agricultural production through improved access to agricultural inputs. Some

Investing in Africa’s Future Final Report
A-84
of this increased agricultural production is intended to contribute to better nutrition for
women and children, a main activity under the second sub-objective (Africare 2001).
Unlike the other Title II programs in Mozambique, the FY1997–FY2001 Save the
Children and ADRA Title II DAPs emphasized rural infrastructure rehabilitation among
other objectives (SCF n.d.; ADRA 1996); however, infrastructure development is not an
explicit objective or intermediate result of the 2001–2005 Save the Children DAP (SCM
2003). Under the current Save the Children program, food consumption and household
farming systems are to be improved through sustainable technologies and nutrition
practices such as disease resistant/tolerant crops, expanded market linkages, and
improved storage and processing of agricultural products (SCM 2003).
The final evaluation of ADRA’s FY1997–2001 Title II program reports increased
incomes among participating farmers in Maganja da Costa, Zambezi Province, resulting
from increased agricultural production (ADRA 2001). In addition to road infrastructure
rehabilitation, the ADRA program sought to foster increased agricultural production
through nurseries, outplanting, training, on-farm demonstrations, research, market-
enhancement, commercialization, and producer association activities related to cashew,
fruit tree, and vegetable cultivation (ADRA 2002).
USDA’s Agricultural Development Activities in Mozambique
Non-Food Aid Activities
Beyond food aid, USDA has no appropriation specifically for agricultural development
assistance in Africa but USDA employees provide technical assistance and manage
programs that are funded by USAID through the International Cooperation and
Development (ICD) Program in USDA’s Foreign Agricultural Service. Ten USDA
agricultural advisors are on reimbursable details at USAID working on the Presidential
Initiative to End Hunger in Africa.
In addition, USDA funds occasional projects that relate to agricultural
development in specific African countries through ICD’s Food Industry Division and
Scientific Cooperation Research Program amounting to about $1 million annually across
the continent (Brown 2005). Projects of this kind that have some connection with

Investing in Africa’s Future Final Report
A-85
Mozambique include the Cochran Fellowship Program, which in FY2003 gave 15
Mozambican scientists two to six weeks of agricultural training in the United States and
collaboration with USAID to foster agricultural trade in Mozambique and other East and
Southern African countries by improving transportation management, developing
common agricultural standards, and enhancing public–private collaboration.
Food Aid for Agricultural Development Purposes
In resource terms, USDA’s largest contribution to agricultural development in Africa
comes through its management of food aid programs, including the Food for Progress and
the 416(b) program.
1. Funding
USDA’s 416(b) expenditures and Food for Progress shipments of development food aid
are generally on a smaller scale than the values associated with USAID’s Title II Food
for Peace Program. In Mozambique from FY2000 to FY2004, 416(b) and Food for
Progress combined averaged about $5 million per year, including estimated freight costs,
ranging from zero in FY2002 to $9.1 million in FY2003. The FY2004 value was $4.6
million including freight (Table 6).
It is important to note that in contrast to USAID, USDA’s tables reporting the
values of its Food for Progress and 416(b) commodity allocations do not include the cost
of freight. Freight costs normally comprise about one-third of the total value of a food aid
shipment. Thus, as reflected in Table 6, the estimated freight-inclusive value of the
USDA food aid allocations is about 50% greater than the values reported in the USDA
food aid tables. Excluding freight, the value of USDA shipments of 416(b) and Food for
Progress food aid averaged $3.3 million annually over the five-year period.
As a general rule, Food for Progress resources are used for agriculture-related
projects, while 416 (b) resources are used for a range of purposes, including agriculture,
education, HIV/AIDS, and other health purposes (Rubas 2005). USDA does not provide
project-by-project estimates of the percentage of food aid resources that is devoted to
agriculture or other purposes. The working assumption for the purpose of this report is
Investing in Africa’s Future Final Report
A-86
that 100% of Food for Progress resources and 50% of 416(b) resources are used for
agricultural purposes.
On this basis, the USDA-managed food aid resources made available in
Mozambique for agricultural development purposes in the FY2001–2004 period averaged
$4.8 million per year with freight costs included and $3.2 million without freight costs
included (Table 6).
2. Activities
The predominant agricultural use of USDA-managed food aid in Mozambique during
FY2000–FY2004 was to support rural credit programs (Rubas 2005). In addition, smaller
amounts of assistance were provided to support HIV/AIDS education and the training of
primary school teachers.
Other United States Agencies
African Development Foundation
No ADF projects were reported in Mozambique for agricultural development or other
purposes in the FY2002–FY2003 ADF annual report, which is the most current source of
readily available information on ADF activities (ADF 2003).
Trade and Development Agency
No Trade and Development Agency projects are reported in Mozambique during the
FY2000–FY2004 period (OECD n.d.; USTDA 2004).
Trends in Bilateral U.S. Agricultural Development Assistance in Mozambique
The great majority of U.S. agricultural development assistance for Mozambique is funded
through the USAID Development Assistance account or through the USAID and USDA
food aid programs (Table 7). Total funding through these vehicles has fluctuated over the
five-year period of FY2000–FY2004 within the range $49.5 million and $30.9 million,
with the changes year-to-year being affected by variations in both DA and food aid

Investing in Africa’s Future Final Report
A-87
funding levels. Overall, the level of bilateral U.S. assistance for agricultural development
in Mozambique is substantially lower in FY2004 than it was in FY2000.
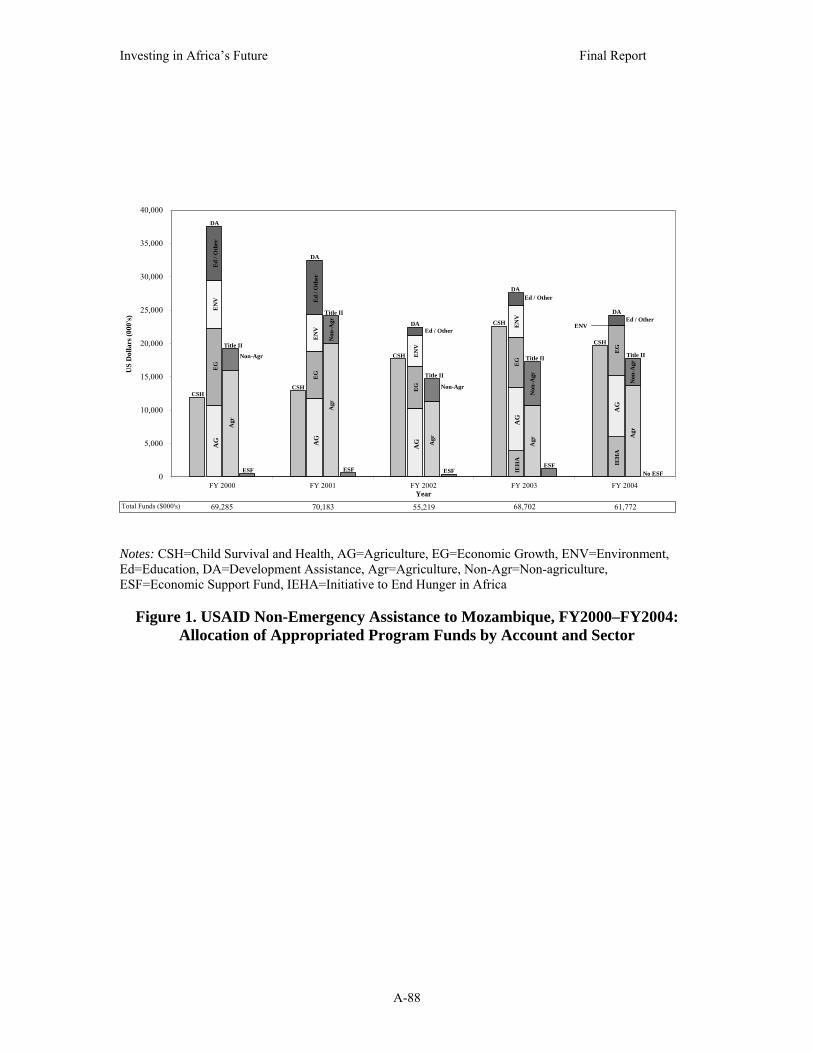
Investing in Africa’s Future Final Report
A-88
Notes: CSH=Child Survival and Health, AG=Agriculture, EG=Economic Growth, ENV=Environment, Ed=Education, DA=Development Assistance, Agr=Agriculture, Non-Agr=Non-agriculture, ESF=Economic Support Fund, IEHA=Initiative to End Hunger in Africa
Figure 1. USAID Non-Emergency Assistance to Mozambique, FY2000–FY2004:
Allocation of Appropriated Program Funds by Account and Sector
0
5,000
10,000
15,000
20,000
25,000
30,000
35,000
40,000
FY 2000 FY 2001 FY 2002 FY 2003 FY 2004Year
US
Dol
lars
(000
's)
CSH
DA
Title II
ESF
DA
DA
DA
DA
CSH
CSHCSH
CSHTitle II
Title II
Title II
Title II
ESF
AG
EG
ENV
IEH
A
Ed / Other
Ed
/ Oth
er
Ed
/ Oth
er
Ed / Other
Ed / Other
EN
V
EN
V
EN
V
EN
V
EG
EG
EG
EG
AG
AGA
G
AG
Agr
Agr
Agr
Agr
Agr
ESF No ESFESF
Non-Agr
Non
-Agr
Non
-Agr
Non-Agr
Non
-Agr
Total Funds ($000's) 70,18369,285 55,219 68,702 61,772IE
HA

Investing in Africa’s Future Final Report
A-89
HIV/AIDS23%
Rural Incomes (100% Agriculture-related)
36%
Exports (Agriculture-related)
8%
Exports (non-Agriculture-related)
8%
Maternal and Child Health22%
Municipal Governance
Figure 2. USAID Mozambique Strategic Objective Funding Distribution, FY2004

Investing in Africa’s Future Final Report
A-90
Table 1. Aid at a Glance: Mozambique
Source: Aid Statistics, Recipient Aid Charts, Ghana, OECD Development Co-operation Directorate (OECD/DAC n.d.).

Investing in Africa’s Future Final Report
A-91
Table 2. OECD Agriculture-related Assistance to Mozambiquea as Reported to the OECD/CRS from all OECD Countries Combined, 2000–2003b (with U.S. contributions in parentheses)
Sector ($, thousands)
Year Core
Agriculturec Forestry & Fisheriesd
Rural Developmente
Road Transportf
Trade Policy &
Facilitationg Development
Food Aidh All Other Aid Total 2000 28,675 (10,715) 2,022 1,035 47,464 2,962 27,285 (20,017) 900,328 (56,343) 1,009,770 (87,075) 2001 41,356 (11,798) 8,708 (757) 10,222 6,495 264 (250) 38,965 (32,311) 596,503 (37,642) 702,512 (82,758) 2002 31,924 (1,872) 7,055 24,931 (16,656) 12,599 30 23,288 (14,880)1,613,444 (85,825) 1,713,270 (119,233) 2003 13,238 2,725 16,324 (7,146) 15,055 1 34,301 (28,421) 515,766 (54,760) 597,410 (90,327) Total 115,193 (24,385) 20,510 (757) 52,512 (23,802) 81,613 3,257 (250) 123,838 (95,629)3,626,041 (234,570) 4,022,963 (379,393) Notes: aRecipients included in our definition of sub-Saharan Africa (SSA) include individual SSA countries, “South of Sahara Unallocated,” and “Africa Unspecified.” bAll years (2000–2003) refer to calendar years. cCore Agriculture includes all purpose codes beginning with 311 (Agriculture) and purpose codes 32165 (Fertilizer Plants), 32267 (Fertilizer Minerals), 23070 (Biomass), and 32161 (Agro-Industries). dForestry & Fisheries includes all purpose codes beginning with 312 (Forestry) and 313 (Fisheries) along with purpose code 32162 (Forest Industries). eRural Development includes purpose code 43040 (Rural Development). 6Road Transport includes purpose code 21020 (Road Transport). fTrade Policy & Facilitation includes all purpose codes beginning with 331 (Trade). gDevelopment Food Aid includes purpose codes 52000 (Development Food Aid/Food Security Assistance) and 52010 (Food Security Programmes/Food Aid). Source: OECD CRS Online Database on Aid Activities (OECD n.d.).
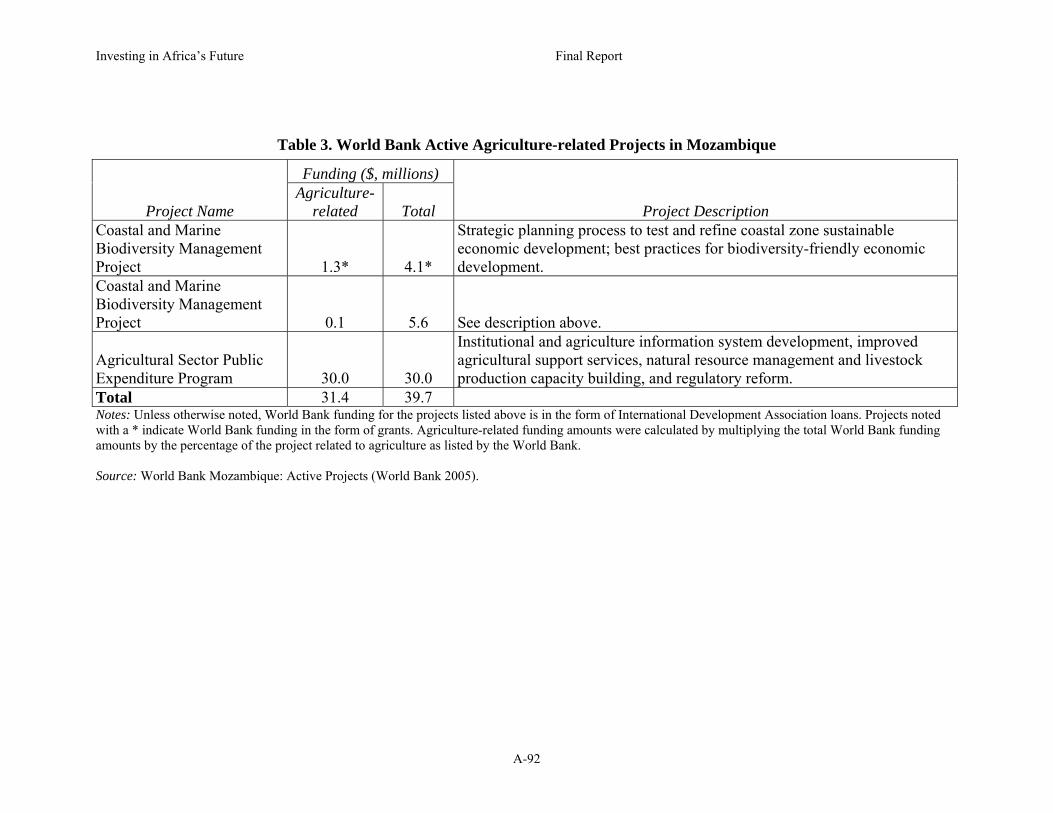
Investing in Africa’s Future Final Report
A-92
Table 3. World Bank Active Agriculture-related Projects in Mozambique
Notes: Unless otherwise noted, World Bank funding for the projects listed above is in the form of International Development Association loans. Projects noted with a * indicate World Bank funding in the form of grants. Agriculture-related funding amounts were calculated by multiplying the total World Bank funding amounts by the percentage of the project related to agriculture as listed by the World Bank. Source: World Bank Mozambique: Active Projects (World Bank 2005).
Funding ($, millions)
Project Name Agriculture-
related Total Project Description Coastal and Marine Biodiversity Management Project 1.3* 4.1*
Strategic planning process to test and refine coastal zone sustainable economic development; best practices for biodiversity-friendly economic development.
Coastal and Marine Biodiversity Management Project 0.1 5.6 See description above.
Agricultural Sector Public Expenditure Program 30.0 30.0
Institutional and agriculture information system development, improved agricultural support services, natural resource management and livestock production capacity building, and regulatory reform.
Total 31.4 39.7

Investing in Africa’s Future Final Report
A-93
Table 4. USAID Appropriation of Program Funds for Mozambique, FY2000-
FY2004 Appropriation ($, thousands)
Account FY2000 Actual
FY2001 Actual
FY2002 Actual
FY2003 Actual
FY2004 Actual
FY2005 Requested
Development Assistance Total 37,569 31,469 22,438 27,567 24,261 18,319 Agriculture 10,715 11,798 10,317 9,500 9,181 Economic Growth 11,552 7,042 6,269 7,534 7,481 Environment 7,200 5,467 4,591 4,733 100 IEHA 0 0 0 3,900 6,000 Child Survival & Health 11,950 12,953 17,677 22,601 19,700 19,730Economic Support Fund 500 600 400 1,250 0 0Total PL 480 Title II Non-Emergency 19,266 24,161 14,704 17,284 17,811
Non-Emergency Agricultural Use 15,883 19,933 11,309 10,736 13,674
Non-Emergency Non-Agricultural Use 3,383 4,228 3,394 6,548 4,137
TOTAL NON-EMERGENCY PROGRAM FUNDS 69,285 69,183 55,219 68,702 61,772 38,049
Total PL 480 Title II (Emergency + Development) 23,627 22,996 17,901 16,166 14,855 18,801
TOTAL PROGRAM FUNDS 73,646 68,018 58,416 67,584 58,816 56,850Notes: IEHA=Initiative to End Hunger in Africa. Source: USAID Congressional Budget Justifications (USAID various years) and personal communication with Fenton B. Sands, Chief, Economic Growth, Environment & Agriculture Division, Office of Sustainable Development, Bureau for Africa, USAID (Sands 2005).

Investing in Africa’s Future Final Report
A-94
Table 5. USAID Agriculture-related Strategic Objectives and Funding Levels, Mozambique, FY2000–FY2004
Source: Authors’ calculations, with data from USAID Congressional Budget Justifications-Ghana (USAID various years).
Funding ($, thousands)
Title Former Title % related to Agriculture FY2000 FY2001 FY2002 FY2003 FY2004
Total, FY2000–FY2004
656-001 Increased Rural Incomes
656-001 Increased rural income in focus area 100 25,177 18,840 17,910 6,329 0 68,256
656-004 Enabling Environment for Growth
656-004 Improved enabling environment for private sector-led growth and development
50(33-67)
2,210(1,459-2,961)
2,734(1,804-3,663)
1,634(1,078-2,189)
140(92-187) 0
6,718(4,433-9,000)
656-006 Rural Incomes 100 0 0 0 17,571 15,900 33,471
656-007 Exports 50
(33-67)0
(0)0
(0)0
(0)
1,119(739-
1,499)
3,550(2,343-4,757)
4,669(3,082-6,256)
Total 27,387(26,636-28,138)
21,574(20,644-22,503)
19,544(18,988-20,099)
25,159(24,731-25,586)
19,450(18,243-20,657)
113,114(109,242-116,983)

Investing in Africa’s Future Final Report
A-95
Table 6. U.S. Non-Emergency Food Aid Estimated Value Applied for Agricultural Development Purposes, Mozambique, FY2000–FY2004
Notes: * Calculated based on the assumption that freight costs consume one-third of the total value. ** Calculated based on estimates in USAID annual reports on non-emergency food aid of the percentages of each cooperating sponsor program in Mozambique that is devoted to agricultural development. Source: USAID Office of Food for Peace Annual Reports, FY2000–FY2004 (USAID/FFP various years) and the USDA/Foreign Agricultural Service web site (USDA/FAS n.d.).
Funding ($, thousands)
Allocation FY2000 FY2001 FY2002 FY2003 FY2004 Average Increase, FY2000– FY2004 (%)
USAID Title II Value With Freight 17,933 22,868 13,263 15,991 17,809 17,573 -1%
Title II Value w/o Freight* 11,961 15,253 8,846 10,666 11,879 11,721 -1%
202(e) Payment 1,333 1,293 1,441 1,285 0 1,070 --------USAID Total With Freight 19,266 24,161 14,704 17,276 17,809 18,643 -8%
USAID Total w/o Freight 13,294 16,546 10,287 11,951 11,879 12,791 -11%
% Used for Agriculture** 82% 82% 77% 62% 77% 76% -6%
Total USAID Agriculture Value With Freight
15,798 19,812 11,322 10,711 13,713 14,271 -13%
Total USAID Agriculture Value w/o Freight
10,901 13,568 7,921 7,410 9,147 9,789 -16%
USDA 416(b) Value* With Freight 0 0 0 1,340 794 427 --------
416(b) Value w/o Freight 0 0 0 893 529 284 --------
Food for Progress Value w/ Freight* 6,300 4,841 0 7,782 3,819 4,548 -39%
Food for Progress Value w/o Freight 4,200 3,227 0 5,188 2,546 3,032 -39%
Total USDA Agriculture Value With Freight
6,300 4,841 0 8,452 4,216 4,762 -33%
Total USDA Agriculture Value w/o Freight
4,200 3,227 0 5,635 2,811 3,175 -33%
TOTAL U.S. Agr. Value With Freight
22,098 24,653 11,322 19,163 17,929 19,033 -19%
TOTAL U.S. Agr. Value w/o Freight
15,101 16,795 7,921 13,045 11,958 12,964 -21%

Investing in Africa’s Future Final Report
A-96
Table 7. Bilateral U.S. Assistance for Mozambican Agriculture, Major Elements, FY2000– FY2004
Funding ($, thousands)
Program FY2000 Actual
FY2001 Actual
FY2002 Actual
FY2003 Actual
FY2004 Actual
USAID/Development Assistance Agriculture- Related Strategic Objective
27,387 21,574 19,544 25,159 19,450
USAID/Food Aid PL480 Title II* 15,798 19,812 11,322 10,711 13,713
USDA/Food Aid Food for Progress 6,300 4,841 0 8,452 4,216
Total 49,485 46,227 30,866 44,322 37,379Notes: * Includes 202(e) payments. All food aid values include freight costs. Source: Extracted from Tables 5 and 6.

Investing in Africa’s Future Final Report
A-97
References
ADBG (African Development Bank Group). 2005. Summary of Operations for the
Republic of Mozambique. http://www.afdb.org/en/country_operations/african_
countries/mozambique (accessed February 13, 2005).
ADF (African Development Foundation). 2003. Innovative Investments in Africa’s
Future: ADF Funded Projects Fiscal Years 2002–2003. http://www.adf.gov/
ADF200203report.pdf (accessed April 2, 2005).
ADRA (ADRA/Mozambique). 1996. Development Activity Proposal. P.L. 480 Title II.
ADRA. 2001. P.L. 480 Title II Project, 1997-2001, Final Evaluation Report.
ADRA. 2002. P.L. 480 Title II Project, 1997-2001, FY2001 Results Report & FY2003–
FY2004 Resource Request.
Africare (Africare/Mozambique). P.L. 480 Title II Manica Expanded Food Security
Initiative, FY2002–FY2006, Development Activity Proposal.
Bogart, Brian J. 2004. Personal communication from Brian J. Bogart, Results and
Information Reporting, USAID/FFP/AMEX International, to Michael Taylor,
Nov. 12.
Brown, Jocelyn. 2005. Personal communication from Jocelyn Brown, assistant deputy
administrator, ICD/FAS/USDA, to the authors, Feb. 4.
CARE (CARE/Mozambique). 1996. FY1997–2001 Mozambique/CARE Fact Sheet.
de Voest, Christine. 2005. Personal communication from Christine de Voest,
Rural Incomes Team Leader, USAID Mission to Maputo, Mozambique, to the
authors, Jan. 18.
FAO (Food and Agriculture Organization of the United Nations). 2004. The State of
Food Security in the World, 2004. Available from http://www.fao.org/
documents/show_cdr.asp?url_file=/docrep/007/y5650e/y5650e00.htm (accessed
June 20, 2005).
FAO. 2005. List of Operationally Active projects for all Organizational Units in
Mozambique by funding source. https://extranet.fao.org/fpmis/
FPMISReportServlet.jsp?sel_ country=MZ&div=&type=countryprofileopen
&language=EN&countryId=MZ (accessed June 25, 2005).

Investing in Africa’s Future Final Report
A-98
IFAD (International Fund for Agricultural Development). 2005. Approved Projects for
Mozambique. http://www.ifad.org/operations/projects/regions/PF/MZ_all.htm
(accessed February 13, 2005).
Mabombo, Joao David. 2005. Personal communication from Joao David Mabombo,
Director General, Administracao Nacional de Estradas, to the authors, Jan. 19.
MADER (Republic of Mozambique Ministry of Agriculture and Rural Development).
2004. Strategy Document ProAgri II.
Mozambique (Government of the Republic of Mozambique). 2001. Action Plan for the
Reduction of Absolute Poverty (2001-2005) (PARPA). http://www.imf.org/
External/np/prsp/2001/moz/01/043101.pdf (accessed June 29, 2005).
Mozambique. 2004. Review of the Economic and Social Plan for 2003.
http://www.imf.org/external/pubs/ft/scr/2004/cr04135.pdf
(accessed June 29, 2005).
OECD (Organisation for Economic Co-operation and Development). n.d. CRS Online
Database on Aid Activities. Available from http//:www.oecd.org/dac/stats/
idsonline (accessed April 3, 2005).
OECD/DAC (Organisation for Economic Co-operation and Development-Development
Co-operation Directorate). n.d. Aid Statistics, Recipient Aid Charts,
Mozambique. http://www.oecd.org/dataoecd/23/7/1882362.gif (accessed June 21,
2005).
Rubas, Debbie. 2005. Personal communication from Debbie Rubas, Agricultural
Economist, Programming Division, Export Credits, FAS/USDA, to the authors,
February 3.
Sands, Fenton B. 2005. Personal communication from Fenton Sands, Chief, Economic
Growth, Environment & Agriculture Division, Bureau for Africa, USAID, to the
authors, February 8.
SCF (Save the Children Federation). n.d. P.L. 480 Title II Development Activity
Proposal FY1997-FY2001 Food Security, Infrastructure Rehabilitation and
Community-Based Agriculture & Natural Resource Management Program in
Nacala-a-Vehla and Memba Districts, Nampula Province, Mozambique.
SCM (Save the Children/Mozambique). 2003. Fiscal Year 2003 Results Report for P.L.
Investing in Africa’s Future Final Report
A-99
480 Title II DAP Activity, Coastal Region Integrated Food Security Program,
Nampula Province, Mozambique.
USAID (U.S. Agency for International Development). n.d. USAID: Mozambique
Budget Page. http://www.usaid.gov/policy/budget/cbj2005/afr/mz.html (accessed
June 25, 2005).
USAID. 2003. Mozambique Country Strategic Plan FY2004–2010. http://www.usaid.
gov/locations/sub-saharan_africa/countries/mozambique/csp_
mozambique04-10.pdf (accessed June 25, 2005).
USAID. 2005. FY2005 Africa Congressional Budget Justification. Available from
http://www.usaid.gov/policy/budget/cbj2005/afr/ (accessed June 25, 2005).
USAID. Various years. Congressional Budget Justification–Mozambique. Available from
http://www.usaid.gov/ policy/budget/ (accessed March 30, 2005).
USAID/FFP (U.S. Agency for International Development/Office of Food for Peace).
1995. Food Aid and Food Security Policy Paper. Feb. 27. http://www.usaid.gov/
policy/ads/200/foodsec/foodsec.pdf (accessed March 25, 2005).
USAID/FFP. Various Years. Food for Peace Annual Reports, FY2000 to FY2004.
USDA/FAS (U.S. Department of Agriculture/Foreign Agricultural Service). n.d. Food
Aid Reports. Available from http://www.usda.fas.gov/excredits/FoodAid/Reports
reports.html (accessed July 25, 2005).
U.S. Department of State. 2004. Background Note: Mozambique. http://www.state.
gov/r/pa/ei/bgn/7035.htm (accessed on December 14, 2004).
U.S. Department of State. 2005. Background Note: Mozambique. http://www.state.
gov/r/pa/ei/bgn/7035.htm (accessed June 25, 2005).
USTDA (U.S. Trade and Development Agency). 2004. Annual Report. Available from
http://www.tda.gov/USTDA/About%20USTDA/eventspubs.htm (accessed March
30, 2005).
World Bank Group. 2003. Mozambique - Country Assistance Strategy, Vol. 1 of 1.
Available from http://www-wds.worldbank.org/servlet/WDS_IBank_Servlet?
pcont=details&eid=000012009_20040709092054 (accessed June 25, 2005).
World Bank Group. 2004. Mozambique Country Brief. Available from http://web.
worldbank.org/WBSITE/EXTERNAL/COUNTRIES/AFRICAEXT/0,,menuPK:2

Investing in Africa’s Future Final Report
A-100
58649~pagePK:158889~piPK:146815~theSitePK:258644,00.html (accessed
October 15, 2004).
World Bank Group. 2005. Mozambique: Active Projects. http://web.worldbank.org/
external/default/main?menuPK=382164&pagePK=141155&piPK=141124&theSi
tePK=382131 (accessed May 25, 2005).
World Vision. 2001. The Ovata Program Title II BHR/FFP Development Program
Proposal, FY02-FY06.
Xavier, Victorino. 2005. Personal communication from Victorino Xavier, Project
Director, Projecto Integrado de Desenvolvimento Agricola, to the authors, June
22.

Investing in Africa’s Future Final Report
A-101
Appendix 4-D U.S. Agricultural Development
Assistance in Uganda
By Michael R. Taylor, Julie A. Howard, and Nicole M. Mason1
Overview of the Economy, Agriculture, and Food Security in Uganda2
Britain granted Uganda self-rule in 1961 and formal independence was established in
1962 under the leadership of Milton Obote. In 1971, after having suspended the
constitution, Prime Minister Obote was removed from power in a military coup led by Idi
Amin Dada. Amin appointed himself president, granted himself absolute power, and led
an eight-year “reign of terror” that resulted in 100,000 Ugandans murdered and the
country’s economic and social structures in shambles. Amin was forced to flee Uganda in
1979 after his troops were repelled from Tanzania and the Tanzanian army and Ugandan
exiles took control of the capital, Kampala.
Human rights abuses continued under President Obote, who returned to power in
1980 after the short-lived presidencies of Yusuf Lule and Godfrey Binaisa. Obote was
ousted from power a second time in 1985, with coup leader General Tito Okello
assuming the presidency. Okello’s government opened negotiations with Yoweri
Museveni’s National Resistance Army (NRA), which had been leading an insurgency
since 1980. Diplomacy, however, proved unsuccessful and the NRA ultimately captured
Kampala, forcing Obote to flee, and installed Museveni as president in 1986. Museveni
1 Michael R. Taylor is a Senior Fellow at Resources for the Future in Washington, DC. Julie A. Howard is Executive Director of the Partnership to Cut Hunger & Poverty in Africa in Washington, DC. Nicole M. Mason is a graduate student in the Department of Agricultural Economics at Michigan State University. Peter Ngategize, National Coordinator of the MTCS Secretariat at the Ugandan Ministry of Finance, Planning and Economic Development, served as a consultant for this report. The authors acknowledge him for his contributions to their substantive understanding of the issues related to U.S. agricultural development assistance in Uganda and for facilitating their meetings with a broad cross section of government actors and private-sector stakeholders. 2 Information in this section is drawn from the U.S. Department of State’s “Background Note: Uganda” unless otherwise noted (U.S. Department of State 2004).

Investing in Africa’s Future Final Report
A-102
was reelected in 2001 for a five-year term; constitutional changes are being considered
that would eliminate term limits and allow Museveni to run again in 2006.
Under Museveni, human rights abuses have all but ceased, and Uganda has
adopted economic reforms and liberalization in partnership with the International
Monetary Fund and the World Bank. The country has experienced strong economic
growth in recent years, but previous years of low economic growth and civil strife
contributed to a poverty rate of 56% in 1992, which declined to 44% in 1997 and 34% in
2000 but rose to 38% in 2003 (MFPED 2000). Per capita gross domestic product (GDP)
for Uganda’s population of 26.4 million was $227 in 2003, and 82.2% of the population
lived on less than $1 a day at some point during the period 1990–2001 (UNDP 2003).
Income poverty disproportionately affects food crop farmers, who accounted for 62.2%
of those living in poverty in 1996 even though they made up just 44.2% of the population
(Uganda 2000a).
Uganda ranks among the low human development countries in the United
Nations’ Human Development Report, with an infant mortality rate of 86/1,000 in 2001
and a life expectancy of 44.7 years (UNDP 2003). The AIDS prevalence rate of 6.2% in
2002 (Uganda AIDS Commission n.d.), though lower than some other African countries
due to a strong prevention effort, contributes to the short life expectancy. School
attendance rates (89%) and literacy (70%) rates are high relative to other sub-Saharan
African countries.
In economic terms, the reforms under Museveni have produced some positive
changes. Investment as a percentage of GDP is up from 13.7% in 1999 to 20.3% in 2003.
Inflation has been brought under control to 5.1% after running as high as 240% in 1987.
Uganda’s abundant fertile land and natural resource endowment also offer the promise of
economic growth and development.
Ugandan exports in 2003 totaled $628 million, with the vast majority of export
revenues coming from coffee, tea, fish, vanilla, and horticultural products; electricity
made up the remainder of the export revenue. Other cash crops cultivated in Uganda
include cotton, tobacco, sugar cane, and cut flowers. Expansion of the cash crop sector
has been constrained by lack of technology and poor market access and infrastructure
(Uganda 2000a). The major food crops are bananas, corn, cassava, potatoes, millet, and
Investing in Africa’s Future Final Report
A-103
pulses. Livestock and fisheries also are important to the Ugandan economy and the food
security situation, with beef, goat meat, milk, Nile perch, and tilapia among the major
products. Industry in Uganda is predominately agriculture-related: 44.2% of households
work in the food crop sector (1996) and 26.7% of households engage in non-food cash
crop farming; manufacturing (3.7%), trade (6.9%), and government services (5.5%)
employ the remainder of the workforce (Uganda 2000a).
Hunger persists in Uganda despite its vast agricultural potential. The Food and
Agriculture Organization of the United Nations (FAO) estimates that in the years 2000–
2002, 19% of Ugandans were undernourished, meaning that their basic food energy needs
were not being met (FAO 2004).3 Although this is the lowest food insecurity rate among
East African countries and down from 26% in the period 1995-1997, there is room for
improvement. Elsewhere in Africa, Gabon and Mauritius have achieved
undernourishment rates of just 6%.
Uganda’s Governance Structure for Agricultural Development4
Uganda’s governance structure for agricultural development is shared among several
agencies, including Parliament, the Cabinet, and government ministries and agencies, and
follows elaborate processes guided by national laws and strategies. The Poverty
Eradication Action Plan (PEAP or Uganda’s PRSP) defines the overall development
objectives and priorities for the medium term (MFPED 2000). The PEAP is revised
regularly through a broad-based consultative process led by the Ministry of Finance,
Planning, and Economic Development (MFPED). Financing for the agricultural sector is
defined under the Medium Term Expenditure Framework (MTEF), which provides a
three-year expenditure plan from which annual budgets are defined (MFPED 2000).
3 The term “undernourishment” refers only to the failure to meet dietary energy needs and not to the problem of malnutrition, which includes the failure to consume the micronutrients, protein, and other dietary components needed for good health. Nevertheless, FAO uses undernourishment interchangeably with “food insecurity,” which FAO defines as the condition in which people in a society lack physical and economic access to the safe and nutritious food they need to thrive (FAO 2004). 4 Unless otherwise noted, information in this section is drawn from a personal communication with Peter Ngategize, Coordinator, MTCS Secretariat, Ministry of Finance, Planning and Economic Development, Uganda (Ngategize 2005b).

Investing in Africa’s Future Final Report
A-104
The annual budget process is guided by the Budget Act 2001, which provides for
the sequencing of the consultative processes. These processes begin with national
workshops attended by stakeholders, including the private sector and development
partners. Following the workshops, sector budget framework papers are developed and a
National Budget Framework Paper (BFP) is drafted. The BFP is discussed by the Cabinet
and then submitted to Parliament for review. By the time the budget is read in Parliament
by the minister of finance (normally in mid-June), inputs from key stakeholders have
been incorporated into the budget. After the reading of the budget, Parliament will have
the opportunity to formally approve the budget through parliamentary procedures.
Following a period of declining investment in the agricultural sector caused in
part by the sector’s poor performance, the Ugandan government initiated a sector review
and strategy development process with the participation of key stakeholders that resulted
in the formulation of the Plan for Modernisation of Agriculture (PMA) (Uganda 2000).
The PMA provides a framework for the revitalization of the agricultural sector. It
recognizes the need for a multi-sectoral approach to agricultural modernization, defines
stakeholder roles, and identifies priority areas for action.
Roles of Key Ministries and Agencies
The Ministry of Finance, Planning and Economic Development
The MFPED has the mandate of promoting economic development and ensuring macro-
economic stability, mobilization, and allocation of budgetary resources guided by the
PEAP.
The Ministry of Agriculture, Animal Industry, and Fisheries
The mandate of the Ministry of Agriculture, Animal Industry, and Fisheries (MAAIF)is
to support, promote, and guide the production of crops, livestock, and fisheries to ensure
improved quality and quantity of agricultural produce and products for domestic
consumption, food security, and export. The ministry, among others, formulates and
implements agricultural policies, laws, and regulations and provides technical guidance
and coordinates and monitors the implementation of agricultural development programs.

Investing in Africa’s Future Final Report
A-105
The Ministry of Tourism, Trade, and Industry
The Ministry of Tourism, Trade, and Industry’s mandate covers aspects of tourism and
trade (including trade negotiations and industrial development). It is a critical ministry in
Uganda’s economic development because of the importance of exports and tourism in
Uganda’s development strategy.
The Ministry of Water, Lands, and Environment
The mandate of the Ministry of Water, Lands, and Environment is to promote and ensure
the rational and sustainable utilization, development, and effective management of
Uganda’s natural resource base. It provides policy and technical guidance in the
implementation of related programs and projects.
Involvement of Donor Governments and International Agencies
Development partners are critical to Uganda’s agricultural development as they
contribute up to 75% of the funding for agricultural programs, including agricultural
extension and research, and provide technical support in program design and
implementation. Where funding to government programs is through the budget, their
involvement is of a general nature involving design and review of development strategies
and the budget process. In the design and implementation of specific projects, donors and
international organizations play bigger roles to varying levels, and at times projects may
be implemented with limited levels of transparency and participation of the local
institutions. This has implications for the level of ownership and leadership and,
consequently, the effectiveness of such support. To enhance local leadership and
ownership, the government encourages development partners to provide support through
the budget process, and several development partners have signed partnerships principles
to support this policy direction.
Participation of the Private sector (Including Civil Society Organizations)
The private sector is playing an increasing role in priority setting, design, and
implementation and monitoring of agricultural development programs. Private-sector

Investing in Africa’s Future Final Report
A-106
umbrella organizations such as the Uganda National Farmers Federation and the Private
Sector Foundation Uganda often participate in priority-setting planning fora and project
implementation and monitoring committees. The private sector increasingly is playing a
key role in providing leadership at project steering committee levels or as chairs of the
board of directors of various public institutions and agencies. Similarly, private-sector
entities, such as civil society organizations, are getting requests from government
agencies for oral or written views as inputs into program designs and reviews.
At the sector and commodity levels (e.g., fish, flowers, etc), clusters are gradually
forming and playing important roles in self-governance, product quality improvement,
enforcement of regulations, and policy advocacy.
The Role of Agriculture in Uganda’s Development Strategy
Uganda’s development strategy is described in its 1997 PEAP (MFPED 2000), which
was revised in 2004 (MFPED 2004). The revised PEAP is built on five pillars:
• Economic management;
• Enhancing production, competitiveness, and incomes;
• Security, conflict resolution, and disaster management;
• Good governance; and
• Human development (MFPED 2004).
Structural adjustment, including price liberalization, agricultural modernization,
and the expansion of smallholder agriculture, are described as preconditions for economic
growth and the realization of the five pillars of the PEAP. Price liberalization,
particularly for coffee, has already had a dramatic effect on poverty reduction and was
largely responsible for the 12% decrease in poverty during the period 1992–1997
(MFPED 2000). One goal of the PEAP is to reduce poverty to 10% of the population by
2017.
Economic growth is to be stimulated by macroeconomic incentives (i.e.,
economic openness to generate increasing incomes from agricultural modernization),
equitable and efficient collection and use of public resources (including reallocation of

Investing in Africa’s Future Final Report
A-107
expenditures to poverty-reducing services such as agricultural extension), and private
sector competitiveness (namely infrastructure development and contract reform)
(MFPED 2000). The economic growth goal set by the PEAP is 7% annual growth in the
GDP (MFPED 2000).
Although the PEAP provides a framework for sectoral activities, each sector,
including the agricultural sector, articulates its own plan. The major strategy document
for the agricultural sector is the PMA (Uganda 2000). Because more than 70% of
households are engaged in this sector, the PEAP describes the PMA as playing a central
role in poverty eradication (MFPED 2000). Indeed, the vision put forth in the PMA is
“poverty eradication through a profitable, competitive, sustainable and dynamic
agricultural and agro-industrial sector” (Uganda 2000, 27), and the plan’s mission is
“eradicating poverty by transforming subsistence agriculture to commercial agriculture”
(Uganda 2000, vi).
The specific objectives of the PMA are: 1) to increase incomes and improve the
quality of life of poor subsistence farmers; 2) to improve household food security; 3) to
provide gainful employment; and 4) to promote sustainable use and management of
natural resources (Uganda 2000, 28). The PMA details core areas for public action in
agriculture, or pillars, designed to achieve these objectives and targeted mainly at
subsistence farmers. They include:
• Research and technology;
• Agricultural advisory services;
• Agricultural education;
• Rural finance;
• Agro-processing and marketing;
• Sustainable natural resource utilization and management; and
• Physical infrastructure (Uganda 2000).
The strategies for achieving the PMA’s objectives and enhancing the PMA pillars
include: 1) decentralizing government and promoting the role of the private sector; 2)
increasing the availability and utilization of productivity-enhancing technologies; 3)
Investing in Africa’s Future Final Report
A-108
improving existing markets and creating new market opportunities; 4) fostering
partnerships among government, the private sector, and civil society; and 5) harmonizing
multi-sectoral interventions. These strategies envision the transformation of Ugandan
subsistence farmers and of the agricultural sector in general into more commercial,
competitive enterprises (Uganda 2000).
Within the agricultural sector, the private sector (including subsistence farmers)
plays an important role in the government of Uganda’s agricultural and overall
development strategies. In fact, the PMA describes the private sector as “the main engine
of growth” (Uganda 2000, viii). From agricultural extension, credit, and irrigation
infrastructure to agricultural production, marketing, and processing and wherever else
possible, government control is to be transferred gradually to the private sector.
Nonetheless, government will continue to lead the way in creating and
maintaining the policy framework and conditions conducive to the shift from subsistence
to commercial agriculture. Included in that policy framework are structural reforms such
as market liberalization and the dismantling of other barriers to trade (e.g., tariffs and
taxes on agricultural exports). The government also will spearhead efforts to bolster rural
road networks and support the privatization of rural electrification through “smart
subsidies” (Uganda 2000, xii). In addition to creating conducive policy and investment
climates, the government is committed to a medium-term focus on capacity building,
particularly in the areas of irrigation and water harvesting, micro-finance and risk
management, production, marketing and agro-processing infrastructure, and agricultural
education.
Another focus of the PMA is agricultural research and technology. Production-
enhancing technologies will help farmers increase production, which can be marketed to
generate greater income. Agricultural technology also has the potential to keep food
prices low, enabling the poor to get more for their money and also increasing the
competitiveness of Ugandan products in regional and world markets. According to the
PMA, the agricultural growth resulting from increased agricultural productivity will
“drive growth in other parts of rural areas” (Uganda 2000, vii).

Investing in Africa’s Future Final Report
A-109
Overview of Public Investment in Ugandan Agriculture
While the focus of this study is U.S. agricultural development assistance to Uganda, the
U.S. program is best understood in the context of overall public investment in Ugandan
agriculture, which is summarized in this section.
As used here, the term “public investment” refers to expenditures by the
government of Uganda or by external donor governments and multilateral institutions.
Public investment in agriculture includes expenditures that have as a primary purpose
improving the capacity of agriculture to contribute to economic growth and a reduction in
poverty and hunger. It thus includes expenditures for the core agricultural purpose of
increasing productivity through improved access to technology, extension, and other
services farmers need to produce, as well as the broader purpose of linking farmers to
markets so they can earn income from increased production.
In many cases, such as spending on rural roads or trade policy, public investments
have multiple purposes and it may not be possible to identify a primary purpose. Thus,
the broader view of public investment in agriculture taken here makes it impossible to
produce a single figure that can be said with confidence to represent total public
investment in agriculture in any country. The only remedy is to describe relevant
spending in ways that are as clear, transparent, and comparable country-to-country as
available information permits.
The Ugandan government’s investment in agricultural development occurs in the
context of its overall investment plans for implementation of the PEAP that are
developed by the MFPED. These plans are outlined in the MTEF 2001/02 to 2004/05
(MFPED 2000). Total approved spending under the MTEF for agriculture and rural
development was about $119 million in 2000–2001, or about 9.9% of total government
investment to eradicate poverty (MFPED 2000). Of this amount, about $53 million (or
4.46% of total government spending) went to the MAAIF, with the rest going for rural
roads and water programs, local government capacity building (other than for health and
education), land and environment, trade and industry, and other grants (MFPED 2000). In
2003–2004, the total approved spending increased to $141 million (8.79% of total
government spending), while spending for agriculture per se through MAAIF remained at

Investing in Africa’s Future Final Report
A-110
$53 million (or 3.31% of total government spending), which was a nearly 15% decrease
from the preceding year (MFPED 2000).
In August 2003, the Report on the Second Review of the Plan for Modernization
of Agriculture cited the tight funding of the agriculture sector, with the share of the total
investment budget that goes to MAAIF declining significantly, as a “present and future
concern” for the successful implementation of the PMA (Uganda 2003, 73). Funding will
likely continue to be constrained, however, by the MFPED effort to close the
government’s substantial budget deficit and by competing budget priorities. Education,
for example, currently receives about 25% of total spending.
Like many African countries that are pursuing poverty reduction strategies,
Uganda relies heavily on foreign assistance to fund its budget, with 40% of the overall
budget and 67% of the development budget coming from external sources (Ngategize
2005a). Increased foreign assistance cannot be the only answer to the need for increased
funding of agricultural development, however, because the high level of overall aid flows
to Africa already threatens adverse impacts on the value of the Ugandan shilling and
other macroeconomic conditions, and the Ugandan government has placed a cap on the
size of its budget and the level of foreign economic assistance it will accept.
According to the Organisation for Economic Co-operation and Development
(OECD) (Table 1), external assistance to Uganda from all sources for all purposes totaled
more than $959 million in 2003, or about 16% of Uganda’s national income, with the top
four donors being the World Bank’s International Development Association, the United
States, the United Kingdom, and the European Commission. Funding for education,
health and population, and other social services was about 50% of the total, while funding
for economic infrastructure and services and production garnering about 10% of the total.
As reported through the OECD’s Creditor Reporting System, bilateral assistance
from the OECD countries (including the United States) averaged $462 million annually
from 2000 through 2003, with reported funding for core agriculture, forestry, and rural
development purposes averaging about $34.7 million annually (Table 2). Reported
OECD country funding for road transport averaged $2.2 million over the period, but the
data do not specify whether the assistance was for rural or urban road transport.

Investing in Africa’s Future Final Report
A-111
Significant public investment in Ugandan agriculture also comes from the
multilateral development organizations, including:
• The World Bank. As of May 2005, the World Bank portfolio in Uganda included 35
active projects with a commitment value of about $1,219 million (World Bank 2005).
These projects involve health, education, infrastructure, governance, and natural
resource management and other sectors related to achieving the goals of the bank’s
Country Assistance Strategy for Uganda (World Bank 2000), which include
enhancing Uganda’s public sector management capacity and accountability (World
Bank 2000b). Eighteen active World Bank projects relate directly to agriculture, with
a value of about $201.5 million (Table 3).
• Food and Agriculture Organization. In 2004, FAO was involved in 30 active, mostly
multi-year projects in Uganda, with a total FAO contribution valued at $4.7 million
(FAO 2005). FAO’s projects focus primarily on improving productivity and food
security at the household level, but they involve a wide range of activities, including
fostering access to needed inputs, strengthening producer organizations, developing
bankable projects, and enhancing coordination between agricultural research and
extension.
• International Fund for Agricultural Development (IFAD). The IFAD is financing five
ongoing projects in Uganda with loans totaling approximately $61 million (IFAD
2005). The projects are: 1) a seven-year program to support the creation of an
extensive rural finance system to generate more opportunities for rural populations to
earn higher incomes; 2) support of the World Bank-initiated National Agricultural
Advisory Services program, a component of Uganda’s PMA and PRSP; 3) a six-year
project to modernize smallholder agriculture in southwestern Uganda through private-
sector involvement, strengthening of producer organizations, and rural infrastructure
improvements; 4) a six-year program to raise the standard of living and improve food
security in Kabarole through the promotion of cash crop production and other
income-generating activities, improved water and sanitation services, and enhanced
local governance; and 5) an eight-year project to increase domestic vegetable oil
production in Bugala Island and Bwamba County.

Investing in Africa’s Future Final Report
A-112
• African Development Bank (ADB). In 2003, ADB loans and grant disbursements in
Uganda totaled 17.9 UA or approximately $26.8 million (ADBG 2005). While
agriculture is a priority sector for investment in the ADB’s strategic plan, project- and
sector-specific information was not available for this report.
It is impossible to determine precisely the total amount of annual public
investment in Ugandan agriculture, whether from domestic or external sources, due to the
lack of any standardized definition or reporting system for such investment and the fact
that many projects are funded on a multi-year basis. Nevertheless, for the sole purpose of
putting U.S. assistance in context, a reasonable approximation of the annual public
investment in traditional agricultural development activities is $100–150 million, most of
which is from external sources. This includes annual bilateral assistance from OECD
countries and multilateral commitments (assuming an average three-year project life).
The U.S. Assistance Program for Agriculture in Uganda
The U.S. agricultural development program in Uganda is best understood in the context
of the overall U.S. assistance program in the country. In most recent years, the United
States has been Uganda’s largest bilateral donor, followed by the United Kingdom and
the Netherlands. As reported to the OECD, total U.S. bilateral assistance to Uganda from
all agencies for all purposes during the period 2000–2003 averaged about $105 million
per year (Table 2). As much as 90% or more of this assistance is funded and managed
through U.S. Agency for International Development (USAID), with the balance coming
through the Peace Corps, the U.S. Department of Agriculture (USDA), the Trade and
Development Agency, the African Development Foundation, and the Departments of
State, Treasury, and Interior.
In the fiscal years 2000–2004, the total annual USAID appropriation targeted
specifically to assist Uganda averaged about $94 million, including a high of $146
million in FY2003, when there was a sharp increase in emergency food aid for Uganda,
and an appropriation of $70.7 million in FY2000 (Table 4). USAID’s FY2005 budget
request for Uganda was $72.3 million, the third largest in the Africa region after the
Sudan and Ethiopia (USAID 2005a). These figures do not include funds appropriated for

Investing in Africa’s Future Final Report
A-113
the Economic Growth, Agriculture, and Trade and the Africa regional programs that may
have been used for activities in Uganda.
Background and Strategy
USAID has worked in Uganda since 1962, although much of the mission’s activity in the
1970s was geared toward recovery and reconstruction, USAID/Uganda returned its focus
to sustainable growth and poverty reduction in 1980 (USAID n.d.). Given Uganda’s
strategic role in East African development, regional stability, and global integration, the
U.S. government has both security and humanitarian interests in supporting poverty
reduction in the country.
USAID’s overall strategy in Uganda, including its strategy for agriculture, is
described in USAID’s Uganda Integrated Strategic Plan (ISP) FY2002–2007 (USAID
2001). The program goal of the ISP is to “assist Uganda to reduce mass poverty” (USAID
2001, 9). The ISP describes the Ugandan government’s PEAP and other elements of the
country’s development strategy as “an outstanding set of policies and programs designed
to sustain economic growth and to alleviate poverty.” Thus, the ISP program goal and the
three strategic objectives identified to achieve that goal are in complete and direct support
of the PEAP (USAID 2001, 6). These strategic objectives are:
• Expanded Sustainable Economic Opportunities for Rural Sector Growth;
• Improved Human Capacity; and
• More Effective and Participatory Governance.
The ISP describes the participatory process by which these strategic objectives
were formulated. A key feature of this process was the consultation of numerous
stakeholders from the Ugandan government, civil society, other U.S. government
agencies, other bilateral and multilateral donors, and implementing partners (USAID
2001).
USAID/Uganda allocated 67% of FY2004 strategic objective funding for
Improved Human Capacity, which encompasses health, education, and HIV/AIDS
activities (USAID 2005b). The ISP nevertheless emphasizes that “the rural economy

Investing in Africa’s Future Final Report
A-114
supports 85% of Ugandans and must be the development target if broad-based economic
growth is to be achieved” (USAID 2000, 7). The mission also places the rural sector at
the center of its strategy because 96% of poor Ugandans live in rural areas (USAID
2000). The rural sector-focused PEAP already has significantly reduced poverty and
stimulated economic growth, but these achievements relied on extensive rather than
intensive agriculture. Because only 25% of Uganda’s land mass is highly productive, the
ISP underscores the importance of improving agricultural productivity to foster further
growth and increase Ugandans’ per capita income in the future (USAID 2000, 27).
Beyond agriculture, the ISP cites economic diversification as another key component of
achieving broad-based economic growth.
The mission’s economic growth strategic objective (Expanded Sustainable
Economic Opportunities for Rural Sector Growth) is based on the development
hypothesis that Uganda’s macroeconomic structure, particularly its competitive and
liberalized economy, has the potential to reduce poverty and increase incomes if
constraints to growth, such as low agricultural productivity and inadequate agricultural
competitiveness and natural resource management, are removed. These barriers to growth
are to be dismantled through increased agricultural productivity and improved natural
resource management at all scales of production (USAID 2000). Furthermore,
competitiveness for both domestic and international markets and the overall investment
and business environment are to be improved through economic reform and capacity
building of entrepreneurs and productive sectors. More specifically, the near-term goals
of the strategy for the rural sector (intermediate results in USAID terms) are articulated
as:
• Increased food security for vulnerable populations in selected regions, with
illustrative activities including food security, nutrition, and agricultural development
initiatives (e.g., technical assistance, training, rural road rehabilitation, direct food
assistance, and emergency food aid) implemented by the mission’s PL 480 Title II
cooperating sponsors.
• Increased productivity of agriculture and natural resource systems in selected regions,
with illustrative activities including technical assistance and specialized training in
agricultural technology and natural resource management.

Investing in Africa’s Future Final Report
A-115
• Increased competitiveness of enterprises in selected sectors, with illustrative activities
including grant support to microfinance institutions and support to improve the
financial sector and long-term financing for farmers and other business owners.
• Improved enabling environment for broad-based economic growth, with illustrative
activities including technical assistance to implement institutional and structural
reforms and implementation of an action plan in the commercial justice sector
(USAID 2000).
Crosscutting themes emphasized throughout the ISP, and with particular
relevance to the Expanded Sustainable Economic Opportunities for Rural Sector Growth
strategic objective, include strategic alliances, regional trade, and food security (USAID
2000). The development partners and stakeholders involved in the participatory
consultative process that led to the formulation of the strategic objectives will continue to
play an important role in the realization of the strategic objectives. Partnerships will be
equally important to take full advantage of Uganda’s trade opportunities. As a member of
both the East African Community and the Common Market for Eastern and Southern
Africa, Uganda is poised to expand its trade and otherwise benefit from the elimination of
tariffs proposed by these two important regional trade bodies. Finally, because low
agricultural productivity is one of the primary causes of food insecurity in Uganda,
increasing that productivity through appropriate agricultural technologies will not only
stimulate broad-based economic growth but also bolster food security (USAID 2000).
USAID’s Agricultural Development Program
Funds Available for Agricultural Development Assistance
USAID’s agricultural development assistance for Uganda is funded and managed
primarily through the USAID Mission in Kampala out of its Development Assistance
(DA) and PL 480 Title II accounts. The other major account through which the activities
of the USAID Mission in Uganda are funded is Child Survival and Health (CSH). As
indicated in Table 4 and Figure 1, total funding through the DA account has fluctuated
but was slightly lower in FY2004 than in FY2000. The Title II non-emergency food aid

Investing in Africa’s Future Final Report
A-116
and CSH appropriations have grown substantially. The CSH account is now the largest of
the three, whereas the DA account was the largest in FY2000. The DA allocation for
Uganda is slated for a further decrease in FY2005.
Within the DA account, it is important to focus on the specific sectoral allocations
that are used to support agriculture’s role in economic development and poverty
reduction, namely agriculture, economic growth, and environment (with funding for the
Initiative to End Hunger in Africa [IEHA] coming online in FY2003 as a sub-component
of the agriculture sector). The agriculture-related sectors comprise about 67% of the DA
account, with the bulk of the remainder earmarked for basic education. Funding for these
sectors in Uganda declined by 28% from FY2000 to FY2004 (from $24.7 million to
$17.7 million), even with the initiation of IEHA funding in Uganda in FY2003 (Table 4).
While total non-emergency Title II food aid resources in Uganda increased from
$10.3 million to $18 million over the FY2000–FY2004 period, the share of that
assistance devoted to agricultural development declined from 90% of the total non-
emergency food aid to 39% of the total (from $9.2 million to $7 million in absolute
terms) (Table 4).
Use of Development Assistance Funding for Agriculture
1. Recent Funding of Agricultural Development
While the Uganda Mission receives its DA funding allocation from Washington in the
four agriculture-related sub-categories shown in Table 4 (among other sub-categories),
USAID allocates and reports its commitment of DA resources to agriculture and other
sectors through the strategic objectives laid out in its ISP for Uganda. As noted, the
strategic objective applicable to agricultural development since FY2002 is SO 617-007
(Expanded Sustainable Economic Opportunities for Rural Sector Growth). Although
some of the activity under this strategic objective and its predecessor (Increased Rural
Household Income, SO 617-001) may involve non-agricultural enterprises, the activities
are predominately agriculture-related and the authors treated them as 100% agriculture-
related strategic objectives for purposes of estimating overall USAID commitment of
program funds to support agriculture-led economic growth. Funding for these strategic

Investing in Africa’s Future Final Report
A-117
objectives was $16.2 million in FY2000, dropped to $7.6 million in FY2001, and then
rose to $19.2 million in FY2004 (Table 5).
Taking into account the funding of all three strategic objectives currently in effect
in USAID’s Uganda Mission, approximately 31% of the funding in FY2004 was used for
purposes related to fostering agriculture’s role in economic growth and poverty reduction
(Figure 2).
2. Current Activities in the Primary Agriculture Strategic Objective
USAID/Uganda’s agriculture-related strategic objective takes a highly market- and
export-oriented approach to expanding rural economic growth. It focuses on building up
the productivity and competitiveness of farmers producing crops with export potential,
such as specialty coffee, dairy, cocoa, and vanilla (USAID 2005b). Of the $19.2 million
committed to this strategic objective in FY2004, $13.7 million was devoted to the
intermediate result of increased agricultural production and productivity. This includes
commodity-specific activities to transfer technology (including biotechnology),
strengthen producer organizations, improve input distribution, and develop specific
agricultural and rural enterprises that can compete in local and international markets
(USAID 2005b).
This strategic objective also seeks to increase the competitiveness of Ugandan
exports by creating a more business-friendly environment that can attract both local and
foreign private investment (USAID 2005b). This involves activities such as providing
technical assistance to the Ugandan government to help develop a strong trade policy and
investment strategy, introducing information and communications technology, and
increasing access to financial services for agricultural enterprises. About $1.9 million was
provided for these activities in FY2004 (USAID 2005b).
Finally, this strategic objective includes the commitment in 2004 of $3.6 million
to improve natural resource management in ways that will help sustain income-
generating agricultural enterprises, build a more diverse export base, and expand other
commercial activities (USAID 2005b). This includes working with farmers and other
resource users on soil conservation, land management, agro-forestry technologies, and
value-added processing.

Investing in Africa’s Future Final Report
A-118
Chemonics International, Inc., and Development Alternatives, Inc. (DAI) are key
prime contractors for implementing the agricultural productivity and export assistance
elements of this strategic objective. DAI also is a prime contractor on the natural resource
management component of the program, along with ECOTRUST, the African Wildlife
Fund, and the International Center for Research on Agro-forestry (USAID 2005b).
Use of PL 480 Title II Food Aid Resources for Agricultural Development
A significant portion of the overall U.S. investment in agricultural development in
Uganda is financed through development (non-emergency) food aid from USAID, which
is channeled normally through private, voluntary organizations working in the country as
Title II cooperating sponsors (CSs). These organizations use the proceeds from the sale
(monetization) of commodities to carry out their projects involving agriculture, health,
education, and other needs. USDA also provides food aid to Uganda but it goes for
school feeding and World Food Programme activities not directly related to agricultural
development.
Determining the dollar amount of the food aid resource that is applied to
agriculture in Uganda requires considering the total USAID non-emergency food aid
flow through the Title II program (Food for Peace), the related cash assistance to CSs
through section 202(e) of PL 480, and estimates of the percentage of each CS program
that is devoted to agricultural development (Table 6).5
1. Funding
During the period FY2000–FY2004, the value of USAID’s Title II non-emergency food
aid shipments to Uganda averaged $12.9 million annually, including freight costs from
the United States (Table 6). Excluding freight costs, the value of the commodities
themselves averaged $8.6 million. Total payments under section 202(e) to all CSs
working in Uganda averaged $950,000 per year. As many as six CSs have been managing
Title II food aid programs in Uganda over the period FY2000–FY2004. All have been
involved in agricultural development to some extent but with the level of activity varying
3 The development food aid reported here does not include USAID food aid contributions to the U.N.’s World Food Programme, which are used predominately for emergency feeding.
Investing in Africa’s Future Final Report
A-119
from as little as 1% to as much as 100% of their programs in Uganda. Based on USAID’s
reported estimates, the share of overall Title II non-emergency food aid used for
agriculture in Uganda from FY2000 through FY2004 averaged 63%, but it steadily
declined from 90% in FY2000 to 39% in FY2004 (Table 6).
Thus, if freight costs are included, Title II food aid-financed agricultural
assistance for Uganda from FY2000 through FY2004, including 202(e) payments,
averaged $8.2 million annually, with the levels fluctuating between $6.8 million in
FY2001 and $10.9 million in FY2003. The trend, however, is downward, with the
FY2004 value of $7 million being 24% lower than the FY2000 level. If freight costs are
excluded, U.S. agricultural assistance in Uganda financed by Title II food aid averaged
$5.7 million annually (Table 6).
2. Title II-Funded Development Activities
The principal CSs managing food aid-financed projects in Uganda are ACDI/VOCA,
Africare, Catholic Relief Services (CRS), Save the Children, TechnoServe, and World
Vision. ACDI/VOCA has by far the largest Title II program in Uganda, accounting for
more than 60% of total Title II resources in FY2004 (or about $10 million in commodity
value including freight) (Bogart 2004).
Like USAID-managed food aid programs in general, the ACDI/VOCA program is
focused on the goal of food security as called for by USAID’s 1995 food aid policy
statement (USAID/FFP 1995). The FY2002–FY2006 Development Activity Program
(DAP) proposes to foster the transition of smallholder farmers from subsistence to
commercial agriculture and to mitigate childhood malnutrition through “enhancing
agricultural production, marketing, rural finance services and increasing nutritional
awareness” (ACDI/VOCA 2001, 1). The ACDI/VOCA program complements the
government of Uganda’s PMA, as well as USAID/Uganda’s key agriculture-related
strategic objective to expand sustainable economic opportunities for rural sector growth.
Proposed activities under the five-year program include the extension of improved
agricultural and nutritional practices to farmers, with a particular focus on women
producers (ACDI/VOCA 2001). To address the issue of input and working capital
shortfalls, ACDI/VOCA seeks to link agricultural input and marketing providers with
Investing in Africa’s Future Final Report
A-120
rural credit institutions. The DAP proposes improving marketing by enhancing price
information dissemination, rehabilitating feeder roads, and training farmers in improved
post-harvest handling and storage techniques. The Title II program’s health component
focuses on direct food distribution to people living with HIV/AIDS and the integration of
those individuals into the program’s agricultural activities (ACDI/VOCA 2001).
Many of ACDI/VOCA’s activities overlap with the other major CSs managing
food aid programs in Uganda, and the DAP describes significant coordination among
these programs. For example, CRS is a grantee of the ACDI/VOCA Title II program.
Furthermore, ACDI/VOCA monetizes commodities that TechnoServe receives for its
Arua agricultural marketing project, while ACDI/VOCA benefits from TechnoServe’s
marketing expertise for projects in Apac District (ACDI/VOCA 2001).
The broad objectives of TechnoServe’s FY1999–FY2003 Title II program were
increased production and productivity of selected crops and increased rural household
incomes (TechnoServe 2003). Successful activities of this DAP, as described in the final
evaluation, include demonstration plots and technology transfer, chili production and
sales, nurseries and high value crop trials, and produce trading.
As in the ACDI/VOCA program, the CRS and Save the Children Title II
programs both address the food insecurity of persons living with HIV/AIDS. One of the
CRS program’s specific objectives is to “establish a food security safety net for
individuals and households affected by HIV/AIDS, whose food utilization abilities are
compromised by the symbiosis of poverty and illness” (CRS 2001, 6). The other major
objective of the program is to “re-establish sustainable agricultural systems with a focus
on smallholder farmers whose potential crop production levels are high, but whose
abilities to reach that potential are compromised by protracted insecurity and economic
marginalization” (CRS 2001, 5). The geographic areas at which CRS assistance is
targeted are three northern districts and four south-central districts.
In addition to the specific goal of improved livelihoods through food distribution
to people living with HIV/AIDS and families affected by the disease, the broad objectives
of the Save the Children Title II program are improved food access and production and
improved food utilization among target households (SCF 2002). The DAP proposes to
increase food access through: 1) on-farm training and demonstrations of improved

Investing in Africa’s Future Final Report
A-121
farming, gardening, post-harvest storage, and processing techniques; 2) the establishment
and support of market enterprise groups; and 3) rehabilitation of market feeder roads.
Improved food utilization is to be achieved through improved access to and use of water,
sanitation facilities, and health services.
Africare’s Title II program, the Uganda Food Security Initiative FY2002–
FY2006, has as its three main objectives: 1) to increase agricultural productivity; 2) to
improve household nutrition, particularly for women and children under 5; and 3) to
increase accessibility of households in the four southwest highland districts of Uganda
(Africare 2001). These objectives align with all three of USAID/Uganda’s strategic
objectives: expanding sustainable economic opportunities for rural sector growth,
improving human capacity, and fostering more effective and participatory governance.
The major technical areas within the scope of the project are agricultural production,
post-harvest handling, marketing, household nutrition, community road improvements,
and natural resource management (Africare 2001).
The overall goal of World Vision’s DAP is “to improve food security for 36,000
households in Gulu and Kitgum Districts of northern Uganda” (World Vision 1999, 5).
The specific objectives of this Title II program are: 1) to increase household income
through the sale of agricultural products; 2) to increase dependence on sustainable
resource use systems, such as woodlots and improved stoves; and 3) to improve
households’ nutrition and diet diversity knowledge (World Vision 1999).
USDA’s Agricultural Development Activities in Uganda
As noted, USDA provides limited food aid to Uganda but not for purposes directly
related to agricultural development. Beyond food aid, USDA has no appropriation
specifically for agricultural development assistance in Africa but USDA employees
provide technical assistance and manage programs that are funded by USAID through the
International Cooperation and Development (ICD) Program in USDA’s Foreign
Agricultural Service. Ten USDA agricultural advisors are on reimbursable details at
USAID working on the Presidential Initiative to End Hunger in Africa.

Investing in Africa’s Future Final Report
A-122
In addition, USDA funds occasional projects that relate to agricultural
development in specific African countries through ICD’s Food Industry Division and
Scientific Cooperation Research Program amounting to about $1 million annually across
the continent (Brown 2005). Projects of this kind that have some connection with Uganda
include the Cochran Fellowship Program, which through the end of FY2003 has given a
total of 36 Ugandan scientists two to six weeks of agricultural training in the United
States.
Other United States Agencies
African Development Foundation
Eight of ten projects in Uganda approved in FY2002 and FY2003 by the ADF relate to
agricultural development, according to the FY2002–FY2003 ADF annual report, which is
the most current source of readily available information on ADF activities (ADF 2003).
Funding for these eight projects, all of which are ongoing, totals approximately $1.6
million and supports: 1) two sericulture development projects; 2) two projects to increase
the production of two vanilla farmers groups; 3) a leather processing and cotton gin
washers production project; 4) a project to train 117 farmers in tea crop husbandry and
increase the production of a 35-member association of tea farmers in Mukono district; 5)
a project to increase the production of a 20-member association of manufacturers of
agricultural equipment, building, and plumbing parts; and 6) a local cereals processing
project (ADF 2003).
Trade and Development Agency
Only two TDA projects in Uganda during the period FY2000–FY2004 related to
agricultural development: a phosphate fertilizer feasibility study ($360,000) and desk
study ($4,000), both conducted in FY2003 (OECD n.d.; USTDA 2004).
Trends in Bilateral U.S. Agricultural Development Assistance in Uganda
The majority of U.S. agricultural development assistance for Uganda is funded bilaterally
through the USAID Development Assistance account and the Title II food aid program
Investing in Africa’s Future Final Report
A-123
(Table 7). Total funding through these vehicles has fluctuated over the five-year period
FY2000–FY2004, with funding for the agriculture-related strategic objective dropping
sharply from FY2000 to FY2001 then rising again. Total funding levels, including
through development food aid (including freight), ranged from $14.4 million in FY2001
to $28.4 million in FY2003, and rose 3% over the five-year period.
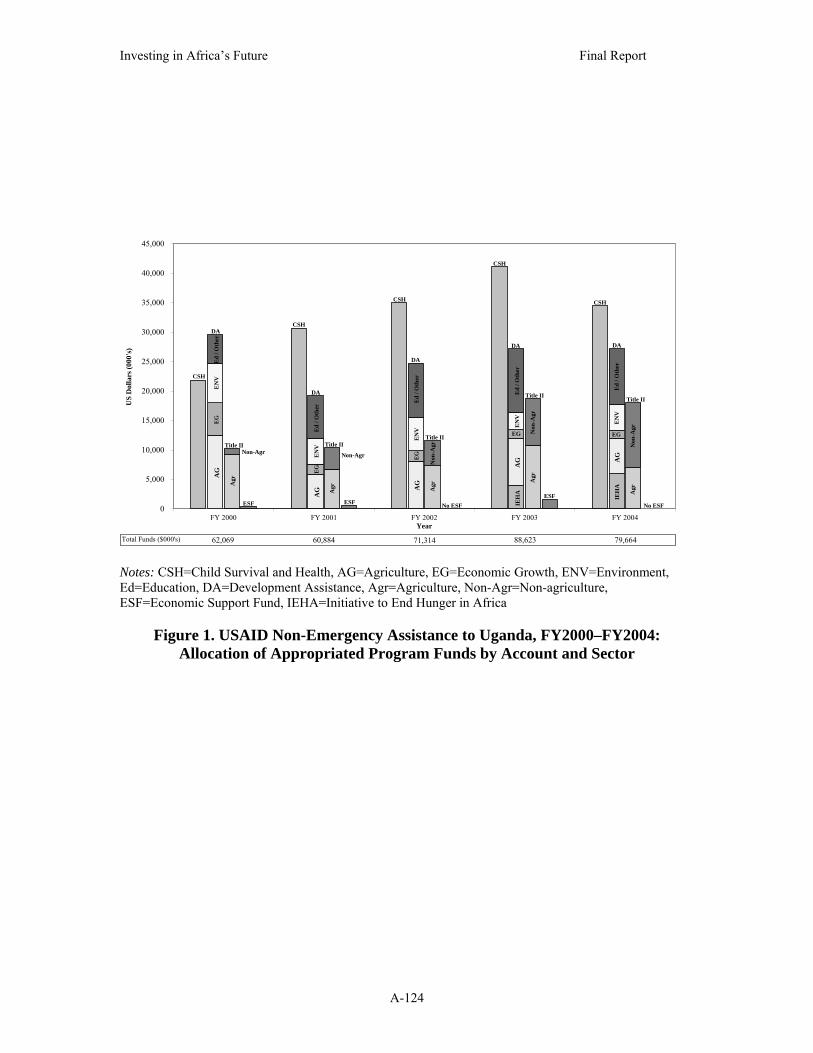
Investing in Africa’s Future Final Report
A-124
Notes: CSH=Child Survival and Health, AG=Agriculture, EG=Economic Growth, ENV=Environment, Ed=Education, DA=Development Assistance, Agr=Agriculture, Non-Agr=Non-agriculture, ESF=Economic Support Fund, IEHA=Initiative to End Hunger in Africa
Figure 1. USAID Non-Emergency Assistance to Uganda, FY2000–FY2004: Allocation of Appropriated Program Funds by Account and Sector
0
5,000
10,000
15,000
20,000
25,000
30,000
35,000
40,000
45,000
FY 2000 FY 2001 FY 2002 FY 2003 FY 2004Year
US
Dol
lars
(000
's)
CSH
DA
Title II
ESF
DA
DA
DA
DA
CSH
CSH
CSH
CSH
Title II Title IITitle II
Title II
ESF
AG
EG
EN
VIE
HA
Ed
/ Oth
er
Ed
/ Oth
er
Ed
/ Oth
er
Ed
/ Oth
er
Ed
/ Oth
erE
NV
EN
V
EN
V
EN
V
EG
EG
EG
EG
AG
AG
AG
AG
Agr
Agr
Agr
Agr Agr
ESF No ESFNo ESF
Non-Agr
Non
-AgrNon
-Agr
Non
-Agr
Non-Agr
Total Funds ($000's) 60,88462,069 71,314 88,623 79,664
IEH
A
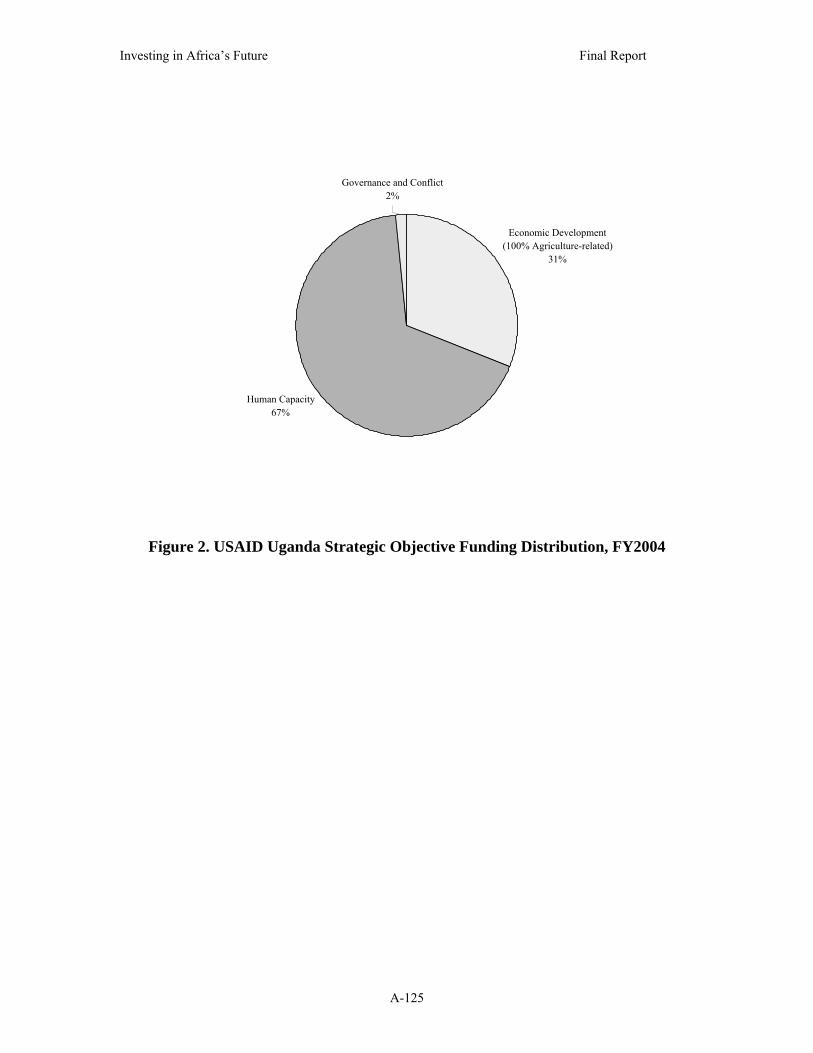
Investing in Africa’s Future Final Report
A-125
Economic Development (100% Agriculture-related)
31%
Human Capacity67%
Governance and Conflict2%
Figure 2. USAID Uganda Strategic Objective Funding Distribution, FY2004

Investing in Africa’s Future Final Report
A-126
Table 1. Aid at a Glance: Uganda
Source: Aid Statistics, Recipient Aid Charts, Uganda, OECD Development Co-operation Directorate (OECD/DAC n.d.).

Investing in Africa’s Future Final Report
A-127
Table 2. OECD Agriculture-related Assistance to Ugandaa as Reported to the OECD/CRS from ll OECD Countries Combined, 2000–2003b (U.S. contributions in parentheses)
Sector ($, thousands)
Year Core
Agriculturec Forestry & Fisheriesd
Rural Developmente
Road Transportf
Trade Policy &
Facilitationg Development
Food Aidh All Other Aid Total 2000 17,301 (12,500) 11,252 19,063 514 17 6,271 (4,843) 538,823 (45,888) 593,241 (63,231) 2001 16,610 (5,321) 3,616 5,577 1,446 484 (390) 17,637 (16,712) 257,455 (48,227) 302,827 (70,650) 2002 22,281 (15,235) 4,195 5,651 (975) 3,697 13,134 (13,134) 303,516 (82,249) 352,475 (111,593) 2003 13,485 (1,050) 488 19,128 (15,704) 2,964 303 26,322 (22,255) 537,019 (136,075) 599,709 (175,084) Total 69,678 (34,106) 19,551 49,419 (16,679) 8,622 805 (390) 63,364 (56,944) 1,636,814 (312,439)1,848,252 (420,558) Notes: aRecipients included in our definition of sub-Saharan Africa (SSA) include individual SSA countries, “South of Sahara Unallocated,” and “Africa Unspecified.” bAll years (2000–2003) refer to calendar years. cCore Agriculture includes all purpose codes beginning with 311 (Agriculture) and purpose codes 32165 (Fertilizer Plants), 32267 (Fertilizer Minerals), 23070 (Biomass), and 32161 (Agro-Industries). dForestry & Fisheries includes all purpose codes beginning with 312 (Forestry) and 313 (Fisheries) along with purpose code 32162 (Forest Industries). eRural Development includes purpose code 43040 (Rural Development). 6Road Transport includes purpose code 21020 (Road Transport). fTrade Policy & Facilitation includes all purpose codes beginning with 331 (Trade). gDevelopment Food Aid includes purpose codes 52000 (Development Food Aid/Food Security Assistance) and 52010 (Food Security Programmes/Food Aid). Source: OECD CRS Online Database on Aid Activities (OECD n.d.).

Investing in Africa’s Future Final Report
A-128
Table 3. World Bank Active Agriculture-related Projects in Uganda
Funding ($, millions)
Project Name Agriculture-
related Total Project Description Agriculture Resources & Training II 26.0 26.0 Increase agricultural efficiency, productivity, household income, and welfare
through research and technology capacity building. Economic Recovery II 0.6 2.0 No additional information available. Economic Recovery Program 0.1 1.5 No additional information available.
Economic Recovery II 0.4 1.6 No additional information available. Economic Recovery 0.1 1.7 No additional information available. Energy for Rural Transformation Project 3.9 49.2 Renewable rural energy and information/communication technologies
development. Energy for Rural Transformation Project 0.4* 12.1 See description above.
Kibale Forest Wild Coffee Project 0.8* 0.8 Use of Kibale Forest Wild Coffee sales income to enhance biodiversity
conservation in the Kibale National Park and agricultural areas of Uganda.
UG: Lake Victoria Environmental Project (IDA) 9.4 12.1
Maximize sustainable benefits of food, employment and income potential of the lake; fisheries research, management, extension, policies and laws, and land use management.
Lake Victoria Environmental Project (GEF) 7.6* 9.8 See UG: Lake Victoria Environmental Project (IDA) description above.
Lake Victoria Environmental Management Project- Supplemental Credit
3.5 4.5 See UG: Lake Victoria Environmental Project (IDA) description above.
National Agricultural Advisory Services Project 45.0 45.0
Provide agricultural advisory services to farmers and promote partnerships among producers, advisers, researchers, and markets; finance capacity building for private sector, institutions and public extension staff.
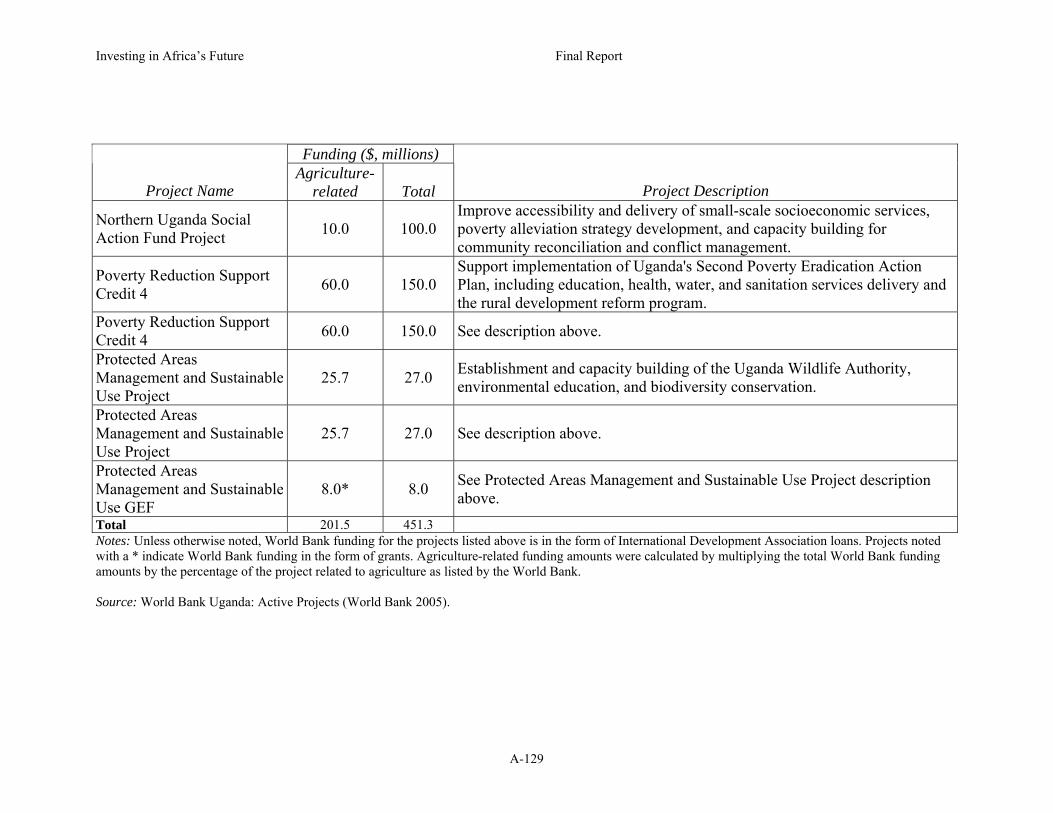
Investing in Africa’s Future Final Report
A-129
Notes: Unless otherwise noted, World Bank funding for the projects listed above is in the form of International Development Association loans. Projects noted with a * indicate World Bank funding in the form of grants. Agriculture-related funding amounts were calculated by multiplying the total World Bank funding amounts by the percentage of the project related to agriculture as listed by the World Bank. Source: World Bank Uganda: Active Projects (World Bank 2005).
Funding ($, millions)
Project Name Agriculture-
related Total Project Description
Northern Uganda Social Action Fund Project 10.0 100.0
Improve accessibility and delivery of small-scale socioeconomic services, poverty alleviation strategy development, and capacity building for community reconciliation and conflict management.
Poverty Reduction Support Credit 4 60.0 150.0
Support implementation of Uganda's Second Poverty Eradication Action Plan, including education, health, water, and sanitation services delivery and the rural development reform program.
Poverty Reduction Support Credit 4 60.0 150.0 See description above.
Protected Areas Management and Sustainable Use Project
25.7 27.0 Establishment and capacity building of the Uganda Wildlife Authority, environmental education, and biodiversity conservation.
Protected Areas Management and Sustainable Use Project
25.7 27.0 See description above.
Protected Areas Management and Sustainable Use GEF
8.0* 8.0 See Protected Areas Management and Sustainable Use Project description above.
Total 201.5 451.3
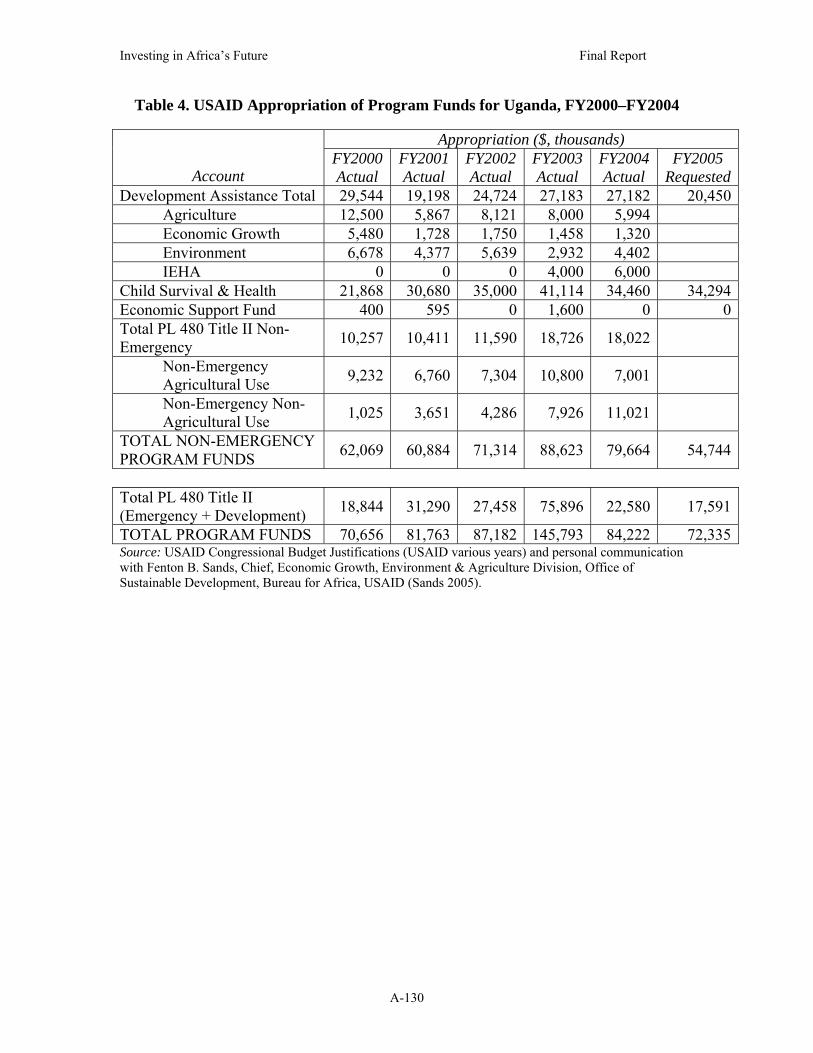
Investing in Africa’s Future Final Report
A-130
Table 4. USAID Appropriation of Program Funds for Uganda, FY2000–FY2004
Appropriation ($, thousands)
Account FY2000 Actual
FY2001 Actual
FY2002 Actual
FY2003 Actual
FY2004 Actual
FY2005 Requested
Development Assistance Total 29,544 19,198 24,724 27,183 27,182 20,450 Agriculture 12,500 5,867 8,121 8,000 5,994 Economic Growth 5,480 1,728 1,750 1,458 1,320 Environment 6,678 4,377 5,639 2,932 4,402 IEHA 0 0 0 4,000 6,000 Child Survival & Health 21,868 30,680 35,000 41,114 34,460 34,294Economic Support Fund 400 595 0 1,600 0 0Total PL 480 Title II Non-Emergency 10,257 10,411 11,590 18,726 18,022
Non-Emergency Agricultural Use 9,232 6,760 7,304 10,800 7,001
Non-Emergency Non-Agricultural Use 1,025 3,651 4,286 7,926 11,021
TOTAL NON-EMERGENCY PROGRAM FUNDS 62,069 60,884 71,314 88,623 79,664 54,744
Total PL 480 Title II (Emergency + Development) 18,844 31,290 27,458 75,896 22,580 17,591
TOTAL PROGRAM FUNDS 70,656 81,763 87,182 145,793 84,222 72,335Source: USAID Congressional Budget Justifications (USAID various years) and personal communication with Fenton B. Sands, Chief, Economic Growth, Environment & Agriculture Division, Office of Sustainable Development, Bureau for Africa, USAID (Sands 2005).
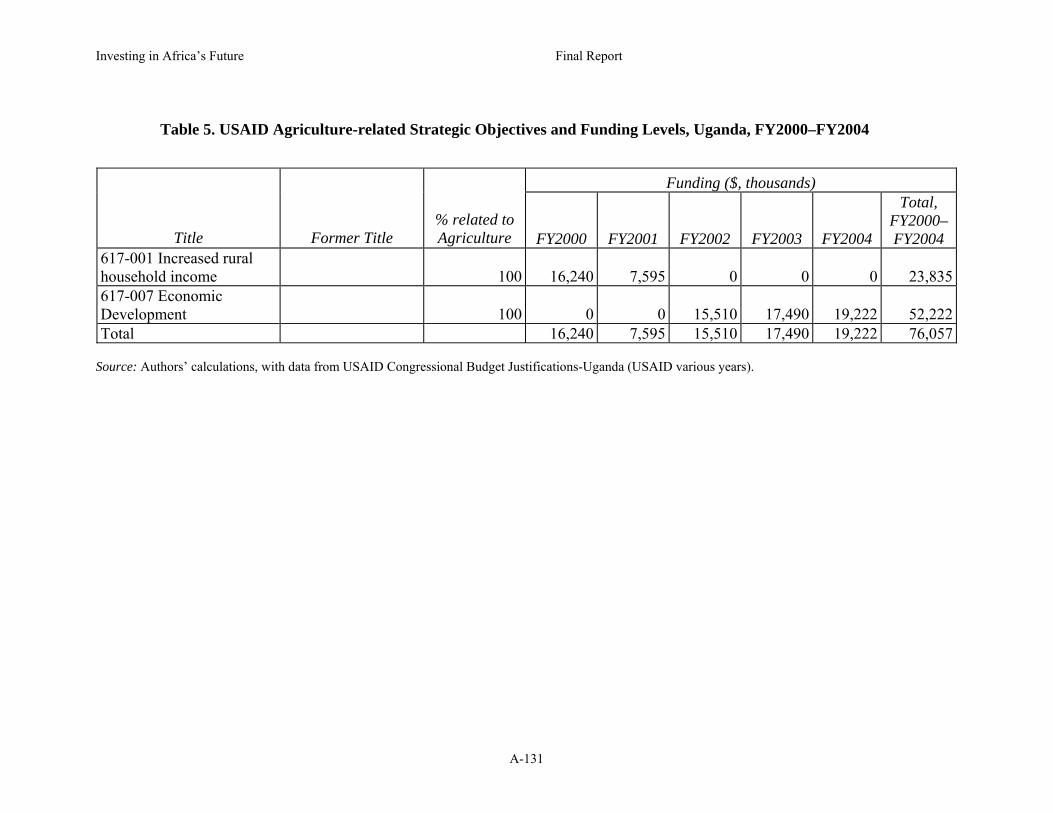
Investing in Africa’s Future Final Report
A-131
Table 5. USAID Agriculture-related Strategic Objectives and Funding Levels, Uganda, FY2000–FY2004
Source: Authors’ calculations, with data from USAID Congressional Budget Justifications-Uganda (USAID various years).
Funding ($, thousands)
Title Former Title % related to Agriculture FY2000 FY2001 FY2002 FY2003 FY2004
Total, FY2000– FY2004
617-001 Increased rural household income
100 16,240 7,595 0 0 0 23,835
617-007 Economic Development
100 0 0 15,510 17,490 19,222 52,222
Total 16,240 7,595 15,510 17,490 19,222 76,057

Investing in Africa’s Future Interim Report
A-132
Table 6. U.S. Non-Emergency Food Aid Estimated Value Applied for Agricultural Development Purposes, Uganda, FY2000–FY2004
Funding ($, thousands)
Allocation FY2000 FY2001 FY2002 FY2003 FY2004 Average Increase, FY2000–FY2004 (%)
USAID Title II Value With Freight 9,512 9,762 10,941 17,719 16,320 12,851 72%
Title II Value w/o Freight* 6,345 6,511 7,298 11,819 10,885 8,572 72%
202(e) Payment 745 649 649 1,007 1,702 950 128%USAID Total With Freight 10,257 10,411 11,590 18,726 18,022 13,801 76%
USAID Total w/o Freight 7,090 7,160 7,947 12,826 12,587 9,522 78%
% Used for Agriculture** 90% 65% 63% 58% 39% 63% -57%
Total USAID Agriculture Value With Freight
9,231 6,767 7,302 10,861 7,029 8,238 -24%
Total USAID Agriculture Value w/o Freight
6,381 4,654 5,007 7,439 4,909 5,678 -23%
Notes: * Calculated based on the assumption that freight costs consume one-third of the total value. ** Calculated based on estimates in USAID annual reports on non-emergency food aid of the percentages of each cooperating sponsor program in Uganda that is devoted to agricultural development. Source: USAID Office of Food for Peace Annual Reports, FY2000–FY2004 (USAID/FFP various years).

Investing in Africa’s Future Interim Report
A-133
Table 7. Bilateral U.S. Assistance for Ugandan Agriculture, Major Elements, FY2000–FY2004
Funding ($, thousands)
Program FY2000 Actual
FY2001 Actual
FY2002 Actual
FY2003 Actual
FY2004 Actual
USAID/Development Assistance Agriculture-Related Strategic Objective
16,240 7,595 15,510 17,490 19,222
USAID/Food Aid PL480 Title II* 9,231 6,767 7,302 10,861 7,029
Total 25,471 14,362 22,812 28,351 26,251Notes: * Includes 202(e) payments. All food aid values include freight costs. Source: Extracted from Tables 5 and 6.

Investing in Africa’s Future Interim Report
A-134
References
ACDI/VOCA (Uganda/ACDI/VOCA). 2001. Title II FY02–FY06 Development
Activity Program Proposal.
ADBG (African Development Bank Group). 2005. Summary of Operations for the
Republic of Uganda. http://www.afdb.org/en/country_operations/african
_countries/uganda (accessed February 13, 2005).
ADF (African Development Foundation). 2003. Innovative Investments in Africa’s
Future: ADF Funded Projects Fiscal Years 2002–2003. http://www.adf.gov/
ADF200203report.pdf (accessed April 2, 2005).
Africare (Africare/Uganda). 2001. Uganda Food Security Initiative FY02–FY06 Title II
Development Assistance Program Proposal.
Bogart, Brian J. 2004. Personal communication from Brian J. Bogart, Results and
Information Reporting, USAID/FFP/AMEX International, to Michael Taylor,
Nov. 12.
Brown, Jocelyn. 2005. Personal communication from Jocelyn Brown, assistant deputy
administrator, ICD/FAS/USDA, to the authors, Feb. 4.
CRS (Catholic Relief Services). 2001. Title II FY2002–FY2006 Development Activity
Program Proposal.
FAO (Food and Agriculture Organization of the United Nations). 2004. The State of
Food Security in the World, 2004. Available from http://www.fao.org/documents/
show_cdr.asp?url_file=/docrep/007/y5650e/y5650e00.htm (accessed June 20, 2005).
FAO. 2005. List of Operationally Active projects for all Organizational Units in Uganda
by funding source. https://extranet.fao.org/fpmis/FPMISReportServlet.jsp?sel_
country=UG& div=&type=countryprofileopen&language=EN&countryId=UG
(accessed June 27, 2005).
IFAD (International Fund for Agricultural Development). 2005. Approved Projects for
Uganda. http://www.ifad.org/operations/projects/regions/PF/UG_all.htm (accessed
February 13, 2005).
MFPED (Ugandan Ministry of Finance, Planning and Economic Development). 2000.

Investing in Africa’s Future Interim Report
A-135
Uganda’s Poverty Eradication Action Plan. http://www.imf.org/external/NP/
prsp/2000/Uga/01/index.htm (accessed June 29, 2005).
MFPED. 2004. Poverty Eradication Action Plan (2004/05-2007/08) Draft.
Ngategize, Peter. 2005a. Personal communication from Peter Ngategize, National
Coordinator, MTCS Secretariat, Ministry of Finance, Planning and Economic
Development, Uganda, to the authors, June 21.
Ngategize, Peter. 2005b. Personal communication from Peter Ngategize, National
Coordinator, MTCS Secretariat, Ministry of Finance, Planning and Economic
Development, Uganda, to the authors, June 30.
OECD (Organisation for Economic Co-operation and Development). n.d. CRS Online
Database on Aid Activities. Available from http//:www.oecd.org/dac/stats/
idsonline (accessed April 3, 2005).
OECD/DAC (Organisation for Economic Co-operation and Development Co-operation
Directorate). n.d. Aid Statistics, Recipient Aid Charts, Uganda.
http://www.oecd.org/dataoecd/12/32/1883200.gif (accessed June 27, 2005).
Sands, Fenton B. 2005. Personal communication from Fenton Sands, Chief, Economic
Growth, Environment & Agriculture Division, Bureau for Africa, USAID, to the authors,
February 8.
SCF (Save the Children Federation/Uganda). 2002. Development Assistance Program
Proposal FY04–FY08.
TechnoServe (TechnoServe/Uganda). 2003. Building Rural Incomes Through Enterprise
P.L. 480 Title II Development Activity Program Fiscal Years 1999–2003 Final
Evaluation Report.
Uganda (Government of the Republic of Uganda). 2000. Plan for the Modernisation of
Agriculture: Eradicating Poverty in Uganda. Available from http://www.pma.go.
ug/loadPage.php?section=PMA%20in%20Depth (accessed June 27, 2005).
Uganda. 2003. Report on the Second Review of the Plan for Modernization of
Agriculture. http://pma.go.ug/pdfs/PMA%20joint%20review%20volume%
20two.pdf (accessed June 29, 2005).
Uganda AIDS Commission. n.d. HIV/AIDS in Uganda. http://www.aidsuganda.
org/aids/index.htm (accessed June 27, 2005).

Investing in Africa’s Future Interim Report
A-136
UNDP (United Nations Development Programme). 2003. Human Development Report
2003. Available from http://hdr.undp.org/reports/global/2003/ (accessed June 27, 2005).
USAID (U.S. Agency for International Development). n.d. USAID/Uganda Home Page.
http://www.usaid.or.ug/ (accessed June 27, 2005).
USAID. 2001. USAID/Uganda Integrated Strategic Plan, FY2002–2007.
http://www.dec.org/pdf_docs/PDABT976.pdf (accessed June 27, 2005).
USAID. 2005a. FY2005 Africa Congressional Budget Justification. Available from
http://www.usaid.gov/ policy/budget/cbj2005/afr/ (accessed June 25, 2005).
USAID. 2005b. FY2005 Congressional Budget Justification–Uganda.
http://www.usaid.gov/policy/budget/cbj2005/afr/pdf/ug_cbj_fy05.pdf (accessed
June 20, 2005).
USAID. Various years. CongressionalBudget Justification-Uganda. Available from
http://www.usaid.gov/ policy/budget/ (accessed March 30, 2005).
USAID/FFP (U.S. Agency for International Development/Office of Food for Peace).
1995. Food Aid and Food Security Policy Paper. Feb. 27. http://www.usaid.gov/
policy/ads/200/foodsec/foodsec.pdf (accessed March 25, 2005).
USAID/FFP. Various Years. Food for Peace Annual Reports, FY2000 to FY2004.
U.S. Department of State. 2004. Background Note: Uganda. http://www.state.gov/r/
pa/ei/bgn/2963.htm (December 14, 2004).
USTDA (U.S. Trade and Development Agency). 2004. Annual Report. Available from
http://www.tda.gov/USTDA/About%20USTDA/eventspubs.htm (accessed March
30, 2005).
World Bank Group. 2000a. Country Assistance Strategy for Uganda. Available from
http://www-wds.worldbank.org/servlet/WDS_IBank_Servlet?pcont=details&eid=
000094946_00103105320380 (accessed June 27, 2005).
World Bank Group. 2000b. Memorandum of the President of the International
Development Association and the International Finance Corporation to the
Executive Directors on a Country Assistance Strategy of the World Bank Group for the
Republic of Uganda. http://www-wds.worldbank.org/servlet/WDSContent
Server/WDSP/IB/2000/11/10/000094946_00103105320380/Rendered/PDF/multi
0page.pdf (accessed June 27, 2005).

Investing in Africa’s Future Interim Report
A-137
World Bank Group. 2005. Uganda: Active Projects. http://web.worldbank.org/
external/default/main?menuPK=374969&pagePK=141155&piPK=141124&theSi
tePK=374864 (accessed May 25, 2005).
World Vision. 1999. P.L. 480 Title II Development Activity Proposal Food Security
Program Gulu and Kitgum Dist

Investing in Africa’s Future Interim Report
A-138
Glossary ADB African Development Bank ADB/ADF African Development Fund of the African Development Bank ADF African Development Foundation CAADP Comprehensive Africa Agriculture Development Programme CBJ Congressional Budget Justification CGIAR Consultative Group on International Agricultural Research CRSPs Collaborative Research Support Programs CSH Child Survival and Health (account) DA Development Assistance (account) DAC Development Assistance Committee (of OECD) DAP Development Activity Program DCHA Bureau for Democracy, Conflict, and Humanitarian Assistance (of
USAID) DFA Development Fund for Africa EGAT Bureau for Economic Growth, Agriculture, and Trade (of USAID) ESF Economic Support Fund (account) FAA Foreign Assistance Act FAO Food and Agriculture Organization of the United Nations FAS Foreign Agricultural Service (of USDA) FDI foreign direct investment FFP Office of Food for Peace (of USAID’s DCHA) HIPC Initiative
Heavily Indebted Poor Countries Initiative
HIV/AIDS Human Immunodeficiency Virus/Acquired Immune Deficiency Syndrome
IBRD International Bank for Reconstruction and Development IDA International Development Association IEHA President’s Initiative to End Hunger in Africa IFAD International Fund for Agricultural Development IO Bureau of International Organization Affairs (of Department of
State) MCA Millennium Challenge Account MCC Millennium Challenge Corporation MDGs Millennium Development Goals NEPAD New Partnership for Africa’s Development NGO Non-governmental organization OECD Organisation for Economic Co-operation and Development OMB Office of Management and Budget OPIC Overseas Private Investment Corporation PCHPA Partnership to Cut Hunger and Poverty in Africa PPC Bureau for Policy and Program Coordination (of USAID) PRSPs Poverty Reduction Strategy Papers PVOs private voluntary organizations REDSO Regional Economic Development Services Office (of USAID) RFF Resources for the Future SSA sub-Saharan Africa TDA U.S. Trade and Development Agency U.N. United Nations USAID U.S. Agency for International Development WARP West Africa Regional Program (of USAID) WFP World Food Programme