investigation on diagnostic methods of rotating machines
TRANSCRIPT

IN DEGREE PROJECT ELECTRICAL ENGINEERING,SECOND CYCLE, 30 CREDITS
, STOCKHOLM SWEDEN 2019
Investigation on Diagnostic Methods of Rotating Machines and Influence Factors Based on Existing Testing Products
JIAMIN HE
KTH ROYAL INSTITUTE OF TECHNOLOGYSCHOOL OF ELECTRICAL ENGINEERING AND COMPUTER SCIENCE

Investigation on Diagnostic Methods ofRotating Machines and InfluenceFactors Based on Existing Testing
Products
Jiamin He
Master Thesis Project, Electromagnetic EngineeringSchool of Electrical Engineering and Computer Science
KTH Royal Institute of Technology , StockholmDecember 16, 2019

Abstract
This thesis summarizes established methods for electrical diagnostics of the in-sulation of large rotating electrical machines, i.e. generators and large motorsworking above the low-voltage range. It then investigates the possibility ofusing some existing diagnostic instruments, not specifically intended for ma-chine insulation, for performing standard tests on a certain type and range ofthe rotating machines. The summary of general diagnostic methods for rotat-ing machinery includes the traditional methods and currently used methodsin industry. It considers what types of the defects can be detected, and theinfluence of the applied voltage magnitudes and frequencies, etc. Then thereis a literature study of several recent or developing technologies such as on-linemonitoring and frequency response analysis, to investigate the possible futuredevelopment of the diagnostic methods that have practical applications dur-ing manufacturing and operation of rotating machinery for a more accurateand timely assessment. Possible modifications to testing devices to suit themmore to machine insulation are investigated. A study of three market-existingdevices summarizes the machine diagnostic tests that they could be used for.Finally, an experimental study on a stator coil rated 7 kV is reported, and itsresults are used to analyze the influence of the test factors such as frequencydependency, for future investigation.

Sammanfattning
Denna avhandling sammanfattar etablerade metoder for elektrisk diagnos-tik av isolering hos stora roterande elektriska maskiner, dvs generatorer ochstora motorer med markspanningar hogre an lagspanning. Darefter undersoksmojligheten att anvanda vissa befintliga diagnostiska instrument, som inte arsarskilt avsedda for maskinisolering, for att utfora standardtester pa roterandemaskinerna. I sammanfattningen av diagnostiska metoder for roterande mask-iner ingar traditionella metoder och for narvarande anvanda metoder inomindustrin. Den anser vilka typer av defekter kan upptackas, och paverkan avde tillampade spannings magnituder och frekvenser, etc. En litteraturstudieomfattar flera nya eller utvecklande teknologier sasom on-line overvakningoch frekvensresponsanalys, for att undersoka den mojliga framtida utveck-lingen av de diagnostiska metoder som har praktiska tillampningar undertillverkning och drift av roterande maskiner for en mer exakt och punktligbedomning. Mojliga modifieringar av provningsanordningar som passar demmer for maskin isolering undersoks. study av tre marknadsfora-existerandeapparater sammanfattar de bearbeta med maskin diagnostiska testar att dekunde anvandas for. En experimentell studie pa en 7 kV statorlindning rap-porteras, och dess resultat anvands for att analysera paverkan av test faktorersasom frekvensberoendet av resultaten, for framtida utredning.

Acronym
AC - Alternating CurrentDC - Direct CurrentPD - Partial DischargeDIV - Discharge Inception VoltageDEV - Discharge Extinct VoltageC - CapacitanceDF - Dissipation FactorIR - Insulation ResistancePI - Polarization IndexPDC - Polarization and Depolarization CurrentFRA - Frequency Response AnalysisSFRA - Sweep Frequency Response AnalysisDS - Dielectric SpectroscopyFDS - Frequency Domain Dielectric SpectroscopyTDS - Time Domain Dielectric SpectroscopySGC - Semiconductive Slot CoatingSCI - Squirrel Cage Induction (Motor)


Contents
1 Introduction 11.1 Background . . . . . . . . . . . . . . . . . . . . . . . . . . . . 11.2 Project Objectives . . . . . . . . . . . . . . . . . . . . . . . . 11.3 Project Methodology . . . . . . . . . . . . . . . . . . . . . . . 21.4 Project Disposition . . . . . . . . . . . . . . . . . . . . . . . . 2
2 Insulation of Rotating machines 52.1 Stator winding construction . . . . . . . . . . . . . . . . . . . 52.2 Stator insulation system . . . . . . . . . . . . . . . . . . . . . 52.3 Range of Generators . . . . . . . . . . . . . . . . . . . . . . . 6
3 Diagnostic Techniques 73.1 Partial discharge . . . . . . . . . . . . . . . . . . . . . . . . . 73.2 Insulation resistance (IR) and polarization index (PI) . . . . . 93.3 Dielectric Spectroscopy (DS) . . . . . . . . . . . . . . . . . . . 10
3.3.1 Polarization and depolarization current (PDC) measure-ment . . . . . . . . . . . . . . . . . . . . . . . . . . . . 11
3.3.2 Capacitance, dissipation factor(tanδ)/power factor tip-upTest . . . . . . . . . . . . . . . . . . . . . . . . . . . . 12
3.3.3 Dielectric test for drying/manufacturing process moni-toring . . . . . . . . . . . . . . . . . . . . . . . . . . . 18
3.4 Sweep Frequency Response Analysis (SFRA) . . . . . . . . . . 193.5 On-line monitoring . . . . . . . . . . . . . . . . . . . . . . . . 21
3.5.1 On-line Partial Discharge Monitoring . . . . . . . . . . 223.5.2 On-line Capacitance and Dissipation Factor Monitoring 23
4 Testing 254.1 Megger’s Device . . . . . . . . . . . . . . . . . . . . . . . . . . 254.2 Equivalent model . . . . . . . . . . . . . . . . . . . . . . . . . 27
4.2.1 Equivalent model of individual coils and bars . . . . . . 274.2.2 Equivalent model of three-phase stator winding . . . . 28
5 Calculation 315.1 Capacitance, Power/Dissipation factor test at 50 Hz/60 Hz . . 315.2 Capacitance, Power/Dissipation factor tip-up tests at 50 Hz/60 Hz 335.3 Insulation resistance/Polarization test . . . . . . . . . . . . . . 34

5.4 Dielectric Spectroscopy (DS) test . . . . . . . . . . . . . . . . 345.4.1 TDS: Polarization and depolarization current in Time
Domain . . . . . . . . . . . . . . . . . . . . . . . . . . 355.4.2 FDS: Frequency Domain Dielectric Spectroscopy test . 36
5.5 Influence of Moisture and Aging . . . . . . . . . . . . . . . . . 37
6 Case Study 396.1 Purpose of case study . . . . . . . . . . . . . . . . . . . . . . . 396.2 Experimental setup . . . . . . . . . . . . . . . . . . . . . . . . 39
6.2.1 Test Object . . . . . . . . . . . . . . . . . . . . . . . . 396.2.2 Testing set-up . . . . . . . . . . . . . . . . . . . . . . . 40
6.3 Results . . . . . . . . . . . . . . . . . . . . . . . . . . . . . . . 45
7 Closure 517.1 Conclusions and Future Work . . . . . . . . . . . . . . . . . . 51

Diagnostics of Rotating Machines Page 1 of 56
1 Introduction
This is a project in the course EI270X Electromagnetic Engineering, Mas-ter Thesis at KTH cooperated with Megger and it has been supervised byNathaniel Taylor and Roya Nikjoo.
1.1 Background
Rotating machines including generators and motors, play an essential role inindustrial application and is significant to the reliability of the operation inelectrical systems. Unexpected failures that are caused by unhealthy condi-tion of the machines’ insulation, such as thermal deterioration, impurities ormoisture content in insulation, might lead to sudden breakdown of the wholemachinery equipment. This causes economic losses and influence of the relia-bility and security in industries. Therefore, diagnosis and condition monitoringof rotating machine is vital for preventing the failures and large damages inadvance, by understanding the condition of the rotating machines and guaran-teeing sufficient maintenance. Also, manufacturers of rotating machinery areresponsible for executing diagnostic tests to ensure the proven quality of theinsulation system before applying in production [1].
Effective insulation system tests including off-line tests and on-line monitoringare applied for diagnoses of rotating machines. Since for rotating machines, theconstruction and materials of the insulation system are different from trans-formers. Different standards are defined for rotating machines diagnoses: testset-up and related test parameters requirement (e.g. test frequency, voltageand current limit,etc). Megger provides advanced insulation tests instruments,but their testing devices are mostly focus on the diagnoses of power transform-ers and cables insulation. This thesis work is to investigate the possibilities ofusing these devices for a certain type and range of the rotating machines, aswell as the influence of the test parameter set-up.
1.2 Project Objectives
The main objective of this project is to investigate the possibility and applica-bility for diagnoses of rotating machines by applying several existing devices
1

Diagnostics of Rotating Machines Page 2 of 56
that are mainly used for transformer or power cables. This includes four as-pects:
• General investigation
• Theoretical calculation
• Experimental study and verification, as well as influence of the test set-up factors, such as the test frequencies etc.
1.3 Project Methodology
The approach to achieve the project objectives consists of the following as-pects:
• Investigate existing general tests as well as the potential techniques thatcan be applied for diagnostics of rotating machines. Study and summa-rize from corresponding standards.
• Study the function and specification of the market-existing devices forinsulation diagnosis, including IDAX, CDAX, FRAX and TRAX.
• Summarize the types of diagnostics tests as well as calculate to approxi-mate the range of the rotating machines that the devices can be used asmeasurement instruments. Comparison between requirements and thespecification or limitation of the specific devices.
• Perform diagnostic tests in lab with Megger’s instruments for case study.Study influence of the test set-up factors, such as the test frequencies etc
1.4 Project Disposition
The following chapter introduce the insulation system of rotating machinery.The third chapter will begin with summarizing the generally used diagnos-tic measurements that are applied for rotating machines, including appliedsignals, measured quantities, interpretations and other details for each testmethods. Then, literature study of developing diagnostic methods such as on-line monitoring is performed. In chapter four, the investigation of the existingdiagnostic devices that are mainly used in transformer and equivalent model
2

Diagnostics of Rotating Machines Page 3 of 56
for insulation system of both individual coil/bar and whole stator windingsare included. The fifth chapter will analyze the possibilities of the devices toperform measurements by theoretical calculation, and then study regardingto the influence of moisture and aging are included. Later in the sixth chap-ter, case study will be performed, which contains three diagnostic tests ona 7.2 kV stator coil based on the discussed devices in previous chapter. Thelast chapter will contain conclusion of the project and future study for futureinvestigation.
3

Diagnostics of Rotating Machines Page 5 of 56
2 Insulation of Rotating machines
2.1 Stator winding construction
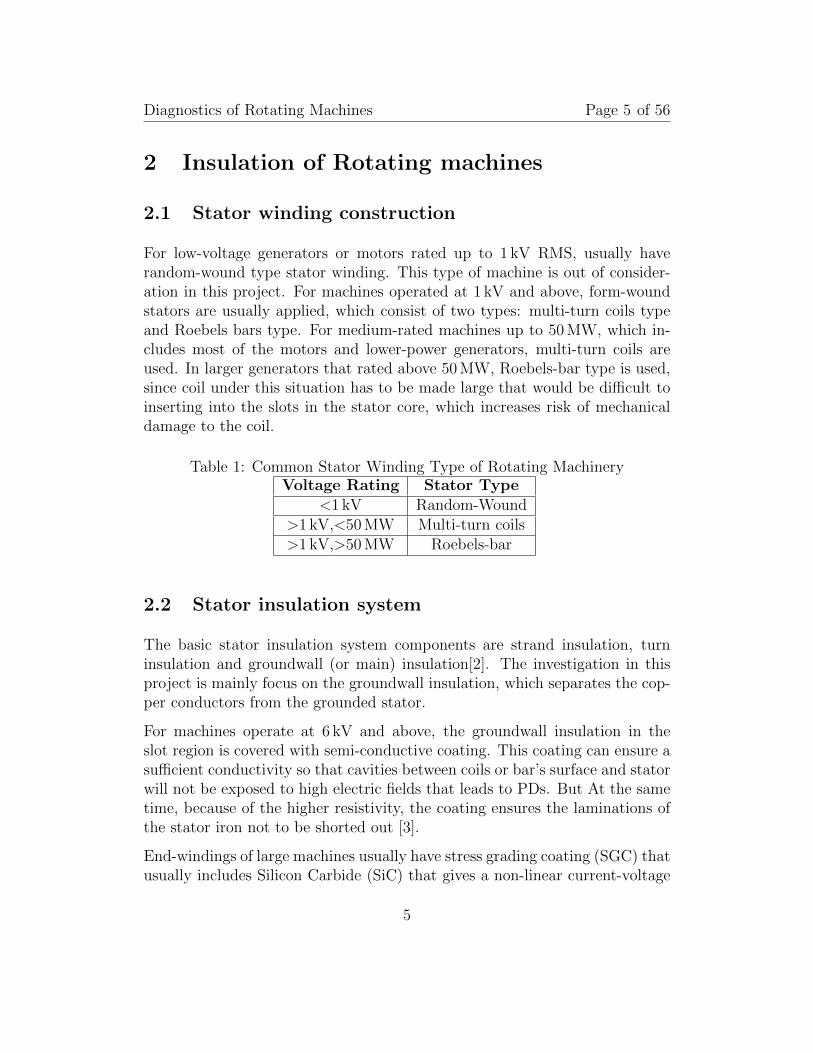
For low-voltage generators or motors rated up to 1 kV RMS, usually haverandom-wound type stator winding. This type of machine is out of consider-ation in this project. For machines operated at 1 kV and above, form-woundstators are usually applied, which consist of two types: multi-turn coils typeand Roebels bars type. For medium-rated machines up to 50 MW, which in-cludes most of the motors and lower-power generators, multi-turn coils areused. In larger generators that rated above 50 MW, Roebels-bar type is used,since coil under this situation has to be made large that would be difficult toinserting into the slots in the stator core, which increases risk of mechanicaldamage to the coil.
Table 1: Common Stator Winding Type of Rotating MachineryVoltage Rating Stator Type
<1 kV Random-Wound>1 kV,<50 MW Multi-turn coils>1 kV,>50 MW Roebels-bar
2.2 Stator insulation system
The basic stator insulation system components are strand insulation, turninsulation and groundwall (or main) insulation[2]. The investigation in thisproject is mainly focus on the groundwall insulation, which separates the cop-per conductors from the grounded stator.
For machines operate at 6 kV and above, the groundwall insulation in theslot region is covered with semi-conductive coating. This coating can ensure asufficient conductivity so that cavities between coils or bar’s surface and statorwill not be exposed to high electric fields that leads to PDs. But At the sametime, because of the higher resistivity, the coating ensures the laminations ofthe stator iron not to be shorted out [3].
End-windings of large machines usually have stress grading coating (SGC) thatusually includes Silicon Carbide (SiC) that gives a non-linear current-voltage
5

Diagnostics of Rotating Machines Page 6 of 56
characteristic. SGC is applied from the end of the winding’s semi-conductivecoating mentioned above, with overlap of several centimeters. This techniqueallows the surface potential falls off smoothly along the end-winding insula-tion surface towards the stator and thus efficiently prevent surface discharges[3][4].
The materials that are typically used in groundwall insulation system forhigh-voltage machines are mica-based products, since mica has good dielectricstrength even at high temperature and contributes to preventing PD activi-ties. Asphalt bonded mica is generally used in older insulation system, but itbecomes most common to use epoxy bonded mica tape material, with vacuumpressure impregnation (VPI) technology used for drying during manufacturingprocess [5].
2.3 Range of Generators
The range of generators are summarized in Table 2 in order to give a generalview of their rotor types and different ratings, which are important factors forinvestigating relevant diagnostic methods and ratings of testing devices.
Table 2: Common Type of Rotating Machines and ratingsType Turbo-generator Hydro-generator SCI motors
Rotor Type Round Rotor Salient Pole Rotor SCI RotorPower Rating >2000 MW >500 MW >60 MW
Voltage Rating 4.7 kV to 13.8 kV 11 kV or higher >35 kV
Note: Rating in Table 2 are refer to high-voltage machinery.
6
Diagnostics of Rotating Machines Page 7 of 56
3 Diagnostic Techniques
In this chapter, the traditional and general industrial diagnostic methods uti-lized in rotating machines are introduced, followed by the summary of litera-ture study of innovated methods such as on-line monitoring technique. Thissection is aimed to give a system view of the related defects, applied signals,interpretation of measurement results and influence of environment factors indifferent possible diagnostic methods.
Here is the summary of existing and potential diagnostic techniques in rotat-ing machines, based on study of [2]. Summary tables are listed in Appendixaccording to IEEE standard [6],[7] and [8]:
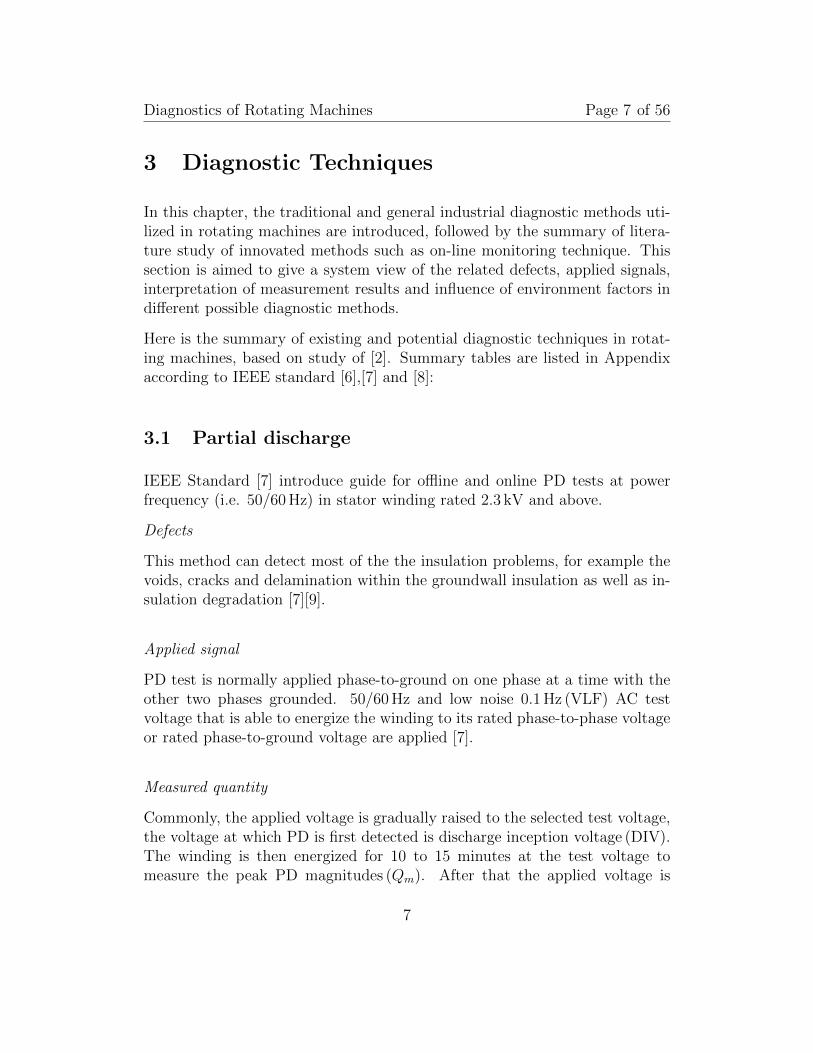
3.1 Partial discharge
IEEE Standard [7] introduce guide for offline and online PD tests at powerfrequency (i.e. 50/60 Hz) in stator winding rated 2.3 kV and above.
Defects
This method can detect most of the the insulation problems, for example thevoids, cracks and delamination within the groundwall insulation as well as in-sulation degradation [7][9].
Applied signal
PD test is normally applied phase-to-ground on one phase at a time with theother two phases grounded. 50/60 Hz and low noise 0.1 Hz (VLF) AC testvoltage that is able to energize the winding to its rated phase-to-phase voltageor rated phase-to-ground voltage are applied [7].
Measured quantity
Commonly, the applied voltage is gradually raised to the selected test voltage,the voltage at which PD is first detected is discharge inception voltage (DIV).The winding is then energized for 10 to 15 minutes at the test voltage tomeasure the peak PD magnitudes (Qm). After that the applied voltage is
7
Diagnostics of Rotating Machines Page 8 of 56
gradually lowered, when PD is no longer observable, record this voltage as thedischarge extinction voltage (DEV).
If the recording device for PD pulses is a phase-resolved pulse magnitudeanalyzer (PRPD), the PD pattern can be produced, which contains the infor-mation about the number, magnitude and phase position of PD with respectto the AC cycle.
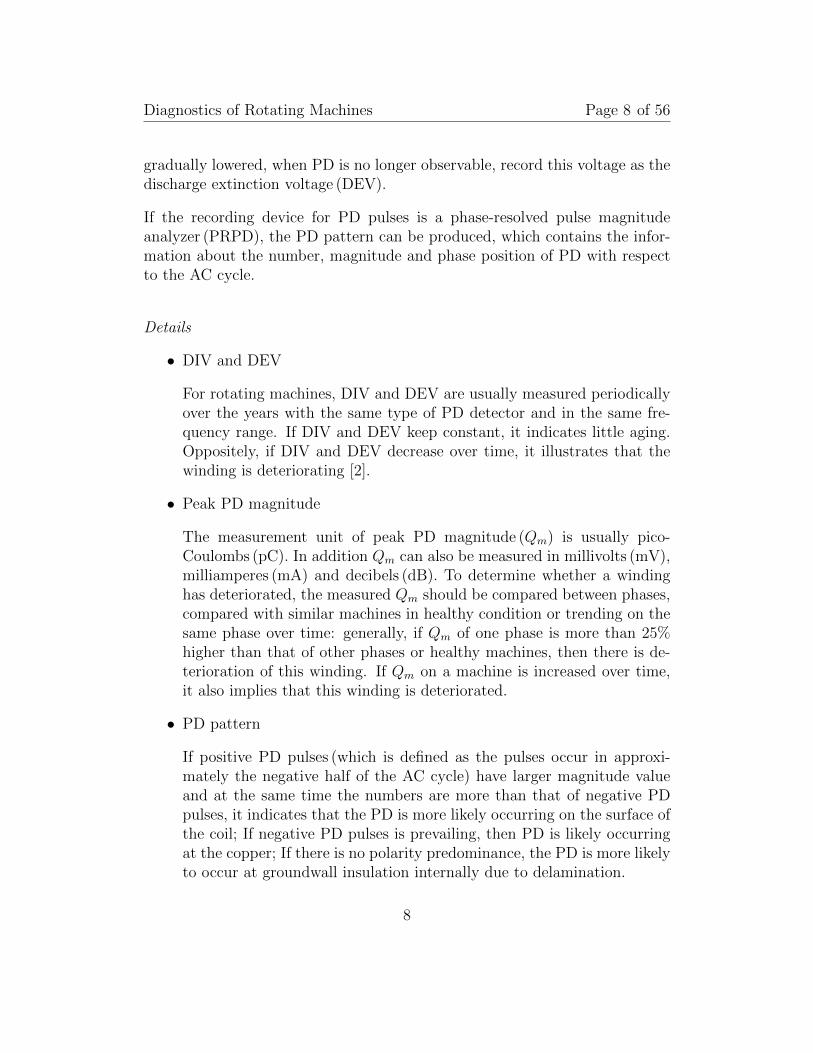
Details
• DIV and DEV
For rotating machines, DIV and DEV are usually measured periodicallyover the years with the same type of PD detector and in the same fre-quency range. If DIV and DEV keep constant, it indicates little aging.Oppositely, if DIV and DEV decrease over time, it illustrates that thewinding is deteriorating [2].
• Peak PD magnitude
The measurement unit of peak PD magnitude (Qm) is usually pico-Coulombs (pC). In addition Qm can also be measured in millivolts (mV),milliamperes (mA) and decibels (dB). To determine whether a windinghas deteriorated, the measured Qm should be compared between phases,compared with similar machines in healthy condition or trending on thesame phase over time: generally, if Qm of one phase is more than 25%higher than that of other phases or healthy machines, then there is de-terioration of this winding. If Qm on a machine is increased over time,it also implies that this winding is deteriorated.
• PD pattern
If positive PD pulses (which is defined as the pulses occur in approxi-mately the negative half of the AC cycle) have larger magnitude valueand at the same time the numbers are more than that of negative PDpulses, it indicates that the PD is more likely occurring on the surface ofthe coil; If negative PD pulses is prevailing, then PD is likely occurringat the copper; If there is no polarity predominance, the PD is more likelyto occur at groundwall insulation internally due to delamination.
8

Diagnostics of Rotating Machines Page 9 of 56
3.2 Insulation resistance (IR) and polarization index (PI)
This method is one of the most common tests that practically applied in motorand generator windings.
Defects
This method can detect as well as locates contamination, major flaws such ascracks or cuts in the insulation. It is a good indicator of thermal deteriorationand whether the windings are soaked with moisture.
Applied signal
In this method, well regulated DC voltage should be applied. Higher testvoltages are more likely to find major defects, but should be still well belowthe rated peak line-to-ground voltage of the windings. The IEEE standard[7] shows the recommended applied voltage when testing machines of differentrating as in Table 3.
Table 3: Recommend Test Voltages in IR test [7]Winding rated voltage (V) IR test voltage (V)
< 1000 5001000− 2500 500-10002501− 5000 1000-25005001− 12000 2500-5000> 12000 5000-10000
Measured quantity
For IR test, the resistance of the insulation between the copper conductorsand the stator core is measured after applying DC test voltage for specifictime, usually the value at 1 min is collected. The current is measured by asensitive ammeter that is able to measure currents smaller than nanoamp. Bymeasuring the current It, The IR at time t can be calculated by:
Rt =V
It(1)
PI is a ratio of IR at two different times. In practice, PI can be defined as the
9

Diagnostics of Rotating Machines Page 10 of 56
ratio of the IR when DC voltage has been applied for 10 minutes(R10) to IRvalue collected at 1 minute(R1), as shown in Equation 2.
PI =R10
R1
(2)
Details
According to [7], the recommended minimum IR value for most stator windingsmanufactured after 1970 is 100 megaohms (at 40 C). The measured currentis the total current consists of several current component, including capacitivecurrent, conduction current, leakage surface current and absorption current.However, the currents that are taken into consideration for evaluating thewinding condition are the leakage and conduction currents, since they arecaused by surface contamination and moisture or cracks, respectively. The ab-sorption current is still non-zero after applying DC voltage for just one minute,but it will decay to zero after about 10 minutes. Also, IR values are stronglyeffected by the temperature. Thus the result of IR at 1 minute R1 is sometimesunreliable. PI test should be added to reduce the influence of the temperatureand give a more reliable interpretation: If PI ≈ 1, means the leakage andconduction current are much larger than the absorption current, this indicatesthat the winding is soaked with water or contaminated; If PI > 2, meansleakage and conduction currents are relatively low, which indicates that thewinding is dry and clean.
3.3 Dielectric Spectroscopy (DS)
Dielectric Spectroscopy (DS) methods are widely applied in diagnostic mea-surements on high-voltage machines. In addition to off-line tests, novel tech-nique of on-line condition monitoring are developed nowadays. DS meth-ods can be divided to two types according to time or frequency dependency:Time domian Dielectric Spectroscopy (TDS) and Frequency Domain Spec-troscopy (FDS). TDS methods mainly includes polarization and depolarizationcurrent measurements (PDC) and capacitance,dissipation factor (DF/tanδ)/powerfactor (PF) tip-up tests. FDS test mainly implies to Sweep Frequency Re-sponse Analyzer (SFRA).
10

Diagnostics of Rotating Machines Page 11 of 56
3.3.1 Polarization and depolarization current (PDC) measurement
Defects
PDC measurement is sensitive to detect bulk insulation degradation such asdelamination caused by thermal deterioration or damaged stress relief coat-ings. Also, contamination of stator end winding can also be detected.[10]
Applied signal
A DC voltage (up to rated voltage) is applied across the test object for 10-20minutes. Then the applied voltage is removed and the test object is groundedthrough measuring instrument. The applied voltage waveform is shown inFigure 3.3.1.
tCharging time Discharging time
U(t)
Vdc
Measured quantity
The current measured simultaneously when the DC voltage is applied is re-ferred to the ’polarization’ current. Then the winding is discharged to groundthrough the PDC instrument, the current measured at the same time is the’depolarization’ current.
Details
PDC plot that includes both of the charge and discharge current versus relativetime (i.e. set the time to zero when discharging starts, so that the depolarizingcurrent is assigned a positive current) gives the comparisons between the two
11

Diagnostics of Rotating Machines Page 12 of 56
current. A difference in these two current in a test indicates an insulationproblem. Different faults and defects can be identified according to PDC plotscharacteristic [2].
3.3.2 Capacitance, dissipation factor(tanδ)/power factor tip-up Test
Nowadays, the capacitance and dissipation factor tip-up tests are commonlyused in industries for diagnostic of high-voltage insulation in rotating ma-chines. Practically, C/DF tip-up tests are applied for individual stator coilsor bars of rotating machines at any voltage level as well as form-wound sta-tor windings rated 2300 V and above, which is also considered as an indirectpartial discharge test.
Defects
Tip-up test can detect most of defects that appear within the groundwall in-sulation, such as the small voids, cracks and contamination or uncured resinsections. The method is also effective to present problems including thermaldeterioration or saturation of the insulation by moisture or water leak withinthe bulk of insulation [6].
Applied Signal
High or low AC voltage is applied and the power-frequency voltage sourceis usually used. Generally the tests are performed at low voltage. But intip-up test, the applied voltage is changed between different voltage levels,commonly from 20% to 100% of the rated phase-to-phase voltage of the statorwindings (notated as E), with an increment of 20%E.
Measured quantity
In traditional tests, the capacitance are measured with calibrated capacitancebridges that have a precision better than 0.1%. Dissipation factor (DF) orpower factor (PF) can be measured at the same time in capacitance measure-ment test, by calculating the R and C elements that give the null reading ofdetector (i.e. a balanced bridge) in the bridge-type instrument that mentionedabove. Another method is to measure the phase angle between the voltage and
12
Diagnostics of Rotating Machines Page 13 of 56
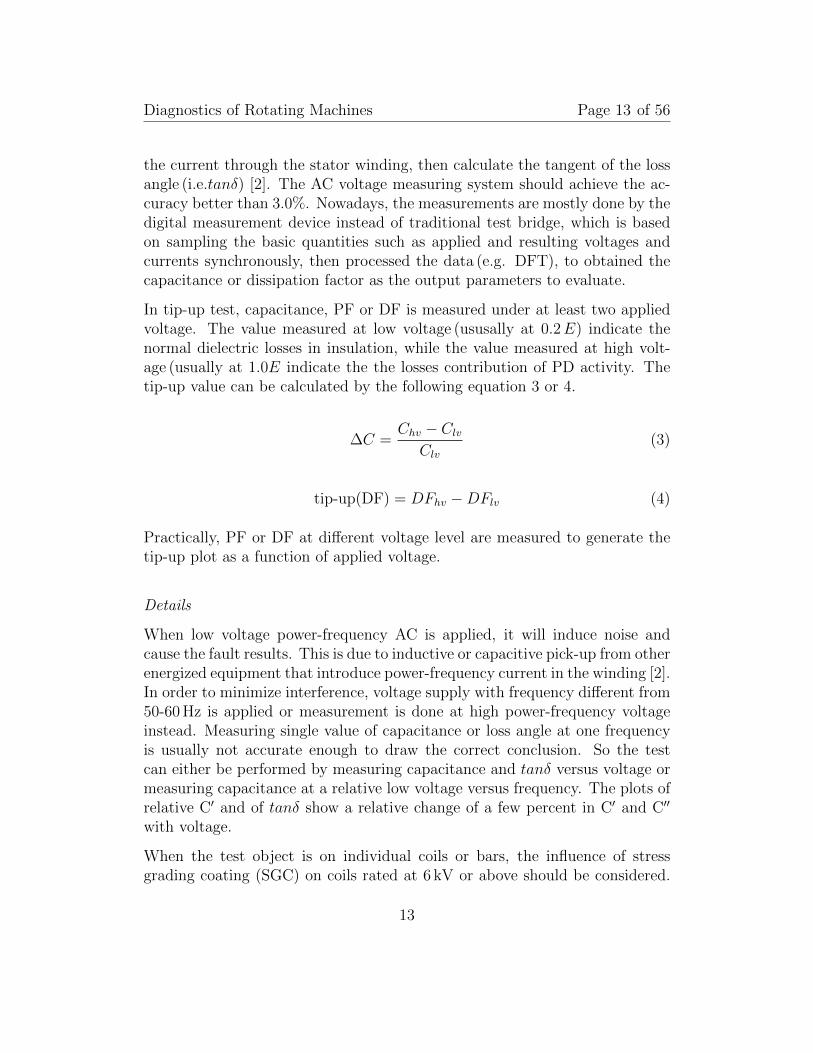
the current through the stator winding, then calculate the tangent of the lossangle (i.e.tanδ) [2]. The AC voltage measuring system should achieve the ac-curacy better than 3.0%. Nowadays, the measurements are mostly done by thedigital measurement device instead of traditional test bridge, which is basedon sampling the basic quantities such as applied and resulting voltages andcurrents synchronously, then processed the data (e.g. DFT), to obtained thecapacitance or dissipation factor as the output parameters to evaluate.
In tip-up test, capacitance, PF or DF is measured under at least two appliedvoltage. The value measured at low voltage (ususally at 0.2E) indicate thenormal dielectric losses in insulation, while the value measured at high volt-age (usually at 1.0E indicate the the losses contribution of PD activity. Thetip-up value can be calculated by the following equation 3 or 4.
∆C =Chv − Clv
Clv
(3)
tip-up(DF) = DFhv −DFlv (4)
Practically, PF or DF at different voltage level are measured to generate thetip-up plot as a function of applied voltage.
Details
When low voltage power-frequency AC is applied, it will induce noise andcause the fault results. This is due to inductive or capacitive pick-up from otherenergized equipment that introduce power-frequency current in the winding [2].In order to minimize interference, voltage supply with frequency different from50-60 Hz is applied or measurement is done at high power-frequency voltageinstead. Measuring single value of capacitance or loss angle at one frequencyis usually not accurate enough to draw the correct conclusion. So the testcan either be performed by measuring capacitance and tanδ versus voltage ormeasuring capacitance at a relative low voltage versus frequency. The plots ofrelative C′ and of tanδ show a relative change of a few percent in C′ and C′′
with voltage.
When the test object is on individual coils or bars, the influence of stressgrading coating (SGC) on coils rated at 6 kV or above should be considered.
13

Diagnostics of Rotating Machines Page 14 of 56
The material of SGC is commonly silicon carbide, which is semiconductive.At low voltage, the resistance of SGC is very high and basically no currentflows through it, which means there is no power loss contributing from thecoating. However, when the test voltage is high enough, the resistance of thecoating will be relatively low. The capacitive current flows through the coatingthat produce power loss (i.e. I2R) , and contribute to a high tip-up result (forexample 2% or 3%) in the measurement[11].
When testing the complete winding of rotating machine, the line and neutralterminals of phase-winding should be connect together to be energized and toensure a constant voltage across the entire phase-winding. The terminal ofeach phase-winding should be isolated and the measurement on each phase-winding at chosen voltages should be done independently. The results can beinterpreted by comparing between phases or comparing with other measure-ment on new machines in the same type.
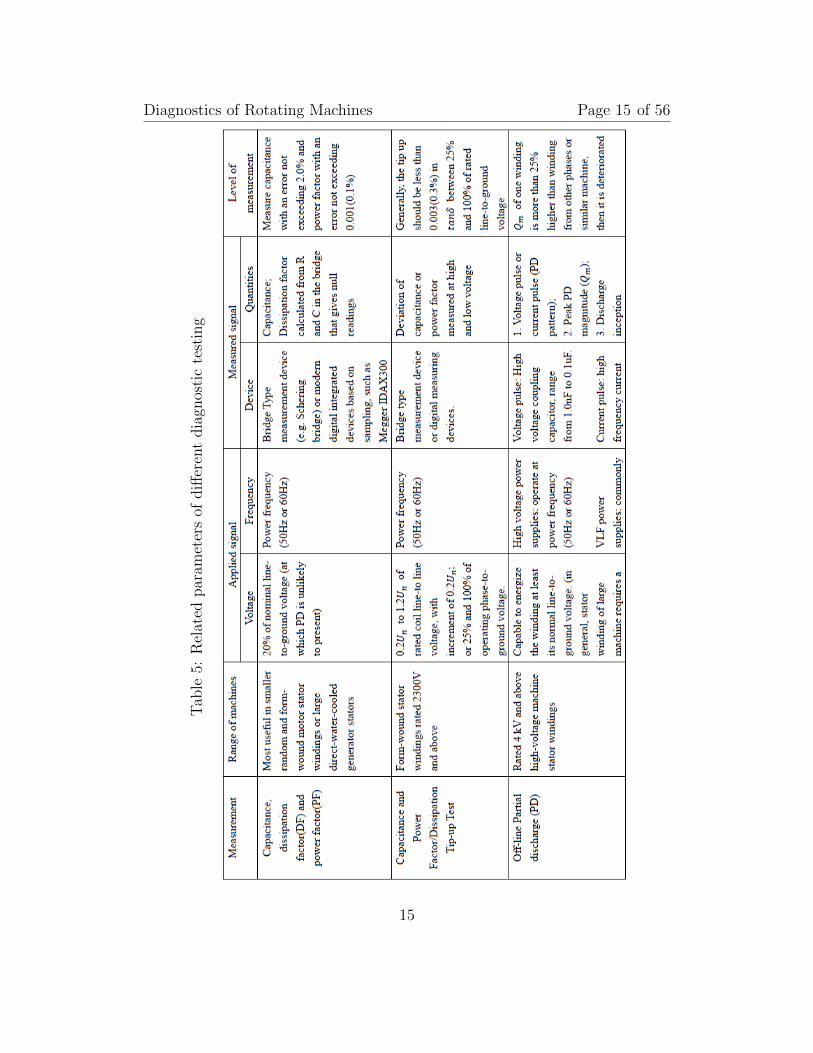
The important parameters for general diagnostic tests for rotating machinesdiscussed above are summarized in Table 4. And literature study of newtechnology are described in following subsections.
Table 4: Possible Detected Defects Regarding Different Methods
14
Diagnostics of Rotating Machines Page 15 of 56
Tab
le5:
Rel
ated
par
amet
ers
ofdiff
eren
tdia
gnos
tic
test
ing
15

Diagnostics of Rotating Machines Page 16 of 56
16

Diagnostics of Rotating Machines Page 17 of 56
17

Diagnostics of Rotating Machines Page 18 of 56
3.3.3 Dielectric test for drying/manufacturing process monitor-ing
Assessment of the manufacturing and drying process of stators is one of themost important application of dielectric response test. Tests that can be ap-plied in the manufacturing process are mainly Capacitance measurement andDF/PF measurement.
Capacitance tests can be applied to monitor the penetration and curing statusduring manufacturing process of coils, bars or global VPI stators. This isaccording to the change of dielectric constant of dielectric materials in differentstates: epoxy and polyester-impregnating resins have a very high dielectricconstant (i.e. relative permittivity, εr) when in the liquid state, which is muchhigher than that of air or vaccum; But in the curing process, the dielectricconstant progressively decreases when it cures to a solid, and reaches lowvalue around 4.
For example, during the vacuum pressure impregnation (VPI) process, whenthe coils or stators are first impregnated with liquid resin, the capacitance willbe higher due to the replacement of the air or vacuum between the mica-papertape layers [12]. Then the capacitance will reach a high steady-state valuewhen complete impregnation is achieved [9]. Then during the cure progress,the capacitance starts to decrease as it becomes solid. By monitoring andanalyzing the trend of capacitance during manufacturing process, a betterpenetration time and a optimal cure time can be determined.
Dissipation (or Power) Factor test (i.e. DF/PF test) is also employed by someoriginal equipment manufacturers (OEMs) to determine when the resin innewly manufactured coils, bars, or global VPI stators is cured.
Dissipation factor (DF or tanδ) is the electrical property of insulation materialsthat defined as the ratio between capacitive reactance to its equivalent seriesresistance (ESR) at a specified frequency, or can be decribed as a ratio betweenthe material’s permittivity and the conductivity. This can be represented byequation 5
DF =ICIR
=ε
σ(5)
DF tests can be used by coil manufacturers as a process monitor for the im-
18

Diagnostics of Rotating Machines Page 19 of 56
pregnation process. This is based on the fact that as the ground wall is im-pregnated, the DF value will gradually increase, since the resin is replacing air,and that liquid resin has a higher DF than the air due to the increased relativepermittivity. When the coil is in curing process, the DF will decrease untilreach its steady level, because the DF of the cured solid epoxy or polyester islower than that of liquid resin.
In conclusion, capacitance measurements and DF/PF tests are applied to de-termine: [9].
a) When the resin has impregnated a coil, bar, or global VPI stator;
b) When the resin has cured
Literature study
[13] introduces the global insulation cure monitoring of large AC motor statorwindings processed through global vacuum pressure impregnation (VPI), andshows that the best frequency range for cure monitoring purpose is 100Hz to500Hz. [14] studies the measurement of the dielectric response during the cur-ing of the epoxy-mica tape to relate the degree of curing to dielectric response.[15] lists different techniques applied in cure monitoring, including dielectricmeasurements. It indicates the methods of using dielectric sensors to monitorthe current response when applying AC in different frequencies. The reliableassessment of cure states can be completed by comparison with characteristicspectrum curve alongside with temperature information and pressure measure-ment.
3.4 Sweep Frequency Response Analysis (SFRA)
SFRA method is based on the fact that the electrical circuit in the stator androtor can be equivalent to a complex electrical network consists of resistance,capacitance and inductance that has its unique frequency response pattern.SFRA method is mainly used to measure the frequency response to evaluatethe state of the power transformer [16]. However, this method is not practicallyused for diagnostics of rotating machine in industry. The reason is that inrotating machine, there is rotor winding and the stator winding is placed into
19

Diagnostics of Rotating Machines Page 20 of 56
slots, which make the high-frequency equivalent circuits of the windings inrotating machines are more complicated than that of power transformers.
Defects
SFRA test has potential to detect inter-turn faults that usually caused bymechanical stress in the pole windings of machines during factory acceptancetesting or routine maintenance testing [17] This method is usually applied fordiagnosis of turn-to-turn fault in coils during the manufacturing process ofrotating machines.
Applied Signal
A varying-frequency low-voltage sinusoidal signal is applied at the input of themeasured winding of the rotating machine.
Measured quantities
The input voltage as well as the amplitude and the phase shift of the outputsignal (i.e. output voltage) at the end of this winding are measured.The ratiopresented in dB is calculated as 20 log(Uout/Uin) for each frequency and theresults are plotted as a frequency dependent curve. The measured outputfrequency response is dependent on the overall impedance.
Details
If there are any defects, changes or fault in the windings, there will be achange of the equivalent network. As a result, there will also be a changein corresponding frequency response. Therefore, by comparing the measuredfrequency response curve over time or with the reference curve of the identicalmachines that is captured when the machine is new or in healthy condition, thedefects could be analyzed. When different response patterns are occurred, itindicated that there might be mechanical changes in measured windings.
Literature Study
[18] performed tests in an individual medium-voltage stator coil and extendthe test to induction motor stator winding. The results indicated that inter-turn fault in coils can be clearly detected while in stator winding, only presentslight changes in frequency response. Also, inter-turn faults imply changes inthe high frequency zone.
[16][19] perform experimental measurements and analysis on induction mo-
20
Diagnostics of Rotating Machines Page 21 of 56
tors to implement the measurement procedure and analysis of SFRA for fail-ure identification by comparing the methodology used for power transformers[16]. presented that SFRA can be applied for off-line diagnosis to indicateinter-winding short-circuit fault that the measurements of winding resistancesand insulation resistances can not reveal. While [19] pointed out that it washard to confirm the type of malfunction and the location of the fault. Newmeasurements should be done to form the database of SFRA frequency re-sponse patterns. [20] investigate SFRA method for detection of inter-turnfaults within the coils by performing tests on medium-voltage coils. In thisstudy, the grounding connection that is first studied due to the fact that thecoil is normally inside the stator of rotating machines. Then the coils un-der test are modified to perform the investigation. The study concludes thatSFRA is an easy way to detect manufacturing defect or inter-turn fault ofcoils. However, to locate the exact location of the fault inside coil should befurther studied.
3.5 On-line monitoring
The motivation of investigating on-line monitoring test are as follows:
a) Off-line tests are performed when the machine is not in service, which re-quires at least a short outage, but on-line tests can be done during operationof the machine.b) Off-line tests cannot be performed frequently, so it is hard to identify aproblem in time and guarantee a reliable operation. Instead, on-line monitor-ing can observe the trend so that to prevent the insulation failure in advance.c) On-line tests can avoid the problem of supplying the test voltage to highcapacitance regarding to the large generators or motors.d) On-line tests with data acquisition technique can also observe environ-mental (temperature, humidity, etc.) or service conditions (e.g. changes inload) in time and build more accurate analyze pattern with these correlationdata.
The two major on-line monitoring of interests are on-line partial discharge andon-line capacitance and dissipation factor monitoring.
21

Diagnostics of Rotating Machines Page 22 of 56
3.5.1 On-line Partial Discharge Monitoring
As PD activity is often presented well in advance of insulation failure, theproper on-line monitoring will predict the failures so that the maintenance willbe performed in optimal scheduled way that considerably reduce maintenancecosts and increase its effectiveness.
Main theory:
The On-line PD testing are commonly under VHF (Very High Frequency)range of instead of working in LF (Low frequency) range of 30 kHz-3 MHzas off-line PD test. The PD monitoring system consists of sensors that havehigh accuracy of sensing the high frequency current from PD and wide rangeof frequency sensitivity. High-frequency current transformer (HFCT) are orig-inally used and nowadays high voltage capacitors installed on each phase ter-minal are the most commonly used sensors. Then the sampled analog pulsesignals are converted to digital form, such as pulse magnitude analyzers thatrecords the number of PD pulses per second versus PD magnitude as well asthe PRPD (phase resolved PD) analyzers that record the when the PD pulsesoccurred versus the power frequency AC cycle. After data acquisition, sig-nal processing techniques are used to discriminate PD signals from noises andconfirm reliable interpretation. Also, data processing also help analyze thepattern to identify the type of insulation failure is occurring [2].
Difficulties:
One of the main problems in on-line partial discharge measurement is thenon-neglected interference noise that results in false indication of the insula-tion condition. This is due to the fact that the monitoring system is workingwith the machine connected to the power system. The noises are commonly in-cluding corona from overhead transmission lines or electrostatic precipitators,poor eletrical contacts and etc.
To avoid this issue, studies are performed to develop the methods to sepa-rate the PD signals from interference, for example, PDA monitor system forhydro-generators and turbine generator analyzer (TGA) for motors and tur-bine generators.
literature study
[21] describes the PDA (Partial Discharge Analyzer) system with HV capaci-
22

Diagnostics of Rotating Machines Page 23 of 56
tors as sensors utilize a pulse-by-pulse noise rejection technique to eliminatenoise to ensure the accurate PD data acquisition.
[22] presented a hysteresis method for partial discharge analysis. The hys-teresis method is to utilize the size of a resulted curve and the area that thecurve creates as an indicator of the defects and deterioration in insulation.The patterns will vary when PDs occur variably within time. In on-line PDmonitoring method, the measurement results are collected, the condition ofinsulation will be indicated by hysteresis method.
[9] introduce on-line measuring of PD behavior could indirectly detect the vi-brating movement of the coils that might lead to thermal deterioration andabrasion of electrical insulation and eventually the likely failure. The articlealso explains this measurement could only be done online to successfully iden-tify the generator insulation caused by thermal and mechanical stress, sincewhen high-voltage machines are operating, the magnetic forces that act on thecoils would cause large enough air gaps that could be a necessary precursor ofPD.
3.5.2 On-line Capacitance and Dissipation Factor Monitoring
Main theory:
The main concept for monitoring the stator insulation condition on-line isto measure the leakage current flow through the stator insulation for eachphase. Since the capacitance of stator groundwall insulation can be deter-mined by C = IC/2πfV , where IC represents the capacitive leakage currentthrough the insulation when the voltage V is added across the insulation.This indicates that once the magnitude and phase angle of leakage currentare measured, C and DF can then be determined by its capacitive and re-sistive components. DF can be calculated by equation 5. The current sensorencloses both ends of the phase winding leads to measure the differential cur-rent of the line and neutral end of each phase winding, so that the leakagecurrent can be obtained since the stator load current are canceled in differen-tial measurement[23]. Phase-fault differential current transformers are usuallybe used for phase-to-phase or phase-to-ground fault protection, but the mea-surement of the leakage current does not have high precision. The insulationcondition can be indicated by capacitiance or DF value.
23

Diagnostics of Rotating Machines Page 24 of 56
Difficulties:
It is hard to conduct the online test on large motors since the difficulty inmeasuring the small motor insulation leakage currents (few mA), that theaccuracy of the online measurement is heavily influenced by the large loadcurrents (hundreds of amps) [24]. However, many researches performed showsthat there are high accuracy sensors such as high sensitivity differential currenttransformer (HSCT) are able to measure leakage current accurately and fulfillthe requirement of the on-line monitoring tests.
literature study
In [25] describes the detailed setup of on-line monitoring test. Several ex-perimental tests are performed on a 4160 V form wound motor with HSCTsinstalled in each phase of motor to monitor C/DF as well as partial dischargecouplers with RFCT (Radio drequency current transformer) installed to mon-itor PD activities. The conditions of test cases are created by applying con-taminant spray to end-winding while the motor is in service. While in [23],a more detailed set-up and process are described and the behaviors duringaccelerated life testing are analyzed. The researches draw a conclusion thataging, surface tracking and moisture of stator end-winding insulation can ob-served by the trending of insulation leakage current and loss angle as well asPD patterns.
24
Diagnostics of Rotating Machines Page 25 of 56
4 Testing
This chapter introduces and summarizes the specification of the market exist-ing devices for diagnoses that mainly used in transformer. Then the equivalentmodels of individual coils and bars as well as three-phase stator windings arestudied. This is aimed at pre-studying the devices and set-up in the actualtesting.
4.1 Megger’s Device
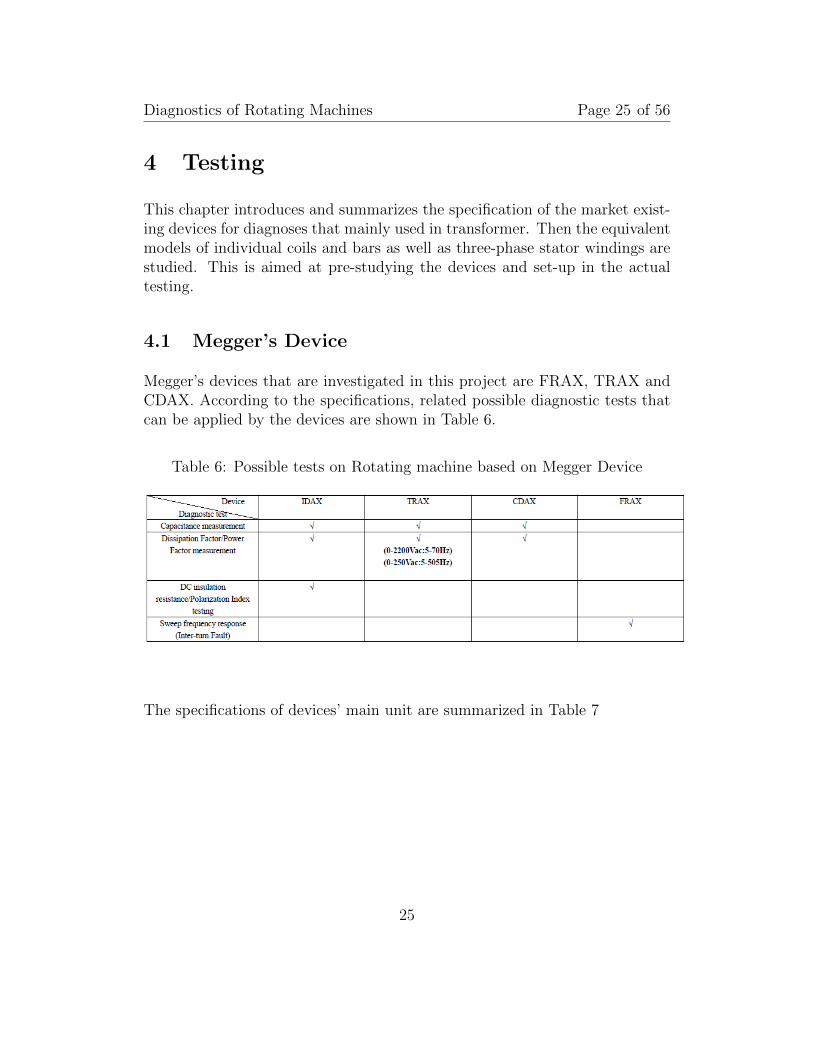
Megger’s devices that are investigated in this project are FRAX, TRAX andCDAX. According to the specifications, related possible diagnostic tests thatcan be applied by the devices are shown in Table 6.
Table 6: Possible tests on Rotating machine based on Megger Device
The specifications of devices’ main unit are summarized in Table 7
25

Diagnostics of Rotating Machines Page 26 of 56
Table 7: Device Specifications
The specifications of the accessories that can be applied with the main unitsdescribed above are summarized in Table 8
Table 8: Accessories Specifications
26
Diagnostics of Rotating Machines Page 27 of 56
4.2 Equivalent model
4.2.1 Equivalent model of individual coils and bars
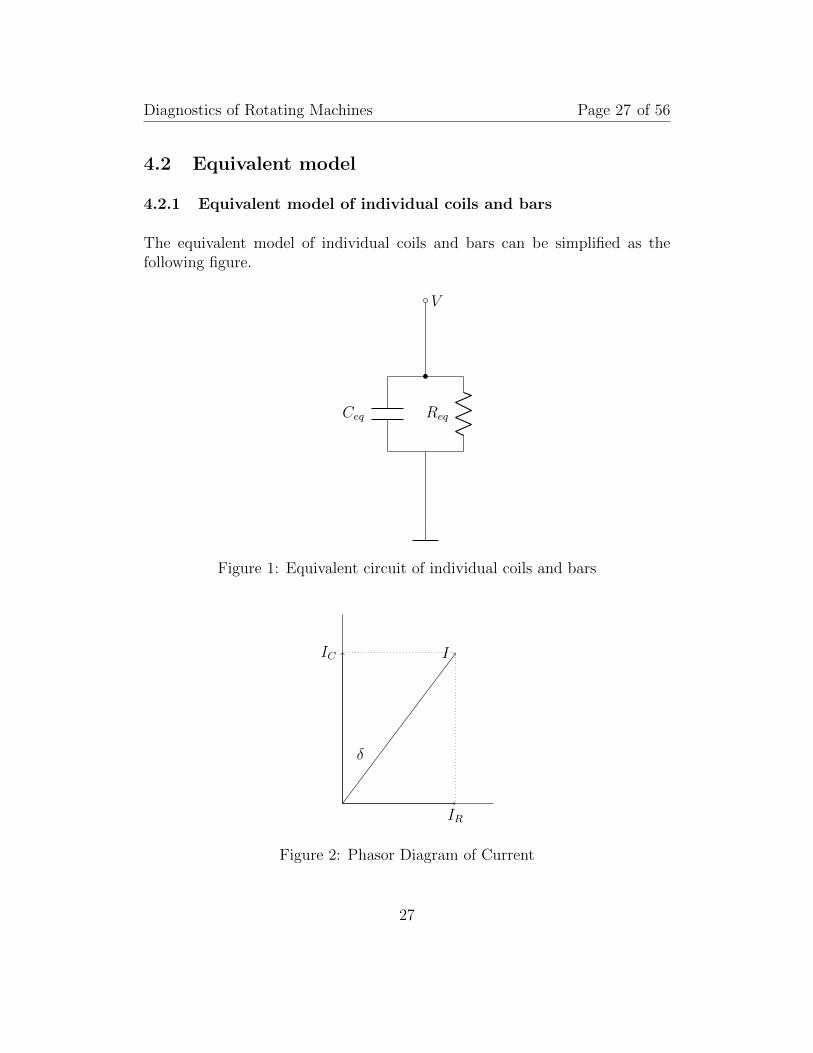
The equivalent model of individual coils and bars can be simplified as thefollowing figure.
Ceq
V
Req
Figure 1: Equivalent circuit of individual coils and bars
IR
IC I
δ
Figure 2: Phasor Diagram of Current
27

Diagnostics of Rotating Machines Page 28 of 56
In Figure 4.2.1, Ceq represents equivalent capacitance of groundwall insulationand Req represents dielectric loss. According to current vector diagram asFigure4.2.1,
DF = tanδ =IRIC
=1
ωCeqReq
=1
2πfCeqReq
(6)
I = V (jωCeq +1
Req
) (7)
In healthy bars or coils, Req is large enough:
|I| ≈ |IC | = 2πfV Ceq (8)
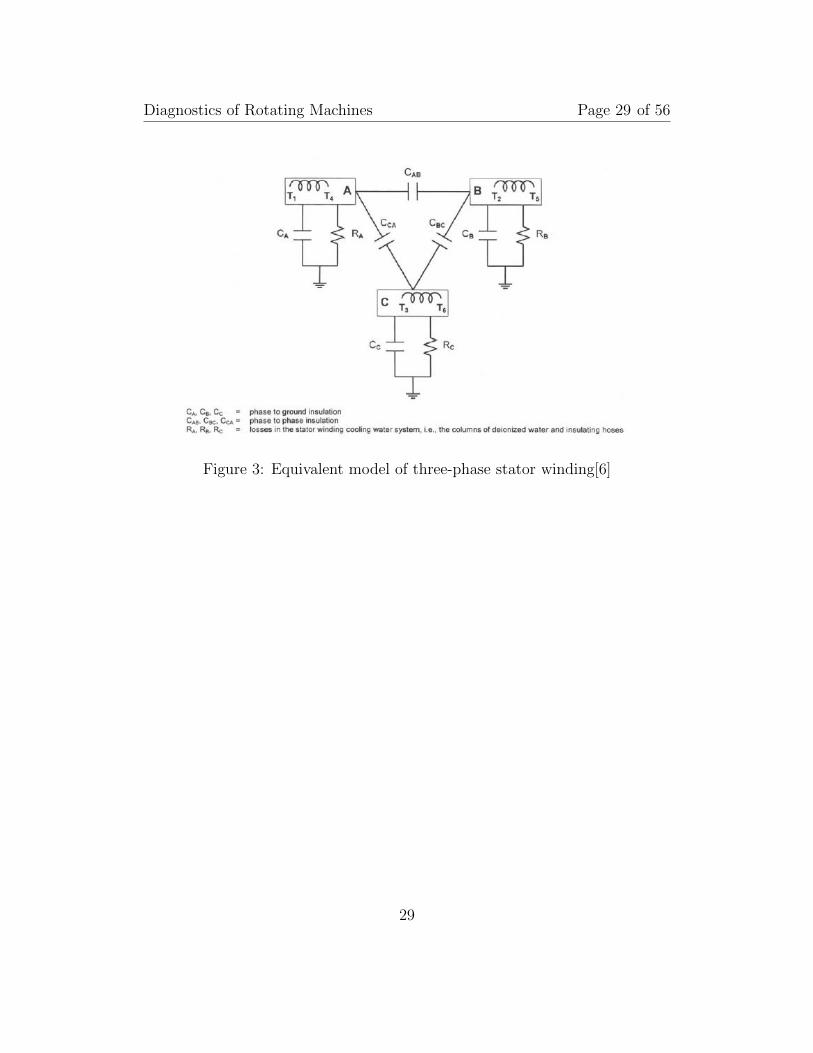
4.2.2 Equivalent model of three-phase stator winding
According to [6], equivalent model of three-phase stator winding is shown inFigure 3. To perform off-line tests such as DF/PF tip-up, the terminals ofeach phase-winding should be completely isolated. In other words, the lineterminals should be disconnected from the system and the neutral terminalsare disconnected from ground circuit, while the line and neutral terminals ofthe phase-winding are connected together so that it can be energized to ensurean constant voltage across the entire winding.
28
Diagnostics of Rotating Machines Page 29 of 56
Figure 3: Equivalent model of three-phase stator winding[6]
29

Diagnostics of Rotating Machines Page 31 of 56
5 Calculation
In practice the maximum output voltage is determined by the capacitance ofthe test object and the frequency.
|Umax| =|imax|2πfC
(9)
In order to investigate the range of machines that Megger’s devices can beused for diagnostic measurements related to Dielectric response, the tests aredivided into four cases.
1. Capacitance, Power/Dissipation factor test at 50 Hz/60 Hz
2. Capacitance, Power/Dissipation factor tip-up test at 50 Hz/60 Hz
3. Capacitance, Power/Dissipation factor test with variable frequency (FDS)
4. Insulation Resistance/Polarization test (DC)
In this section, calculations are done according to the mentioned four casesbased on the data collected from defined specification or that of healthy con-dition. Then investigate the influence of moisture and aging.
5.1 Capacitance, Power/Dissipation factor test at 50 Hz/60 Hz
If the rated voltage of hydro generator is 10 kV, with the phase-to-groundcapacitance of 352 nF [26], the test voltage would be 0.2 Un=2 kV. In this sit-uation, IDAX 300 with accessory units, TRAX and CDAX might be able toperform the test:
IDAX 300 with VAX 020
According to Table 8, VAX 020 and VAX 230 can be applied as an externalaccessory unit to support IDAX performing dielectric tests. VAX 020 is ableto supply sinudoidal AC voltages up to 20 kV with frequency up to 100 KHzand current limit of 50 mA, while VAX 230 can expand the supply voltage upto 30 kV with test frequency up to 100 Hz and current limit of 40 mA.When applying VAX 020, the maximum current can be calculated as 221 mA,
31

Diagnostics of Rotating Machines Page 32 of 56
which exceed the limit of the current (i.e. 50 mA). Not applicable in this par-ticular situation, but it will be applicable when measuring rotating machineswith smaller ratings, for example 3 kV stators.Possible solution to improve the measuring range of the device is to use theinput transformer or compensated reactor.
CDAX
With power supply of 2 kV, the current range of the device is 0-5 A, whichmeans it is applicable for measuring the capacitance and DF with CDAX.Also, the measuring accuracy is 0.02%, dissipation factor is 0.002%. Accord-ing to IEEE standard [5][2]: measured capacitance with an error not exceeding2.0% and power factor with an error not exceeding 0.001 (0.1%), the require-ment can be satisfied.
TRAX
With TDX 120, the possible maximum current is 100 mA (continuous) and ifthe current reach 300 mA and last for more than 4 minutes, the device mightbe damage due to overheat. If capacitance is lower than 100 nF, for examplethe individual bars or coils, then this device is applicable for this test.
In this measuring method discussed above, if Capacitance and DF are mea-sured at the same time:
• When the trend in C decrease but DF increase, this strongly indicativeGeneral thermal deterioration
• When the trends in C and DF are both increase, this indicate that thewinding is Contaminated or has absorbed moisture
The influence of the moisture and aging will be investigated later in this re-port.
However, measuring at one single frequency point has shortages and are dis-cussed below:
• Low voltage power frequency might induce power-frequency current inthe winding due to inductive or capacitive pick up from other energized
32

Diagnostics of Rotating Machines Page 33 of 56
equipment and lead to a fault result. So a frequency different from powerfrequency or measurement done at high power voltage can be performedto minimize interference
• According to [27] the absolute dissipation factor limit at 0.2Un recom-mended by IEC is too conservative and could not indicate the real con-dition as the tip-up test.
• If thermal deterioration or water leak failure processes are occurring atonly a few locations, the test is probably not sensitive enough. If theentire winding is affected, the capacitance test is more likely to detectit. This form of the capacitance test assesses the average condition ofthe insulation [2].
5.2 Capacitance, Power/Dissipation factor tip-up testsat 50 Hz/60 Hz
For form-wound stator windings rated 2300 V and above, tip-up tests are ap-plied to overcome the problems mentioned above.
If the rated voltage of hydro generator is 10 kV, with the phase-to-ground ca-pacitance of 352 nF [3], in the tip-up test, the maximum test voltage would be10 kV. In this situation, the maximum current can be calculated as 1.1058 A.Not applicable for the devices with amplifiers mentioned above. But CDAXmight be able to perform the test.
If a hydro generator rated 10 MW, 12 kV and has a phase-to-ground capac-itance 1 uF, the current is 3.77 A, which is also within the limit. Based onthe discussion above, we can draw a conclusion that CDAX can be used forcapacitance tip-up test: for the form-winding rated 2.3 kV above and up toaround 12 kV.
33

Diagnostics of Rotating Machines Page 34 of 56
5.3 Insulation resistance/Polarization test
According to the brouchures, IDAX might be used for DC insulation testing.Test voltage: with accessory VAX 020, the maximum DC voltage supply is2 kV, according to the standard, this means the measurement can be appliedto the rotating machines rated under 5 kV. Since the current limit is 50 mApeak, and the order of the insulation resistance is usually GΩ, it is possible tobe applied for DC insulation testing. But IDAX is much more expensive incomparison to the specific IR measuring device, for example MIT 515, whichcan supply voltage up to 500 V. IDAX can be used as a multi-functional diag-nostic device.
5.4 Dielectric Spectroscopy (DS) test
IDAX: Voltage range: 200 Vpeak, current range: 50 mA peak and frequencyrange: DC-10kHz
TRAX: Voltage range: 250 Vpeak,current range: 2.5 A(> 2h), frequency range:1Hz-500Hz
Dielectric response analysis is performed at relatively low voltages, which al-lows fast on-site testing. Measurement and assessment of the groundwall in-sulation in rotating machine can be performed by collecting and processingabsolute values such as capacitance or DF/PF, while the output voltage isapplied to the ground and one or two input channels are connected to thephases.
The advantages of DS test are analyzed. The dielectric response analysis de-termines the dielectric properties of the insulation in a relative broad frequencyrange, which makes it very sensitive for detecting a variety of insulation de-fects. Since the frequency independence of complex capacitance or loss tangentcan reveal more information about the status of the insulation under investi-gation than a single measuring value at 50 Hz or a particular frequency. Forexample, creepage paths are easier to be detected at lower frequencies. There-fore dielectric response analysis is more sensitive to detect surface moisture orother defects compared to DF/PF measurements at line frequency.
Main theory: It confirms that the dielectric response function of the insulationsystem of high voltage rotating machines (new stator bar) follows the “Curie-
34

Diagnostics of Rotating Machines Page 35 of 56
von Schweidler” model.
f(t) = At−n (10)
Current-Voltage relations The dielectric response current i(t) from an appliedvoltage U(t):
i(t) = C0[σ
ε0U(t) + ε∞
dU(t)
dt+d
dt
∞∫0
fDiel(τ)U(t− τ)dτ ] (11)
In frequency domain with U(t) = U0ejωt yields the equation represented by
current and voltage phasor as:
I = jωC0U
((ε∞ + ∆ε′r(ω))− j(ε′′r(ω) +
σ
ωε0)
)= jω (C ′(ω)− jC ′′(ω)) U = jωCU
(12)
5.4.1 TDS: Polarization and depolarization current in Time Do-main
PDC is a broadband method that measures the dielectric response directlyin time domain: Measuring the (Polarization) current when a DC voltage isapplied for 10-20 minutes and then the winding is grounded while the depolar-ization current is measured [2]. With regard to interpretation, a difference inthe polarization and depolarization plots indicates there is an insulation prob-lem. Explanation of how this reflect in the complex capacitance is as follows.Applied voltage can be written by:
U(t) = U0 (13)
Polarization current can be obtained:
ipol(t) = C0U0
(σ
ε0H(t) + ε∞δ(t) + fDiel(t)
)(14)
And the depolarization can be written by:
idepol(t′) = −C0U0 (fDiel(t
′)− f(t′ + Tchg)) (15)
35

Diagnostics of Rotating Machines Page 36 of 56
Where t′ = t − Tchg is the time that reset to zero when the depolarizationstarts.
If the charging time is large enough (e.g. Tchg →∞ )
idepol(t′) = −C0U0fDiel(t
′) (16)
From the above equations can be seen that, from the depolarization current, itis possible to calculate the dielectric response function when the charging timeis large enough. So time domain measurement can in a way reflect the behaviorin frequency domain. If the polarization current and depolarization currentcurve have large differences, the insulation is indicated unhealthy.
In this method, the applied voltage is usually 100 V, so the polarization ordepolarization meausured is lower than 1ms, which is far below the maximumrating of IDAX. This means IDAX is sufficient to perform this tests.
5.4.2 FDS: Frequency Domain Dielectric Spectroscopy test
In FDS tests, the insulation condition is characterized by the measured param-eters such as dielectric loss factor (tanδ), complex capacitance (C) or complexpermittivity (ε) under different applied frequencies. The relation of complexpermittivity and frequency is shown in Equation 17. In this method, the re-sults can be observed intuitively by comparing FDS curves between differentphases of the test stator or comparing the curves with reference curves, forexample, curves of the healthy stator of the same type.
εr(ω) = ε′r(ω)− j(ε′′r +σ
ωε0) (17)
Base on the measurement results from a healthy stator bar in frequency do-main with IDA and PDC measurement in time domain, applying curve-fittingtool in Matlab to fit the depolarization current based on Hamon approxima-tion (Equation10), the measured capacitance and calculated complex capac-itance from the fitting Curie-von Schweidler response function in frequencydomain is shown in Figure 4.
36

Diagnostics of Rotating Machines Page 37 of 56
Figure 4: Frequency domain spectroscopy
5.5 Influence of Moisture and Aging
The influences of moisture and aging occured in diagnostic tests are studiedand summarized as below.
For single capacitance measurement, according to [2], a significant amount ofthermal deterioration will result in only a 1% drop in capacitance over theyears. If the winding has been soaked with water, a significant amount ofdeterioration may result in about a 5% increase in capacitance.
For dielectric spectroscopy tests, the conductivity increased due to relativityhigh-conductivity contamination such as water. And according to the mea-sured apparent permittivity (17), the influence of moisture is much more sig-nificant at the lower frequency.
From the literature [28] and [29], the influence of aging is studied. In [29],five new samples and five aged samples of the insulation system of 6 kV coilsfor rotating machines are measured for state comparison. Maxwell-Wagnerequivalent dielectric model is used for analysis, the relaxation time constantsare considered to reflect the aging (time constant increased due to aging). In[28], Curie-von Schweidler dielectric response function constants are consid-ered as sensitive parameters for aging time (A and n increased due to aging).
37

Diagnostics of Rotating Machines Page 38 of 56
The conclusion is drawn that the capacitance will decrease in general at allfrequency, but in higher frequencies the difference compared to the new andhealthy stator is more pronounced; While the change of dissipation factor atlow frequency is greater due to the post curing processes, and the loss fac-tor curves versus frequencies for different aged material pattern are varied inthe aspect of position and height of some local maximum. In [23], five stagesduring accelerated aging are analyzed: in the initial heating stage, increasesare shown in capacitance and loss angle; after longer-term aging, capacitancecontinues to increase but loss angle stables at a constant value; after that theinsulation current reaches the peak and followed by a decrease, which meansit is the beginning of resin loss; When the resin is losing at a substantial rate,the capacitance will decrease and HSCTs are more sensitive to the motor loadcycling, this indicates loose windings faults; And the last stage represents anelectrical breakdown in the motor.
38
Diagnostics of Rotating Machines Page 39 of 56
6 Case Study
In this section, several diagnostic tests are performed with the use of Megger’sdevices. The experiment object is a stator coil rated 7.2 kV. The tests anddevices involved in case study are summarized in the table below:
Table 9: Case StudyCase Diagnositic tests Device
1 IR test MIT 5152 FDS test & C/DF tip-up test IDAX 3003 C/DF tip-up test CDAX 605
6.1 Purpose of case study
The aim of the measurements in this section are as follows:
1) To demonstrate that several existing Megger’s products are suitable formeasurements on machine insulation.
2) To investigate frequency-dependence of tip-up tests in machine insulationbased on the existing Megger’s products. This is aimed at studying the possi-bility of enabling use of an easier voltage-sources such as resonant set with afew fixed resonant inductors, for diagnostic measurements.
6.2 Experimental setup
In this section, experimental setup includes test object, devices and connectionfor different diagnostic measurements are first described, then the results ofthe tests are stated in the figures or tables.
6.2.1 Test Object
Test object in this lab experiment is an individual complete coil for the mo-tors rated 7 kV with around 2 mm groundwall insulation thickness. This coil ismanufactured in 2006 and was accelerated thermally aged for a week at 180 C.
39
Diagnostics of Rotating Machines Page 40 of 56
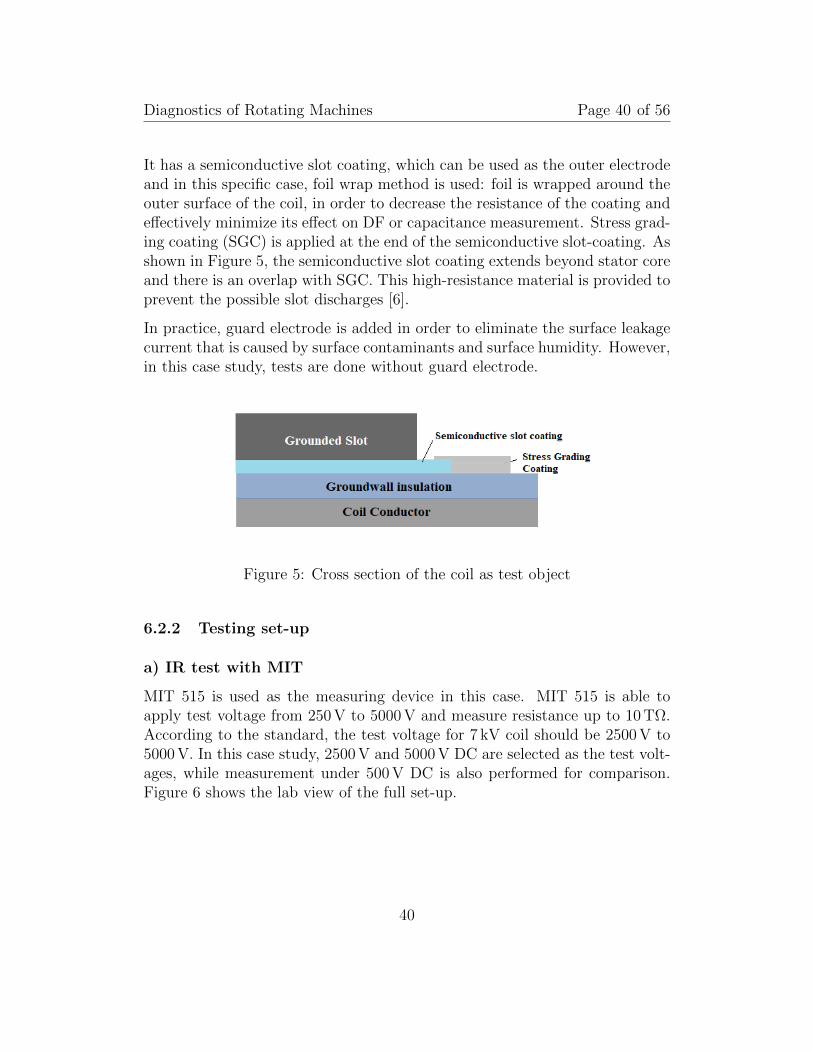
It has a semiconductive slot coating, which can be used as the outer electrodeand in this specific case, foil wrap method is used: foil is wrapped around theouter surface of the coil, in order to decrease the resistance of the coating andeffectively minimize its effect on DF or capacitance measurement. Stress grad-ing coating (SGC) is applied at the end of the semiconductive slot-coating. Asshown in Figure 5, the semiconductive slot coating extends beyond stator coreand there is an overlap with SGC. This high-resistance material is provided toprevent the possible slot discharges [6].
In practice, guard electrode is added in order to eliminate the surface leakagecurrent that is caused by surface contaminants and surface humidity. However,in this case study, tests are done without guard electrode.
Figure 5: Cross section of the coil as test object
6.2.2 Testing set-up
a) IR test with MIT
MIT 515 is used as the measuring device in this case. MIT 515 is able toapply test voltage from 250 V to 5000 V and measure resistance up to 10 TΩ.According to the standard, the test voltage for 7 kV coil should be 2500 V to5000 V. In this case study, 2500 V and 5000 V DC are selected as the test volt-ages, while measurement under 500 V DC is also performed for comparison.Figure 6 shows the lab view of the full set-up.
40

Diagnostics of Rotating Machines Page 41 of 56
Figure 6: Lab set-up for IR test with MIT 515
b) FDS and tip-up test with IDAX
In this test, IDAX 300 and external accessory unit VAX 230 are applied.IDAX ’s main unit can supply sinusoidal AC voltages up to 200 V peak andtest frequencies from 100 µHz to 10 kHz. VAX 230 is an external amplifierthat is applied to provide high-voltage output up to 30 kV peak and maximumcurrent of 40 mA. But VAX 230 has a limitation that the maximum frequencyis up to 100 Hz. The measuring principle of IDAX is to measure the voltageand the current through the test object, and perform DFTs to present thedata versus frequency.
Figure 7: Simple diagram of connection in Case 2
Figure 7 shows the simple equivalent diagram of the connection of the test
41
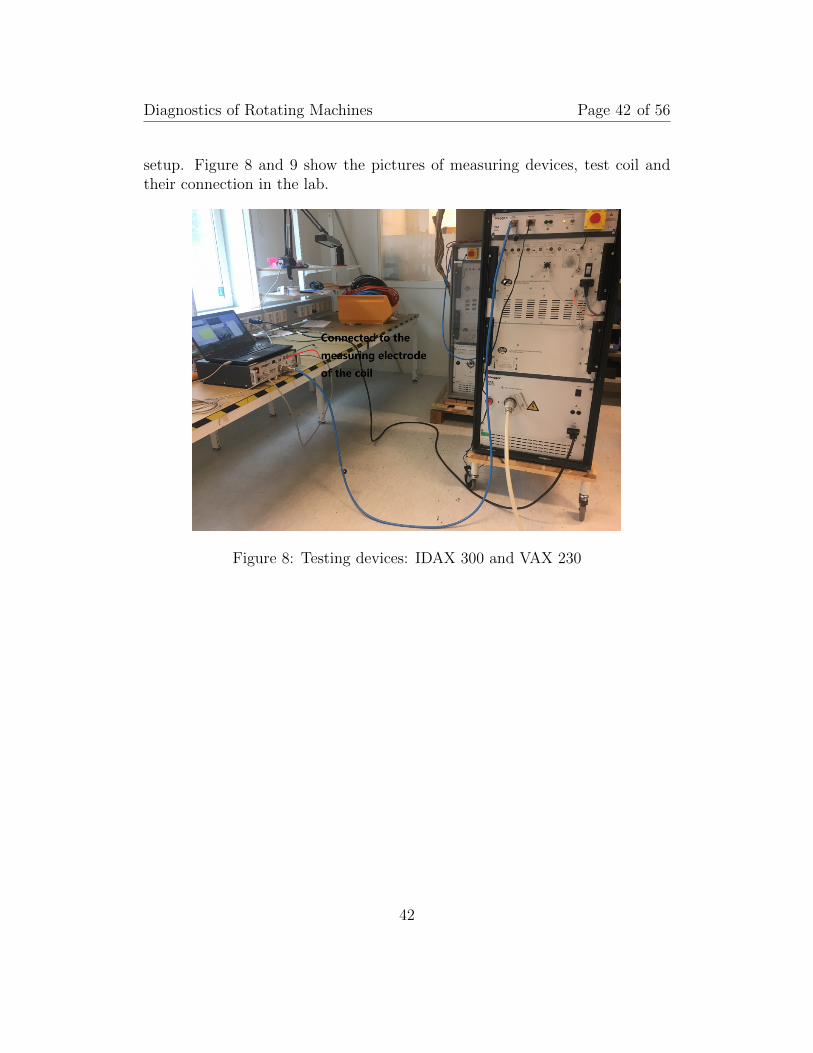
Diagnostics of Rotating Machines Page 42 of 56
setup. Figure 8 and 9 show the pictures of measuring devices, test coil andtheir connection in the lab.
Figure 8: Testing devices: IDAX 300 and VAX 230
42

Diagnostics of Rotating Machines Page 43 of 56
Figure 9: Connection with test coil
In order to investigate the influence of the test voltages in FDS test, differenttest voltages are selected for testing: 2 kV, 4 kV, 5 kV and 6 kV.
The same test set-up can be applied for tip-up tests. The test devices in thiscase is able to perform tests in lower frequency than that with CDAX. For thepurpose of investigating the influence of the test frequency in tip-up test, thetest frequencies are selected in the range of 1 Hz to 90 Hz. And the appliedvoltages are selected from 2 kV as the lowest and 6 kV as the higest.
c) tip-up test with CDAX
CDAX 605 is a high accuracy measuring instrument that applied with a highvoltage AC source and a standard capacitance to form a complete setup forinsulation testing. In this test, TRAX is used as an AC power supply, ofwhich the maximum voltage is 250 V and the frequency range is from 5 to 500Hz. Then TRAX is connect to a step-up transformer to boost the voltage forhigh-voltage tests. The equivalent circuit to explain the measuring principleof CDAX is shown in Figure 6.2.2:
43

Diagnostics of Rotating Machines Page 44 of 56
U0 CX
A
IXCN
A
IN
Figure 10: Equivalent circuit for measuring principle of CDAX
CDAX measures the two current values, and the complex capacitance of testobject can be calculated by:
Cx =IXIN· CN (18)
Where CN is the standard capacitance, in this test CN = 107.266 pF.
This method eliminates the effect of the phase-shift due to the step-up trans-former. CDAX has high accuracy of 0.02% for capacitance measurement andof 0.05% for DF measurement at 15µA to 300mA measuring current.
Figure 11 shows the picture of the testing devices (CDAX 300 and TRAX 100)for tip-up test.
44

Diagnostics of Rotating Machines Page 45 of 56
Figure 11: Testing devices: CDAX 300 and TRAX 100
In this tip-up test for diagnostic of the 7 kV individual coil, the lowest voltageis selected as 1 kV, which is below the coil’s discharge inception voltage. Whilethe highest voltage is chosen as 6 kV that is well above the discharge inceptionvoltage and close to the actual service voltage of the coil. The measurement isdone at each 1 kV increments in test voltage to provide sufficient data point andpresent the results in the plot of capacitance/DF versus applied test voltage.In order to investigate the influence of test frequencies, measurements areperformed under different frequencies: 15 Hz, 30 Hz, 45 Hz, 60 Hz, 120 Hz and240 Hz.
6.3 Results
Case 1: IR test
According to [7], for insulation in good condition and dried, the measuredinsulation resistance (at the same t) will remain substantially the same valuewhen applying any test voltages up to the peak value of the rated voltage. As
45
Diagnostics of Rotating Machines Page 46 of 56
Table 10: Case 1 ResultTest Voltage(V) Measured IR(t), t=120s
500 697GΩ2500 622GΩ5000 584GΩ
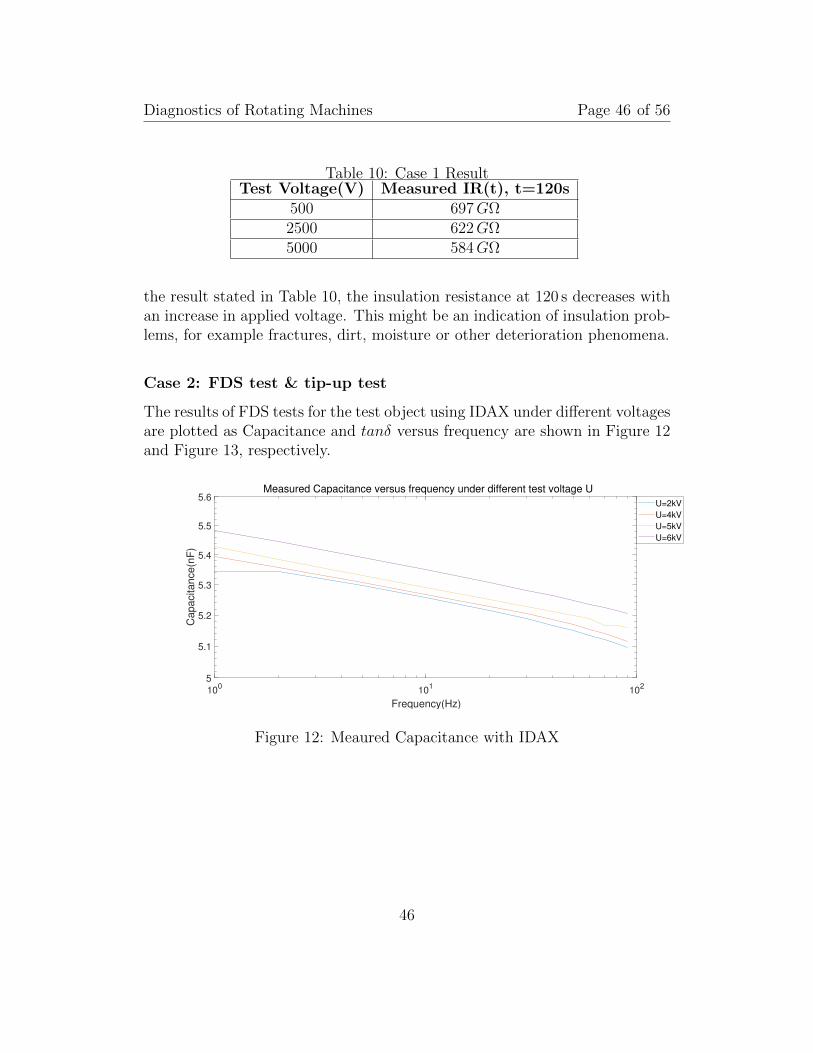
the result stated in Table 10, the insulation resistance at 120 s decreases withan increase in applied voltage. This might be an indication of insulation prob-lems, for example fractures, dirt, moisture or other deterioration phenomena.
Case 2: FDS test & tip-up test
The results of FDS tests for the test object using IDAX under different voltagesare plotted as Capacitance and tanδ versus frequency are shown in Figure 12and Figure 13, respectively.
100
101
102
Frequency(Hz)
5
5.1
5.2
5.3
5.4
5.5
5.6
Capacitance(n
F)
Measured Capacitance versus frequency under different test voltage U
U=2kV
U=4kV
U=5kV
U=6kV
Figure 12: Meaured Capacitance with IDAX
46

Diagnostics of Rotating Machines Page 47 of 56
100
101
102
Frequency(Hz)
1.5
2
2.5
3
3.5
4
tan
(%
)
Measured loss tangent versus frequency under different test voltage U
U=2kV
U=4kV
U=5kV
U=6kV
Figure 13: Meaured tanδ with IDAX
According to Equation 3 and Equation 4, the results of the tip-up test areshown in Table 11
According to Equation 4 and 3, the results of the tip-up test measured byIDAX are shown in Table 11
Table 11: Case 2 tip-up test ResultsTest Frequency(Hz) ∆C(%) DF tip-up(%)
1 2.60 1.8145 1.81 1.72410 1.79 1.68430 1.81 1.61150 1.92 1.58670 2.03 1.59690 2.16 1.708
From the result, it can be seen that the tip-up values are higher in low fre-quency and high frequency tests than that in power frequency. More testsshould be done to verify.
Case 3: C/DF tip-up test
The measured capacitance and DF versus test voltages are plotted in Figure14 and 15, respectively.
47

Diagnostics of Rotating Machines Page 48 of 56
0 1000 2000 3000 4000 5000 6000 7000
Voltage(V)
4.8
4.9
5
5.1
5.2
5.3
Capacitance(n
F)
Measured capacitance versus voltage under different test frequency
f=15Hz
f=30Hz
f=45Hz
f=60Hz
f=120Hz
f=240Hz
Figure 14: Meaured Capacitance with CDAX
0 1000 2000 3000 4000 5000 6000 7000
Voltage(V)
1.5
2
2.5
3
3.5
4
4.5
tan
(%
)
Measured loss tangent versus voltage under different test frequency
f=15Hz
f=30Hz
f=45Hz
f=60Hz
f=120Hz
f=240Hz
Figure 15: Meaured tanδ with CDAX
According to Equation 3 and Equation 4, the results of the tip-up test areshown in Table 12
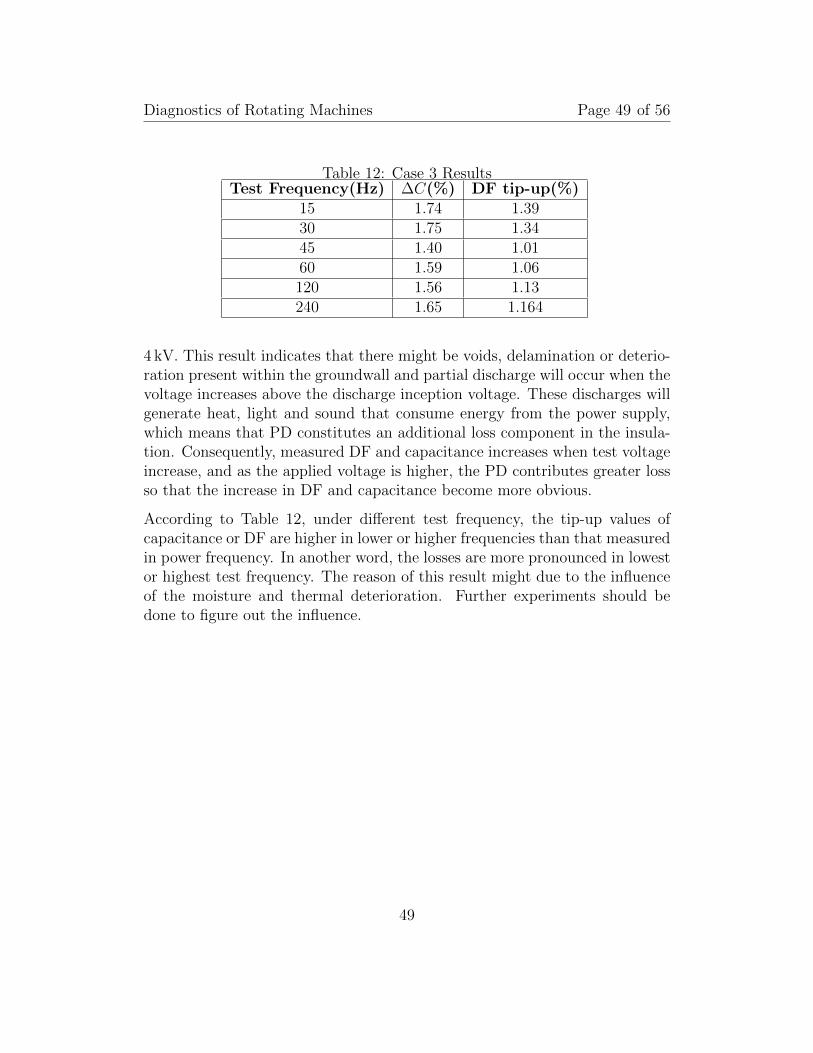
According to Figure 14 and 15, as the AC voltage is increased across the in-sulation in a form-wound coil, the measured DF and capacitance first increasegently (i.e. When the test voltage is up to 4 kV) and then the increase in DFand capacitance become greater when the test voltage continue to increase over
48
Diagnostics of Rotating Machines Page 49 of 56
Table 12: Case 3 ResultsTest Frequency(Hz) ∆C(%) DF tip-up(%)
15 1.74 1.3930 1.75 1.3445 1.40 1.0160 1.59 1.06120 1.56 1.13240 1.65 1.164
4 kV. This result indicates that there might be voids, delamination or deterio-ration present within the groundwall and partial discharge will occur when thevoltage increases above the discharge inception voltage. These discharges willgenerate heat, light and sound that consume energy from the power supply,which means that PD constitutes an additional loss component in the insula-tion. Consequently, measured DF and capacitance increases when test voltageincrease, and as the applied voltage is higher, the PD contributes greater lossso that the increase in DF and capacitance become more obvious.
According to Table 12, under different test frequency, the tip-up values ofcapacitance or DF are higher in lower or higher frequencies than that measuredin power frequency. In another word, the losses are more pronounced in lowestor highest test frequency. The reason of this result might due to the influenceof the moisture and thermal deterioration. Further experiments should bedone to figure out the influence.
49


Diagnostics of Rotating Machines Page 51 of 56
7 Closure
7.1 Conclusions and Future Work
In this thesis, the general diagnostic methods of rotating machines as well asthe developing on-line monitoring and SFRA methods are summarized and ex-isting diagnostic devices that are not initially used for rotating machinery arestudied according to their functions and how the devices can be used in diag-noses of rotating machines. The accessories of the devices are studied to fulfillthe testing condition, and possible solution to improve measuring range suchas input transformer or compensated reactor are mentioned. The case studiesare performed and proved that the investigated devices are suitable for mea-suring and assessing condition of coils or bars. However, the limitation of thesupply frequencies in regards of high voltage requirement in the measurementcan be seen in case study. The influence of thermal aging and moisture arediscussed. Also, the tip-up tests are performed to investigate the frequency-dependency based on the existing products, this arouses the possibility studyof enabling the use of easier voltage source for diagnostic measurements.
For the future work, further case studies should be performed, for example,tests on complete three-phase stator windings based on these diagnostic devicesand supplementary tests for investigating the frequency-dependency for tip-uptests. The investigation of the cost and market of rotating machinery diagnosesis also important for development of the devices.
51


Diagnostics of Rotating Machines Page 53 of 56
References
[1] M. K. W. Stranges, S. Haq, and L. H. A. Teran, “Large-motor high-voltage insulation systems testing: Qualification and acceptance for thepetrochemical industry,” IEEE Industry Applications Magazine, vol. 22,no. 6, pp. 33–38, Nov 2016.
[2] G. Stone, I. Culbert, E. Boulter, and H. Dhirani, Electrical Insulationfor Rotating Machines: Design, Evaluation, Aging, Testing, and Repair,ser. IEEE Press Series on Power Engineering. Wiley, 2014. [Online].Available: https://books.google.se/books?id=00v1AwAAQBAJ
[3] N. Taylor, “Measured and modeled capacitance, loss and harmonics instator insulation with nonlinear stress control,” IEEE Transactions onDielectrics and Electrical Insulation, vol. 22, no. 6, pp. 3133–3145, De-cember 2015.
[4] R. Tremblay, C. Hudon, T. Godin, M. Belec, J. Banville, and D. Nguyen,“Improvement in requirements for stress grading systems of stator wind-ings at Hydro-Quebec,” 01 2006.
[5] “IEEE guide for insulation maintenance of electric machines,” IEEE Std56-2016, pp. 1–86, Nov 2016.
[6] “IEEE recommended practice for measurement of power factor tip-up ofelectric machinery stator coil insulation,” IEEE Std 286-2000, pp. i–29,2001.
[7] “IEEE recommended practice for testing insulation resistance of electricmachinery,” IEEE Std 43-2013 (Revision of IEEE Std 43-2000), pp. 1–37,March 2014.
[8] “IEEE guide for the measurement of partial discharges in AC electricmachinery,” IEEE Std 1434-2014 (Revision of IEEE Std 1434-2000), pp.1–89, Dec 2014.
[9] G. C. Stone, “A perspective on online partial discharge monitoring for as-sessment of the condition of rotating machine stator winding insulation,”IEEE Electrical Insulation Magazine, vol. 28, no. 5, pp. 8–13, September2012.
[10] M. Farahani, H. Borsi, and E. Gockenbach, “Dielectric spectroscopy in
53

Diagnostics of Rotating Machines Page 54 of 56
time and frequency domain on insulation system of high voltage rotatingmachines,” in Proceedings of the 2004 IEEE International Conference onSolid Dielectrics, 2004. ICSD 2004., vol. 1, July 2004, pp. 60–63 Vol.1.
[11] M. Farahani, H. Borsi, and G. Ernst, “Study of Capacitance andDissipation Factor Tip-Up to Evaluate the Condition of InsulatingSystems for High Voltage Rotating Machines,” Electrical Engineering,vol. 89, no. 4, pp. 263–270, Mar 2007. [Online]. Available: https://doi.org/10.1007/s00202-006-0011-9
[12] Handbook of electric motors, ser. Electrical engineering and electronics92. New York: Dekker, 1995.
[13] R. Mills, C. Payne, and K. Younsi, “Insulation cure monitoring on globalVPI large AC motors,” in Conference Record of the the 2002 IEEE Inter-national Symposium on Electrical Insulation (Cat. No.02CH37316), April2002, pp. 492–496.
[14] A. Helgeson and U. Gafvert, “Dielectric response during curing of aresin-rich insulation system for rotating machines,” in 1999 Annual Re-port Conference on Electrical Insulation and Dielectric Phenomena (Cat.No.99CH36319), Oct 1999, pp. 289–292 vol.1.
[15] L. Garden, D. Hayward, and R. Pethrick, “Dielectric non-destructivetesting approach to cure monitoring of adhesives and composites,”Proceedings of the Institution of Mechanical Engineers G, Journal ofAerospace Engineering, vol. 221, no. 4, pp. 521–533, 2007. [Online].Available: http://search.proquest.com/docview/30101237/
[16] M. Brandt and S. Kascak, “Failure identification of induction motor usingSFRA method,” in 2016 ELEKTRO, May 2016, pp. 269–272.
[17] “Diagnostic testing and monitoring of rotating machines.” [On-line]. Available: https://www.omicronenergy.com/en/applications/rotating-machines-testing-monitoring/
[18] F. R. Blanquez, C. A. Platero, E. Rebollo, and F. Blanquez, “Evalua-tion of the applicability of FRA for inter-turn fault detection in statorwindings,” in 2013 9th IEEE International Symposium on Diagnosticsfor Electric Machines, Power Electronics and Drives (SDEMPED), Aug2013, pp. 177–182.
54
Diagnostics of Rotating Machines Page 55 of 56
[19] M. Brandt, M. Gutten, T. Koltunowicz, and P. Zukowski, “Analysis ofwinding fault in electric machines by frequency method,” in 2018 ELEK-TRO, May 2018, pp. 1–4.
[20] C. Platero, F. Blazquez, F. Blanquez, E. Rebollo, B. Batlle, andE. Fernandez-Sanchez, “Application of sweep frequency response anal-ysis (SFRA) for inter-turn detection of in medium-voltage coils manu-facturing,” 44th International Conference on Large High Voltage ElectricSystems 2012, 01 2012.
[21] H. Zhu and V. Green, “Diagnosis of stator insulation of generators andmotors using in-service partial discharge testing,” in Power System Tech-nology, 1998. Proceedings. POWERCON ’98. 1998 International Confer-ence on, vol. 1, Aug 1998, pp. 76–80 vol.1.
[22] C. P. Malliou, A. Karlis, and M. G. Danikas, “Electrical machine in-sulation: Partial discharges, consequences and diagnostic technique,” in2017 IEEE 11th International Symposium on Diagnostics for ElectricalMachines, Power Electronics and Drives (SDEMPED), Aug 2017, pp.468–474.
[23] K. Younsi, P. Neti, M. Shah, J. Y. Zhou, J. Krahn, K. Weeber, andC. D. Whitefield, “On-line capacitance and dissipation factor monitoringof AC stator insulation,” IEEE Transactions on Dielectrics and ElectricalInsulation, vol. 17, no. 5, pp. 1441–1452, October 2010.
[24] S. B. Lee, J. Yang, K. Younsi, and R. M. Bharadwaj, “An online ground-wall and phase-to-phase insulation quality assessment technique for ac-machine stator windings,” IEEE Transactions on Industry Applications,vol. 42, no. 4, pp. 946–957, July 2006.
[25] P. Neti, K. Younsi, and M. R. Shah, “A novel high sensitivity differen-tial current transformer for online health monitoring of industrial motorground-wall insulation,” in 2013 IEEE Energy Conversion Congress andExposition. IEEE, 2013, pp. 2493–2499.
[26] N. Taylor, Diagnostics of stator insulation by dielectric response and vari-able frequency partial discharge measurements : a study of varied lowfrequencies in stator insulation, with particular attention to end-windingstress-grading, ser. Trita-EE, 2006:049. Stockholm: Elektrotekniska sys-tem Electrical Engineering, 2006.
55

Diagnostics of Rotating Machines Page 56 of 56
[27] H. Sedding, G. Stone, and A. Shaikh, “Dielectric dissipation factor accep-tance criteria for stator winding insulation,” in 2016 IEEE InternationalConference on Dielectrics (ICD), vol. 2, July 2016, pp. 955–958.
[28] M. Farahani, H. Borsi, and E. Gockenbach, “Dielectric response studieson insulating system of high voltage rotating machines,” vol. 13, pp. 383– 393, 05 2006.
[29] R. Cimbala, J. Kurimsky, and I. Kolcunova, “Determination of thermalageing influence on rotating machine insulation system using dielectricspectroscopy,” vol. 87, pp. 176–179, 01 2011.
56

www.kth.se
TRITA-EECS-EX-2019:850