investigation of the pwr subchannel void · pdf filethe 14th international topical meeting on...
TRANSCRIPT
The 14th International Topical Meeting on Nuclear Reactor Thermal Hydraulics (NURETH-14) Log Number: 085 Hilton Toronto Hotel, Toronto, Ontario, Canada, September 25-29, 2011.
(1/25)
INVESTIGATION OF THE PWR SUBCHANNEL VOID DISTRIBUTI ON BENCHMARK (OECD/NRC PSBT BENCHMARK) USING ANSYS CFX
Th. Frank1, F. Reiterer1 and C. Lifante1 1 ANSYS Germany GmbH, Otterfing, Germany
[email protected], [email protected]
Abstract
The presented CFD investigations using ANSYS CFX 13.0 are focused on the “Phase I – Void Distribution Benchmark, Exercise 1 – Steady-state Single Subchannel Benchmark” of the OECD/NRC PSBT benchmark. In this particular subsection of the entire benchmark flow through a test section representing a central subchannel of a PWR fuel assembly under nucleate subcooled boiling conditions is investigated. The investigations using ANSYS CFX had been carried out for 10 different test conditions (with respect to pressure, inlet fluid temperature, power and mass flow rate) from the PSBT test matrix. Emphasis had been given to a CFD best practice guidelines oriented investigation of the subcooled nucleate boiling flow through the subchannel configuration of the test section. By comparing CFD results to the benchmark data reasonably good agreement could be observed. Depending on the applied CFD submodels the results differ from the measured data by ±8% with respect to cross-sectional averaged void fraction at the measurement plane, where the averaged void fraction varied between 0.038 and 0.62 for the test conditions under investigation.
1. Introduction
The investigation presented in this paper is aimed on CFD simulations for the international OECD/NRC PWR subchannel and bundle tests (PSBT) benchmark [1] based on a database provided by the Nuclear Power Engineering Corporation (NUPEC), Japan from an experimental campaign carried out at NUPEC from 1987 to 1995 and based on that time state-of-the-art computer tomography (CT) technology for void measurements. The benchmark encourages advancement in subchannel analysis of fluid flow in rod bundles with subcooled nucleate boiling conditions under typical PWR conditions and therefore has very important relevance to the nuclear reactor safety margin evaluation. The benchmark specification has been designed so that it can systematically assess and compare numerical models and codes (CFD and subchannel codes) used by different benchmark participants for the prediction of detailed subchannel void distributions to full scale experimental data on a prototypical PWR rod bundle.
The PSBT subchannel void fraction and departure from nucleate boiling data encourages advancement in understanding and modeling complex flow behavior in real bundles. Considering that the present theoretical and CFD approaches for describing such complex multiphase flows with rather intensive heat and mass transfer are relatively immature, the benchmark specification is designed so that it will systematically assess and compare the participants’ analytical and CFD models on the prediction of detailed void distributions and DNB. The PSBT benchmark problem includes both macroscopic/integral and microscopic measurement data. In this context, the subchannel grade void fraction data are regarded as the macroscopic/integral data and the digitized CT computer graphic images are the microscopic data, which provide rather coarse information on void distribution within a subchannel. Unfortunately the NUPEC database
The 14th International Topical Meeting on Nuclear Reactor Thermal Hydraulics (NURETH-14) Log Number: 085 Hilton Toronto Hotel, Toronto, Ontario, Canada, September 25-29, 2011.
(2/25)
provides the data for the subchannel void distribution tests only in a single measurement cross-section, so that no information is available for the axial flow development under the conditions of nucleate subcooled boiling.
The presented CFD investigations using ANSYS CFX 13.0 are entirely focused on the “Phase I – Void Distribution Benchmark, Exercise 1 – Steady-state single subchannel bench-mark” of PSBT. In this particular subsection of the entire benchmark flow through a test section representing a central subchannel of a PWR fuel assembly under nucleate subcooled boiling conditions is investigated. For the PSBT Phase I, Exercise 1 experiments cross-sectional averaged void fraction values and CT images of cross-sectional void distribution (but with rather poor spatial resolution) are available for comparison to numerical predictions.
The investigations using ANSYS CFX had been carried out for 10 different selected test conditions (with respect to pressure, inlet fluid temperature, power and mass flow rate) from the overall set of PSBT benchmark data. Emphasis had been given to a CFD best practice guidelines oriented investigation of the subcooled nucleate boiling flow through the subchannel configura-tion of the test section. Therefore a hierarchy of consecutively refined 3d meshes with 0.18, 1.4 and 11.5 Mill. hexahedral mesh elements had been applied. Convergence of the steady-state simulations on all three grid levels as well as the impact of the applied convergence criteria and integration time scales on the target values was thoroughly investigated. Furthermore the influence of anisotropic turbulence and secondary flows in the cross section of the subchannel test section on cross-sectional void distribution was investigated by applying the shear-stress transport turbulence model (SST) in comparison with the explicit algebraic Reynolds stress model (EARSM). Furthermore the influence of interfacial momentum transfer modeling in the two-phase flow CFD setup has been investigated. Finally, the obtained CFD results are cross-plotted and compared to the data from the PSBT database, where the investigated test conditions cover a range in cross-sectional averaged steam volume fraction from 0.075 to 0.62.
2. Nomenclature
A bubble influence factor Re Reynolds number A1 wall fraction cooled by single-phase
convection rG Volume fraction of gaseous phase
A2 wall fraction cooled by quenching TL near-wall liquid temperature ALG interfacial area density Tsat saturation temperature CpL specific heat capacity of liquid Tsub =Tsat-TL; liquid subcooling
temperature CpG specific heat capacity of vapor Tsup =TW-Tsat; wall superheating dB bubble diameter in the bulk flow TW wall temperature dW bubble departure diameter on the wall TLW liquid characteristic near-wall
temperature f bubble departure frequency tW bubble waiting time g gravitational acceleration y+ non-dimensional distance to the
wall G mass flow rate UG vapour velocity hLG interfacial heat transfer coefficient UL liquid velocity HLG evaporation enthalpy
The 14th International Topical Meeting on Nuclear Reactor Thermal Hydraulics (NURETH-14) Log Number: 085 Hilton Toronto Hotel, Toronto, Ontario, Canada, September 25-29, 2011.
(3/25)
hQ coefficient for heat transfer by quenching
Greek letters
kL liquid heat conductivity ρG density of the gaseous phase LH length of the heated part of the
subchannel test section ρL density of the liquid phase
LM height of the measurement cross section
τW wall shear stress
LT length of the experimental test section Subsripts Na active nucleation site density G gaseous phase Nu Nusselt number L liquid phase Pr Prandtl number of liquid in inlet properties q´´ wall heat flux max maximum QC heat flux due to single-phase
convection ref reference quantity
QE heat flux due to evaporation sub subcooling QQ heat flux due to quenching sup superheating QW total wall heat flux tot total
3. The PSBT Void Distribution Benchmark
3.1 PSBT Phase I, Exercise 1 – Steady-state Single Subchannel Benchmark
The PSBT benchmark consists of the following phases with different exercises [1]: 1. Phase I – Void Distribution Benchmark
• Exercise 1 – Steady-state single subchannel benchmark • Exercise 2 – Steady-state bundle benchmark • Exercise 3 – Transient bundle benchmark • Exercise 4 – Pressure drop benchmark
2. Phase II – DNB Benchmark • Exercise 1 – Steady-state fluid temperature benchmark • Exercise 2 – Steady-state DNB benchmark • Exercise 3 – Transient DNB benchmark
where the present CFD investigation focuses on Phase I, Exercise 1, while the other tasks are mainly directed towards the investigation by subchannel/system codes. In Phase I, Exercise 1 the underlying NUPEC experiments had been carried out for 4 different representative types of subchannels – typical central (S1), central with a guide tube (S2), side (S3) and corner (S4) subchannel type of a typical 17x17 reference fuel assembly. But due to the rather high computational effort of CFD simulations it was decided at an early stage of the PSBT benchmark to focus the CFD investigations on the center type subchannel (S1) experiments, test series 1. The available experimental data include CT scan measurements of the void fraction (subchannel averaged) and images of the void distribution. The data are provided to assess and improve the current models for void generation (subchannel/system and CFD codes) and void distribution within subchannels (CFD codes).
The 14th International Topical Meeting on Nuclear Reactor Thermal Hydraulics (NURETH-14) Log Number: 085 Hilton Toronto Hotel, Toronto, Ontario, Canada, September 25-29, 2011.
(4/25)
3.2 The Test Section for Central Subchannel Void Distribution Measurements
A description of the test sections, subchannel types and applied measurement technology is provided in full detail in [1]. But in order to facilitate the understanding of the further described CFD simulations, a short outline of the experimental test facility will be given here.
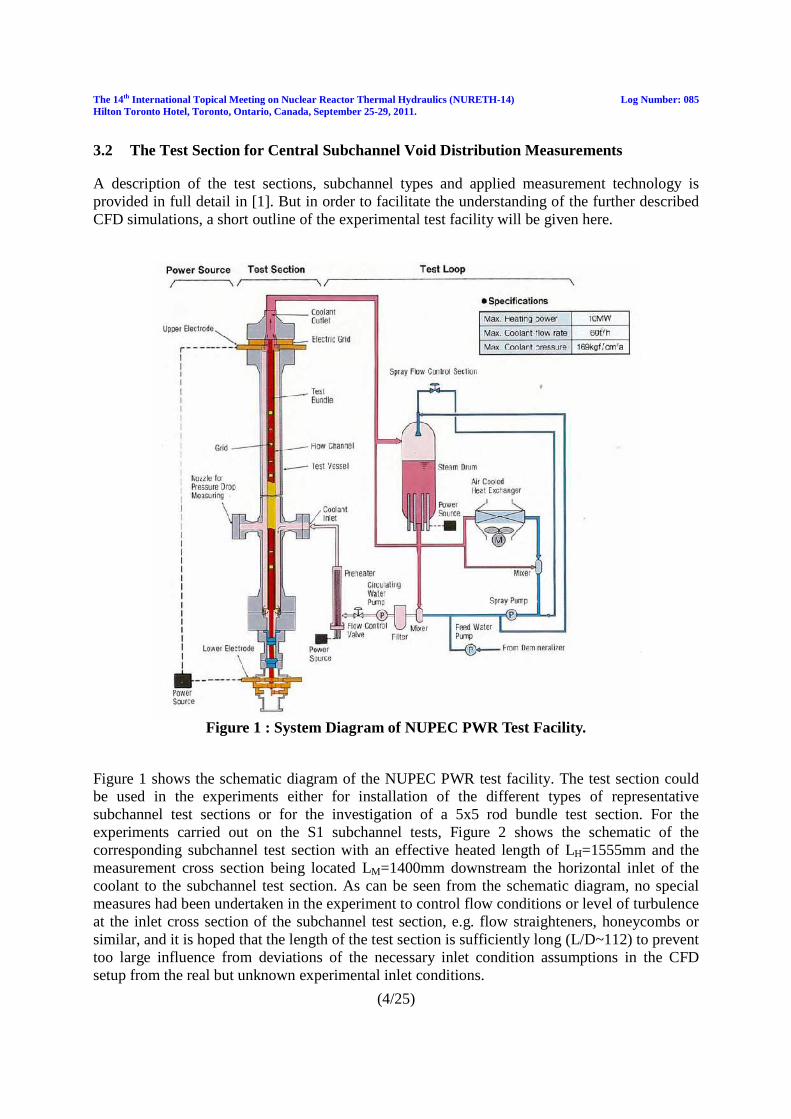
Figure 1 : System Diagram of NUPEC PWR Test Facility.
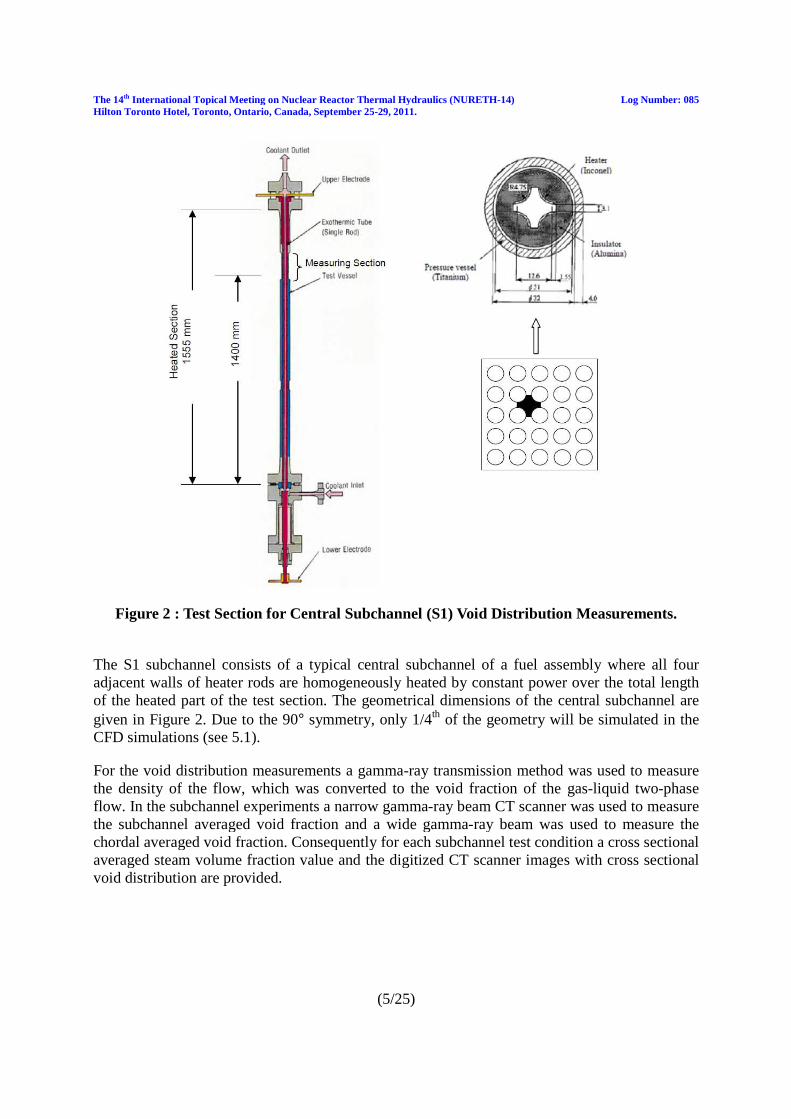
Figure 1 shows the schematic diagram of the NUPEC PWR test facility. The test section could be used in the experiments either for installation of the different types of representative subchannel test sections or for the investigation of a 5x5 rod bundle test section. For the experiments carried out on the S1 subchannel tests, Figure 2 shows the schematic of the corresponding subchannel test section with an effective heated length of LH=1555mm and the measurement cross section being located LM=1400mm downstream the horizontal inlet of the coolant to the subchannel test section. As can be seen from the schematic diagram, no special measures had been undertaken in the experiment to control flow conditions or level of turbulence at the inlet cross section of the subchannel test section, e.g. flow straighteners, honeycombs or similar, and it is hoped that the length of the test section is sufficiently long (L/D~112) to prevent too large influence from deviations of the necessary inlet condition assumptions in the CFD setup from the real but unknown experimental inlet conditions.
The 14th International Topical Meeting on Nuclear Reactor Thermal Hydraulics (NURETHHilton Toronto Hotel, Toronto, Ontario, Canada,
Figure 2 : Test Section for Central Subchannel (S1) Void Distribution Measurements
The S1 subchannel consists of a typical central subchannel of a fuel assembly where all four adjacent walls of heater rods are homogeneously heated by constant power over the total lengthof the heated part of the test section. The geometrical dimensions of the central subchannel are given in Figure 2. Due to the 90CFD simulations (see 5.1).
For the void distribution measurements the density of the flow, which was converted to the void fraction of the gasflow. In the subchannel experimentsthe subchannel averaged void fraction and a wide gammachordal averaged void fraction. averaged steam volume fraction value and the digitized CT scanner images with cross sectiovoid distribution are provided.
International Topical Meeting on Nuclear Reactor Thermal Hydraulics (NURETH-14) Canada, September 25-29, 2011.
(5/25)
Section for Central Subchannel (S1) Void Distribution Measurements
The S1 subchannel consists of a typical central subchannel of a fuel assembly where all four adjacent walls of heater rods are homogeneously heated by constant power over the total lengthof the heated part of the test section. The geometrical dimensions of the central subchannel are
. Due to the 90° symmetry, only 1/4th of the geometry will be simulated in the
For the void distribution measurements a gamma-ray transmission method was used to measure the density of the flow, which was converted to the void fraction of the gas
n the subchannel experiments a narrow gamma-ray beam CT scanner was used to measure ged void fraction and a wide gamma-ray beam was used to measure the
chordal averaged void fraction. Consequently for each subchannel test condition a cross sectional averaged steam volume fraction value and the digitized CT scanner images with cross sectiovoid distribution are provided.
Log Number: 085
Section for Central Subchannel (S1) Void Distribution Measurements.
The S1 subchannel consists of a typical central subchannel of a fuel assembly where all four adjacent walls of heater rods are homogeneously heated by constant power over the total length of the heated part of the test section. The geometrical dimensions of the central subchannel are
y will be simulated in the
ray transmission method was used to measure the density of the flow, which was converted to the void fraction of the gas-liquid two-phase
ray beam CT scanner was used to measure ray beam was used to measure the
Consequently for each subchannel test condition a cross sectional averaged steam volume fraction value and the digitized CT scanner images with cross sectional
The 14th International Topical Meeting on Nuclear Reactor Thermal Hydraulics (NURETH-14) Log Number: 085 Hilton Toronto Hotel, Toronto, Ontario, Canada, September 25-29, 2011.
(6/25)
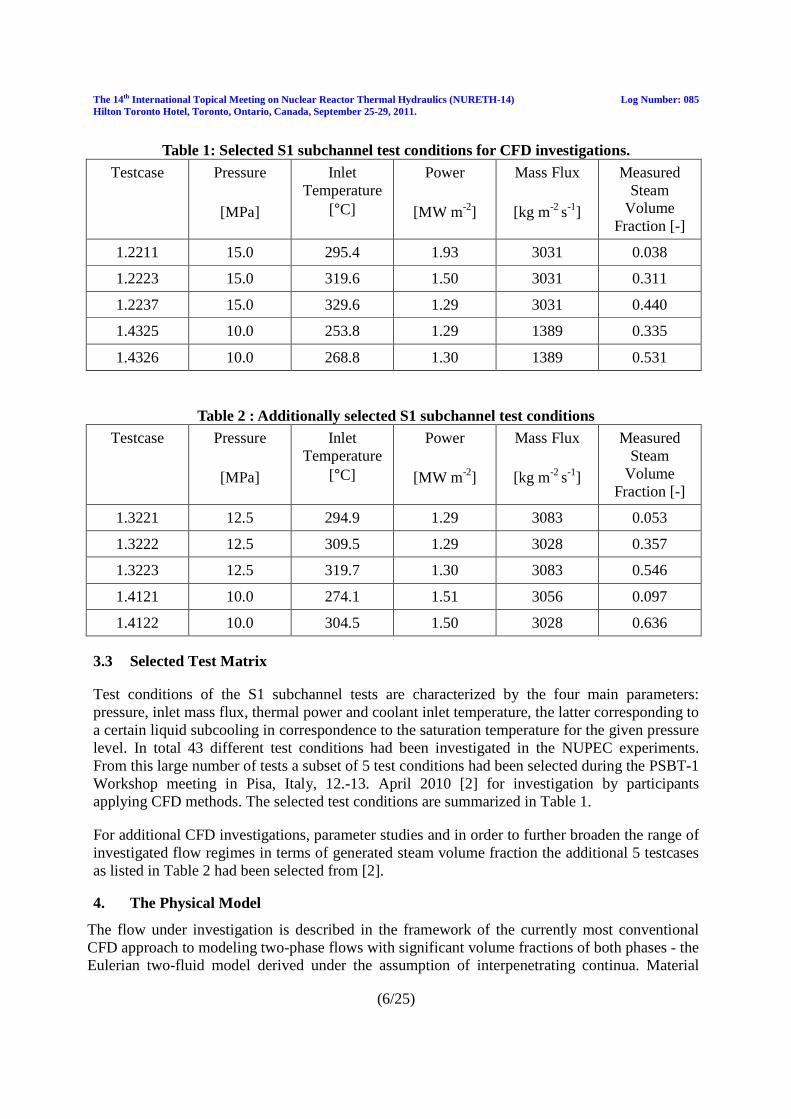
Table 1: Selected S1 subchannel test conditions for CFD investigations. Testcase Pressure
[MPa]
Inlet Temperature
[°C]
Power
[MW m-2]
Mass Flux
[kg m-2 s-1]
Measured Steam
Volume Fraction [-]
1.2211 15.0 295.4 1.93 3031 0.038
1.2223 15.0 319.6 1.50 3031 0.311
1.2237 15.0 329.6 1.29 3031 0.440
1.4325 10.0 253.8 1.29 1389 0.335
1.4326 10.0 268.8 1.30 1389 0.531
Table 2 : Additionally selected S1 subchannel test conditions Testcase Pressure
[MPa]
Inlet Temperature
[°C]
Power
[MW m-2]
Mass Flux
[kg m-2 s-1]
Measured Steam
Volume Fraction [-]
1.3221 12.5 294.9 1.29 3083 0.053
1.3222 12.5 309.5 1.29 3028 0.357
1.3223 12.5 319.7 1.30 3083 0.546
1.4121 10.0 274.1 1.51 3056 0.097
1.4122 10.0 304.5 1.50 3028 0.636
3.3 Selected Test Matrix
Test conditions of the S1 subchannel tests are characterized by the four main parameters: pressure, inlet mass flux, thermal power and coolant inlet temperature, the latter corresponding to a certain liquid subcooling in correspondence to the saturation temperature for the given pressure level. In total 43 different test conditions had been investigated in the NUPEC experiments. From this large number of tests a subset of 5 test conditions had been selected during the PSBT-1 Workshop meeting in Pisa, Italy, 12.-13. April 2010 [2] for investigation by participants applying CFD methods. The selected test conditions are summarized in Table 1.
For additional CFD investigations, parameter studies and in order to further broaden the range of investigated flow regimes in terms of generated steam volume fraction the additional 5 testcases as listed in Table 2 had been selected from [2].
4. The Physical Model
The flow under investigation is described in the framework of the currently most conventional CFD approach to modeling two-phase flows with significant volume fractions of both phases - the Eulerian two-fluid model derived under the assumption of interpenetrating continua. Material
The 14th International Topical Meeting on Nuclear Reactor Thermal Hydraulics (NURETH-14) Log Number: 085 Hilton Toronto Hotel, Toronto, Ontario, Canada, September 25-29, 2011.
(7/25)
properties for both vapor and liquid had been specified by defining material properties based on IAPWS-IF97 water/water steam tables defined for the given range of temperature and pressure of the testcases. Phase distribution results from solving the phase-specific continuity equations for volume fractions, and separate sets of momentum equations are solved for each phase, where buoyancy and interfacial momentum transfer is taken into account. Momentum transport equations are supplemented by turbulence model equations, where the shear stress transport model (SST) has been applied to the continuous phase and a zero-equation disperse phase turbulence model together with the Sato bubble enhanced turbulence model have been used to describe the turbulence effects arising from the bubbly phase (for details see [3]). For the steam–water bubbly flow an energy equation is solved for liquid, while for the description of the nucleate subcooled boiling processes under consideration the vapour is assumed to be saturated at all time. The exchange of mass, momentum and heat between phases are modeled using the correspondent source terms in the phase-specific balance equations. For the dispersed bubbly flow assumed for the nucleate subcooled boiling processes the interfacial momentum transfer is modeled in terms of the Grace drag force due to the hydrodynamic resistance and the non-drag forces [3]. Regarding the consideration of the non-drag forces the current framework in ANSYS CFX [3] allows for the inclusion of the lift, the wall lubrication, the virtual mass and the turbulent dispersion force. Further forces can be added by user-defined source terms. Previous investigations have shown good agreement for simulating adiabatic air-water bubbly flows [4], polydispersed air-water and steam-water flows [5] as well as recondensing steam-water flows [6] using the formulations of Tomiyama (1995, 1998) for the lift force, the generalized wall lubrication force formulation by Frank (2005) and the Favre averaged drag turbulent dispersion force formulation by Burns et al. (2004). In the present investigation non-drag forces with the exclusion of the wall lubrication and virtual mass forces have been applied. The modeling approach for wall boiling will be described in a separate section. Once the steam is produced at the wall, it will be assumed, that the steam is at local pressure dependent saturation temperature at all time. Further the steam condensates in the bulk subcooled liquid (TL < Tsat) with the mass transfer rate per unit volume:
( )
max ,0LG sat L LG
LG
h T T Am
H
−=
ɺ (1)
With superheated liquid, fluid is evaporating at the rate:
( )
max ,0LG L sat LG
LG
h T T Am
H
−=
ɺ (2)
ALG is the interfacial area, and hLG is the interfacial heat transfer coefficient, calculated according to Ranz and Marshall (1952):
( )1/2 1/32 0.6 Re PrL LLG
B B
k kh Nu
d d= = + (3)
This relationship is valid for mass transfer at the interface of rather small bubbles with diameters well below 0.5mm, which is assumed here for the pressurized conditions in PSBT tests. To close the phase transition model in the bulk bubbly flow, a phasic characteristic length scale for the mean bubble diameter dB has to be provided. This can be obtained from applying a population
The 14th International Topical Meeting on Nuclear Reactor Thermal Hydraulics (NURETH-14) Log Number: 085 Hilton Toronto Hotel, Toronto, Ontario, Canada, September 25-29, 2011.
(8/25)
balance model like homogeneous/inhomogeneous MUSIG1 model or a DQMOM2 model. Here in this study we follow the simplified approach of providing a local mean bubble diameter as proposed by Kurul and Podowski [7] as well as Anglart et al. [8], where both proposed to calculate the local bubble diameter dB as a linear function of liquid subcooling Tsub:
( ) ( )1 ,2 2 ,1
,1 ,2
B sub sub B sub sub
Bsub sub
d T T d T Td
T T
− + −=
− (4)
For typical nuclear energy applications these authors proposed for subcooled nucleate boiling under PWR conditions (so, high pressure conditions) reference bubble diameters at the two reference subcooling conditions: dB1 = 0.1mm at Tsub,1 = 13.5K and dB2 =2mm at Tsub,2 = -5K. The bubble size in the bulk has a direct influence on the interfacial area density and on the condensation respective evaporation rate in the bulk. It is clear, that these assumptions cannot be applied without reconsideration to the nucleate subcooled boiling under normal pressure conditions, since already the experimental observations show, that Sauter mean bubble diameters of up to 4mm occurred in the experiments under some of the operating conditions. Therefore this relationship (5) was a first candidate for necessary model modifications for bulk and wall boiling under low pressure conditions, as will be discussed in a later section. 4.1. Modeling Nucleate Subcooled Boiling at Heated Walls The current implementation and exposure of the wall boiling model in the graphical CFD preprocessor of ANSYS CFX had predecessors in earlier versions of ANSYS CFX as beta model capabilities. Therefore more detailed descriptions of the wall boiling modeling approach exist from earlier publications, referring to Egorov et al. [9] and Krepper et al. [10]. All this model development follow the general outline of the so-called wall heat flux partitioning algorithm developed by Kurul & Podowski [7]. Since this initial model development was aimed more on 1d thermohydraulic modeling of the phenomenon, model enhancements and adjustments were necessary in various places of the model algorithm formulation in order to accommodate for the specific requirements of an implementation into a general 3d CFD solver. Subcooled boiling is observed at heated surfaces, when the heat flux applied to the wall is too high to be transferred to the core flow of liquid by the single-phase convective-conductive mechanisms. The term “subcooled” means, that the saturation temperature is exceeded only in a local vicinity of the wall, whereas the average temperature in the bulk is still below saturation. The point, where the local wall temperature reaches the saturation temperature, is considered as the onset of nucleate boiling. Steam bubbles are generated at the heated surface at nucleation sites, with the surface density of these sites depending on different factors, including the wall superheat. With increasing wall superheat ∆Tsup=TW-Tsat the attached bubbles grow and then leave the wall at certain critical size. This critical size, called bubble departure diameter, may depend on the surface tension and on the forces acting on the bubbles from the surrounding fluid. Heat transfer from the wall is then described as being carried by turbulent convection of liquid, by transient conduction due to the departing bubbles and by evaporation. Distribution of the entire wall heat flux between these mechanisms (wall heat partitioning) can be calculated by modeling each mechanism in terms of the nucleation site density, the size of departing bubbles, their detachment frequency, and waiting time until the next bubble appears on the same site
1 MUSIG – Multiple Size Group Model 2 DQMOM - Direct Quadrature Method of Moments
The 14th International Topical Meeting on Nuclear Reactor Thermal Hydraulics (NURETH-14) Log Number: 085 Hilton Toronto Hotel, Toronto, Ontario, Canada, September 25-29, 2011.
(9/25)
(mechanistic modeling approach). This mechanistic modeling approach of the wall boiling process is required in the framework of the CFD code, since for technical applications it is mostly impossible to fully resolve the micro-phenomenon of steam bubble formation at the heated wall on the underlying numerical mesh and with the applied time scale of integration. Instead the resulting steam production and enhanced heat transfer to the liquid is taken into account by the mechanistic model of wall boiling based on the wall heat flux partitioning algorithm. Once the steam bubbles are released from the nucleation sites, they move through the subcooled liquid and condensate, releasing the latent heat again in correspondence to eq. (1). Following the modeling approach of wall heat flux partitioning, the applied wall heat flux on the heated surface is split into 3 parts: QC, the turbulent convective heating of the liquid, QQ, the quenching heat flux and QE, the evaporative heat flux: W C Q EQ Q Q Q= + + (5)
As already mentioned, in this model vapour is assumed to be saturated everywhere, and no part of the wall heat flux is arranged for superheating of the vapour phase. The heat partitioning model considers the whole heated wall surface as being separated into two fractions: a) fraction A2
influenced by the vapour bubbles, formed on the wall and b) fraction A1 being the remaining wall surface area with A1=1-A2. The wall area fraction A1 represents the part of the wall surface that is not affected by the growing steam bubbles. Therefore the wall heat flux for this part of the surface is modelled in a similar way as for the single-phase convective heat transfer into pure liquid, by using the turbulent wall function procedure as outlined in [9]. Given that, the convective heat flux can be written as: ( )1C C W LQ A h T T= − (6)
where hC is the turbulent heat transfer coefficient, which depends on the velocity field and is modelled using the turbulent temperature wall function (see [9]). The wall area fraction A2 represents the remaining part of the surface, which exchanges heat with both phases. The already mentioned evaporative heat flux QE is consumed for evaporation of the initially subcooled liquid:
( ),E G sat LQ m h h= −ɺ (7)
with:
3
2 2
'2
min ,5
62
2
4
3
3
WG a
G F W
Gw
aw
a d
dm N f
A d f
d fN
πρ
π
ρ
ρ
=
=
=
ɺ
(8)
resulting in:
2 2
min ,52
3 4E G a LGw
W
a dQ N f hd
πρ
= (9)
where mɺ is the evaporation mass transfer rate per unit wall area, A’2F is the non-limited wall area influenced by vapour bubble formation, hG,sat and hL are the specific enthalpies of the saturated vapour and subcooled liquid respectively, dW is the bubble departure diameter, Na is the nucleation site density and f is the bubble detachment frequency. The quenching heat flux due to transient vapour bubble departure and cooling of the wall area A2 by substituting fresh subcooled liquid is modelled as:
The 14th International Topical Meeting on Nuclear Reactor Thermal Hydraulics (NURETH-14) Log Number: 085 Hilton Toronto Hotel, Toronto, Ontario, Canada, September 25-29, 2011.
(10/25)
( )2Q Q W LQ A h T T= − (10)
where hQ is the quenching heat transfer coefficient. In the above relationships the area A2 influenced by the growing vapour bubbles is related to the nucleation site density and the bubble departure diameter:
2 2
2 min( ,1)4
Wa
a dA Nπ= ⋅ (11)
where dW is the bubble departure diameter, Na is the nucleation site density and a is a influence factor introduced by Kurul & Podowski [7] and is assumed to be a=2. In order to arrive at a closed model formulation for the above wall heat flux partitioning scheme, a larger number of closure models have to be provided. These are required for the following model parameters:
• Na, wall nucleation site density • bW, bubble departure diameter • f, bubble detachment frequency • hQ, quenching heat transfer coefficient • bubble waiting time
The required closure relationships are provided from correlations, following in most cases the used correlations in the original model formulation of Kurul & Podowski [7], but providing alternatives or the possibility for the model user to introduce his own model correlation as a user-defined relationship instead. For more details on the different submodels please refer to [3]. One particular and rather important correlation used in this model closure is introduced for the bubble departure diameter. Here Kurul & Podowski [7] adopted a correlation established by Tolubinski & Kostanchuk [11]:
maxmin exp ,subW ref
ref
Td d d
T
∆= ⋅ − ∆
(12)
The parameters of the original model are dimensional (dmax=1.4mm, dref=0.6mm, ∆Tref=45K) and ∆Tsub refers to the local liquid subcooling. These model data are specific for the model application to nucleate subcooled boiling under pressurized conditions and need to be revised in case of model application to different operating conditions. 4.2. Boundary Conditions for the Wall Boiling Model The implementation of the wall boiling model for nucleate subcooled boiling in ANSYS CFX supports the specification of either a prescribed wall heat flux or a prescribed wall temperature at the surface of the heated wall. Eq. (6) provides in both cases the relationship to predict either the resulting wall temperature in dependence on the prescribed wall heat flux or vice versa. Another, and in practical cases even more interesting capability, is the specification of a volumetric energy source in the solid material of the heater and the prediction of the heat transfer due to conduction in the solid material using conjugate heat transfer (CHT) prediction. In this case both the wall heat flux and the wall temperature are part of the solution from a coupled simulation of CHT in the solid material and multiphase flow CFD in the fluid domain of the application. ANSYS CFX supports this type of simulation with both 1:1 and non-conforming meshes at the fluid-solid interface. In the present CFD investigation the constant wall heat flux boundary condition was applied, using the specified wall heat flux values for the individual test conditions as listed in Table 1 and Table 2.
The 14th International Topical Meeting on Nuclear Reactor Thermal Hydraulics (NURETH-14) Log Number: 085 Hilton Toronto Hotel, Toronto, Ontario, Canada, September 25-29, 2011.
(11/25)
5. CFD Simulations of Void Distribution in Central Subchannel Test Section (S1)
Formerly the wall boiling model, described in the previous section, was already thoroughly validated [10] for nucleate subcooled boiling under pressurized (PWR) conditions using the data from vertical channel or pipe experiments with heated outer walls for comparison, e.g. experiments published by Bartolomej et al. [12], [13]. In a further investigation [14] the wall boiling model was applied to non-pressurized (BWR) conditions, using the testcase configuration from the experimental test facility and experimental data of Lee et al. [15], [16] and [17]. To identify the range of validity of applied boiling model and undertaken model parameter changes the calculated steam volume fraction and steam/water velocity profiles were compared with the large set of measurements at different operating conditions. Finally the RPI wall boiling in ANSYS CFX was successfully coupled with the homogeneous and inhomogeneous Multiple Size Group Model (MUSIG) [4], [18] in order to overcome the limitations and uncertainties arising from the use of correlations for the bulk bubble diameter in boiling flows and in order to account for changes in the steam bubble size distribution due to evaporation, condensation, breakup and coalescence. This new coupled approach [18] was validated against the experimental data of Roy et al. [19] for nucleate subcooled boiling of R-113 refrigerant flowing upward in a concentric circular annulus with central heated rod. Due to the rather new implementation of this coupled approach and the higher computational demands of the MUSIG model, for the present PSBT benchmark investigations the Kurul and Podowski correlation from eq. (4) was still used. All of the above investigations had been carried out so far for geometries showing radial symmetry and which can basically simulated in 2d. In contrary in the present study the underlying geometry of the central heated subchannel of a 5x5 rod bundle represents dedicated 3-dimensional flow geometry with a curved heater surface. Expected secondary flows in the cross-section of the subchannel geometry and their possible influence on the wall boiling process at the curved heater surface of the subchannel required closer attention to the CFD setup configuration and turbulence modeling. To identify the range of validity of applied multiphase flow and boiling models, the calculated steam volume fractions were compared with a large set of measurements at different operating conditions.
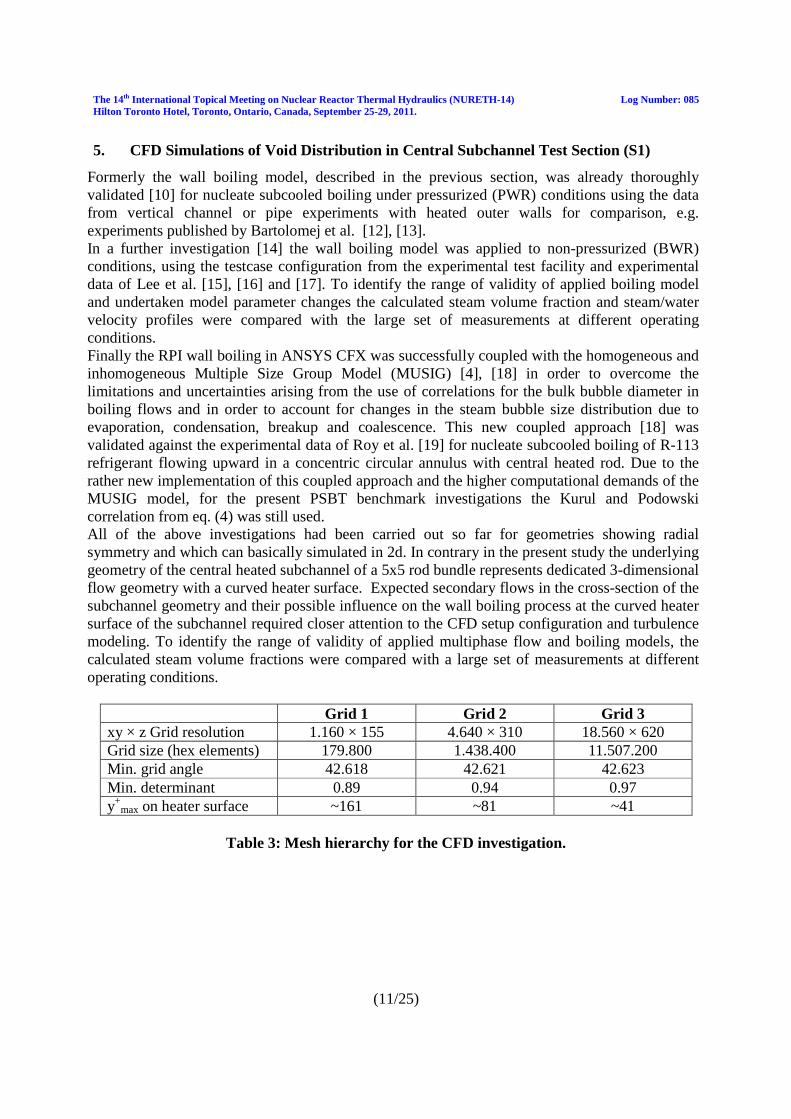
Grid 1 Grid 2 Grid 3 xy × z Grid resolution 1.160 × 155 4.640 × 310 18.560 × 620 Grid size (hex elements) 179.800 1.438.400 11.507.200 Min. grid angle 42.618 42.621 42.623 Min. determinant 0.89 0.94 0.97 y+
max on heater surface ~161 ~81 ~41
Table 3: Mesh hierarchy for the CFD investigation.
The 14th International Topical Meeting on Nuclear Reactor Thermal Hydraulics (NURETH-14) Log Number: 085 Hilton Toronto Hotel, Toronto, Ontario, Canada, September 25-29, 2011.
(12/25)
5.1 CFD Geometry and Applied Mesh Hierarchy
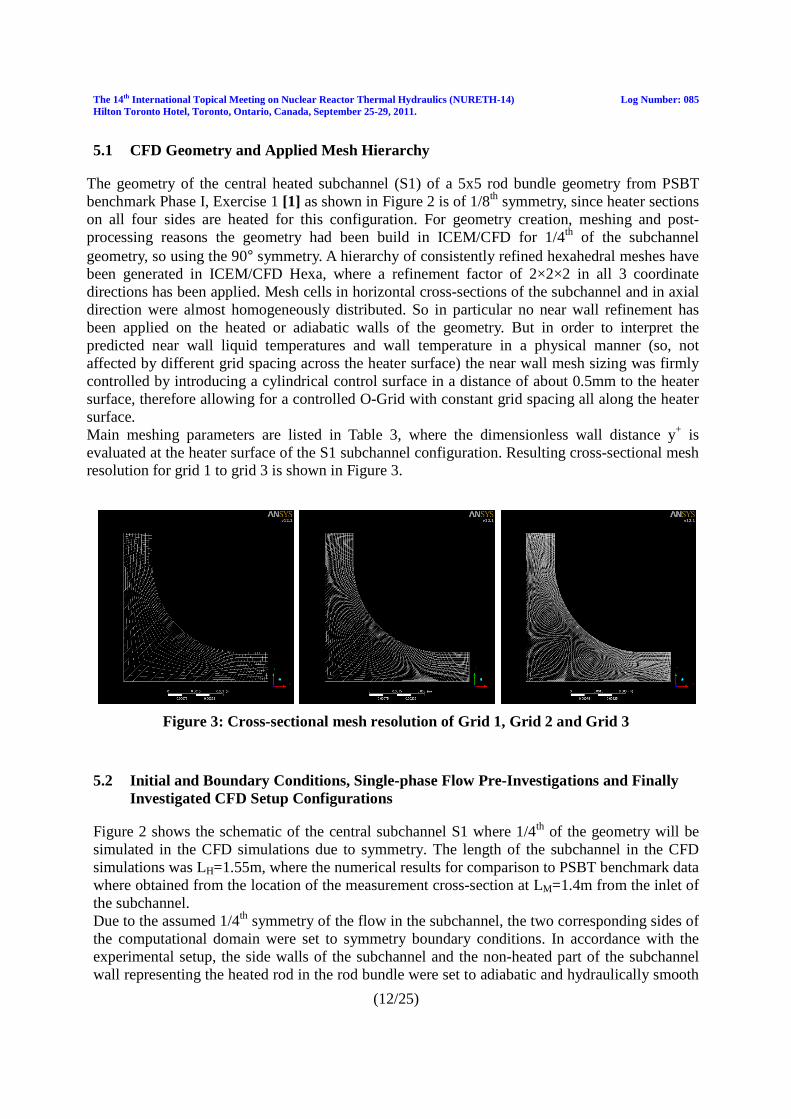
The geometry of the central heated subchannel (S1) of a 5x5 rod bundle geometry from PSBT benchmark Phase I, Exercise 1 [1] as shown in Figure 2 is of 1/8th symmetry, since heater sections on all four sides are heated for this configuration. For geometry creation, meshing and post-processing reasons the geometry had been build in ICEM/CFD for 1/4th of the subchannel geometry, so using the 90° symmetry. A hierarchy of consistently refined hexahedral meshes have been generated in ICEM/CFD Hexa, where a refinement factor of 2×2×2 in all 3 coordinate directions has been applied. Mesh cells in horizontal cross-sections of the subchannel and in axial direction were almost homogeneously distributed. So in particular no near wall refinement has been applied on the heated or adiabatic walls of the geometry. But in order to interpret the predicted near wall liquid temperatures and wall temperature in a physical manner (so, not affected by different grid spacing across the heater surface) the near wall mesh sizing was firmly controlled by introducing a cylindrical control surface in a distance of about 0.5mm to the heater surface, therefore allowing for a controlled O-Grid with constant grid spacing all along the heater surface. Main meshing parameters are listed in Table 3, where the dimensionless wall distance y+ is evaluated at the heater surface of the S1 subchannel configuration. Resulting cross-sectional mesh resolution for grid 1 to grid 3 is shown in Figure 3.
Figure 3: Cross-sectional mesh resolution of Grid 1, Grid 2 and Grid 3
5.2 Initial and Boundary Conditions, Single-phase Flow Pre-Investigations and Finally Investigated CFD Setup Configurations
Figure 2 shows the schematic of the central subchannel S1 where 1/4th of the geometry will be simulated in the CFD simulations due to symmetry. The length of the subchannel in the CFD simulations was LH=1.55m, where the numerical results for comparison to PSBT benchmark data where obtained from the location of the measurement cross-section at LM=1.4m from the inlet of the subchannel. Due to the assumed 1/4th symmetry of the flow in the subchannel, the two corresponding sides of the computational domain were set to symmetry boundary conditions. In accordance with the experimental setup, the side walls of the subchannel and the non-heated part of the subchannel wall representing the heated rod in the rod bundle were set to adiabatic and hydraulically smooth
The 14th International Topical Meeting on Nuclear Reactor Thermal Hydraulics (NURETH-14) Log Number: 085 Hilton Toronto Hotel, Toronto, Ontario, Canada, September 25-29, 2011.
(13/25)
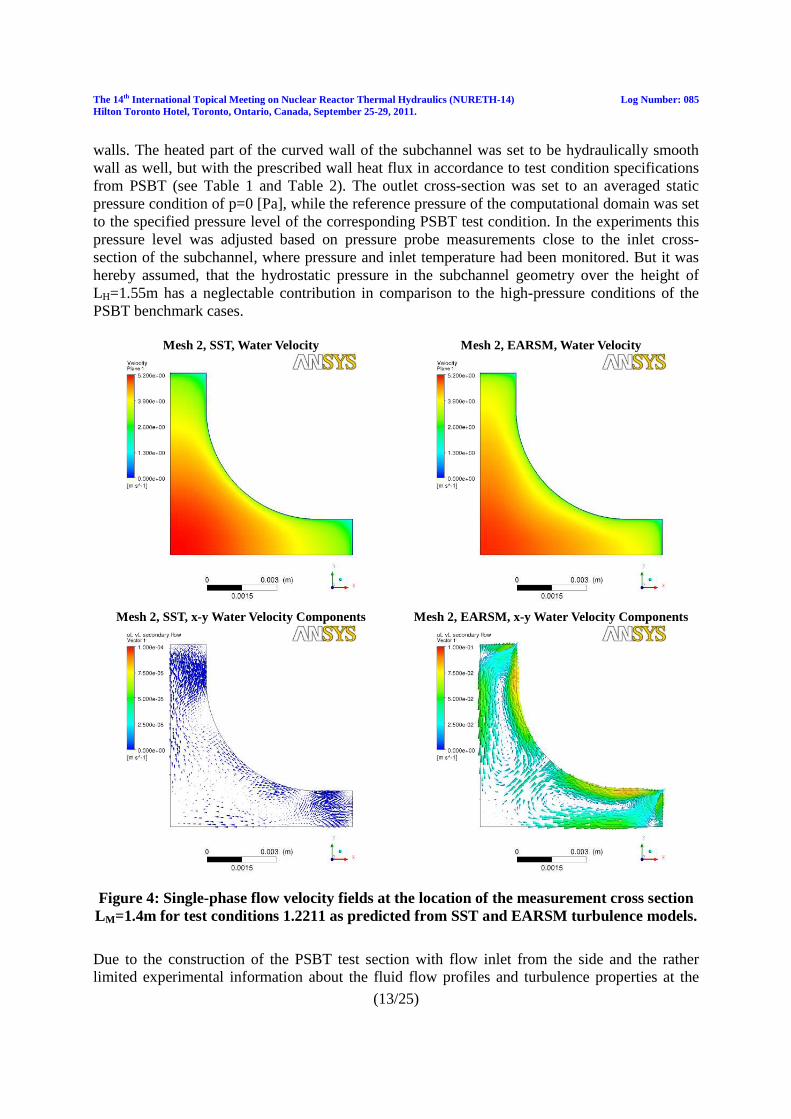
walls. The heated part of the curved wall of the subchannel was set to be hydraulically smooth wall as well, but with the prescribed wall heat flux in accordance to test condition specifications from PSBT (see Table 1 and Table 2). The outlet cross-section was set to an averaged static pressure condition of p=0 [Pa], while the reference pressure of the computational domain was set to the specified pressure level of the corresponding PSBT test condition. In the experiments this pressure level was adjusted based on pressure probe measurements close to the inlet cross-section of the subchannel, where pressure and inlet temperature had been monitored. But it was hereby assumed, that the hydrostatic pressure in the subchannel geometry over the height of LH=1.55m has a neglectable contribution in comparison to the high-pressure conditions of the PSBT benchmark cases.
Mesh 2, SST, Water Velocity
Mesh 2, EARSM, Water Velocity
Mesh 2, SST, x-y Water Velocity Components
Mesh 2, EARSM, x-y Water Velocity Components
Figure 4: Single-phase flow velocity fields at the location of the measurement cross section LM=1.4m for test conditions 1.2211 as predicted from SST and EARSM turbulence models.
Due to the construction of the PSBT test section with flow inlet from the side and the rather limited experimental information about the fluid flow profiles and turbulence properties at the
The 14th International Topical Meeting on Nuclear Reactor Thermal Hydraulics (NURETH-14) Log Number: 085 Hilton Toronto Hotel, Toronto, Ontario, Canada, September 25-29, 2011.
(14/25)
inlet cross section to the heated part of the test section, these inlet boundary conditions are subject of a major uncertainty. In the lack of knowledge it was assumed, that fully developed inflow conditions can be applied for the CFD investigations. In order to allow for a best possible flow initialization and inlet boundary conditions it was decided, to first carry out a single-phase CFD simulation for the test section with adiabatic boundary conditions on all solid walls including the heater section on the rod surface. These single-phase flow CFD predictions had been carried out on Grid 2 for corresponding pressure level of the test, with assigned inlet boundary condition corresponding to the specified homogeneous liquid inlet temperature and specified mass flow rate of the tests. Therefore such single-phase flow predictions have been carried out for the 10 different investigated test conditions and for each of them by applying 3 different turbulence models, namely the SST3, EARSM4 and BSL RSM5 turbulence models (see [3], [20]). Due to the similarity of the EARSM and BSL RSM solutions, for the later multiphase flow investigations the BSL RSM model was dropped in order to reduce the test matrix. Figure 4 shows the representative single-phase flow velocity fields in the measurement cross-section at LM=1.4m for the test conditions of 1.2211 test. While it is rather hard to observe substantial differences in distribution for the absolute value of the fluid velocity, Figure 4 shows clear differences between the SST and EARSM single-phase flow field solutions, if the x-y-components of the fluid velocity are plotted in the measurement cross section at LM=1.4m in order to visualize the secondary flows induced by the curved wall of the heater surface and resulting anisotropic turbulence. It can be seen, that an isotropic turbulence model like SST is not able to predict these secondary flows (almost zero cross-sectional velocity components), while EARSM or BSL RSM Reynolds stress models result in secondary fluid flow in the cross section of the subchannel with maximum amplitude of about 0.1m/s. In the case of boiling at the heater surface it can be expected, that these secondary flows will have certain influence on the steam volume fraction, liquid temperature and wall temperature distribution across the heater surface, which might be even a safety relevant design or operation criteria for the fuel rod bundle flow. Consequently the applied CFD simulation and flow field initialization methodology followed the following individual steps:
1. Single-phase CFD simulation for the subchannel S1 geometry with corresponding pressure level, inlet fluid temperature and mass flow rate and with adiabatic boundary conditions on all solid walls
2. Extraction of u-v-w velocity profiles and all turbulence properties of the applied turbulence model (SST: k and ω, EARSM: k and ε, BSL RSM: all 6 Reynolds stress components and ω) at the outlet cross section at LT=1.55m
3. Application of these xy-profile data for inlet boundary conditions and for CFD domain initialization for all subsequent multiphase flow predictions
4. Additional specification of an inlet steam void fraction of rv=10-7 at the inlet cross-section in case of multiphase flow prediction. The velocity field for the gaseous phase (water steam) is initially set equal to the velocity field of the fluid phase (water) as determined from step 2).
5. Multiphase flow computation for the subcooled nucleate boiling flow under the corresponding test conditions with application of the corresponding wall heat flux to the heated section of the rod surface of the subchannel.
3 SST – Shear-Stress Transport model 4 EARSM – Explicit algebraic Reynolds Stress Model 5 BSL RSM - ω-based Baseline Reynolds Stress Model
The 14th International Topical Meeting on Nuclear Reactor Thermal Hydraulics (NURETH-14) Log Number: 085 Hilton Toronto Hotel, Toronto, Ontario, Canada, September 25-29, 2011.
(15/25)
As mentioned in section 4, in both the single- and multiphase flow simulations the material properties for steam and water had been specified by defining the material properties based on IAPWS-IF97 water/water steam tables defined for the given range of temperature and pressure of the testcase conditions. Thereby it is assured, that the correct thermodynamical properties of the working fluids are used at any time in the CFD simulation. For the investigation of the nucleate subcooled boiling flow through the S1 subchannel geometry there were unfortunately besides the inlet boundary conditions and the required turbulence modelling even additional uncertainties or unresolved degrees of freedom in the CFD simulation.
1. The PSBT benchmark specification does not provide any information about the steam bubble size spectrum which was observed or present under the individual PSBT test conditions. The interfacial area concentration was not measured as well, so that it is almost unknown, which particular multiphase flow regime is realized in one or the other test. Since the test conditions vary over a very wide range from only some percent of steam volume fraction up to about 70-80%, this corresponds to flow transition from dispersed bubbly flow through churn-turbulent and slug flow regimes up to dispersed droplet flow with or without existing liquid wall films. Today no existing multiphase flow CFD model is able to deal with this kind of flow morphology transition in a predictive manner and with high accuracy.
2. Due to the not measured bubble size spectrum and/or interfacial area concentration we have to rely in our CFD simulation on the Tolubinski & Kostanchuk correlation in its unmodified form (see section 4) for the bubble departure diameter and an adapted and smoothed Kurul & Podowski correlation with a maximum bubble diameter of dB,max=0.65mm for the bubble diameter in the bulk flow, as commonly used for PWR conditions.
3. Furthermore the interfacial mass, momentum and heat transfer is heavily depending on the multiphase flow regime due to changing interfacial area concentration. Since no further information is available, we decided to test two different setups for the interfacial momentum transfer (see below).
As a result of this uncertainties for the multiphase flow modelling to be applied for the CFD simulation of the boiling subchannel flow, for each test condition in total three different CFD setup configurations had been applied on two or three different meshes.
1. CFD setup configuration – SST_TD: • Turbulence model: SST • MPF model: Eulerian multiphase flow model for dispersed flow but with blended
law for interfacial area concentration for very high steam volume fraction • Drag force model: Grace drag law • Non-drag force models: FAD turbulent dispersion force
2. CFD setup configuration – SST_NDF: This CFD setup corresponds to the SST_TD setup with additionally added non-drag force formulations:
• Turbulence model: SST • MPF model: Eulerian multiphase flow model for dispersed flow but with blended
law for interfacial area concentration for very high steam volume fraction • Drag force model: Grace drag law • Non-drag force models: FAD turbulent dispersion force, Tomiyama lift force and
Antal wall lubrication force
The 14th International Topical Meeting on Nuclear Reactor Thermal Hydraulics (NURETH-14) Log Number: 085 Hilton Toronto Hotel, Toronto, Ontario, Canada, September 25-29, 2011.
(16/25)
3. CFD setup configuration – EARSM_NDF: This CFD setup corresponds to the SST_ND setup with the difference of changed turbulence model from SST to EARSM:
• Turbulence model: SST • MPF model: Eulerian multiphase flow model for dispersed flow but with blended
law for interfacial area concentration for very high steam volume fraction • Drag force model: Grace drag law • Non-drag force models: FAD turbulent dispersion force, Tomiyama lift force and
Antal wall lubrication force Wall Boiling Submodels As already mentioned in section 4, the RPI wall boiling model depends on a larger number of submodels and model parameters, where most of them had been derived for wall boiling processes under pressurized conditions and are assumed to be applicable for PSBT benchmark conditions without further changes. In the present investigation the following settings for the submodels of the wall boiling model have been used:
• Wall nucleation site density: Lemmert & Chawla model • Liquid quenching heat transfer coefficient: Del Valle Kenning model • Bubble detachment frequency: Cole model, derived from terminal bubble rise velocity
over the bubble departure diameter • Bubble waiting time: Tolubinski & Kostanchuk model, which sets the bubble waiting time
to 80% of the time between bubble departures • Bubble diameter influence factor: default value of 2.0 • Fixed y+ for evaluation of liquid subcooling temperature from turbulent wall functions:
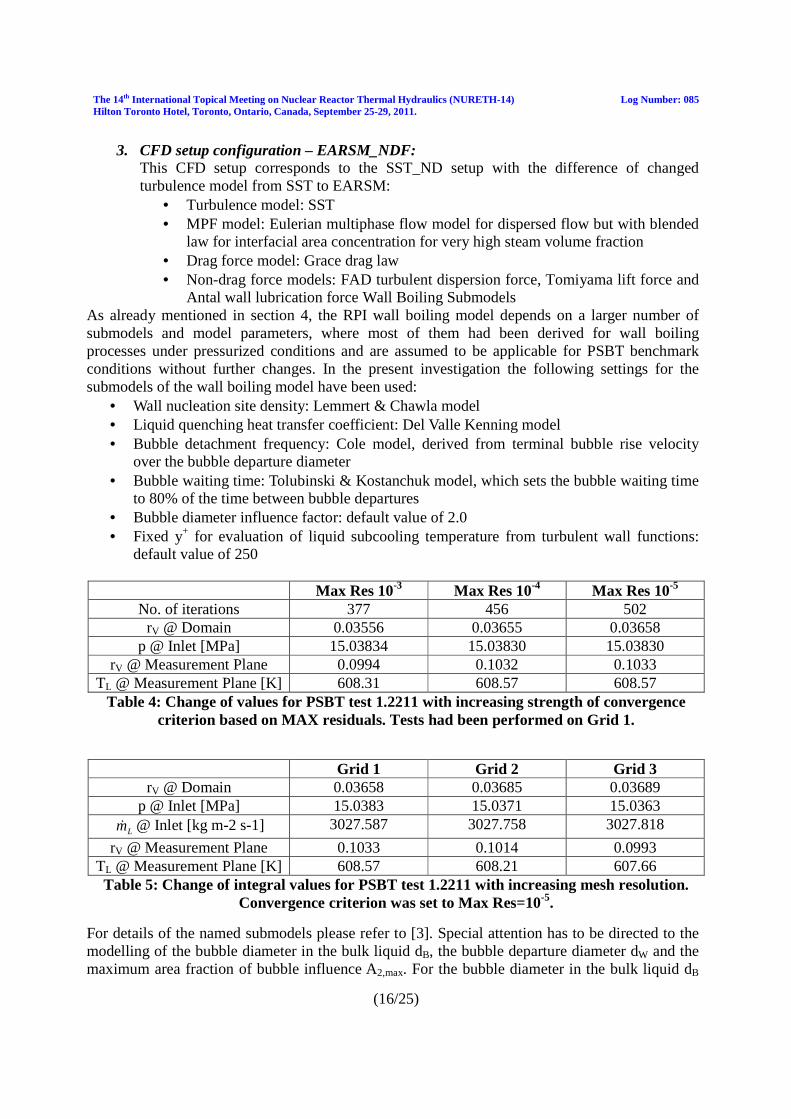
default value of 250 Max Res 10-3 Max Res 10-4 Max Res 10-5
No. of iterations 377 456 502 rV @ Domain 0.03556 0.03655 0.03658
p @ Inlet [MPa] 15.03834 15.03830 15.03830 rV @ Measurement Plane 0.0994 0.1032 0.1033
TL @ Measurement Plane [K] 608.31 608.57 608.57 Table 4: Change of values for PSBT test 1.2211 with increasing strength of convergence
criterion based on MAX residuals. Tests had been performed on Grid 1.
Grid 1 Grid 2 Grid 3
rV @ Domain 0.03658 0.03685 0.03689 p @ Inlet [MPa] 15.0383 15.0371 15.0363
Lmɺ @ Inlet [kg m-2 s-1] 3027.587 3027.758 3027.818
rV @ Measurement Plane 0.1033 0.1014 0.0993 TL @ Measurement Plane [K] 608.57 608.21 607.66 Table 5: Change of integral values for PSBT test 1.2211 with increasing mesh resolution.
Convergence criterion was set to Max Res=10-5.
For details of the named submodels please refer to [3]. Special attention has to be directed to the modelling of the bubble diameter in the bulk liquid dB, the bubble departure diameter dW and the maximum area fraction of bubble influence A2,max. For the bubble diameter in the bulk liquid dB
The 14th International Topical Meeting on Nuclear Reactor Thermal Hydraulics (NURETH-14) Log Number: 085 Hilton Toronto Hotel, Toronto, Ontario, Canada, September 25-29, 2011.
(17/25)
we use the formulation of Kurul & Podowski in accordance with eq. (5). Following a suggestion of Egorov et al.[10], the original piece-wise linear relationship of Kurul & Podowski [7] was additionally smoothed by applying tanh functions as smoothing function. Based on experience from former investigations for PWR conditions [10],[18] the default model parameters from eq. (5) were slightly changed to the following reference bubble diameters at the two reference subcooling conditions: dB1 = 0.15mm at Tsub,1 = 13.5K and dB2 =0.65mm at Tsub,2 = -5K. Thereby the bubble diameter in the bulk fluid is consistently defined in the vicinity of the heated wall in correspondence to the law of Tolubinski and Kostanchuk, eq. (13) for the bubble departure diameter using the default model parameter set. For the maximum area fraction of bubble influence A2,max no limiter was applied, i.e. the maximum area fraction A2,max is set to 1.0. The above RPI wall boiling model settings were applied to all following multiphase flow CFD simulations without change.
5.3 CFD Results and Comparison to PSBT Experimental Data
5.3.1 CFD Solver Convergence and Mesh Independence
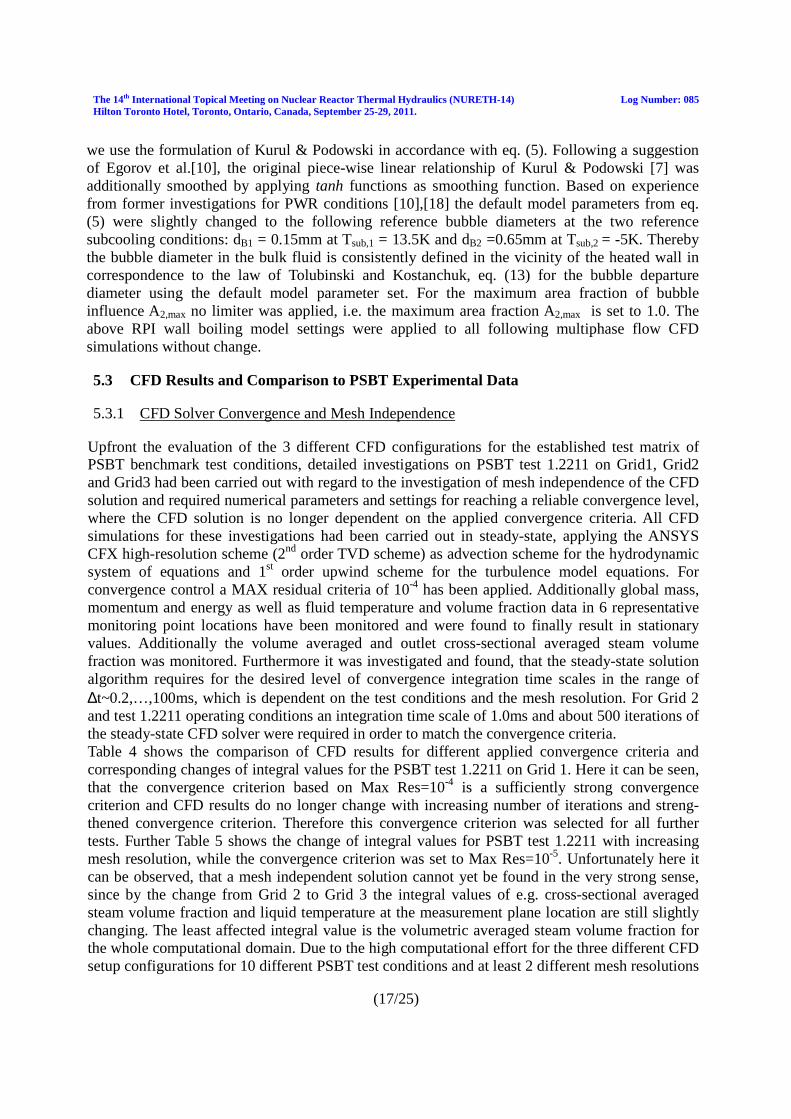
Upfront the evaluation of the 3 different CFD configurations for the established test matrix of PSBT benchmark test conditions, detailed investigations on PSBT test 1.2211 on Grid1, Grid2 and Grid3 had been carried out with regard to the investigation of mesh independence of the CFD solution and required numerical parameters and settings for reaching a reliable convergence level, where the CFD solution is no longer dependent on the applied convergence criteria. All CFD simulations for these investigations had been carried out in steady-state, applying the ANSYS CFX high-resolution scheme (2nd order TVD scheme) as advection scheme for the hydrodynamic system of equations and 1st order upwind scheme for the turbulence model equations. For convergence control a MAX residual criteria of 10-4 has been applied. Additionally global mass, momentum and energy as well as fluid temperature and volume fraction data in 6 representative monitoring point locations have been monitored and were found to finally result in stationary values. Additionally the volume averaged and outlet cross-sectional averaged steam volume fraction was monitored. Furthermore it was investigated and found, that the steady-state solution algorithm requires for the desired level of convergence integration time scales in the range of ∆t~0.2,…,100ms, which is dependent on the test conditions and the mesh resolution. For Grid 2 and test 1.2211 operating conditions an integration time scale of 1.0ms and about 500 iterations of the steady-state CFD solver were required in order to match the convergence criteria. Table 4 shows the comparison of CFD results for different applied convergence criteria and corresponding changes of integral values for the PSBT test 1.2211 on Grid 1. Here it can be seen, that the convergence criterion based on Max Res=10-4 is a sufficiently strong convergence criterion and CFD results do no longer change with increasing number of iterations and streng-thened convergence criterion. Therefore this convergence criterion was selected for all further tests. Further Table 5 shows the change of integral values for PSBT test 1.2211 with increasing mesh resolution, while the convergence criterion was set to Max Res=10-5. Unfortunately here it can be observed, that a mesh independent solution cannot yet be found in the very strong sense, since by the change from Grid 2 to Grid 3 the integral values of e.g. cross-sectional averaged steam volume fraction and liquid temperature at the measurement plane location are still slightly changing. The least affected integral value is the volumetric averaged steam volume fraction for the whole computational domain. Due to the high computational effort for the three different CFD setup configurations for 10 different PSBT test conditions and at least 2 different mesh resolutions
The 14th International Topical Meeting on Nuclear Reactor Thermal Hydraulics (NURETH-14) Log Number: 085 Hilton Toronto Hotel, Toronto, Ontario, Canada, September 25-29, 2011.
(18/25)
it was nevertheless decided to accept the small numerical error, which is still persistent in the CFD solutions on Grid 2, which is for the investigated case 1.2211 in the order of 2% between the Grid 2 and the Grid 3 result for the cross-sectional averaged steam volume fraction at the measurement plane location. Therefore all subsequent CFD simulations had been carried out for the meshes Grid 1 and Grid 2 with the applied convergence criterion based on Max Res=10-4 and additionally observing global imbalances for mass, momentum and energy as well as the liquid temperature and steam volume fraction monitors at the defined locations.
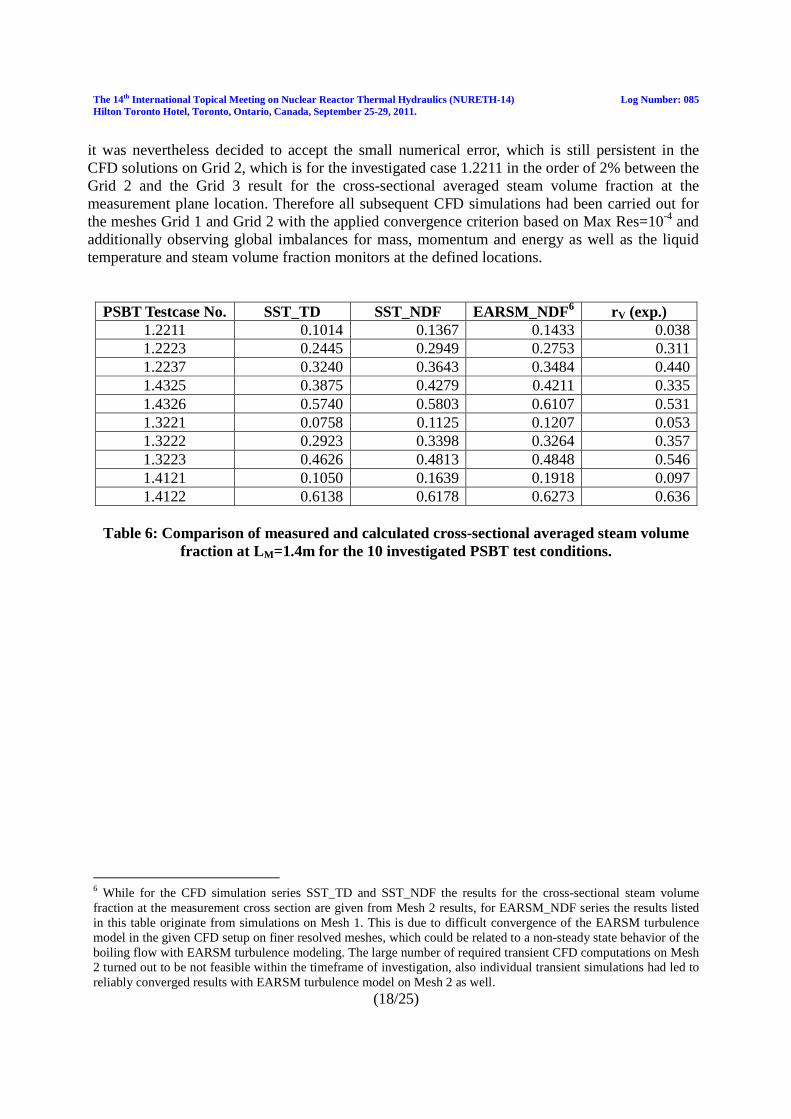
PSBT Testcase No. SST_TD SST_NDF EARSM_NDF6 rV (exp.) 1.2211 0.1014 0.1367 0.1433 0.038 1.2223 0.2445 0.2949 0.2753 0.311 1.2237 0.3240 0.3643 0.3484 0.440 1.4325 0.3875 0.4279 0.4211 0.335 1.4326 0.5740 0.5803 0.6107 0.531 1.3221 0.0758 0.1125 0.1207 0.053 1.3222 0.2923 0.3398 0.3264 0.357 1.3223 0.4626 0.4813 0.4848 0.546 1.4121 0.1050 0.1639 0.1918 0.097 1.4122 0.6138 0.6178 0.6273 0.636
Table 6: Comparison of measured and calculated cross-sectional averaged steam volume
fraction at L M=1.4m for the 10 investigated PSBT test conditions.
6 While for the CFD simulation series SST_TD and SST_NDF the results for the cross-sectional steam volume fraction at the measurement cross section are given from Mesh 2 results, for EARSM_NDF series the results listed in this table originate from simulations on Mesh 1. This is due to difficult convergence of the EARSM turbulence model in the given CFD setup on finer resolved meshes, which could be related to a non-steady state behavior of the boiling flow with EARSM turbulence modeling. The large number of required transient CFD computations on Mesh 2 turned out to be not feasible within the timeframe of investigation, also individual transient simulations had led to reliably converged results with EARSM turbulence model on Mesh 2 as well.
The 14th International Topical Meeting on Nuclear Reactor Thermal Hydraulics (NURETH-14) Log Number: 085 Hilton Toronto Hotel, Toronto, Ontario, Canada, September 25-29, 2011.
(19/25)
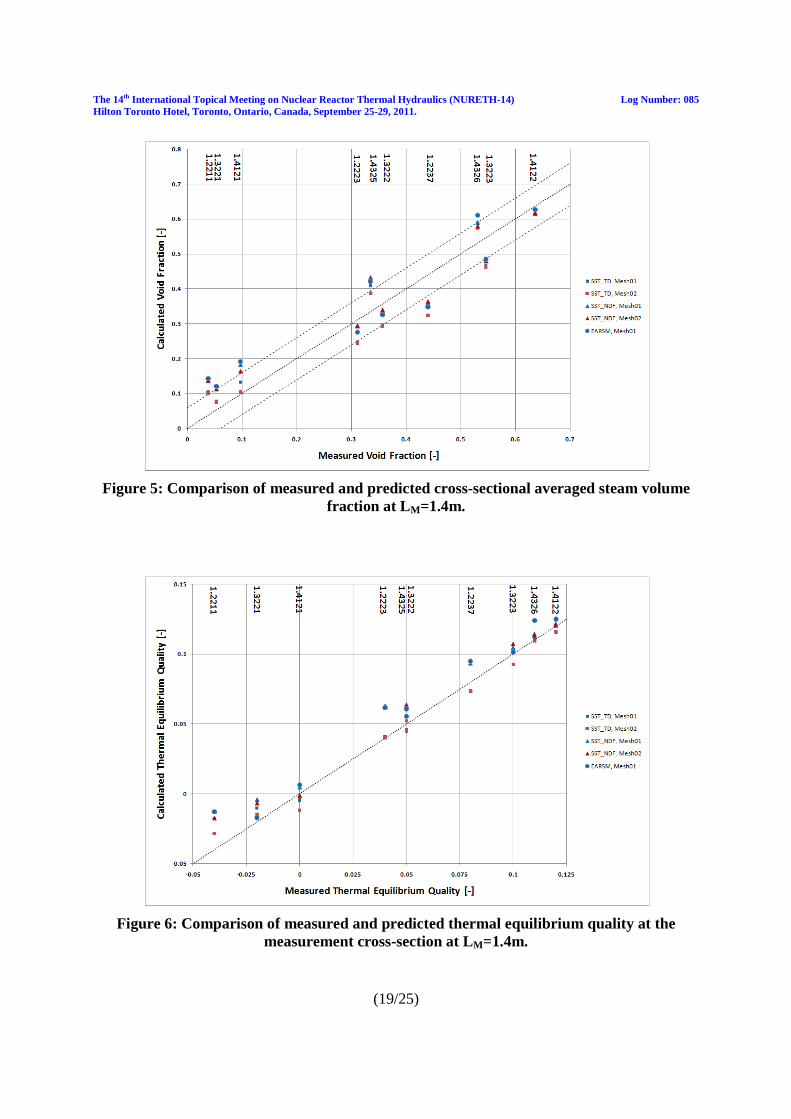
Figure 5: Comparison of measured and predicted cross-sectional averaged steam volume fraction at L M=1.4m.
Figure 6: Comparison of measured and predicted thermal equilibrium quality at the measurement cross-section at LM=1.4m.
The 14th International Topical Meeting on Nuclear Reactor Thermal Hydraulics (NURETH-14) Log Number: 085 Hilton Toronto Hotel, Toronto, Ontario, Canada, September 25-29, 2011.
(20/25)
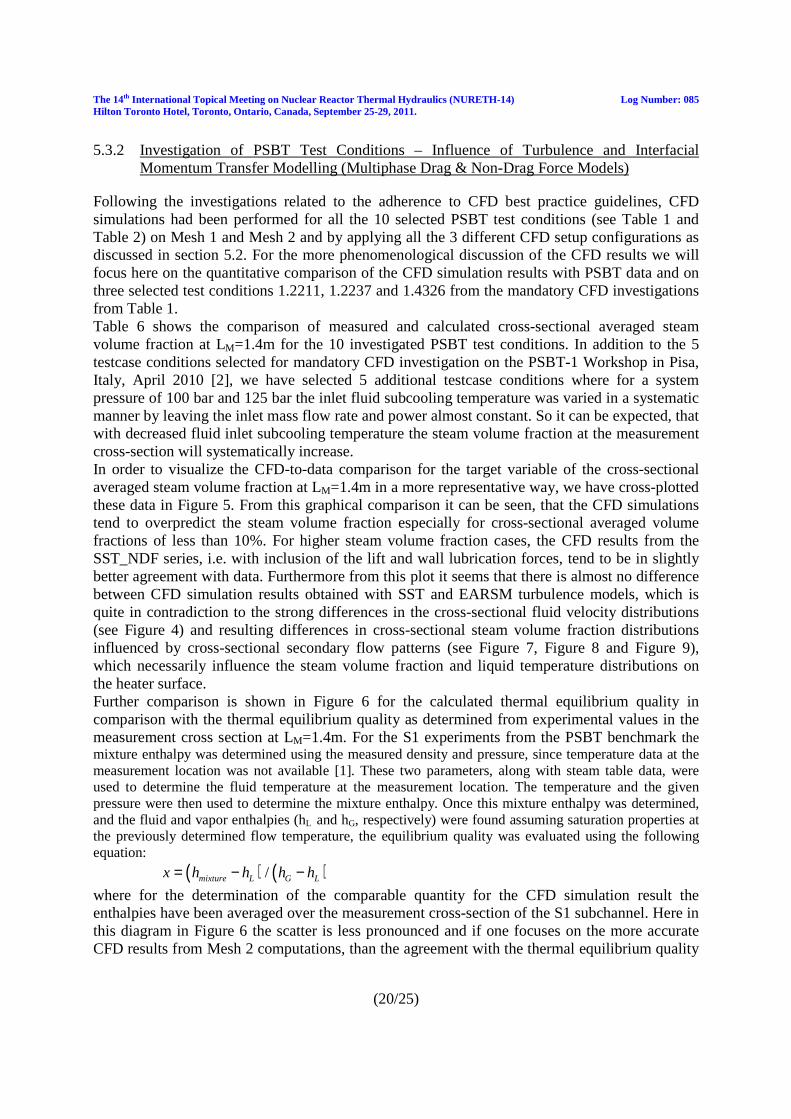
5.3.2 Investigation of PSBT Test Conditions – Influence of Turbulence and Interfacial Momentum Transfer Modelling (Multiphase Drag & Non-Drag Force Models)
Following the investigations related to the adherence to CFD best practice guidelines, CFD simulations had been performed for all the 10 selected PSBT test conditions (see Table 1 and Table 2) on Mesh 1 and Mesh 2 and by applying all the 3 different CFD setup configurations as discussed in section 5.2. For the more phenomenological discussion of the CFD results we will focus here on the quantitative comparison of the CFD simulation results with PSBT data and on three selected test conditions 1.2211, 1.2237 and 1.4326 from the mandatory CFD investigations from Table 1. Table 6 shows the comparison of measured and calculated cross-sectional averaged steam volume fraction at LM=1.4m for the 10 investigated PSBT test conditions. In addition to the 5 testcase conditions selected for mandatory CFD investigation on the PSBT-1 Workshop in Pisa, Italy, April 2010 [2], we have selected 5 additional testcase conditions where for a system pressure of 100 bar and 125 bar the inlet fluid subcooling temperature was varied in a systematic manner by leaving the inlet mass flow rate and power almost constant. So it can be expected, that with decreased fluid inlet subcooling temperature the steam volume fraction at the measurement cross-section will systematically increase. In order to visualize the CFD-to-data comparison for the target variable of the cross-sectional averaged steam volume fraction at LM=1.4m in a more representative way, we have cross-plotted these data in Figure 5. From this graphical comparison it can be seen, that the CFD simulations tend to overpredict the steam volume fraction especially for cross-sectional averaged volume fractions of less than 10%. For higher steam volume fraction cases, the CFD results from the SST_NDF series, i.e. with inclusion of the lift and wall lubrication forces, tend to be in slightly better agreement with data. Furthermore from this plot it seems that there is almost no difference between CFD simulation results obtained with SST and EARSM turbulence models, which is quite in contradiction to the strong differences in the cross-sectional fluid velocity distributions (see Figure 4) and resulting differences in cross-sectional steam volume fraction distributions influenced by cross-sectional secondary flow patterns (see Figure 7, Figure 8 and Figure 9), which necessarily influence the steam volume fraction and liquid temperature distributions on the heater surface. Further comparison is shown in Figure 6 for the calculated thermal equilibrium quality in comparison with the thermal equilibrium quality as determined from experimental values in the measurement cross section at LM=1.4m. For the S1 experiments from the PSBT benchmark the mixture enthalpy was determined using the measured density and pressure, since temperature data at the measurement location was not available [1]. These two parameters, along with steam table data, were used to determine the fluid temperature at the measurement location. The temperature and the given pressure were then used to determine the mixture enthalpy. Once this mixture enthalpy was determined, and the fluid and vapor enthalpies (hL and hG, respectively) were found assuming saturation properties at the previously determined flow temperature, the equilibrium quality was evaluated using the following equation:
( ) ( )/mixture L G Lx h h h h= − −
where for the determination of the comparable quantity for the CFD simulation result the enthalpies have been averaged over the measurement cross-section of the S1 subchannel. Here in this diagram in Figure 6 the scatter is less pronounced and if one focuses on the more accurate CFD results from Mesh 2 computations, than the agreement with the thermal equilibrium quality
The 14th International Topical Meeting on Nuclear Reactor Thermal Hydraulics (NURETH-14) Log Number: 085 Hilton Toronto Hotel, Toronto, Ontario, Canada, September 25-29, 2011.
(21/25)
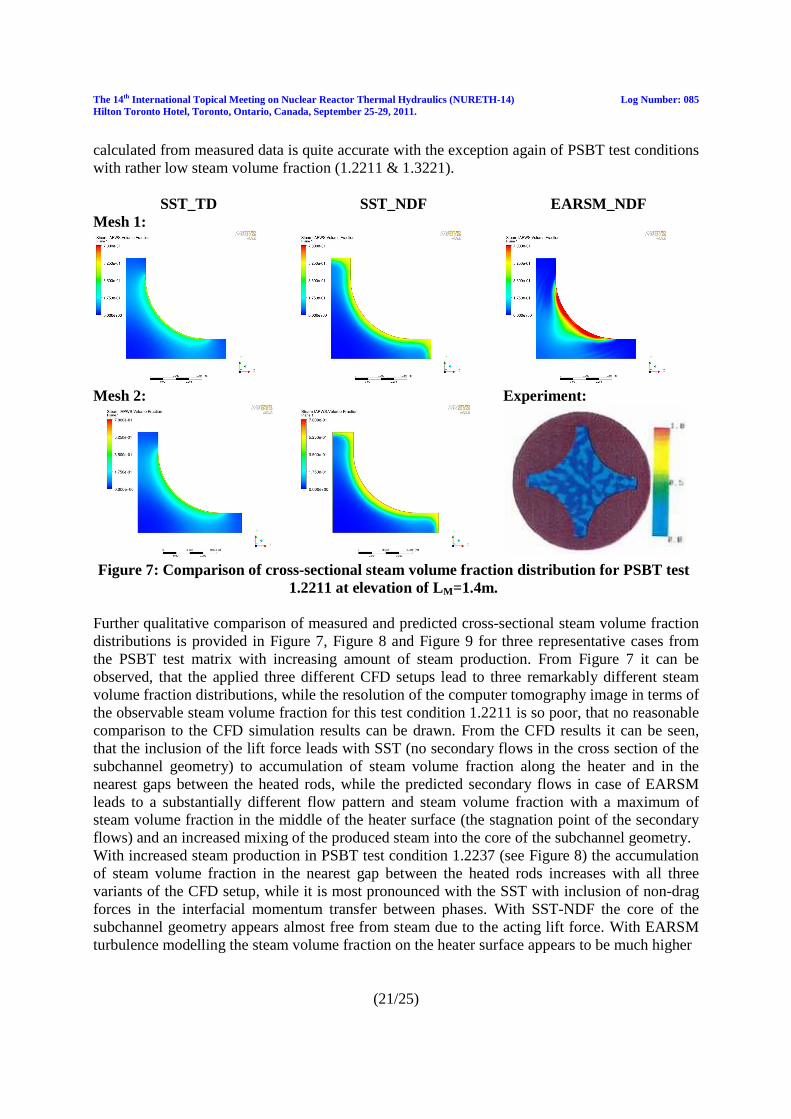
calculated from measured data is quite accurate with the exception again of PSBT test conditions with rather low steam volume fraction (1.2211 & 1.3221).
SST_TD SST_NDF EARSM_NDF Mesh 1:
Mesh 2:
Experiment:
Figure 7: Comparison of cross-sectional steam volume fraction distribution for PSBT test
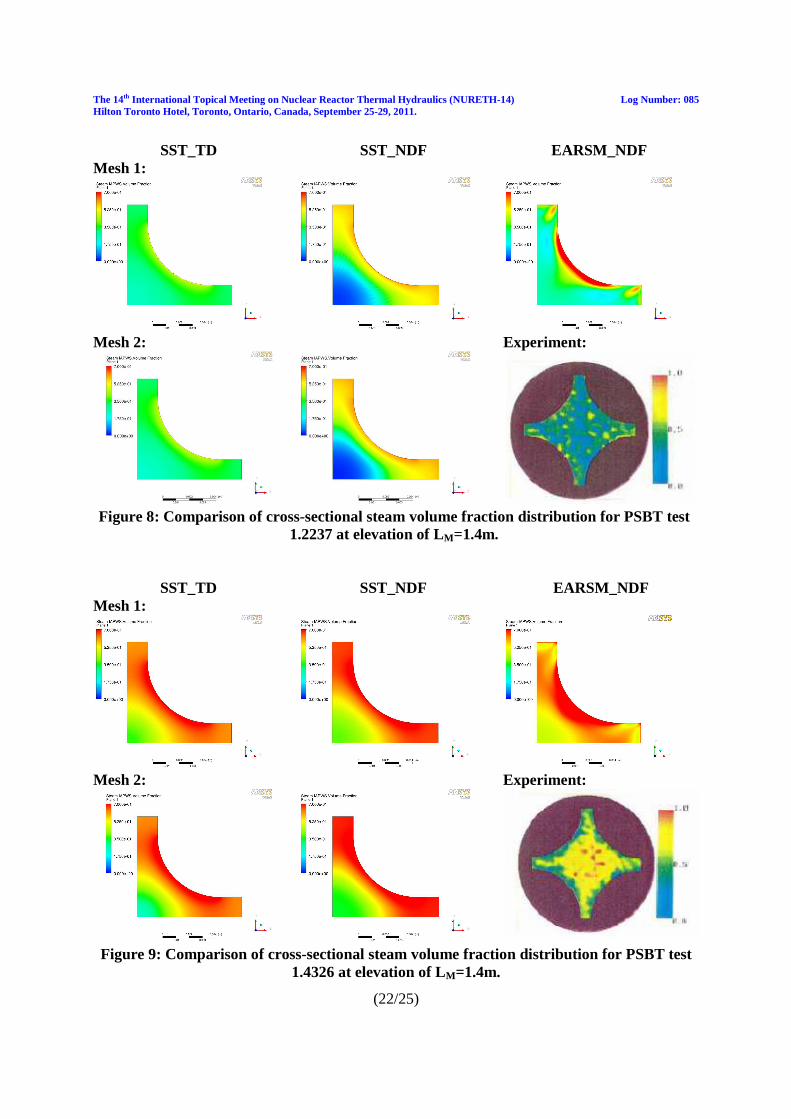
1.2211 at elevation of LM=1.4m. Further qualitative comparison of measured and predicted cross-sectional steam volume fraction distributions is provided in Figure 7, Figure 8 and Figure 9 for three representative cases from the PSBT test matrix with increasing amount of steam production. From Figure 7 it can be observed, that the applied three different CFD setups lead to three remarkably different steam volume fraction distributions, while the resolution of the computer tomography image in terms of the observable steam volume fraction for this test condition 1.2211 is so poor, that no reasonable comparison to the CFD simulation results can be drawn. From the CFD results it can be seen, that the inclusion of the lift force leads with SST (no secondary flows in the cross section of the subchannel geometry) to accumulation of steam volume fraction along the heater and in the nearest gaps between the heated rods, while the predicted secondary flows in case of EARSM leads to a substantially different flow pattern and steam volume fraction with a maximum of steam volume fraction in the middle of the heater surface (the stagnation point of the secondary flows) and an increased mixing of the produced steam into the core of the subchannel geometry. With increased steam production in PSBT test condition 1.2237 (see Figure 8) the accumulation of steam volume fraction in the nearest gap between the heated rods increases with all three variants of the CFD setup, while it is most pronounced with the SST with inclusion of non-drag forces in the interfacial momentum transfer between phases. With SST-NDF the core of the subchannel geometry appears almost free from steam due to the acting lift force. With EARSM turbulence modelling the steam volume fraction on the heater surface appears to be much higher
The 14th International Topical Meeting on Nuclear Reactor Thermal Hydraulics (NURETH-14) Log Number: 085 Hilton Toronto Hotel, Toronto, Ontario, Canada, September 25-29, 2011.
(22/25)
SST_TD SST_NDF EARSM_NDF Mesh 1:
Mesh 2:
Experiment:
Figure 8: Comparison of cross-sectional steam volume fraction distribution for PSBT test
1.2237 at elevation of LM=1.4m.
SST_TD SST_NDF EARSM_NDF Mesh 1:
Mesh 2:
Experiment:
Figure 9: Comparison of cross-sectional steam volume fraction distribution for PSBT test
1.4326 at elevation of LM=1.4m.
The 14th International Topical Meeting on Nuclear Reactor Thermal Hydraulics (NURETH-14) Log Number: 085 Hilton Toronto Hotel, Toronto, Ontario, Canada, September 25-29, 2011.
(23/25)
and the secondary fluid flow in the cross section leads again to a stronger mixing of the produced steam towards the centre of the subchannel. The higher steam volume fractions in the nearest gap of the subchannel seems to be confirmed by the experimental flow pattern, but unfortunately no further judgement about the accuracy of either one or the other CFD setup can be made on basis of this computer tomography patterns.
This seems to substantially different for PSBT case 1.4326 (Figure 9). In this case it can be observed, that for such large amount of steam volume fraction rV|mean=0.61 the flow pattern in the S1 subchannel qualitatively changes to a core maximum in the steam volume fraction, which could not be predicted by either of the three CFD setup variations. The reason for this behaviour is in the occurrence of strong coalescence of steam bubbles, slug formation and subsequent change in the flow morphology and flow regime, which cannot be predicted by the applied CFD modelling. A change in the CFD modelling towards the use of a population balance model with strong coalescence terms would be required in this, where the reversing direction of the lift forces for rather large bubble/slug sizes would lead to an accumulation of the steam volume fraction in the subchannel core. But the ground for the application of such a model would be rather week and close to tuning results towards experiments because of the lack of any information about flow morphologies/flow regimes in PSBT tests and the not yet sufficient predictivity of multiphase flow CFD models with regard to flow morphology transition.
Finally it can be summarized, that the computer tomography data for steam volume fraction distribution in the horizontal cross section of the S1 subchannel geometry are unfortunately not sufficient in order to decide about the appropriate CFD modelling for the given application over the wide range of test condition parameters. Experiments with a much higher spatial and steam volume fraction resolution would be required in order to allow for such a judgment. Furthermore computer tomography measurements for different elevations along the subchannel axis are required in order to get more insight in the axial flow development from onset of nucleate boiling to fully developed boiling flow regimes. Despite the observable discrepancies in the cross-sectional steam volume fraction distributions the agreement between predicted cross-sectional averaged steam volume fraction and experimental data is nevertheless remarkably good and in a similar order to results obtained by system or subchannel codes, but with the additional advantage to provide more insight in the interacting mechanisms of momentum transport, turbulence and wall boiling. Much more detailed research will be required in order to make CFD more predictive and reliable in the forecast and accurate prediction of changing multiphase flow regimes and flow morphologies from single-phase fluid flow up to almost full evaporation of the coolant fluid.
6. Conclusions
The presented CFD investigations using ANSYS CFX 13.0 was aimed on the prediction of nucleate subcooled boiling flow of water and steam under pressurized (PWR) conditions through the S1 subchannel geometry as defined in the OECD/NRC PSBT benchmark, Phase I, Exercise 1. The investigations had been carried out for 10 different test conditions (with respect to pressure, inlet fluid temperature, power and mass flow rate) from the PSBT test matrix. Emphasis had been given to a CFD best practice guidelines oriented approach to the simulation of the subcooled nucleate boiling flow through the subchannel configuration of the test section. By comparing CFD results to the benchmark data reasonably good agreement with experimental data could be observed for the cross-sectional averaged steam volume fraction and thermal
The 14th International Topical Meeting on Nuclear Reactor Thermal Hydraulics (NURETH-14) Log Number: 085 Hilton Toronto Hotel, Toronto, Ontario, Canada, September 25-29, 2011.
(24/25)
equilibrium quality. Depending on the applied CFD submodels the results differ from the measured data by ±8% with respect to cross-sectional averaged void fraction at the measurement plane, where the averaged void fraction varied between 0.038 and 0.62 for the test conditions under investigation. Unfortunately the resolution and accuracy of the provided computer tomography data for the cross-sectional steam volume fraction distributions were found to be too poor in order to make a serious comparison with the CFD simulations and in order to derive any conclusion for improvement of the multiphase flow turbulence modeling or the applied submodels for wall boiling, interfacial mass, momentum and heat transfer. Much more detailed experimental investigations, especially with respect to micro-phenomena in the boiling process and axial development of the multiphase flow morphology/flow regime transition, seem to be necessary in order to improve the underlying physical models for the CFD simulation of multiphase flows of the given complexity.
7. Acknowledgements
This research has been supported by the German Ministry of Education and Research (BMBF, Grant No. 02NUK010G) in the framework of the R&D funding concept of BMBF "Basic Research Energy 2020+", the German CFD Network on Nuclear Reactor Safety Research and the Alliance for Competence in Nuclear Technology, Germany.
8. References
[1] A. Rubin et al., "OECD/NRC Benchmark Based on NUPEC PWR Subchannel and Bundle Tests (PSBT), Volume I: Experimental Database and Final Problem Specifications," US NRC / OECD Nuclear Energy Agency, pp.122, November 2010.
[2] A. Rubin and A. Avramova, "Summary Record of the OECD/NRC Benchmark based on NUPEC PWR Sub-channel and Bundle Tests (PSBT), First Workshop (PSBT-1), Pisa, Italy, April 12-13, 2010," Nuclear Science Committee and Committee on the Safety of Nuclear Installations, NEA/NSC/DOC (2010), pp. 16, June 2010.
[3] ANSYS, ANSYS CFX 13.0 Theory users manual. Canonsburg, USA: Ansys Inc., 2010.
[4] Th. Frank, P. J. Zwart, E. Krepper, H.-M. Prasser, and D. Lucas, "Validation of CFD models for mono- and polydisperse air-water two-phase flows in pipes," J. Nuclear Engineering & Design (NED), vol. 238, pp. 647-659, March 2008.
[5] E. Krepper, D. Lucas, Th. Frank, H.-M. Prasser, and P. J. Zwart, "The inhomogeneous MUSIG model for the simulation of polydispersed flows," Nuclear Engineering and Design (NED), vol. 238, pp. 1690-1702, 2008.
[6] C. Lifante, T. Frank, A.D. Burns, D. Lucas, and E. Krepper, "Prediction of Polydisperse Steam Bubble Condensation in Sub-Cooled Water using the Inhomogeneous MUSIG Model. ," Proceeedings of the 7th International Conference on Multiphase Flow, Tampa, FL, 2010.
[7] N. Kurul and M.Z. Podowski, "On the modeling of multidimensional effects in boiling channels," Proceeedings of the 27th National Heat Transfer Conference, Minneapolis, July 1991.
[8] H. Anglart, O. Nylund, N. Kurul, and M. Z. Podowski, "CFD prediction of flow and
The 14th International Topical Meeting on Nuclear Reactor Thermal Hydraulics (NURETH-14) Log Number: 085 Hilton Toronto Hotel, Toronto, Ontario, Canada, September 25-29, 2011.
(25/25)
phase distribution in fuel assemblies with spacers," Proceeedings of the NURETH-7, Saratoga Springs, New York, 1995, Published in: Nuclear Eng. & Design (NED), Vol. 177 (1997), pp. 215-228.
[9] Y. Egorov and F. Menter, "Experimental Implementation of the RPI Wall Boiling Model in CFX-5.6," ANSYS Germany GmbH, Otterfing, Germany, Technical Report ANSYS/TR-04-10 2004.
[10] E. Krepper, B. Koncar, and Y. Egorov, "CFD modeling of subcooled boiling - Concept, validation and application to fuel assembly design," Nuclear Engineering and Design (NED), vol. 237, pp. 716-731, 2007.
[11] V. I. Tolubinski and D.M. Kostanchuk, "Vapour bubbles growth rate and heat transfer intensity at subcooled water boiling," Proceeedings of the 4th International Heat Transfer Conference, Paris, 1970.
[12] G. G. Bartolomej and V. M. Chanturiya, "Experimental study of true void fraction when boiling subcooled water in vertical tubes," Thermal Engineering, vol. 14, pp. 123-128, 1967, (translated from Teploenergetika, no. 2, Vol. 14 (1967), pp. 80-83).
[13] G. G. Bartolomej and et al., "An experimental investigation of true volumetric vapour content with subcooled boiling in tubes," Thermal Engineering, vol. 29, pp. 132-135, 1982, (translated from Teploenergetika, no. 3, vol. 29, 1982, pp.20-23).
[14] Th. Frank, P. Beckstein, C. Lifante, and A. D. Burns, "Prediction of Subcooled Wall Boiling in a Heated Annulus Including Conjugate Heat Transfer in the Central Heated Rod," Proceeedings of the 7th International Conference on Multiphase Flow, ICMF 2010, May 30-June 4, 2010, Tampa, FL USA, 2010, pp. 1-14.
[15] T.-H. Lee, B.-J. Yun, G.-C. Park, T. Hibiki, and S.-O. Kim, "Local flow structure of subcooled boiling flow of water in a heated annulus," Proceeedings of the 16th International Conference on Nuclear Engineering (ICONE-16), May 11-15, 2008, Orlando, Florida, USA, 2008, p. 12, Paper No. ICONE16-48170.
[16] T.-H. Lee, G. C. Park, and D. J. Lee, "Local flow characteristics of subcooled boiling flow in a vertical concentric annulus," International J. Multiphase Flows, vol. 28, pp. 1351-1386, 2002.
[17] T.-H. Lee et al., "Axial developments of interfacial area and void concentration profiles in subcooled boiling flow of water," Int. J. Heat and Mass Transfer, vol. 52, pp. 473-487, 2009.
[18] C. Lifante, F. Reiterer, Th. Frank, and A. D. Burns, "Coupling of Wall Boiling with Discrete Population Balance Model," Proceeedings of the The 14th International Topical Meeting on Nuclear Reactor Thermal Hydraulics (NURETH-14), September 25-29, 2011, Hilton Toronto Hotel, Toronto, Ontario, Canada, 2011, p. 14.
[19] R.P. Roy, S. Kang, J.A. Zarate, and A. Laporta, "Turbulent subcooled boiling flow -Experiments and simulations," Journal of Heat Transfer, vol. 124, no. February 2002, pp. 73-93, 2002.
[20] F.R. Menter, "Two-equation eddy-viscosity turbulence models for engineering applications," AIAA Journal, vol. 32, no. 8, pp. 1598 - 1605, 1994.