nureth-15 – 544 - kit · the proposal was approved by the oecd/nea committee on the safety of...
TRANSCRIPT
NURETH-15 – 544
Progress on Severe Accident Code Benchmarking in the Current
OECD TMI-2 Exercise
G. Bandini (ENEA), S. Weber, H. Austregesilo (GRS), P. Drai (IRSN), M. Buck (IKE), M. Barnak, P. Matejovic (IVS), H. Muscher, F. Kretzschmar (KIT), L. Sallus, J. Bulle (Tractebel Engineering), M. Hoffmann (RUB), H. G. Lele, B. Chatterjee (BARC), K. Dolganov, A. Kapustin, D. Tomashchik (IBRAE RAS), P. Groudev, A. Stefanova, R. Gencheva (INRNE), A. Amri (OECD-NEA) 15th International Topical Meeting on Nuclear Reactor Thermalhydraulics, NURETH-15 Pisa, Italy, May 12-17, 2013
2
Outline
Introduction
Objectives
Participants and Codes
SBLOCA Transient Result Comparison
Results from Reflooding Sequences
Conclusions
NURETH-15, Pisa, Italy, May 12-17, 2013

3
Introduction
Based on the conclusions of a previous benchmark exercise on an alternative TMI-2 scenario (ATMI), the Working Group on the Analysis and Management of Accidents (WGAMA) of OECD/NEA felt it worthwhile to extend the accident analysis scope by examining the capability of the codes to predict core melt progression and the effects of severe accident management (SAM) actions under a variety of severe accident situations in order to challenge them to the full extent of their capabilities, recognizing, however, that they are less reliable in predicting late phase core melt progression
As the activity of the SARNET-2 (WP5) project of EU FP7 was focused on late phase phenomena and debris coolability, WGAMA and SARNET-2 WP5 jointly proposed a benchmark as a follow-up to the ATMI benchmark exercise and which includes late phase core degradation, during different severe accident sequences, and core reflooding scenarios
The proposal was approved by the OECD/NEA Committee on the Safety of Nuclear Installations (CSNI) in December 2010
NURETH-15, Pisa, Italy, May 12-17, 2013
4
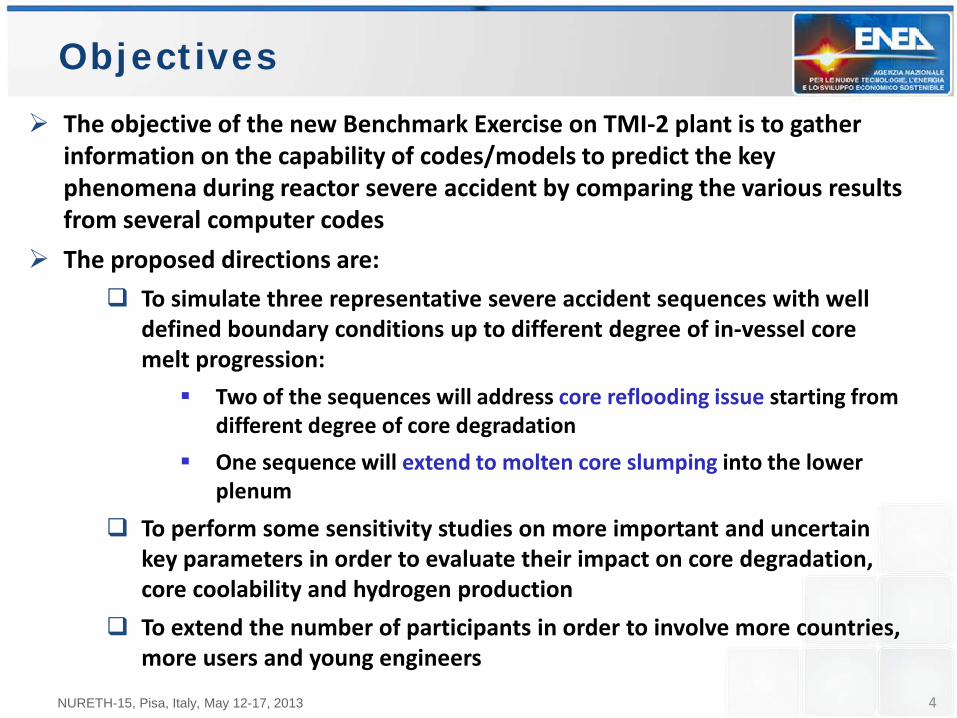
Objectives The objective of the new Benchmark Exercise on TMI-2 plant is to gather
information on the capability of codes/models to predict the key phenomena during reactor severe accident by comparing the various results from several computer codes
The proposed directions are: To simulate three representative severe accident sequences with well
defined boundary conditions up to different degree of in-vessel core melt progression: Two of the sequences will address core reflooding issue starting from
different degree of core degradation One sequence will extend to molten core slumping into the lower
plenum
To perform some sensitivity studies on more important and uncertain key parameters in order to evaluate their impact on core degradation, core coolability and hydrogen production
To extend the number of participants in order to involve more countries, more users and young engineers
NURETH-15, Pisa, Italy, May 12-17, 2013
5
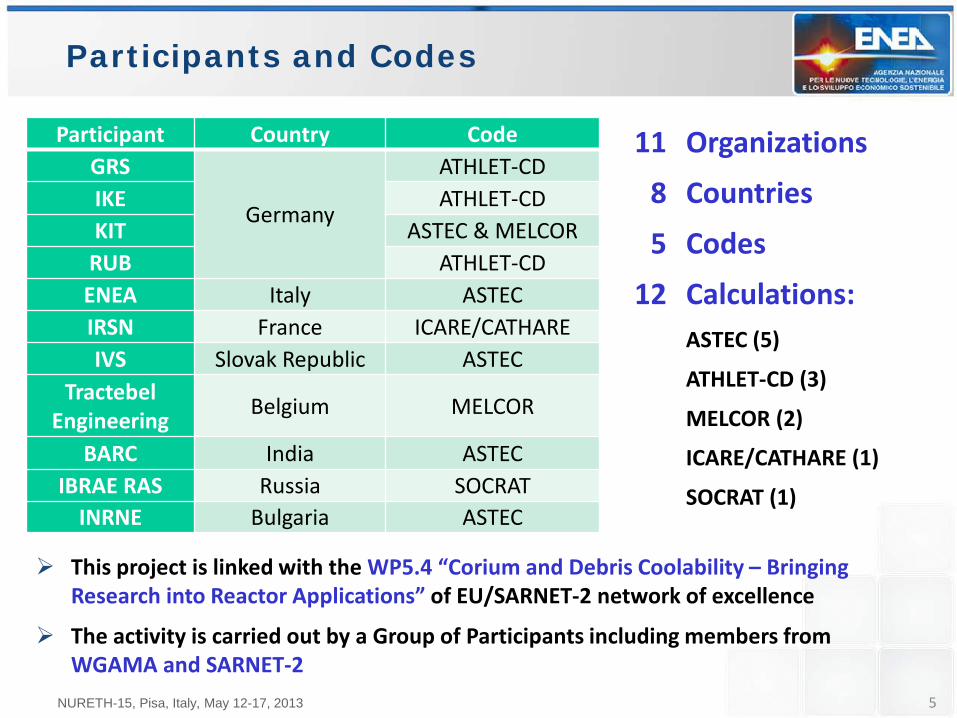
Participants and Codes
11 Organizations
8 Countries
5 Codes
12 Calculations: ASTEC (5)
ATHLET-CD (3)
MELCOR (2)
ICARE/CATHARE (1)
SOCRAT (1)
Participant Country Code GRS
Germany
ATHLET-CD IKE ATHLET-CD KIT ASTEC & MELCOR
RUB ATHLET-CD ENEA Italy ASTEC IRSN France ICARE/CATHARE IVS Slovak Republic ASTEC
Tractebel Engineering Belgium MELCOR
BARC India ASTEC IBRAE RAS Russia SOCRAT
INRNE Bulgaria ASTEC
This project is linked with the WP5.4 “Corium and Debris Coolability – Bringing Research into Reactor Applications” of EU/SARNET-2 network of excellence
The activity is carried out by a Group of Participants including members from WGAMA and SARNET-2
NURETH-15, Pisa, Italy, May 12-17, 2013
6
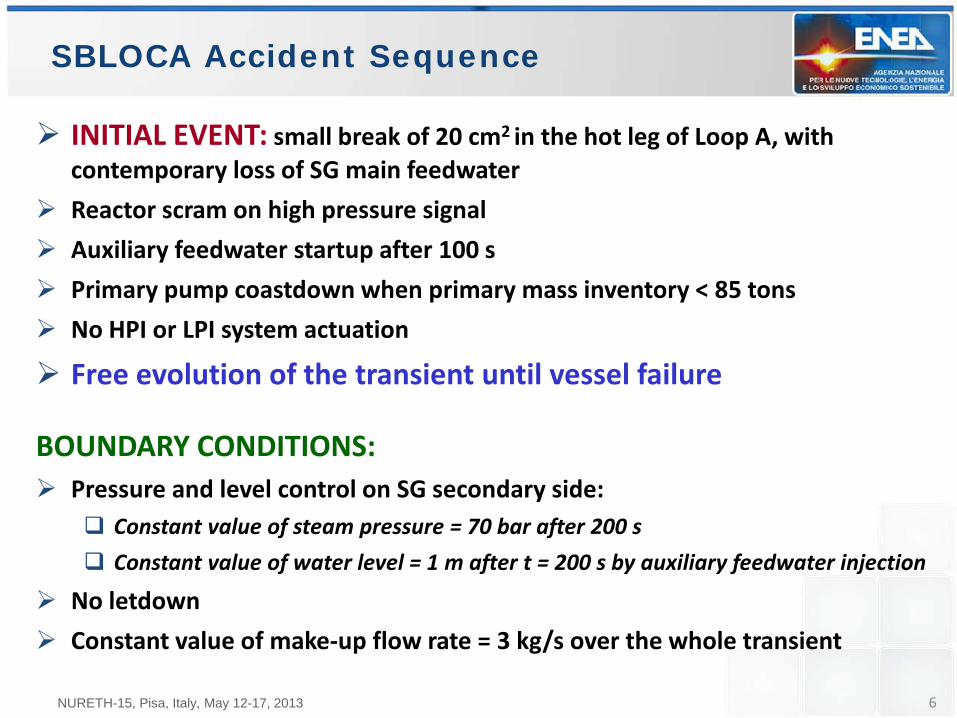
SBLOCA Accident Sequence
INITIAL EVENT: small break of 20 cm2 in the hot leg of Loop A, with contemporary loss of SG main feedwater
Reactor scram on high pressure signal Auxiliary feedwater startup after 100 s Primary pump coastdown when primary mass inventory < 85 tons No HPI or LPI system actuation
Free evolution of the transient until vessel failure
BOUNDARY CONDITIONS: Pressure and level control on SG secondary side:
Constant value of steam pressure = 70 bar after 200 s Constant value of water level = 1 m after t = 200 s by auxiliary feedwater injection
No letdown Constant value of make-up flow rate = 3 kg/s over the whole transient
NURETH-15, Pisa, Italy, May 12-17, 2013
7
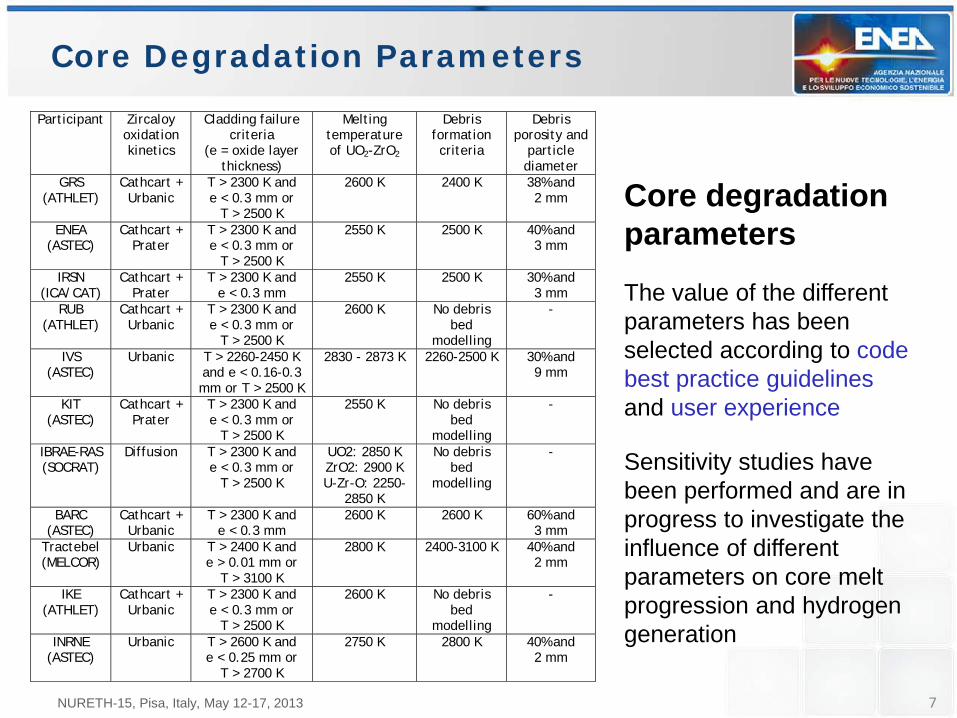
Core Degradation Parameters
Core degradation parameters The value of the different parameters has been selected according to code best practice guidelines and user experience Sensitivity studies have been performed and are in progress to investigate the influence of different parameters on core melt progression and hydrogen generation
Participant Zircaloy oxidation kinetics
Cladding failure criteria
(e = oxide layer thickness)
Melting temperature of UO2-ZrO2
Debris formation criteria
Debris porosity and
particle diameter
GRS (ATHLET)
Cathcart + Urbanic
T > 2300 K and e < 0.3 mm or
T > 2500 K
2600 K 2400 K 38% and 2 mm
ENEA (ASTEC)
Cathcart + Prater
T > 2300 K and e < 0.3 mm or
T > 2500 K
2550 K 2500 K 40% and 3 mm
IRSN (ICA/CAT)
Cathcart + Prater
T > 2300 K and e < 0.3 mm
2550 K 2500 K 30% and 3 mm
RUB (ATHLET)
Cathcart + Urbanic
T > 2300 K and e < 0.3 mm or
T > 2500 K
2600 K No debris bed
modelling
-
IVS (ASTEC)
Urbanic T > 2260-2450 K and e < 0.16-0.3 mm or T > 2500 K
2830 - 2873 K 2260-2500 K 30% and 9 mm
KIT (ASTEC)
Cathcart + Prater
T > 2300 K and e < 0.3 mm or
T > 2500 K
2550 K No debris bed
modelling
-
IBRAE-RAS (SOCRAT)
Diffusion T > 2300 K and e < 0.3 mm or
T > 2500 K
UO2: 2850 K ZrO2: 2900 K U-Zr-O: 2250-
2850 K
No debris bed
modelling
-
BARC (ASTEC)
Cathcart + Urbanic
T > 2300 K and e < 0.3 mm
2600 K 2600 K 60% and 3 mm
Tractebel (MELCOR)
Urbanic T > 2400 K and e > 0.01 mm or
T > 3100 K
2800 K 2400-3100 K 40% and 2 mm
IKE (ATHLET)
Cathcart + Urbanic
T > 2300 K and e < 0.3 mm or
T > 2500 K
2600 K No debris bed
modelling
-
INRNE (ASTEC)
Urbanic T > 2600 K and e < 0.25 mm or
T > 2700 K
2750 K 2800 K 40% and 2 mm
NURETH-15, Pisa, Italy, May 12-17, 2013
8
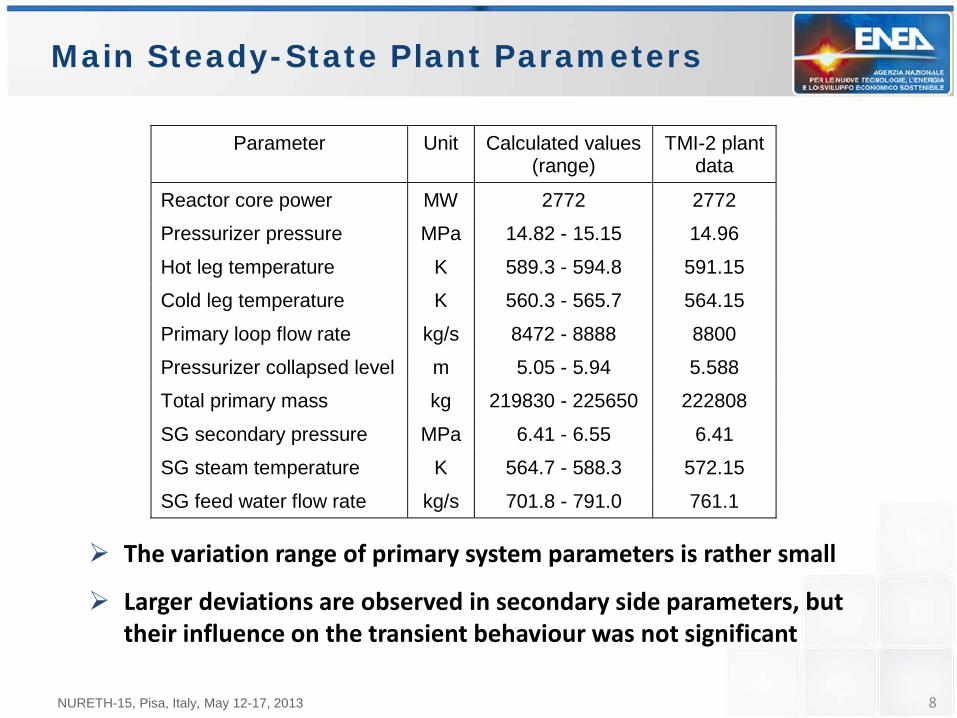
Parameter Unit Calculated values (range)
TMI-2 plant data
Reactor core power MW 2772 2772
Pressurizer pressure MPa 14.82 - 15.15 14.96
Hot leg temperature K 589.3 - 594.8 591.15
Cold leg temperature K 560.3 - 565.7 564.15
Primary loop flow rate kg/s 8472 - 8888 8800
Pressurizer collapsed level m 5.05 - 5.94 5.588
Total primary mass kg 219830 - 225650 222808
SG secondary pressure MPa 6.41 - 6.55 6.41
SG steam temperature K 564.7 - 588.3 572.15
SG feed water flow rate kg/s 701.8 - 791.0 761.1
Main Steady-State Plant Parameters
The variation range of primary system parameters is rather small
Larger deviations are observed in secondary side parameters, but their influence on the transient behaviour was not significant
NURETH-15, Pisa, Italy, May 12-17, 2013

9
Chronology of main events
Parameter Unit Calculated time values
(range)
Break opening and loss of SG feed water s 0
Stop of primary pumps s 2089 - 2320
First fuel rod clad perforation/burst s 3642 - 4488
First clad melting and dislocation s 3806 - 4921
First ceramic melting and dislocation s 4246 - 5203
First molten material slumping in lower plenum (core slumping not modelled by RUB and IKE)
s 4240 - 7633
Vessel failure (not predicted in IRSN, IVS and IBRAE RAS calculations)
s 8560 - 15980
The spreading in vessel failure timing is influenced by the vessel failure mode (creep, wall melting, penetration failure) and the assumption taken on molten jet break-up during slumping with formation of more or less coolable debris bed into the lower head of the vessel
NURETH-15, Pisa, Italy, May 12-17, 2013
10
Code-to-code Result Comparison (1/4)
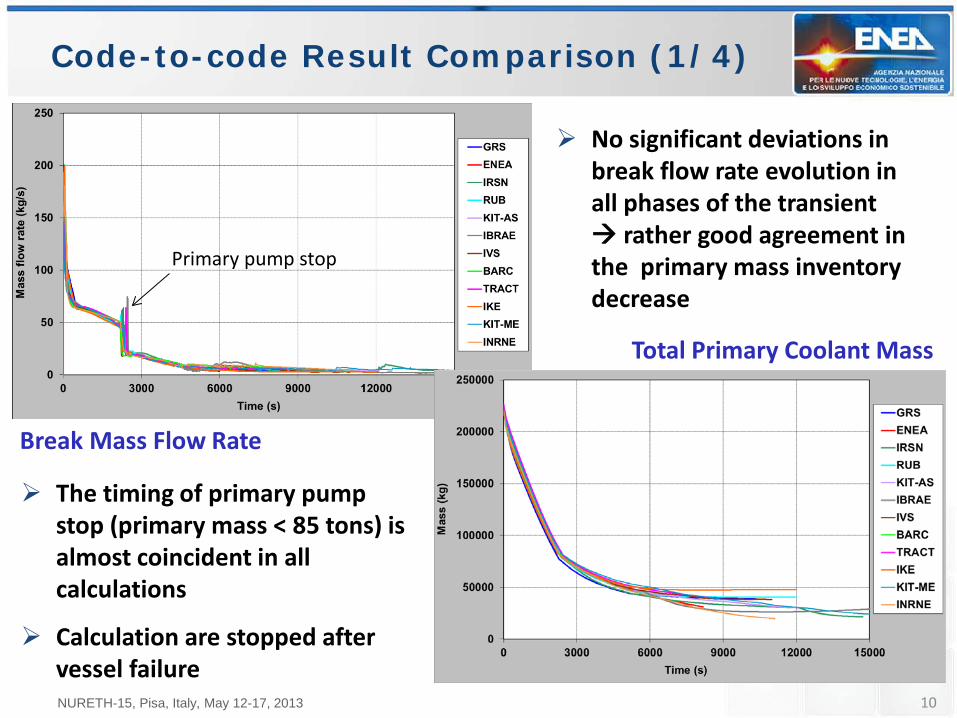
Break Mass Flow Rate
Total Primary Coolant Mass
No significant deviations in break flow rate evolution in all phases of the transient rather good agreement in the primary mass inventory decrease
The timing of primary pump stop (primary mass < 85 tons) is almost coincident in all calculations
Calculation are stopped after vessel failure
Primary pump stop
NURETH-15, Pisa, Italy, May 12-17, 2013
11
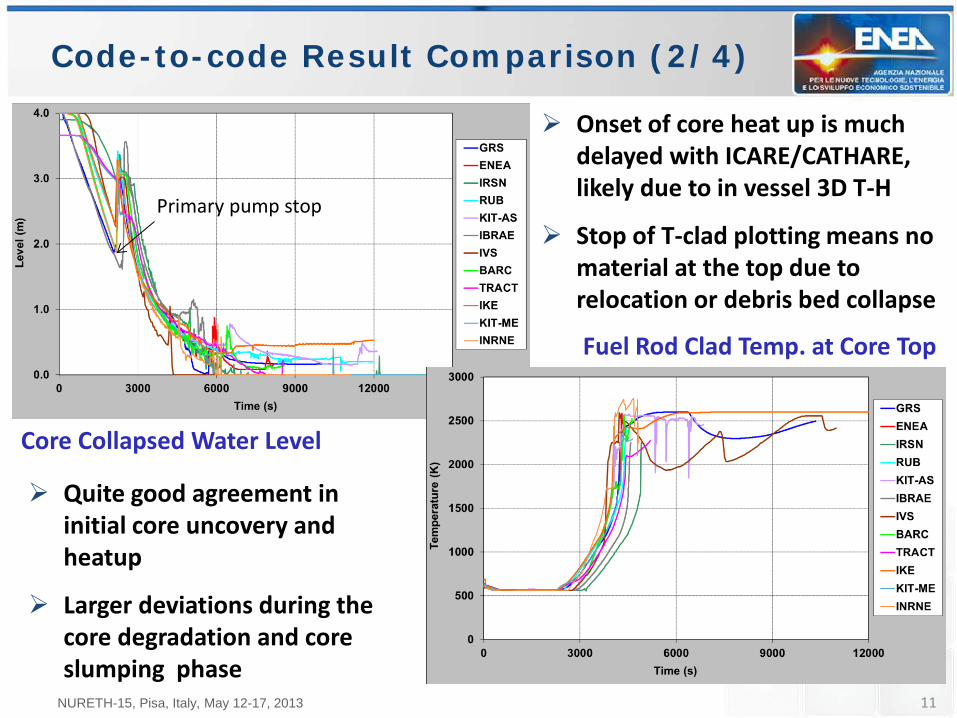
Code-to-code Result Comparison (2/4)
Core Collapsed Water Level
Fuel Rod Clad Temp. at Core Top
Onset of core heat up is much delayed with ICARE/CATHARE, likely due to in vessel 3D T-H
Stop of T-clad plotting means no material at the top due to relocation or debris bed collapse
Quite good agreement in initial core uncovery and heatup
Larger deviations during the core degradation and core slumping phase
NURETH-15, Pisa, Italy, May 12-17, 2013
Primary pump stop
12
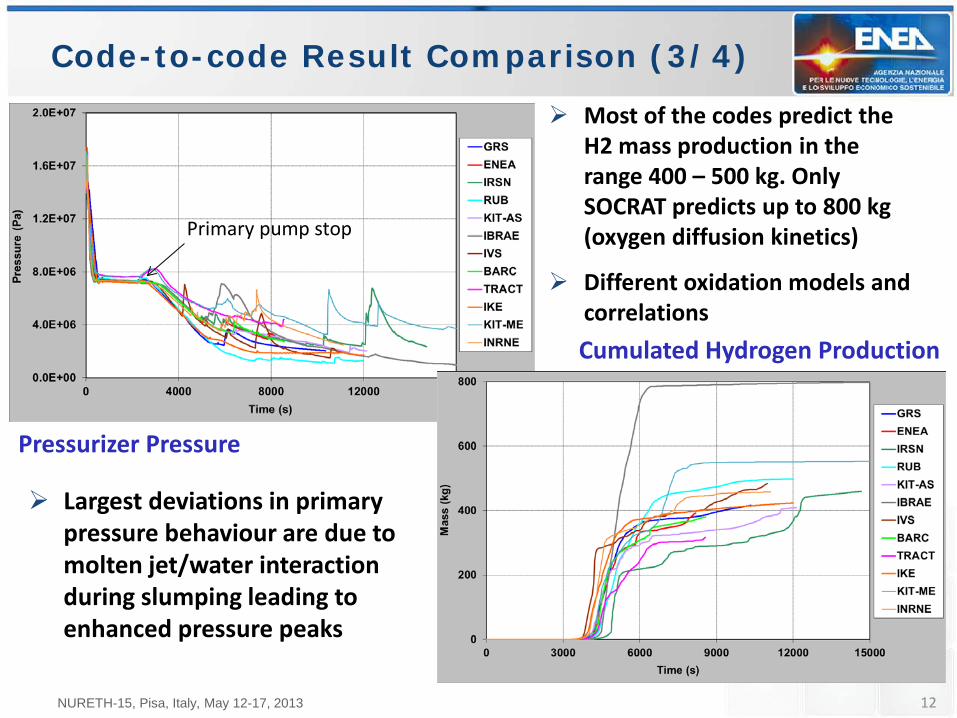
Code-to-code Result Comparison (3/4)
Pressurizer Pressure
Cumulated Hydrogen Production
Largest deviations in primary pressure behaviour are due to molten jet/water interaction during slumping leading to enhanced pressure peaks
Most of the codes predict the H2 mass production in the range 400 – 500 kg. Only SOCRAT predicts up to 800 kg (oxygen diffusion kinetics)
Different oxidation models and correlations
NURETH-15, Pisa, Italy, May 12-17, 2013
Primary pump stop
13
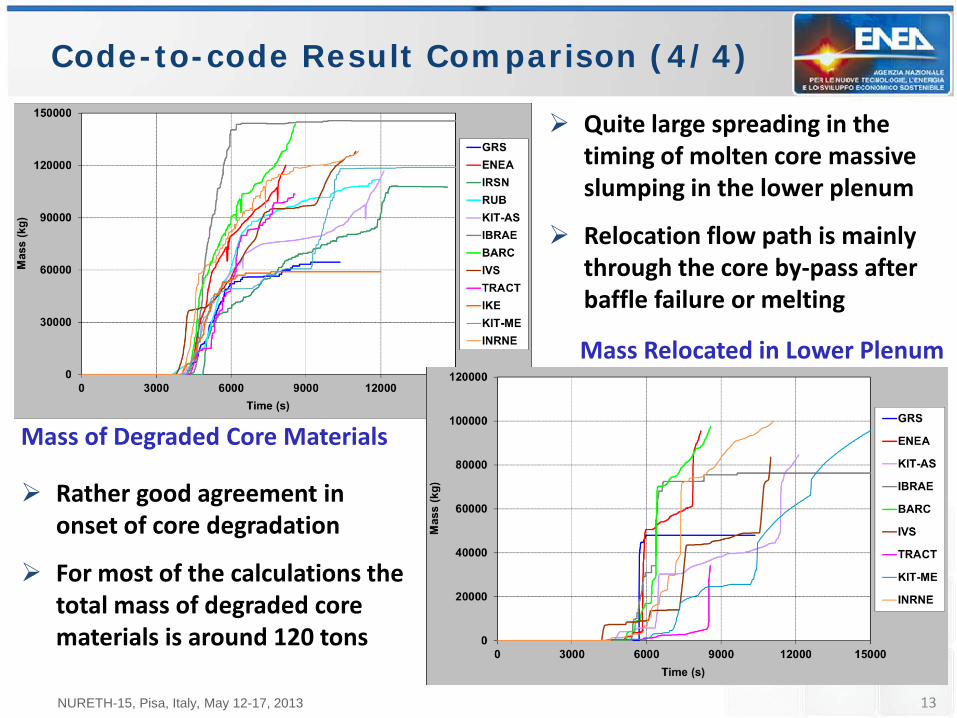
Code-to-code Result Comparison (4/4)
Mass of Degraded Core Materials
Mass Relocated in Lower Plenum
Rather good agreement in onset of core degradation
For most of the calculations the total mass of degraded core materials is around 120 tons
Quite large spreading in the timing of molten core massive slumping in the lower plenum
Relocation flow path is mainly through the core by-pass after baffle failure or melting
NURETH-15, Pisa, Italy, May 12-17, 2013

14
Reflooding Scenarios (SBLOCA sequence)
For the SBLOCA scenario two reflooding sequences have been investigated starting from different core degradation conditions Onset of HPI injection when:
1st sequence: total mass of degraded core materials = 10 tons
2nd sequence: total mass of degraded core materials = 45 tons
Total water injection rate (HPI + make-up) = 28 kg/s (0.8 g/s per rod)
From experimental evidence (QUENCH tests) the rate of 1 g/s per rod might be enough to cool-down the core and stop the melt progression
Conditions at the limit of degraded core coolability are investigated since they seem the most challenging for the severe accident codes
The calculations were stopped after the attainment of stable conditions or eventual vessel failure
NURETH-15, Pisa, Italy, May 12-17, 2013
15
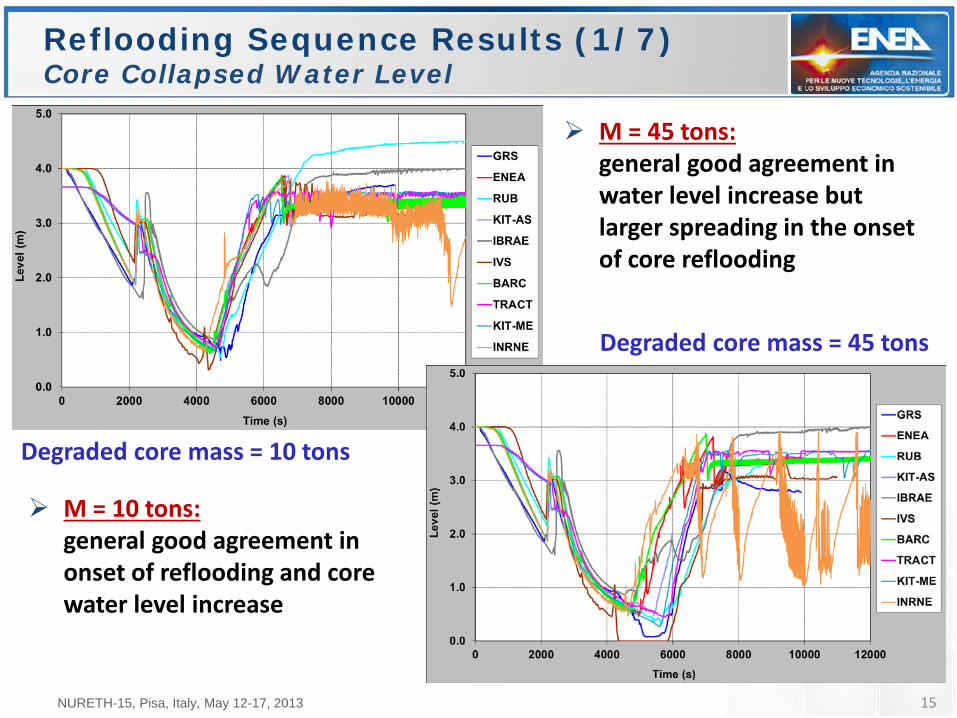
Reflooding Sequence Results (1/7) Core Collapsed Water Level
Degraded core mass = 45 tons
Degraded core mass = 10 tons
M = 10 tons: general good agreement in onset of reflooding and core water level increase
M = 45 tons: general good agreement in water level increase but larger spreading in the onset of core reflooding
NURETH-15, Pisa, Italy, May 12-17, 2013
16
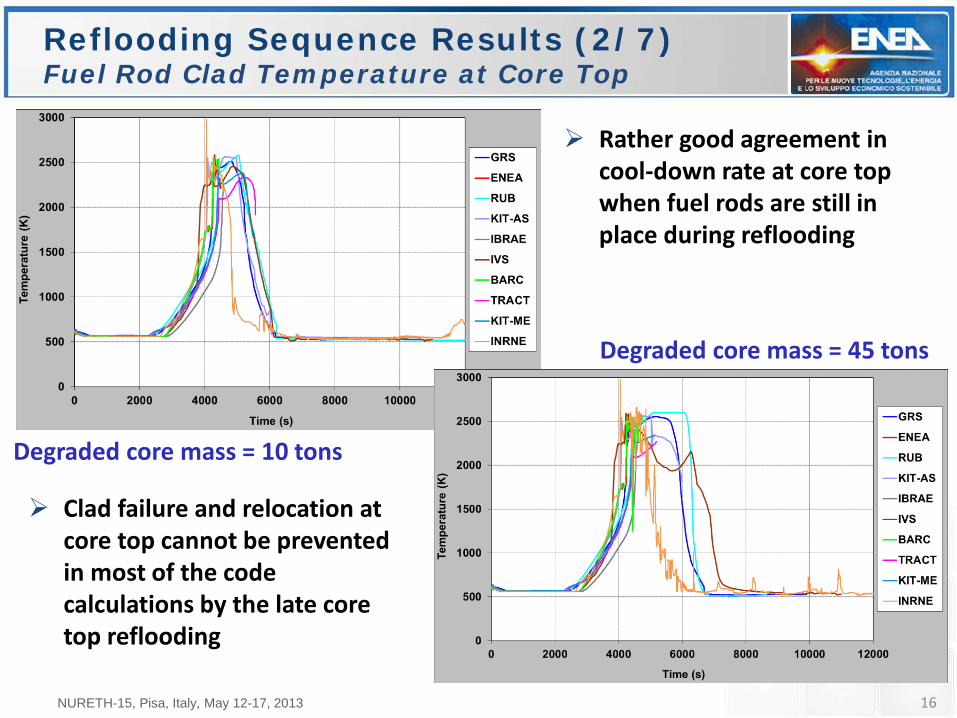
Reflooding Sequence Results (2/7) Fuel Rod Clad Temperature at Core Top
Degraded core mass = 45 tons
Degraded core mass = 10 tons
Clad failure and relocation at core top cannot be prevented in most of the code calculations by the late core top reflooding
Rather good agreement in cool-down rate at core top when fuel rods are still in place during reflooding
NURETH-15, Pisa, Italy, May 12-17, 2013
17
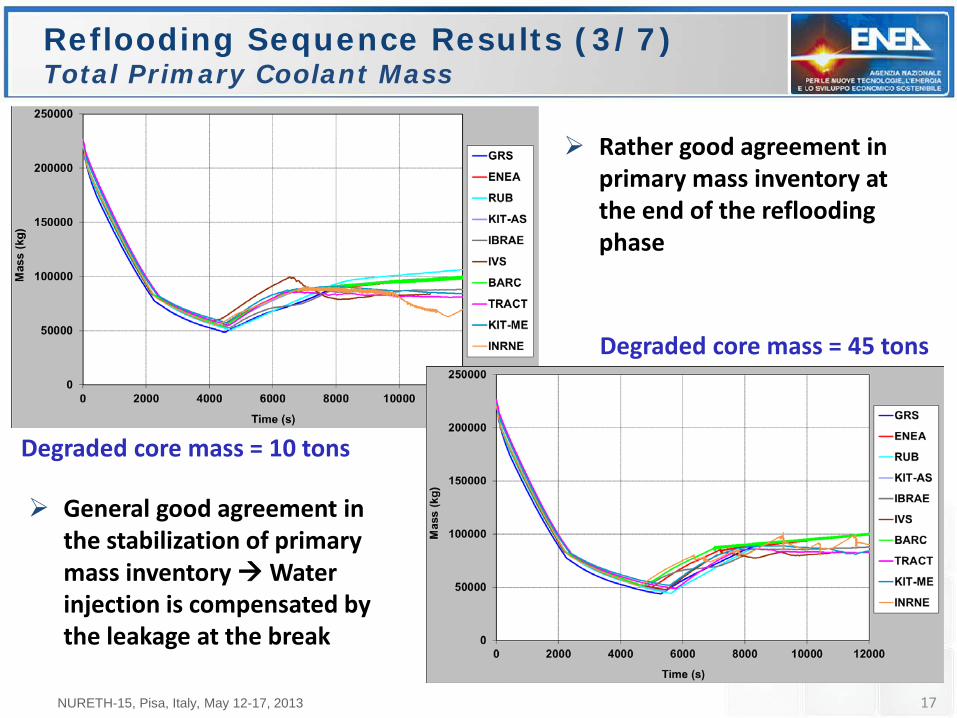
Reflooding Sequence Results (3/7) Total Primary Coolant Mass
Degraded core mass = 45 tons
Degraded core mass = 10 tons
General good agreement in the stabilization of primary mass inventory Water injection is compensated by the leakage at the break
Rather good agreement in primary mass inventory at the end of the reflooding phase
NURETH-15, Pisa, Italy, May 12-17, 2013
18
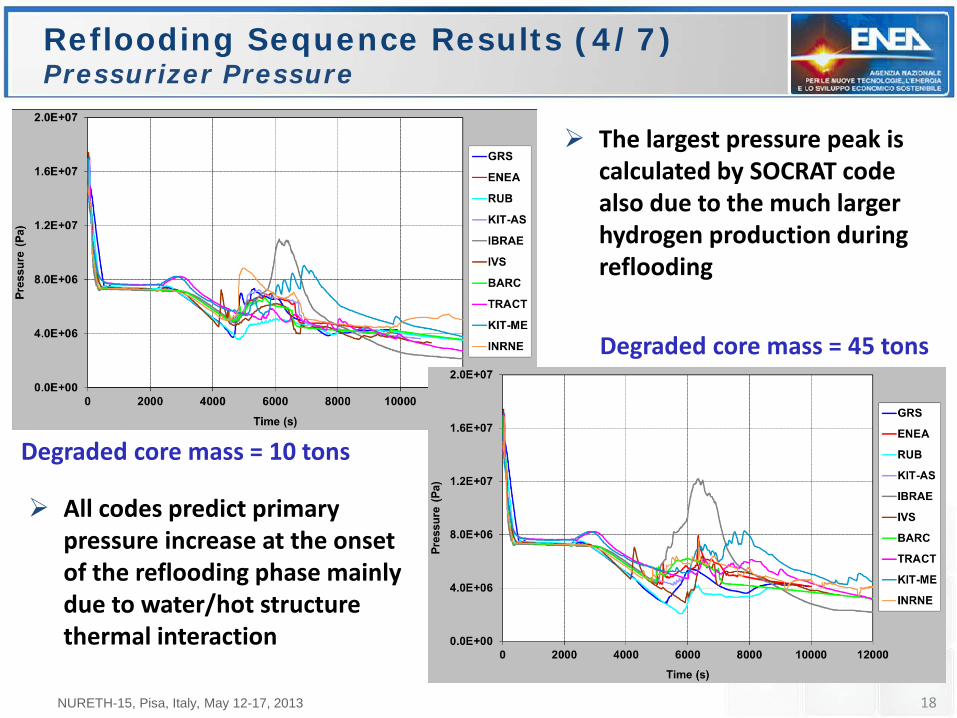
Reflooding Sequence Results (4/7) Pressurizer Pressure
Degraded core mass = 45 tons
Degraded core mass = 10 tons
All codes predict primary pressure increase at the onset of the reflooding phase mainly due to water/hot structure thermal interaction
The largest pressure peak is calculated by SOCRAT code also due to the much larger hydrogen production during reflooding
NURETH-15, Pisa, Italy, May 12-17, 2013
19
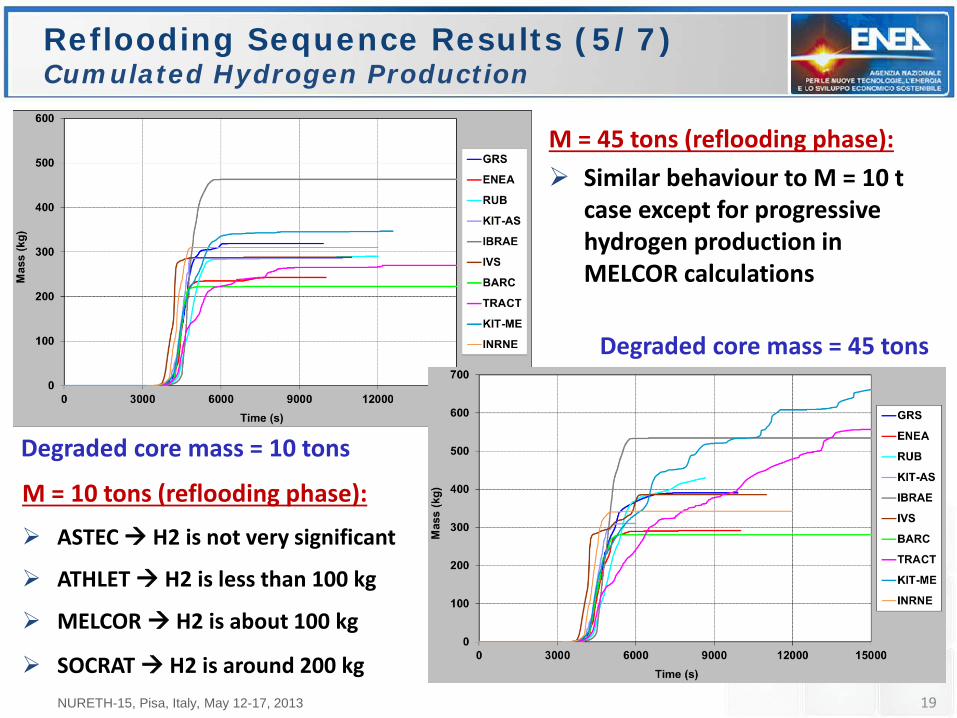
Reflooding Sequence Results (5/7) Cumulated Hydrogen Production
Degraded core mass = 45 tons
Degraded core mass = 10 tons
M = 10 tons (reflooding phase):
ASTEC H2 is not very significant
ATHLET H2 is less than 100 kg
MELCOR H2 is about 100 kg
SOCRAT H2 is around 200 kg
M = 45 tons (reflooding phase): Similar behaviour to M = 10 t
case except for progressive hydrogen production in MELCOR calculations
NURETH-15, Pisa, Italy, May 12-17, 2013

20
Reflooding Sequence Results (6/7) Total Mass of Degraded Core Materials
Degraded core mass = 45 tons
Degraded core mass = 10 tons
After onset of reflooding phase:
ASTEC and ATHLET early stop of core melt progression
MELCOR latest stop of core melt progression
Large discrepancies in code results at the end of the reflooding phase
NURETH-15, Pisa, Italy, May 12-17, 2013
21
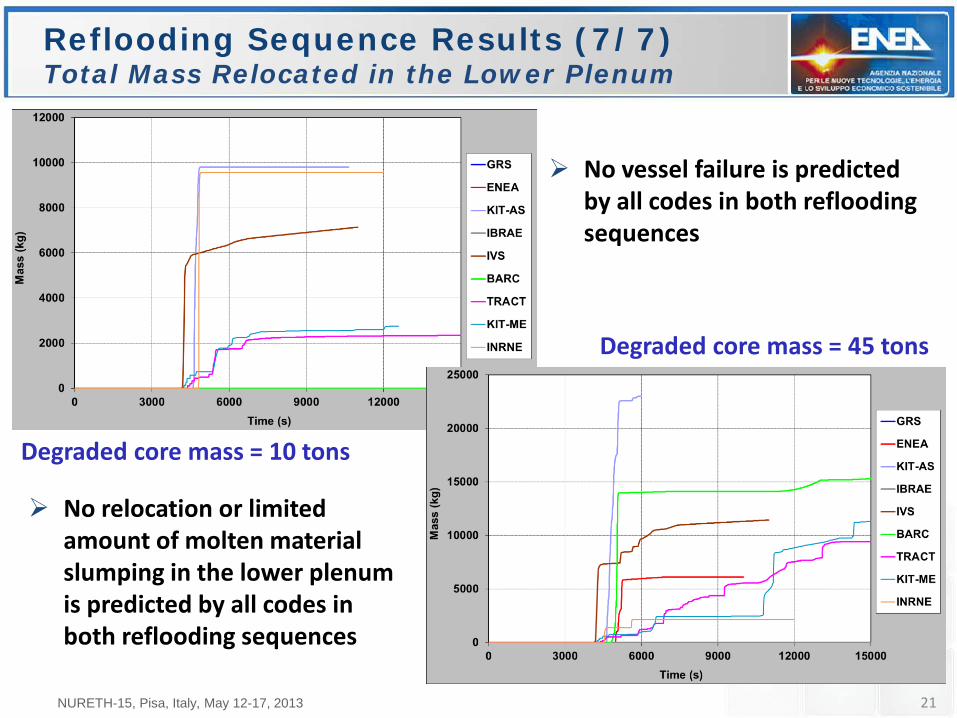
Reflooding Sequence Results (7/7) Total Mass Relocated in the Lower Plenum
Degraded core mass = 45 tons
Degraded core mass = 10 tons
No vessel failure is predicted by all codes in both reflooding sequences
No relocation or limited amount of molten material slumping in the lower plenum is predicted by all codes in both reflooding sequences
NURETH-15, Pisa, Italy, May 12-17, 2013
22
SBO Sequence Calculation
The 2nd sequence that was selected for code-to-code result comparison is a Station Blackout (SBO) scenario + surge line break
INITIATING EVENT: Loss of offsite power supply + surge line break At time = 0 s Reactor scram, primary pump trip, turbine and FW trip BOUNDARY CONDITIONS:
No letdown, no make-up flow and no HPI on primary side No auxiliary feedwater on secondary side Evolution of containment pressure seen at the break by GRS with ATHLET code
Free evolution of the transient until vessel failure Investigation of core reflooding during low primary pressure scenario Two reflooding sequences have been defined like for the SBLOCA scenario
reflooding starting at M = 10 tons and M = 45 tons (M = degraded core mass) at different water injection rates (low and high injection rates)
NURETH-15, Pisa, Italy, May 12-17, 2013
23
Conclusions (1/2)
Within the current benchmark exercise on TMI-2 plant, SBLOCA and SBO sequences are calculated by several organizations using different mechanistic and integral codes
The performed calculations confirm the general robustness of the codes All the codes were able to calculate the accident sequence up to the more severe degradation state and under degraded core reflooding conditions
Thanks to the harmonisation of the initial steady-state and boundary conditions, the uncertainties on the prediction of the plant thermal-hydraulic behaviour have been minimized, at least before significant core degradation takes place
NURETH-15, Pisa, Italy, May 12-17, 2013
24
Conclusions (2/2)
The deviation in code results becomes more remarkable after important core melting and relocation, involving the loss of rod-like geometry, fuel rod collapse and debris bed and molten pool formation, mainly due to:
Different core degradation models used by the codes, particularly in the late degradation phase
Some differences in the plant and core discretization
Different value chosen for core degradation parameters in input to the code
The last two effects are strictly connected with the user effect, and might be enhanced by the degree of freedom left by the code developers in the selection of code input parameter values
The importance of precise code user guidelines is then strengthened, at least for reducing the differences between users of the same code
The uncertainties on the calculation of the reflooding scenarios are still rather large, especially in case of later core reflood
NURETH-15, Pisa, Italy, May 12-17, 2013