investigation of mobile phone sar reduction
TRANSCRIPT

Investigation of Mobile Phone SAR Reduction
Von der Fakultät für Ingenieurwissenschaften,
Abteilung Elektrotechnik und Informationstechnik
der Universität Duisburg-Essen
zur Erlangung des akademischen Grades
Doktor der Ingenieurwissenschaften (Dr.-Ing.)
genehmigte Dissertation
von
Manar Bakro
aus
Dair Atiyyah/Syrien
Gutachter: Prof. Dr.-Ing. Klaus Solbach
Gutachter: Prof. Dr.-Ing. Dirk Manteuffel
Tag der mündlichen Prüfung:
26.07.2016
i
Acknowledgements:
Firstly, I would like to express my gratefully and sincere gratitude to my advisor Prof.
Dr.-Ing. Klaus Solbach for the continuous support of my Ph.D study and related
research, for his patience, motivation, and immense knowledge. His guidance helped
me in all the time of research and writing of this thesis.
I would like to thank my parents for supporting me, and finally my wife Lina for her
support, encouragement, quiet patience and unwavering love were undeniably the
bedrock upon which the past six years of my life have been built.
ii
Table of Contents
Table of Contents ....................................................................................................... ii
Abstract: ..................................................................................................................... v
List of Abbreviations ................................................................................................ vi
Chapter 1 ........................................................................................................................ 1
1. Introduction and Overview ................................................................................ 1
Chapter 2 ........................................................................................................................ 4
2. Mobile Communication Systems ....................................................................... 4
Reflection coefficient: ................................................................................. 6
Bandwidth: ................................................................................................... 7
Efficiency ..................................................................................................... 8
Antenna efficiency measurement ................................................................ 9
User interaction .......................................................................................... 11
Absorption of radiation into the user .................................................. 11
SAR-Limits ........................................................................................ 14
Reduction of radiation efficiency ....................................................... 15
SAR Measurement Equipment (Near-Field Scanners) .............................. 15
3-D Scanning System: ........................................................................ 16
2-D Flat Scanner (iSAR): ................................................................... 18
Chapter 3 ...................................................................................................................... 20
3. Interaction between Handset Antenna and User .............................................. 20
Introduction................................................................................................ 20
Radiation regions of an antenna ................................................................ 21
Boundary conditions at the material interfaces ......................................... 22
Absorption mechanisms for mobile phones with integrated antennas: ..... 26
Biophysical mechanisms of interaction .............................................. 27
Dielectric properties of human body tissues ...................................... 28
SAR Generation ......................................................................................... 29
Antenna parameters in the vicinity of a user ............................................. 32

iii
Chapter 4 ...................................................................................................................... 34
4. EM Simulation Technology (Numerical Techniques) ..................................... 34
Chapter 5 ...................................................................................................................... 37
5. Analysis of near-field distribution ................................................................... 37
Introduction................................................................................................ 37
Antenna model for the simulations ............................................................ 38
Reflection coefficient ......................................................................... 39
Current distributions ........................................................................... 39
Near field distributions ....................................................................... 40
The effect of chassis length on antenna performance and SAR ......... 42
Chapter 6 ...................................................................................................................... 45
6. SAR control mechanisms and concepts for mobile phone antennas with
reduced SAR ............................................................................................................ 45
Introduction: .............................................................................................. 45
State of the art of SAR control: ................................................................. 45
Parasitic Elements .............................................................................. 46
WaveTraps: ........................................................................................ 50
Directive control antenna ................................................................... 56
Slotted ground plane: ......................................................................... 57
Advanced concepts for SAR control: ........................................................ 59
Antenna Type Optimization (Dual-Loop,) ......................................... 59
RF Shields (Ferrite, Conductor, PMC) ............................................... 68
Chapter 7 ...................................................................................................................... 80
7. EBG structures and application for SAR reduction ......................................... 80
New potential concept: Electromagnetic Band Gap (EBG) structures ...... 80
Dipole antenna over EBG and PEC ground plane: .................................... 84
Mobile phone antennas over EBG and PEC ground planes: ..................... 88
PIFA antenna over the EBG ground plane: ........................................ 88
Dual-Loop Antenna over the EBG ground plane: .............................. 93
Mobile Phone Antennas with integrated EBG structure: .......................... 95
Antenna in free space: ........................................................................ 95
Antenna beside the head: .................................................................. 102
iv
Impact of EBG on antenna performance at GSM 900: ........................... 108
Conclusion ............................................................................................... 112
Chapter 8 .................................................................................................................... 113
8. Conclusions and Future Work ....................................................................... 113
References .................................................................................................................. 115

v
Abstract
The increased amount of electromagnetic emission into the environment has increased
the public concern over the possible health risks of wireless devices. However, to
minimize the amount of energy absorbed by the user (measured by the Specific
Absorption Rate, SAR) not only reduces any possible health hazards but is
advantageous from the technical point of view, as well.
The purpose of this thesis is to investigate techniques for the reduction of the
interaction between the mobile phone’s antenna and the user’s head by using different
SAR control mechanisms while taking into account possible degradations of the
electrical and mechanical antenna properties.
The thesis starts with fundamental theory of mobile terminal antennas and SAR and
the numerical and measurement technologies are reviewed. The boundary conditions
on electromagnetic fields are shown to effect EM wave propagation inside dielectric
bodies, in particular, the permittivity of the material strongly affects the E&H field
distributions. This is followed by an introduction of some of the recently suggested
solutions for reduced SAR from internal handset antennas such as parasitic elements,
directive control antenna, wave traps and slots in the PCB ground plane. These
methods aim to control the current distribution and the direction of radiation in the
near field, while ferrite, conductors and AMC shields are used to disperse or attenuate
the EM fields radiated against the human body. As a superior solution, this thesis
proposes a High-Impedance Surface Electromagnetic Band Gap (EBG) planar
structure integrated below the antenna as SAR reduction solution.
With this method, for the case of a monopole antenna for GSM 1900 with backing by
an EBG the SAR values inside a phantom are well reduced with only slight impact on
the antenna radiation efficiency. On the other hand, the possible performance
degradation of a Loop antenna for low-band (GSM 900) by the influence of the EBG
(which is designed for GSM 1900) is checked and found to be acceptably small.

vi
List of Abbreviations
AMC Artificial Magnetic Conductor
CST Computer Simulation Technology
DNG Double NeGative
EM Electromagnetic
EBG Electromagnetic Band Gap
FDTD Finite Difference Time Domain
FEM Finite Element Method
FR4 Flame Retardant 4 (composed of fiberglass and an epoxy resin)
FSS Frequency Selective Surface
GSM Global System for Mobile Communication
HIS High Impedance Surface
ICNIRP International Commission on Non-Ionizing Radiation Protection
MRI Magnetic Resonance Imaging
MEMS Micro-Electro-Mechanical System
NRI Negative Refractive Index
PEC Perfect Electric Conductor
PIFA Planar Inverted F Antenna
PMC Perfect Magnetic Conductor
PBC Periodic Boundary Condition
PBG Photonic Band Gap
PDEBG Polarization-Dependent Electromagnetic Band Gap
PCB Printed Circuit Board
RF Radio Frequency
SNR Signal to Noise Ratio
SAR Specific Absorption Rate
TE Transverse Electric
TEM Transverse ElectroMagnetic
TM Transverse Magnetic
UMTS Universal Mobile Telecommunications System
Introdution and overview
1
Chapter 1
1. Introduction and Overview
With the development of mobile communication and the popularization of mobile
phones during the past ten years, since handsets have to meet tough technical
requirements (Voice and Data), the transmitting power has increased. Therefore, the
absorption of electromagnetic energy in the human head generated by the mobile
phones has become an essential topic in the scientific research due to possible health
risks. The Specific Absorption Rate (SAR) is a well-defined Figure of merit to
evaluate the power absorbed by biological tissue, and the standards organizations have
set exposure limits in terms of SAR.
Moreover, because of the bandwidth limitation of the Patch Inverted F Antenna
(PIFA), the antenna types presently used mostly such as monopole and loop have been
suggested as remedy for 4G handsets. However, most of monopole type radiation
suffers from excessive SAR values; therefore, this radiator is placed near the bottom
of the phone, which is naturally farther away from the head in talk position, but this
tends to be not enough to satisfy SAR limits.
The purpose of this thesis is to investigate possible reduction of the interaction
between the mobile phone’s antenna and the user’s head by using different SAR
control mechanisms without redesigning the antenna. In addition, any solution must
keep within the applicable terminal antenna design specifications. The specifications
are concerned with electrical properties such as efficiency, bandwidth etc., and
mechanical properties such as size, placement, mechanical shock impact etc. This
thesis studies and analyses different published SAR reduction solutions, and proposes
a High impedance surface-Electromagnetic Band Gap (EBG) structure as SAR
reduction solution.
The EBG structure is proposed as RF shielding when it is inserted between the
monopole antenna and the user’s head at the frequency band GSM1900 which is most
critical due to peak SAR values.
This thesis includes eight chapters. The concept of the mobile communication
technique is introduced in the second chapter. This includes an overview about the
interrelation between the most important antenna performance parameters such as the

Introdution and overview
2
reflection coefficient, bandwidth, and radiation efficiency. In addition, the
fundamentals of the interaction between the user and the antenna are presented. The
antenna and SAR measurement technologies are reviewed, which are later used in
next chapters.
Chapter 3 reviews the interaction mechanisms between RF Fields and the Body, the
radiation regions of an antenna are introduced to define the RF interaction region with
the user’s body. The effect of the boundary conditions on electromagnetic fields is
presented and numerical results are generated to describe the EM fields distribution at
the body boundary and inside the human’s body. An overview of Antenna parameters
in free space and in the vicinity of a user is presented to describe the RF antenna
radiation losses inside the head.
These first three chapters provide the necessary background for the reader to be able
to understand the concepts discussed in the later parts of this work.
In chapter 4, a quick view of different numerical simulation technologies (FDTD,
MOM...) to simulate the 3D electromagnetic fields is presented; for the investigation
in this thesis two commercial software packages: Computer Simulation Technology
(CST) and High Frequency Structural Simulator (HFSS) are used.
In chapter 5, the near field distribution of the widely used monopole antenna close to a
dielectric material interface at 900 GHz, and 1900 GHz are investigated. The relation
between peak SAR location and surface currents distribution on the chassis is
presented and compared between the two frequencies. In particular, the effect of the
chassis size on the maximum SAR values and antenna efficiency is studied.
In chapter 6, state-of-the-art SAR control mechanisms, some recently published
solutions for reducing SAR of internal antennas are investigated. The purpose of this
investigation is to evaluate the possibility of using these solutions inside the mobile
phone without negative impact on the mobile antenna performance at all frequency
bands. In addition, numerical and experimental studies for some proposed solutions
are presented. Including a simulation study on shield made of a Perfect Magnetic
Conductor (PMC), which leads to the concept of a “metamaterial” used as a shield behind
the antenna. This concept is investigated in detail using a specially designed multilayer
offset stacked EBG structure in the next chapter.
In Chapter 7, interference and diffraction of EM waves on the EBG structure and peak
SAR are investigated and compared for the case when no EBG is applied. The specific
absorption rate values inside the phantom and antenna radiation efficiency are
investigated for the case of a monopole antenna for GSM 1900 with and without
backing by an EBG. Placement of the small EBG structure inside the phone is
presented, moreover, SAR and antenna performance are investigated in free space and
beside the user’s head. Finally, the performance degradation of a Loop antenna for

Introdution and overview
3
low-band (GSM 900) is investigated to study the influence of the EBG (designed for
GSM 1900), on the loop antenna operating at GSM 900.
In Chapter 8, the conclusions of this thesis are summarized and some suggestions for
future work are presented.

Mobile communication systems
4
Chapter 2
2. Mobile Communication Systems
In today’s environment of almost constant connectivity, wireless devices are
ubiquitous, as the Radio Frequency (RF) electronics technology for these wireless
devices continues to decrease in size, there is a corresponding demand for a similar
decrease in size for the antenna element. Unfortunately, the performance requirements
for the antenna are rarely relaxed with the demand for smaller size. In fact, the
performance requirements generally become more complex and more difficult to
achieve as the wireless communications infrastructure evolves.
In the early organisation of cellular, Digital Cellular System (DCS), Personal
Communications Service/System (PCS), and Global System for Mobile
Communications (GSM) networks, the wireless device typically had to operate within
a single band, defined by the specific carrier’s license(s). In today’s environment, the
wireless device is often required to operate in more than one band that may include
several GSM frequencies, 802.11 (Wi-Fi), 802.16 (Wi-Max) and Global Positioning
System (GPS) as defined in Table 2-1. Note, frequencies below GSM 800 are not
presented.
In today’s wireless device terminology, an antenna that covers more than one of the
wireless communications bands is considered as a multiband antenna. For example, an
antenna that simultaneously covers two separate bands encompassing frequencies of
824–960 MHz and 1,710–1,990 MHz is considered as a four-band or quad-band
antenna since it provides coverage of the GSM 800, GSM 900, GSM 1800, and GSM
1900 frequencies.
In addition, as known from the EM wave propagation theory, the power density (S) of
waves is decreased when the distance (R) from the antenna is increased. Therefore, by
decreasing the mobile phone thickness, the antenna comes closer and the effect of the
antenna radiation on the user becomes higher.
Mobile communication systems
5
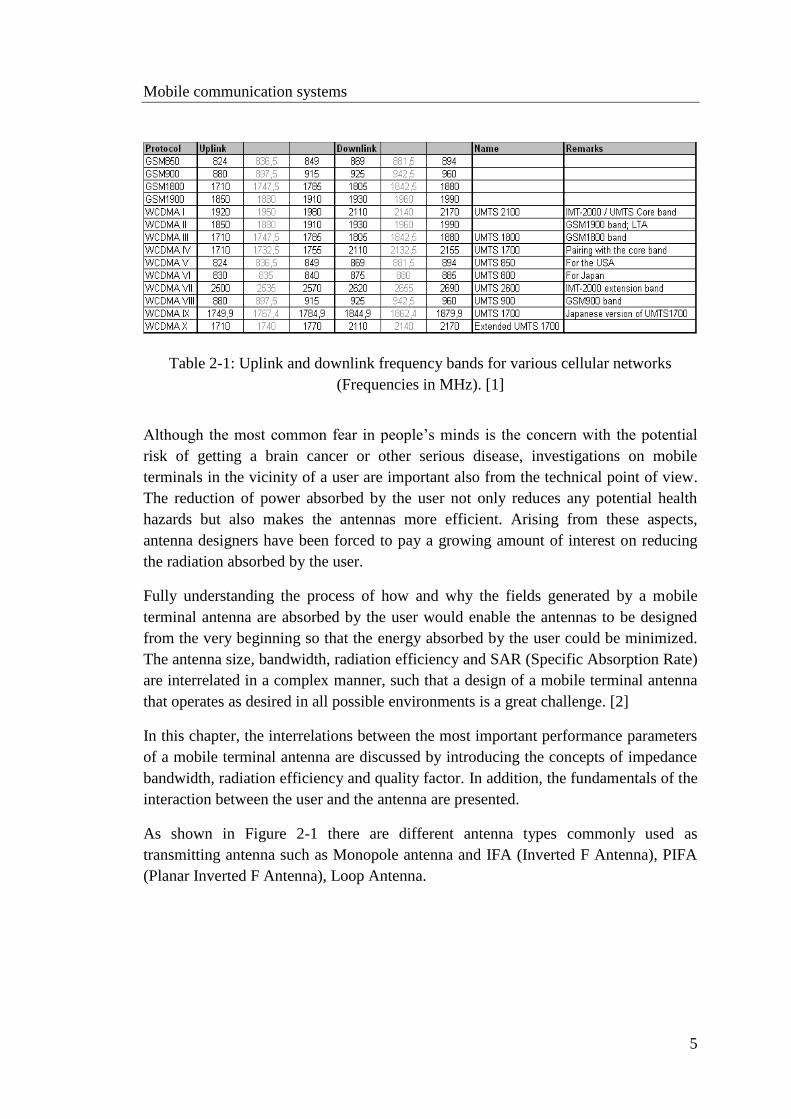
Table 2-1: Uplink and downlink frequency bands for various cellular networks
(Frequencies in MHz). [1]
Although the most common fear in people’s minds is the concern with the potential
risk of getting a brain cancer or other serious disease, investigations on mobile
terminals in the vicinity of a user are important also from the technical point of view.
The reduction of power absorbed by the user not only reduces any potential health
hazards but also makes the antennas more efficient. Arising from these aspects,
antenna designers have been forced to pay a growing amount of interest on reducing
the radiation absorbed by the user.
Fully understanding the process of how and why the fields generated by a mobile
terminal antenna are absorbed by the user would enable the antennas to be designed
from the very beginning so that the energy absorbed by the user could be minimized.
The antenna size, bandwidth, radiation efficiency and SAR (Specific Absorption Rate)
are interrelated in a complex manner, such that a design of a mobile terminal antenna
that operates as desired in all possible environments is a great challenge. [2]
In this chapter, the interrelations between the most important performance parameters
of a mobile terminal antenna are discussed by introducing the concepts of impedance
bandwidth, radiation efficiency and quality factor. In addition, the fundamentals of the
interaction between the user and the antenna are presented.
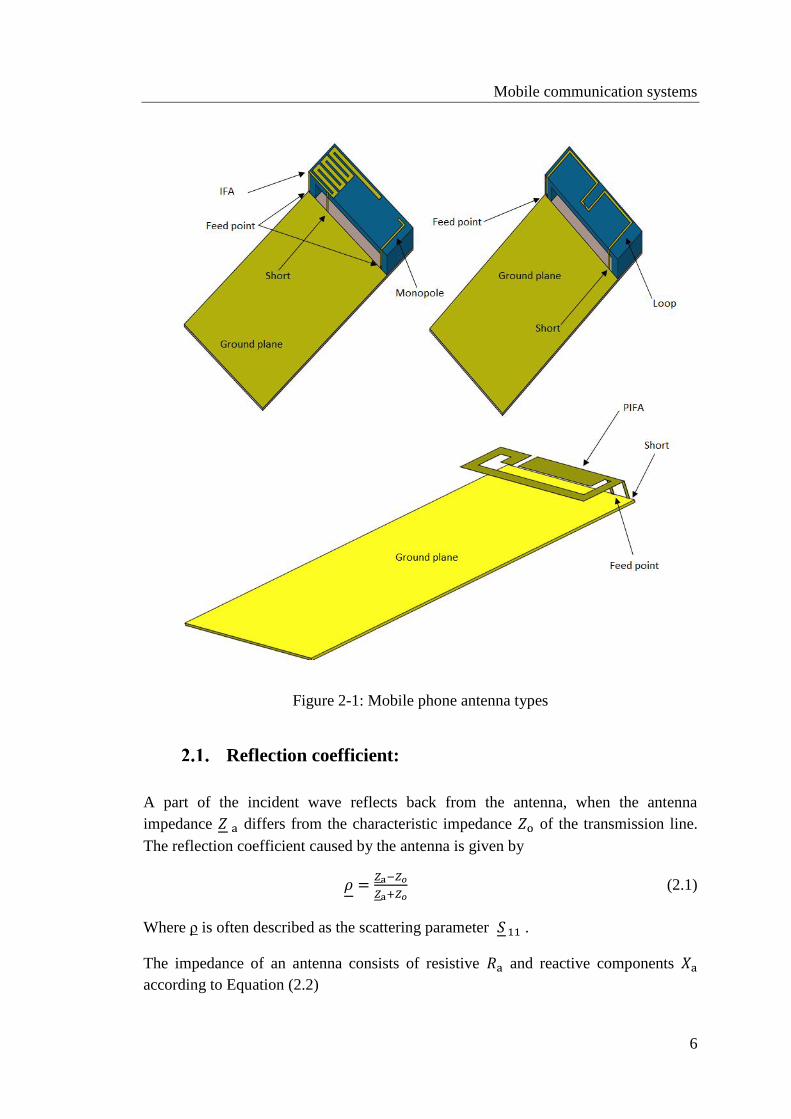
As shown in Figure 2-1 there are different antenna types commonly used as
transmitting antenna such as Monopole antenna and IFA (Inverted F Antenna), PIFA
(Planar Inverted F Antenna), Loop Antenna.
Mobile communication systems
6
Figure 2-1: Mobile phone antenna types
Reflection coefficient:
A part of the incident wave reflects back from the antenna, when the antenna
impedance 𝑍 a differs from the characteristic impedance 𝑍o of the transmission line.
The reflection coefficient caused by the antenna is given by
𝜌 =𝑍a−𝑍𝑜
𝑍a+𝑍𝑜 (2.1)
Where ρ is often described as the scattering parameter 𝑆 11 .
The impedance of an antenna consists of resistive 𝑅a and reactive components 𝑋a
according to Equation (2.2)

Mobile communication systems
7
Transmission line Antenna
Radiation
𝑍o
𝑅r
𝑅l
𝑗𝑋a
𝑍 a = 𝑅a + 𝑗𝑋a (2.2)
The equivalent circuit model for the impedance parameters of an antenna and
transmission line are presented in Figure 2.2.
The resistive part of the impedance further consists of radiation and dissipation
losses,𝑅a = 𝑅r + 𝑅l, and the reactive part 𝑋a is caused by energy stored in the antenna’s
reactive near fields. However, at the antenna’s resonant frequency, the reactive part of the
impedance disappears.
A very close object affects the antenna impedance. However, in many cases a slight
mismatch is accepted. E.g., for small handset antennas |ρ| = | 𝑆 11| ≤ 0.5 is often
considered adequate for the operating frequency range.
Bandwidth:
When designing small mobile terminal antennas, the absolute bandwidth 𝐵𝑊𝑎𝑏𝑠
mostly refers to the impedance bandwidth, i.e. the frequency range where condition |ρ|
= | 𝑆 11| ≤-6 dB is satisfied. The corresponding values for Voltage Standing Wave
Ratio VSWR ≤ 3, and return loss 𝑅L ≥ 6 dB can be calculated from Equations:
𝑉𝑆𝑊𝑅 =1+|𝜌|
1−|𝜌| (2.3)
𝑅L = 10𝑙𝑜𝑔1
|𝜌|2 (2.4)
Figure 2-2 : Equivalent circuit of the transmitting
antenna

Mobile communication systems
8
Bandwidth can also be represented relative to the center frequency 𝑓c leading to the
relative bandwidth, which is defined in the following equation:
𝐵r =𝐵𝑊abs
𝑓c (2.5)
𝐵𝑊abs : Absolute impedance bandwidth, 𝑓c : Center frequency
Table 2.2 presents bandwidth requirements for different wireless systems that can be
applied in portable devices.
System 𝑓𝐜 [MHz] 𝑩𝑾𝐚𝐛𝐬[MHz] 𝑩𝐫 [%]
GSM 850 859 70 8.1
GSM 900 920 80 8.7
GSM 1800 1795 170 9.5
GSM 1900 1920 140 7.3
WLAN (802.11g) 2450 100 4.1
WLAN (802.11a) 5250 200 3.8
Table 2-2: Frequency bands of different systems.
Efficiency
The radiation efficiency 𝜂radof an antenna is defined as the ratio of the radiated power
𝑃rad to the power 𝑃in accepted by the antenna:
𝜂rad =𝑃rad
𝑃in (2.6)
By using the impedance parameter of an antenna, the radiation efficiency can be
written as:
𝜂rad =𝑅r
𝑅r+𝑅l (2.7)
Because the radiation efficiency does not take into account the losses due to mismatch
between the antenna input and the transmission line, the total efficiency of an antenna
is defined as the ratio of the radiated power to the incident power 𝑃inc to the antenna,
and it can be calculated from:
𝜂tot = 𝜂rad𝜂m (2.8)
Mobile communication systems
9
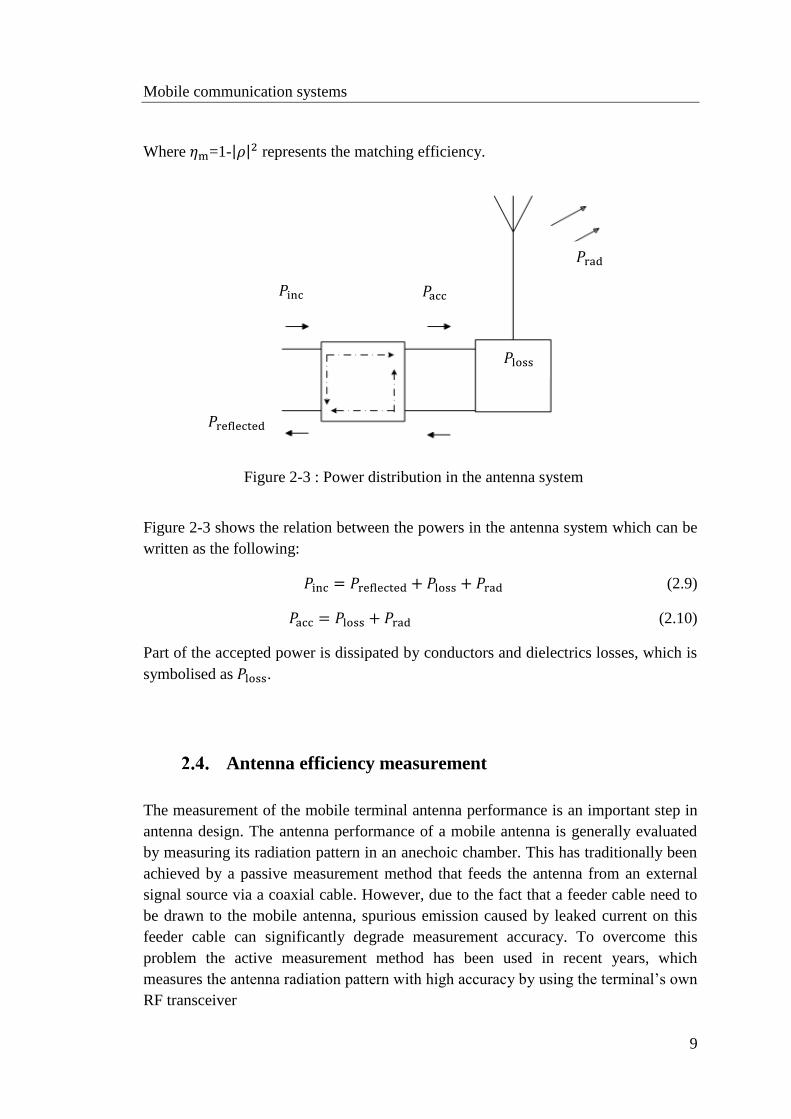
Where 𝜂m=1-|𝜌|2 represents the matching efficiency.
Figure 2-3 shows the relation between the powers in the antenna system which can be
written as the following:
𝑃inc = 𝑃reflected + 𝑃loss + 𝑃rad (2.9)
𝑃acc = 𝑃loss + 𝑃rad (2.10)
Part of the accepted power is dissipated by conductors and dielectrics losses, which is
symbolised as 𝑃loss.
Antenna efficiency measurement
The measurement of the mobile terminal antenna performance is an important step in
antenna design. The antenna performance of a mobile antenna is generally evaluated
by measuring its radiation pattern in an anechoic chamber. This has traditionally been
achieved by a passive measurement method that feeds the antenna from an external
signal source via a coaxial cable. However, due to the fact that a feeder cable need to
be drawn to the mobile antenna, spurious emission caused by leaked current on this
feeder cable can significantly degrade measurement accuracy. To overcome this
problem the active measurement method has been used in recent years, which
measures the antenna radiation pattern with high accuracy by using the terminal’s own
RF transceiver
𝑃inc 𝑃acc
𝑃rad
𝑃reflected
𝑃loss
Figure 2-3 : Power distribution in the antenna system

Mobile communication systems
10
Figure 2-4: Overview of SATIMO passive antenna measurement system. After [3]
The Figure 2-4 shows the antenna measurement system from SATIMO, which was
used in this thesis as passive measurement instrumentation for antenna efficiency. The
Vector Network Analyzer VNA is used as RF source/receiver and the control unit
drives the two positioning motors and the electronic scanning of the 15 two-
polarization probes, with space 22.5° between two probes and rotation step of the mast
of 11.25°.
The active measurement was used to analyse the radiation pattern shape and the
efficiency; this method generally is referred to as OTA, where OTA measurements
determine the Over-The-Air performance of mobile terminals such as mobile phones.
The resulting values for Total Radiated Power (TRP) are a figure of merit for
qualifying a mobile terminal performance in a network as shown in Figure 2-5.
Figure 2-5: Overview of active measurement system (TRP), consisting of 64 two-
polarization probes with 0.02° Azimuth accuracy.After [4]
Mobile communication systems
11
In TRP measurement, the total RF channel power radiated by the mobile phone is
calculated by integrating the measured Effective Isotropic Radiated Power (EIRP)
data over the measurement sphere. The amplification unit amplifies the signal on
reception channels according to the frequency bands; the Radio Communication
Tester (CMU) controls the transmit power of the mobile terminal by the link antenna.
TRP measurement is on the complete system, combining the antenna performance and
the RF transceiver performance and is defined in the following equation:
𝑇𝑅𝑃 =1
4𝜋∮ (𝑃tx𝐺𝜃(𝛺; 𝑓) + 𝑃tx𝐺𝜙(𝛺; 𝑓)) 𝑑𝛺 (2.11)
Here, 𝐺θ and 𝐺ϕ denote the vertical and horizontal polarization components,
respectively, of the antenna gain pattern at frequency f and 𝛺 denotes the area of a
spherical surface cut away by a cone whose vertex is the center of the sphere. In
addition, 𝑃tx is the transmitted power of the DUT so that 𝑃tx𝐺θ and 𝑃tx𝐺ϕ denote the
effective radiated power known as Equivalent Isotropically Radiated Power (EIRP).
User interaction
The everyday use of devices emitting radio frequency (RF) is rapidly increasing.
Close to the antennas, the electric field strengths can reach several hundred volts per
meter. Even higher values can be found close to occupational sources used for
processing of various materials by heating and sometimes by formation of plasma
discharge in the material. Power sources generating high levels of electromagnetic
fields are typically found in medical applications and at certain workplaces. Medical
devices used for magnetic resonance imaging (MRI), diathermy, various kinds of RF
ablation, surgery, and diagnoses may cause high levels of electromagnetic fields at the
patient’s position or locally inside the patient’s body. The cellular mobile
communication causes on average low levels of electromagnetic fields in areas
accessible to the public by comparison to the medical devices. However, it might
cause significantly higher peak levels of exposure during use of mobile terminals.
Absorption of radiation into the user
During the last decade, the issue of electromagnetic interaction between human tissue
and a mobile phone has been intensively studied to expand the understanding of
radiation safety of mobile communication systems. In the case of a mobile phone, a

Mobile communication systems
12
considerable part of the power radiated from the antenna is actually absorbed into the
user’s head, hand and the rest of the body.
The biological effects of electromagnetic radiation on living cells can be classified
into two types: ionizing effect and non-ionizing effect, based on the radiation’s
capability of ionizing atoms and breaking chemical bonds.
According to present knowledge, the only influence that electromagnetic radiation has
on human tissue is the rise in temperature (non-ionizing effect), Figure 2-6, when the
source frequency is between 100 kHz to 300GHz [5]. If the temperature rise on the
surface of the brain caused by radio waves is not more than 0.3 degrees, it is known
that this does not have any physiological significance. As a comparison, the normal
fluctuation is around ±1°C, and in exhausting physical exercise, even a temperature
rise of two degrees is quite common [6].
Although the increase in tissue temperature is too small to cause any biological
damage, it has been speculated that electric fields may, by some unknown non-thermal
mechanism, disturb normal cell function. Hence, in addition to tissue heating, other
possible health hazards of mobile phone radiation have been intensively studied in the
last 20 years.
Apparently, the most popular subject of research has been to study the potential
connection between mobile phone radiation and brain cancer. On the basis of research
results obtained from these studies, it hasn’t been possible to conclude that radiation
from mobile phones would be detrimental to health [6].
Biological hazards of electromagnetic fields
Thermal Effects
Exposure guidelines
Non- Thermal Effects
Figure 2-6 : Biological hazards of electromagnetic fields
Mobile communication systems
13
Target Effect Threshold
Whole
body
Various physiological effects 1.0 °C
Eye
lens
Cataract 3 – 5 °C
Skin Warmth sensation 0.02 – 1 °C
Pain sensation/Burns 10 – 20 °C
Brain Neuron damage 4.5 °C
Table 2-3: Thresholds for the induction of thermal effects to the human body (world
health organization WHO)
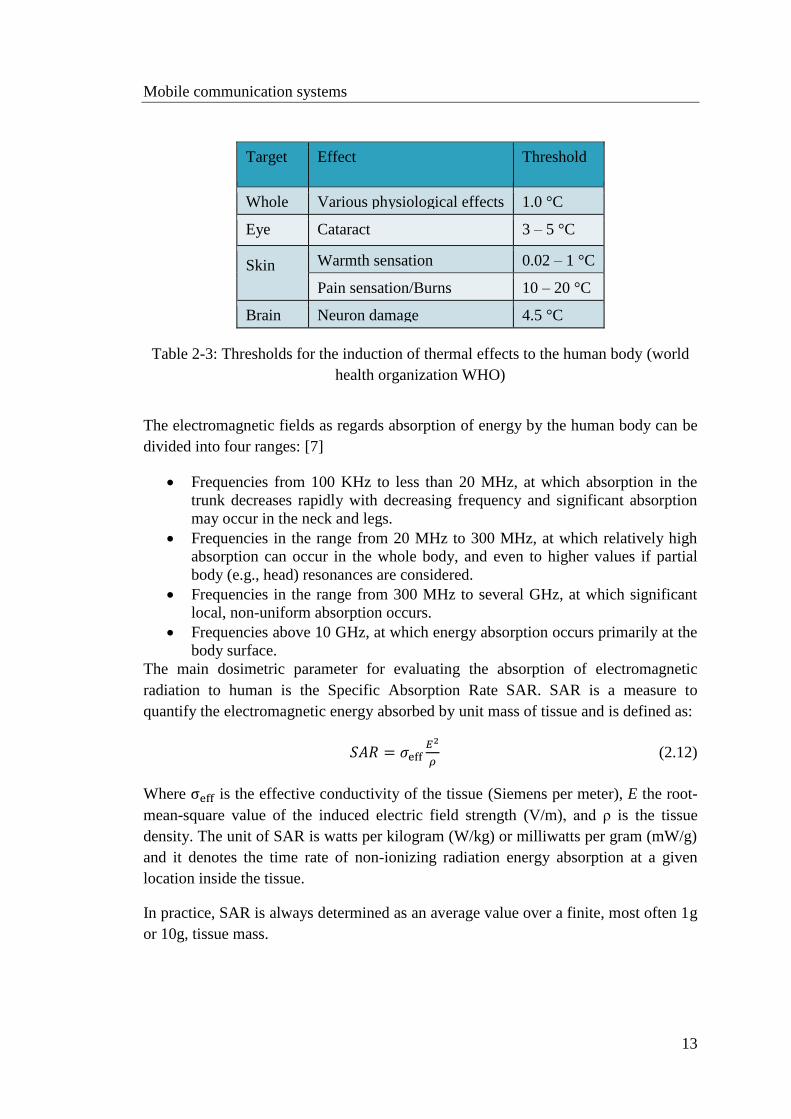
The electromagnetic fields as regards absorption of energy by the human body can be
divided into four ranges: [7]
Frequencies from 100 KHz to less than 20 MHz, at which absorption in the
trunk decreases rapidly with decreasing frequency and significant absorption
may occur in the neck and legs.
Frequencies in the range from 20 MHz to 300 MHz, at which relatively high
absorption can occur in the whole body, and even to higher values if partial
body (e.g., head) resonances are considered.
Frequencies in the range from 300 MHz to several GHz, at which significant
local, non-uniform absorption occurs.
Frequencies above 10 GHz, at which energy absorption occurs primarily at the
body surface.
The main dosimetric parameter for evaluating the absorption of electromagnetic
radiation to human is the Specific Absorption Rate SAR. SAR is a measure to
quantify the electromagnetic energy absorbed by unit mass of tissue and is defined as:
𝑆𝐴𝑅 = 𝜎eff𝐸2
𝜌 (2.12)
Where σeff is the effective conductivity of the tissue (Siemens per meter), E the root-
mean-square value of the induced electric field strength (V/m), and ρ is the tissue
density. The unit of SAR is watts per kilogram (W/kg) or milliwatts per gram (mW/g)
and it denotes the time rate of non-ionizing radiation energy absorption at a given
location inside the tissue.
In practice, SAR is always determined as an average value over a finite, most often 1g
or 10g, tissue mass.

Mobile communication systems
14
SAR-Limits
The RF energy in the frequency range of Global System for Mobile Communications
(GSM): 824 MHz to 2170 MHz, and WLAN: 2.45 GHz and 5.2 GHz is called non-
ionizing because the photon energy is insufficient to knock electrons from atoms in
living tissue.
The most apparent biological effects of RF energy at cell phone frequencies are due to
heating, which means increase in the temperature of the tissues.
Table 2.4 presents the recommended limits for local maximum SAR values in an
uncontrolled environment set by IEEE (Institute of Electrical and Electronics
Engineers) and ICNIRP (International Commission on Non-Ionizing Radiation
Protection). In Europe the ICNIRP recommendations are the most widely followed,
while the slightly stricter standards set by IEEE are applied in the United States.
The SAR limits are defined at different time duration over 6 minutes (ICNIRP 1998)
and over 30 minutes (IEEE 2005).
Workers
Controlled
General public
Uncontrolled
ICNIRP Whole-body SAR 4 W/kg 0.08 W/kg
Local SAR(10 g averaging) 10 W/kg 2 W/kg
IEEE Whole-body SAR 4 W/kg 0.08 W/kg
Local SAR(1 g averaging) 8 W/kg 1.6 W/kg
Table 2-4: Recommended maximum local SAR values set by ICNIRP and IEEE.
The recommendations presented in Table 2.4 give information for antenna designers.
That is, the radiation safety of mobile communication devices can be designed in and
tested by using these levels as references.
The fundamentals of the interaction mechanisms between electromagnetic fields and
dielectric material, such as human tissue, are further discussed in the subsequent
chapters of this thesis.

Mobile communication systems
15
Reduction of radiation efficiency
Radiation efficiency is defined as the ratio of the total power radiated by an antenna to
the net power accepted by the antenna from the connected transmitter.
When the antenna is placed beside the head, the accepted antenna power 𝑃acc consists
of the antenna dissipation 𝑃loss , the absorbed power in the head 𝑃h and (far-field)
radiated power 𝑃r.This can be expressed as:
𝑃acc − 𝑃loss =1
2 𝑅𝑒(𝑉𝐼∗) = 𝑃h + 𝑃r =
1
2∫ 𝜎1 |�̅�|
2𝑉𝑏
𝜕𝑉 +1
2𝑅𝑒 [∫ (�̅� × �̅�∗)𝜕𝑆
𝑠]
(2.13)
𝑉b: Volume of body, S: Far-field sphere.
Besides the health issues, it is essential from the antenna efficiency point of view to
minimize the power absorbed in the user’s head and the rest of the body; the smaller
the portion of power that human tissues absorbes, the larger is the share that radiates
into the surrounding free space.
In fact, the portion of power absorbed in the user largely determines the total radiation
efficiency of the system including the phone and the user. Especially at GSM bands,
the contribution of power that is absorbed in the user is commonly very large and with
internal mobile phone antennas, even more than 90 % of the total accepted power can
be lost due to the presence of the user.
There is no doubt that the input power is also partly lost in the mobile phone antenna
and the structure such as in the battery, display and all the plastic components.
However, free space radiation efficiency of a commercial mobile phone can be still in
the order of 80 % (corresponding to approximately 1 dB of loss in the structure) or
more.
SAR Measurement Equipment (Near-Field Scanners)
In order to evaluate the SAR and induced current density inside of the human body
exposed to electromagnetic fields, various measurement methods have been developed
(IEEE C95.3-2002). For the measurements, human body phantoms are frequently used
while in other cases, volunteers or cadavers have been used [8]; [9]. In order to keep

Mobile communication systems
16
the repeatability of the measurement high, human-body phantoms with homogeneous
liquid dielectric properties are preferable.
For local SAR measurement, there are two methods, one is E-field measurement and
another is temperature measurement. E-field measurement is used for compliance tests
of mobile phones because the sensitivity is relatively high and 3-D measurement is
available if a liquid-type phantom is used.
The procedures of the compliance tests of wireless terminals such as mobile phones
based on E-field measurement have been standardized internationally between 300
MHz and 3 GHz (IEC 62209-1-2005; IEEE Std. 1528-2003). It is also noted that E-
field probes must be calibrated at each frequency and in phantom materials with the
electrical properties adjusted to those of the biological tissues at the frequency of
interest. Thus, an E-field probe which is only calibrated in free space cannot be used
to measure E-field strength in phantoms.
3-D Scanning System:
Figure 2-7 shows a typical 3-D SAR measurement system used to perform SAR
measurement in the head and body phantom. The system measures the E field’s
amplitude inside the liquid. The probe is held by the robot arm and scans the entire
exposed volume of the phantom in order to evaluate the three-dimensional field
distribution.
Figure 2-7: Mobile phone SAR measurement system which consists of an E-field
probe positioned by a robot in a head phantom exposed to a mobile phone at the right
ear. From [10]

Mobile communication systems
17
Figure 2-8 : Side view of the phantom head showing the ear and marking lines BM
and NF. Intersection RE is the ear reference point (ERP). From [11]
Figure 2-8 shows the side view of the phantom. The center-of-mouth reference point
is labelled “M,” the left ear reference point (ERP) is marked by “LE,” and the right
ERP is marked by “RE.” Each ERP is located on the B-M (back-mouth) line 15 mm
behind the entrance-to-ear-canal (EEC) point. At the test frequency the robot measures
the E field over the Scan Area (81x141x1 𝑚𝑚3), with measurement grid 𝑑x=10mm,
𝑑y=10mm.
There are two mobile phone positions for every head side, cheek touch and 15°tilt. In
this study, the cheek touch (right head) position is used to compare the SAR values
from different antenna measurements. The phantom is filled with tissue equivalent
liquid for various frequencies based on a plane wave analysis [12].
In the near field of a wireless handset, the EM field distributions may have sharp
spatial variations in both magnitude and polarization. Thus, the typical field probe for
measuring SAR shall be much smaller than the wavelength λ in a tissue equivalent
liquid, be isotropic, and shall be transparent to the measured field.
The Figure 2-9 shows a typical E-field probe, which consist of three mutually
orthogonal center-fed short dipole antennas. [13]

Mobile communication systems
18
Every dipole antenna (sensor) has a detector diode at the feed point, which produces a
rectified voltage proportional to the square of the E-field component, and high
resistance connection lines. The total E-field vector magnitude is calculated as in the
following equation:
|𝐸| = √|𝐸1|2 + |𝐸2|2 + |𝐸3|2 (2.14)
𝐸1, 𝐸2, 𝐸3: The three orthogonal components measured by the sensors, and SAR
calculated per 1g or 10g cubic by the equation (2.12).
2-D Flat Scanner (iSAR):
The scanner is based on a sensor array implanted in a solid flat phantom. The phantom
is filled with a broadband tissue simulating gel (useful 500 MHz to 3 GHz), with 256
sensors located at 4mm below the surface, Figure 2-10.
The density of the sensor array (grid of 15mm) is sufficient to reliably assess the
exposure. The measured SAR values of all sensors are acquired and integrated in
parallel; the total assessment time is less than 1second. [14]
Connection lines
Figure 2-9: Typical E-field probe construction: Dielectric structure supports the
three miniature and mutually orthogonal sensor dipoles. After [13]

Mobile communication systems
19
The 2-D scanner has been used to support quick evaluations of SAR values, and this
scanner can measure the two electric field polarizations (X, Y) parallel to the phantom
surface. The absence of the polarization in the depth direction may cause SAR
underestimation if the source has strong electric fields perpendicular to the phantom
surface and the source is located in close proximity to the iSAR surface. Using low-
loss spacers between the device and the iSAR can reduce this effect. [15].
Generally, both 2-D and 3-D scanners are connected to the PC, and the local SAR
values for 1g, 10g are calculated from the measured E-field and presented on the PC
by using special software and solving the SAR equation (2.12).
Figure 2-10: Mobile phone 2-D SAR measurement system which consists of an array
of E-field probes located 4mm below the surface. After [14]

Interaction between Handset Antenna and User
20
Chapter 3
3. Interaction between Handset Antenna and User
Introduction
A human is the user of the mobile communication system, and the effect of the user
needs to be considered in order to design antennas with proper performance and
acceptable SAR value. The user of a mobile phone can actually be considered as a part
of the radiating system, as the nearby human tissue affects the electromagnetic fields
generated by the device.
When radio waves propagate in a dielectric material, such as human tissue, electric
and magnetic fields are generated inside the material. The frictional forces between
the particles that start to move due to the electric field cause losses, which results in
absorption of energy. It is well known how these fields inside a dielectric material
interact with the material, but the connection between the original external fields and
the generated internal fields is still an object of research.
Since the total efficiency of a system including the antenna and the user is strongly
affected by the power absorbed by the user, SAR requirements, i.e., the topic of
energy absorbing mechanisms in human body tissue is important not just because of
the SAR limits but also from the antenna efficiency point of view. Therefore, for an
antenna designer, it would be extremely useful to know and understand these
mechanisms and thus to be able to predict the trends of bandwidth, efficiency and
SAR.
In this chapter, the interaction between the fields generated by the antenna and the
nearby dielectric tissue of a user is investigated. At first, the radiation regions of the
antenna and the boundary conditions in Electro-Magnetic (EM) theory need to be
reviewed for the understanding of the interaction between the user and the mobile
phone.
Interaction between Handset Antenna and User
21
Radiation regions of an antenna
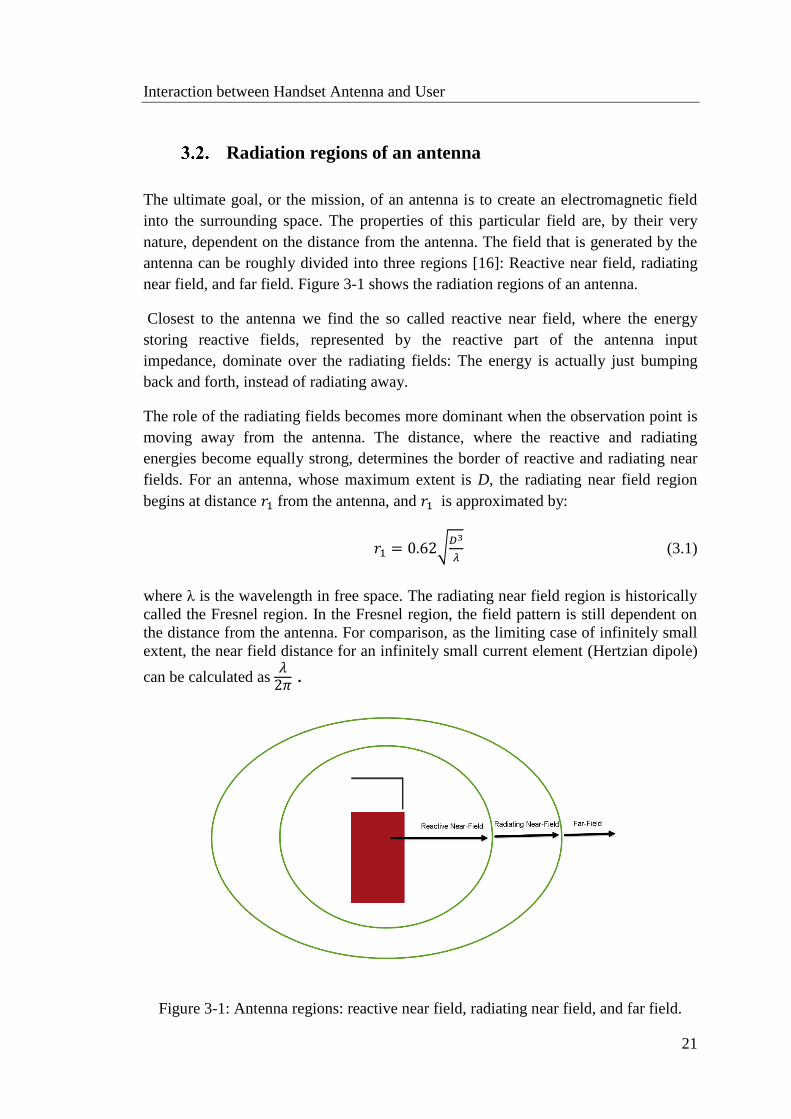
The ultimate goal, or the mission, of an antenna is to create an electromagnetic field
into the surrounding space. The properties of this particular field are, by their very
nature, dependent on the distance from the antenna. The field that is generated by the
antenna can be roughly divided into three regions [16]: Reactive near field, radiating
near field, and far field. Figure 3-1 shows the radiation regions of an antenna.
Closest to the antenna we find the so called reactive near field, where the energy
storing reactive fields, represented by the reactive part of the antenna input
impedance, dominate over the radiating fields: The energy is actually just bumping
back and forth, instead of radiating away.
The role of the radiating fields becomes more dominant when the observation point is
moving away from the antenna. The distance, where the reactive and radiating
energies become equally strong, determines the border of reactive and radiating near
fields. For an antenna, whose maximum extent is D, the radiating near field region
begins at distance 𝑟1 from the antenna, and 𝑟1 is approximated by:
𝑟1 = 0.62√𝐷3
𝜆 (3.1)
where λ is the wavelength in free space. The radiating near field region is historically
called the Fresnel region. In the Fresnel region, the field pattern is still dependent on
the distance from the antenna. For comparison, as the limiting case of infinitely small
extent, the near field distance for an infinitely small current element (Hertzian dipole)
can be calculated as 𝜆2𝜋
.
Figure 3-1: Antenna regions: reactive near field, radiating near field, and far field.
Interaction between Handset Antenna and User
22
The region where the field pattern is only angle-dependent and no more distance-
dependent is called the far field region, or more elegantly, the Fraunhofer region. The
far field region can be considered to begin at distance 𝑟2, which is approximated by:
𝑟2 =2𝐷2
𝜆 (3.2)
For an antenna and PCB (chassis) combination of a mobile handset, the exact
distances to near and far field from the antenna structure can be difficult to define.
Although the largest dimension of the antenna element itself is in the order of 40 mm
at frequencies not substantially higher than 1 GHz, the PCB, whose length is about
100 mm, acts as the main radiator [17], and thus dominates the dimension D in
equations (3.1) and (3.2).
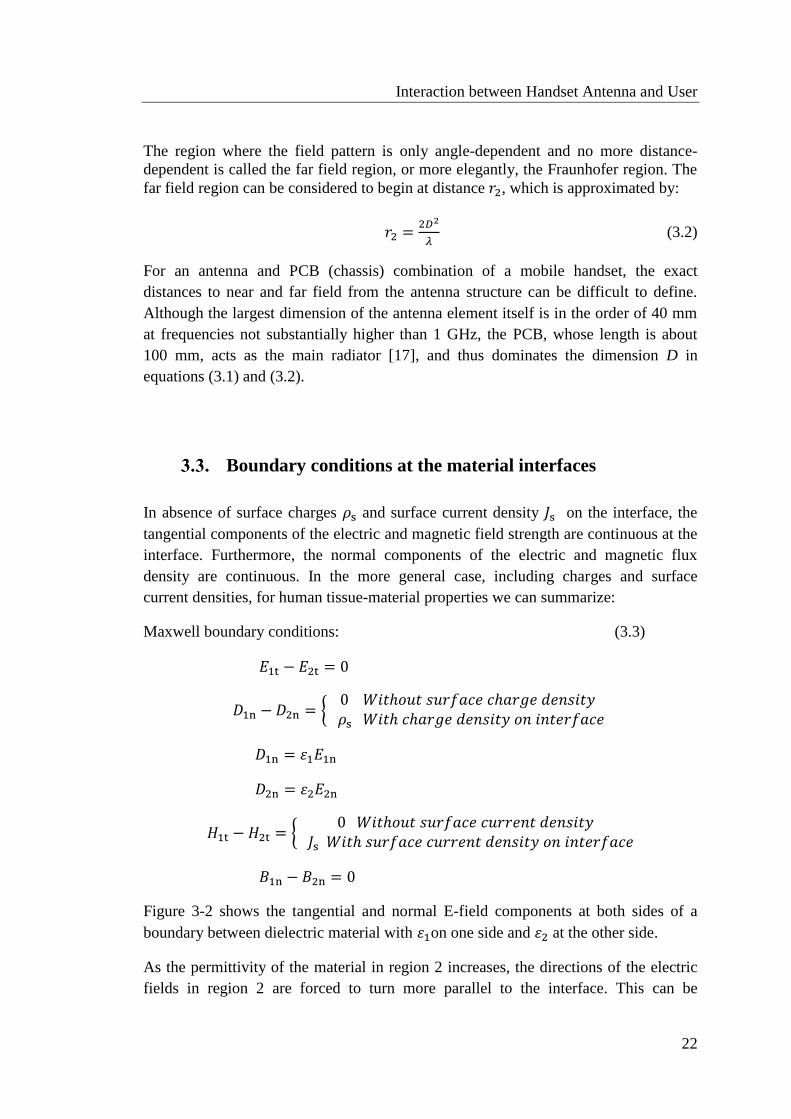
Boundary conditions at the material interfaces
In absence of surface charges 𝜌s and surface current density 𝐽s on the interface, the
tangential components of the electric and magnetic field strength are continuous at the
interface. Furthermore, the normal components of the electric and magnetic flux
density are continuous. In the more general case, including charges and surface
current densities, for human tissue-material properties we can summarize:
Maxwell boundary conditions: (3.3)
𝐸1t − 𝐸2t = 0
𝐷1n −𝐷2n = {0 𝑊𝑖𝑡ℎ𝑜𝑢𝑡 𝑠𝑢𝑟𝑓𝑎𝑐𝑒 𝑐ℎ𝑎𝑟𝑔𝑒 𝑑𝑒𝑛𝑠𝑖𝑡𝑦
𝜌s 𝑊𝑖𝑡ℎ 𝑐ℎ𝑎𝑟𝑔𝑒 𝑑𝑒𝑛𝑠𝑖𝑡𝑦 𝑜𝑛 𝑖𝑛𝑡𝑒𝑟𝑓𝑎𝑐𝑒
𝐷1n = 휀1𝐸1n
𝐷2n = 휀2𝐸2n
𝐻1t − 𝐻2t = {0 𝑊𝑖𝑡ℎ𝑜𝑢𝑡 𝑠𝑢𝑟𝑓𝑎𝑐𝑒 𝑐𝑢𝑟𝑟𝑒𝑛𝑡 𝑑𝑒𝑛𝑠𝑖𝑡𝑦
𝐽s 𝑊𝑖𝑡ℎ 𝑠𝑢𝑟𝑓𝑎𝑐𝑒 𝑐𝑢𝑟𝑟𝑒𝑛𝑡 𝑑𝑒𝑛𝑠𝑖𝑡𝑦 𝑜𝑛 𝑖𝑛𝑡𝑒𝑟𝑓𝑎𝑐𝑒
𝐵1n − 𝐵2n = 0
Figure 3-2 shows the tangential and normal E-field components at both sides of a
boundary between dielectric material with 휀1on one side and 휀2 at the other side.
As the permittivity of the material in region 2 increases, the directions of the electric
fields in region 2 are forced to turn more parallel to the interface. This can be

Interaction between Handset Antenna and User
23
explained by Maxwell’s boundary conditions for electric field components parallel
and normal to the surface, which require that.
Figure 3-2 : Boundary condition for electrical field
The electric field component in region 2 normal to the interface is reduced at the
boundary. The study on the interaction between the fields of an antenna near dielectric
material is started by exploring the electric and magnetic fields when a large volume
filled with material of different dielectric parameters (dielectric block) is placed
beside the antenna.
Figure 3-3 shows two monopole antennas one for 900 MHz, one for 1900 MHz
mounted on an antenna carrier (ground plane) and located above the dielectric block
in 19mm distance.
Figure 3-3: Geometry of the simulation model, Antenna 1 for 900 MHz, and Antenna
2 for 1900 MHz.
Copper Dielectric
block
휀𝑟
d
Antenna 1 Antenna 2 Antenna carrier
75 mm
45 mm
106 mm 92 mm
135 mm
Interaction between Handset Antenna and User
24
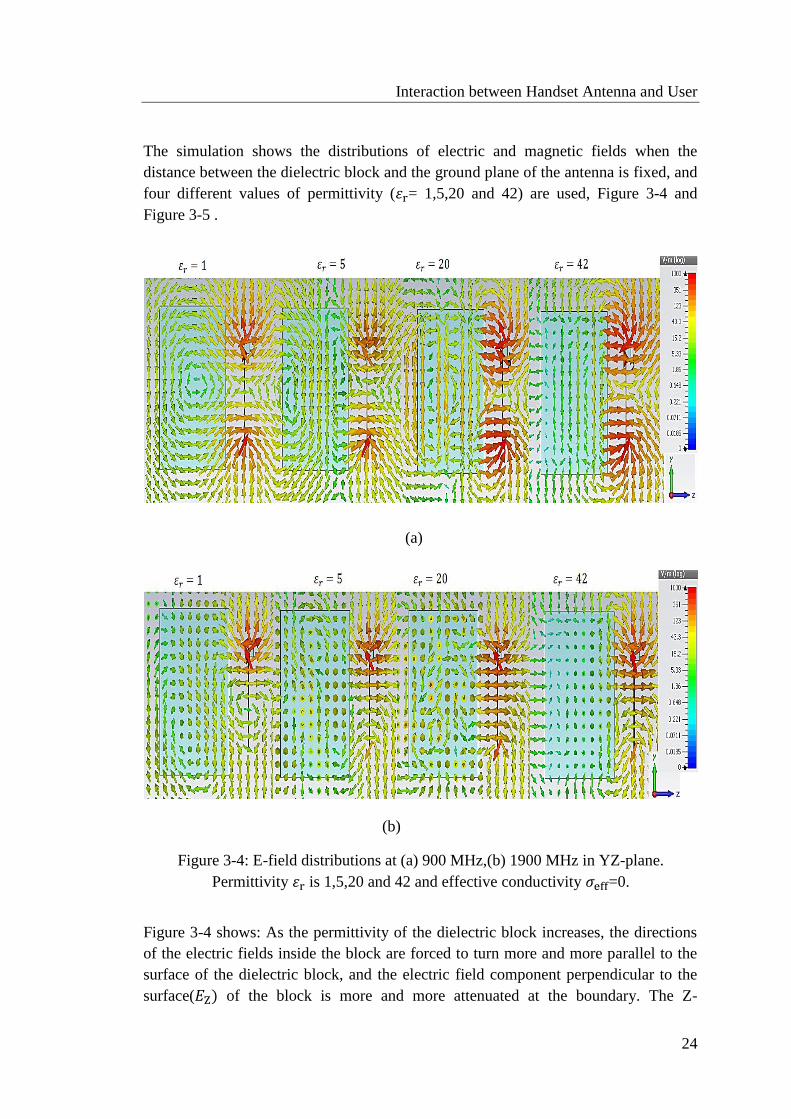
The simulation shows the distributions of electric and magnetic fields when the
distance between the dielectric block and the ground plane of the antenna is fixed, and
four different values of permittivity (휀r= 1,5,20 and 42) are used, Figure 3-4 and
Figure 3-5 .
Figure 3-4 shows: As the permittivity of the dielectric block increases, the directions
of the electric fields inside the block are forced to turn more and more parallel to the
surface of the dielectric block, and the electric field component perpendicular to the
surface(𝐸Z) of the block is more and more attenuated at the boundary. The Z-
(b)
(a)
Figure 3-4: E-field distributions at (a) 900 MHz,(b) 1900 MHz in YZ-plane.
Permittivity 휀r is 1,5,20 and 42 and effective conductivity 𝜎eff=0.

Interaction between Handset Antenna and User
25
component of the electric field hardly penetrates through the material when the
permittivity of the material is high, although it is very strong between the antenna and
the dielectric. The H-field distributions inside the dielectric block and at the boundary
are shown in Figure 3-5.There, we see how the antenna excites a standing wave
pattern inside the dielectric body, more clearly the higher the permittivity is.
Figure 3-5 : H-field distributions at (a) 900 MHz,(b) 1900 MHz in XZ-plane.
Permittivity 휀r is 1,5,20 and 42. Effective conductivity 𝜎eff=0.
Figures 3-4, 3-5 show that as the permittivity of the dielectric block increases,
distributions of the magnitudes of electric and magnetic fields inside the block become
more and more alike.
(a)
(b)

Interaction between Handset Antenna and User
26
Furthermore, the magnitude of the magnetic field inside the dielectric block seems to
increase significantly as the permittivity of the block increases. The analysis shows
that electric and magnetic fields have strong values in the areas along the Y-axis close
to locations where the currents on the surface of the ground plane of the antenna are
high, as well.
Absorption mechanisms for mobile phones with
integrated antennas:
When the free space radio frequency electromagnetic field impinges on a biological
body, it is reflected, transmitted, refracted or scattered by the biological body. The
reflected and scattered fields may proceed in directions different from that of the
incident RF field.
The transmitted and refracted fields from the RF exposure induce electric and
magnetic fields in the biological systems, which interact with cells and tissues in a
variety of ways, depending on the frequency, waveform, and strength of the induced
fields and the energy deposited or absorbed in the biological systems.
At the lower mobile communications frequency of 900 MHz, the wavelength in air is
33.3 cm, and for the reactive and radiation fields of a Hertzian dipole to have equal
amplitudes the distance of 𝜆 2𝜋⁄ is about 5.3 cm. At 1900 MHz, the wavelength in air
is 15.78 cm and the 𝜆 2𝜋⁄ distance is 2.5cm. Clearly, at the mobile phone frequency
bands both near-zone reactive and radiative wave interactions are encountered in the
vicinity of personal wireless telecommunication systems.
If the induced E-field is known, quantities such as current density (J) and specific
energy absorption rate (SAR) are related to it by simple conversion formulas. In this
case, for an induced electric field E in ( Vm−1), the induced current density is given
by:
𝐽(𝑥, 𝑦, 𝑧) = 𝜎(𝑥, 𝑦, 𝑧)𝐸(𝑥, 𝑦, 𝑧) , (3.4)
where 𝜎 is the electrical conductivity (Sm−1) of the biological tissue and SAR is given
as
𝑆𝐴𝑅(𝑥, 𝑦, 𝑧) =𝜎(𝑥,𝑦,𝑧)|𝐸(𝑥,𝑦,𝑧)|𝑟𝑚𝑠
2
𝜌(𝑥,𝑦,𝑧) [
𝑊
𝑘𝑔] (3.5)
Where ρ is the mass density of the tissue (kg m−3).

Interaction between Handset Antenna and User
27
The section 2.5 gave an overview about absorption of radiation into the user, and in
this section, the mechanisms of interaction and the dielectric properties of the human
body tissues are presented.
Biophysical mechanisms of interaction
The electromagnetic energy is known as being carried by photons or quanta, and the
energy of the photon is given by:
𝐸 = ℎ𝑓 (3.6)
Where h is the Planck’s constant = 4.1356 × 10⁻¹⁵ eVs, f: frequency of the waves in
Hz. The higher the frequency, the higher the energy per photon, and a definite amount
of photon energy is required to produce ionization by ejection of orbital electrons
from atoms of the material through which an electromagnetic wave propagates. The
minimum photon energies capable of producing ionization in water and in atomic
carbon, hydrogen, nitrogen, and oxygen are between 12.4 and 25 eV. Inasmuch as
these atoms constitute the basic elements of living organisms, 12.4 eV may be
considered as the lower limit for ionization in biological systems, giving a frequency
limit of 3 PHz. Figure 3-6 shows the electromagnetic spectrum, the non-ionizing
frequency (DC to 3×10¹⁵ Hz), and the Ionizing frequency above 3×10¹⁵ Hz .
Figure 3-6: The electromagnetic spectrum and non-ionizing and ionizing bands; from
[18].

Interaction between Handset Antenna and User
28
A single photon of radio frequency RF and microwave MW radiation 300 Hz to 300
GHz has relatively low energy levels, less than 1.24 meV; therefore, it is not capable
of ionization. Accordingly, electromagnetic radiation in the RF&MW spectrums is
regarded as nonionizing radiation. That means, the tissue heating is the dominant
interaction mechanism of microwave radiation with biological systems.
Dielectric properties of human body tissues
When an electromagnetic wave propagates in a material whose electrical conductivity
σ differs from zero, as is the case in all human tissues, dissipation losses are caused
due to the current density generated according to Ohm’s law:
𝐽 = 𝜎�⃗⃗� (3.7)
Part of the power in the electromagnetic field thus turns into heat. The dielectric
properties of human tissue, i.e., permittivity and conductivity, are considered to
decrease with age due to the changes of water content and organic composition of
tissues.
The dielectric properties of a material characterized by its complex permittivity are
defined in the following way:
휀 = 휀o휀r = 휀o(휀r, − 𝑗휀r
,,) (3.8)
휀r = 휀r, − 𝑗(𝜎eff 𝜔휀𝑜⁄ ) = 휀r
, (1 − 𝑗𝜀r,,
𝜀r, ) = 휀r
, (1 − 𝑗𝑡𝑎𝑛𝛿) (3.9)
where 휀o is the free space permittivity (8.854 ×10⁻¹²F/m), 휀 , the real part of complex
permittivity, 휀 ,, the imaginary part of complex permittivity and 𝜔 = 2𝜋𝑓 the angular
frequency, and tan δ is the loss tangent. The imaginary part of the relative permittivity
휀r:
𝐼𝑚{휀r} = 𝜎eff 𝜔휀𝑜⁄ (3.10)
Can be considered to represent all losses in the material. Here, all the losses,
including(ionic) conductivity losses and dielectric losses are described by the effective
conductivity 𝜎eff. Because all human tissues are non-magnetic materials, no losses due
to permeability μ occur.
To be able to model the behaviour of radio wave propagation inside dielectric
material, accurate knowledge of the values of dielectric parameters of the material is
required. In case of a human, tissues inside the body can be roughly divided into two

Interaction between Handset Antenna and User
29
categories. Tissues that have high water content, like muscle or skin, have high values
of real part of permittivity 휀r, and losses described by the effective conductivity 𝜎eff
are high, as well. On the other hand, in materials that have low water content 휀𝑟` is low
and 𝜎eff is low. Examples of such materials are bone and fat. The frequency
dependence of dielectric parameters of human tissues was studied in [19]. A model for
determining the tissue parameters over the frequency range of 10 Hz - 100 GHz is
presented in that paper.
In Table 3-1, values of 휀𝑟, and 𝜎eff for head tissue equivalent material relevant in the
studies that consider interaction between mobile terminal antennas and users are
presented for the frequency range 750 MHz – 2.3 GHz. Values given in the table are
based on the parametric model described in [11], [19]and will be used in simulations
and measurements later in the thesis.
Table 3-1 : Dielectric properties of head tissue-equivalent material in the 750 MHz to
2300 MHz frequency range.
SAR Generation
Even if radio wave propagation in a lossy material can be described precisely by
application of Maxwell’s theory, the connection between the field inside a dielectric
tissue and the original external electromagnetic field generated by a mobile terminal
antenna is not fully explained. The related studies have mostly focused on determining
the SAR characteristics related to concrete certain arrangements, while the general
energy absorption mechanism has been left with less consideration. In addition, results
of studies concerning the issue are quite diverging [20], [21] , [22].
Frequency
(MHz)Relative permittivity
Conductivity (σ)
(S/m)
750 41.9 0.89
835 41.5 0.90
900 41.5 0.97
1450 40.5 1.2
1500 40.4 1.23
1640 40.2 1.31
1750 40.1 1.37
1800/1900/2000 40.0 1.40
2100 39.8 1.49
2300 39.5 1.67
( , )
Effective
conductivity
(𝝈𝐞𝐟𝐟) (S/m)
Interaction between Handset Antenna and User
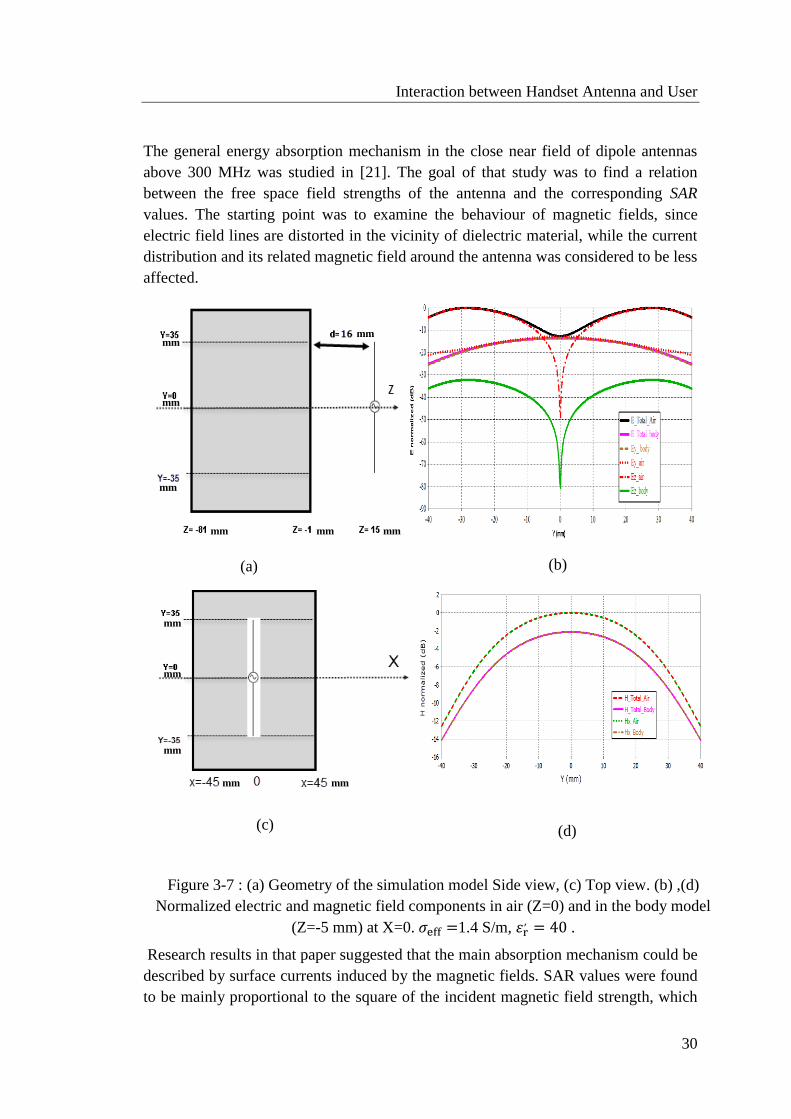
30
The general energy absorption mechanism in the close near field of dipole antennas
above 300 MHz was studied in [21]. The goal of that study was to find a relation
between the free space field strengths of the antenna and the corresponding SAR
values. The starting point was to examine the behaviour of magnetic fields, since
electric field lines are distorted in the vicinity of dielectric material, while the current
distribution and its related magnetic field around the antenna was considered to be less
affected.
Research results in that paper suggested that the main absorption mechanism could be
described by surface currents induced by the magnetic fields. SAR values were found
to be mainly proportional to the square of the incident magnetic field strength, which
mm
(a) (b)
(d) (c)
Figure 3-7 : (a) Geometry of the simulation model Side view, (c) Top view. (b) ,(d)
Normalized electric and magnetic field components in air (Z=0) and in the body model
(Z=-5 mm) at X=0. 𝜎eff =1.4 S/m, 휀r, = 40 .
mm mm mm
mm
mm
mm mm
mm
mm mm
mm
mm
Interaction between Handset Antenna and User
31
led to the conclusion that the spatial peak SAR is related to the antenna spatial peak
current. Consequently, it was concluded that coupling of electric fields would be of
minor importance.
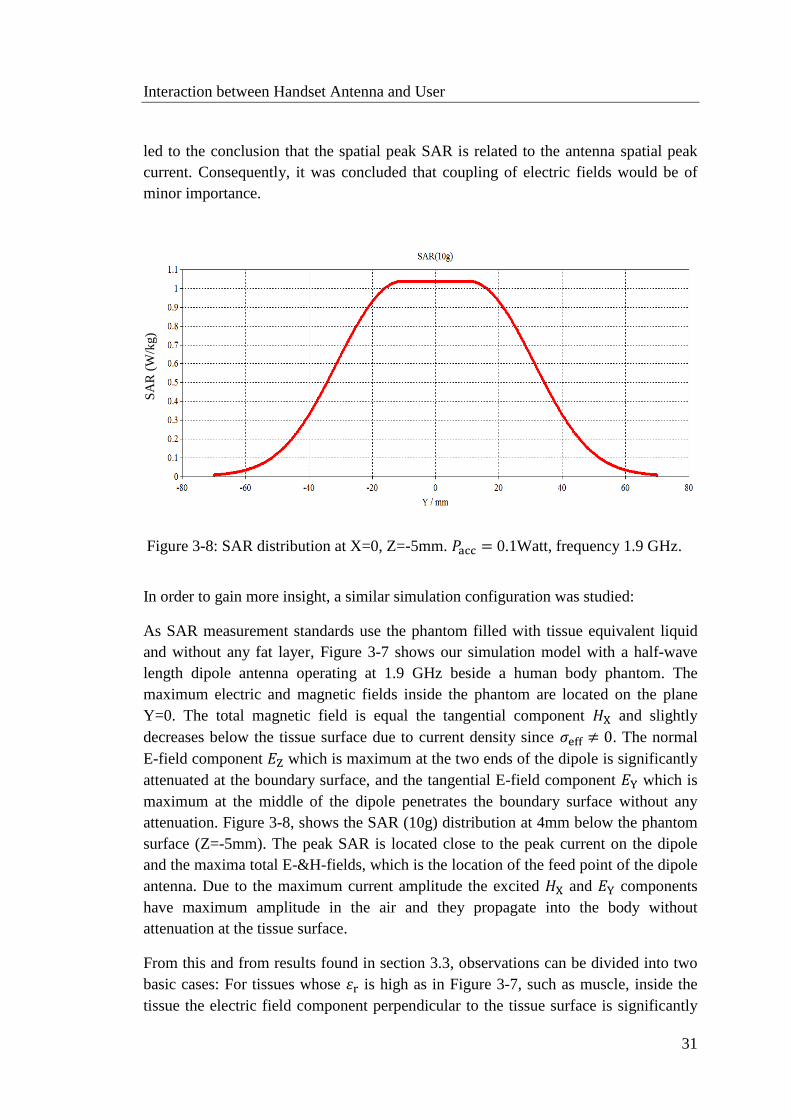
In order to gain more insight, a similar simulation configuration was studied:
As SAR measurement standards use the phantom filled with tissue equivalent liquid
and without any fat layer, Figure 3-7 shows our simulation model with a half-wave
length dipole antenna operating at 1.9 GHz beside a human body phantom. The
maximum electric and magnetic fields inside the phantom are located on the plane
Y=0. The total magnetic field is equal the tangential component 𝐻X and slightly
decreases below the tissue surface due to current density since 𝜎eff ≠ 0. The normal
E-field component 𝐸Z which is maximum at the two ends of the dipole is significantly
attenuated at the boundary surface, and the tangential E-field component 𝐸Y which is
maximum at the middle of the dipole penetrates the boundary surface without any
attenuation. Figure 3-8, shows the SAR (10g) distribution at 4mm below the phantom
surface (Z=-5mm). The peak SAR is located close to the peak current on the dipole
and the maxima total E-&H-fields, which is the location of the feed point of the dipole
antenna. Due to the maximum current amplitude the excited 𝐻X and 𝐸Y components
have maximum amplitude in the air and they propagate into the body without
attenuation at the tissue surface.
From this and from results found in section 3.3, observations can be divided into two
basic cases: For tissues whose 휀r is high as in Figure 3-7, such as muscle, inside the
tissue the electric field component perpendicular to the tissue surface is significantly
Figure 3-8: SAR distribution at X=0, Z=-5mm. 𝑃acc = 0.1Watt, frequency 1.9 GHz.
SA
R (
W/k
g)
Interaction between Handset Antenna and User
32
attenuated at the tissue surface, and thus the SAR maxima are found in locations
where the total electric field in air is moderate, but the component parallel to the
surface is significant.
For low-permittivity tissues, like fat, the SAR maxima were found in [21] close to
locations where the perpendicular electric field was strong also in free space, because
in this case the attenuation of the normal component is small as has be seen before in
section 3.3 for 휀r, = 5 .
From these results, we can conclude that in mobile phones the highest SAR areas
(known as hot spots) coincide with high surface current regions on the chassis, which
are excited by the antenna and which generate high tangential electric and magnetic
field at the head-to-air interface. This will be investigated further in chapter 5.
Antenna parameters in the vicinity of a user
The deterioration of the performance of the mobile terminal antenna located close to
the human body is due to the fact that the human tissue consists of a lossy dielectric
material [23]. From the graphs presented in Figure 3-4, 3-5, it can be concluded that in
mobile communications the user is commonly situated in the reactive near field of the
antenna, meaning that the parameters of the antenna are very likely disturbed.
In most cases these disturbances are case specific, and an exact prediction of the
problem is difficult. Nevertheless, some theoretical background of how the dielectric
loading would affect the antenna operation can be found.
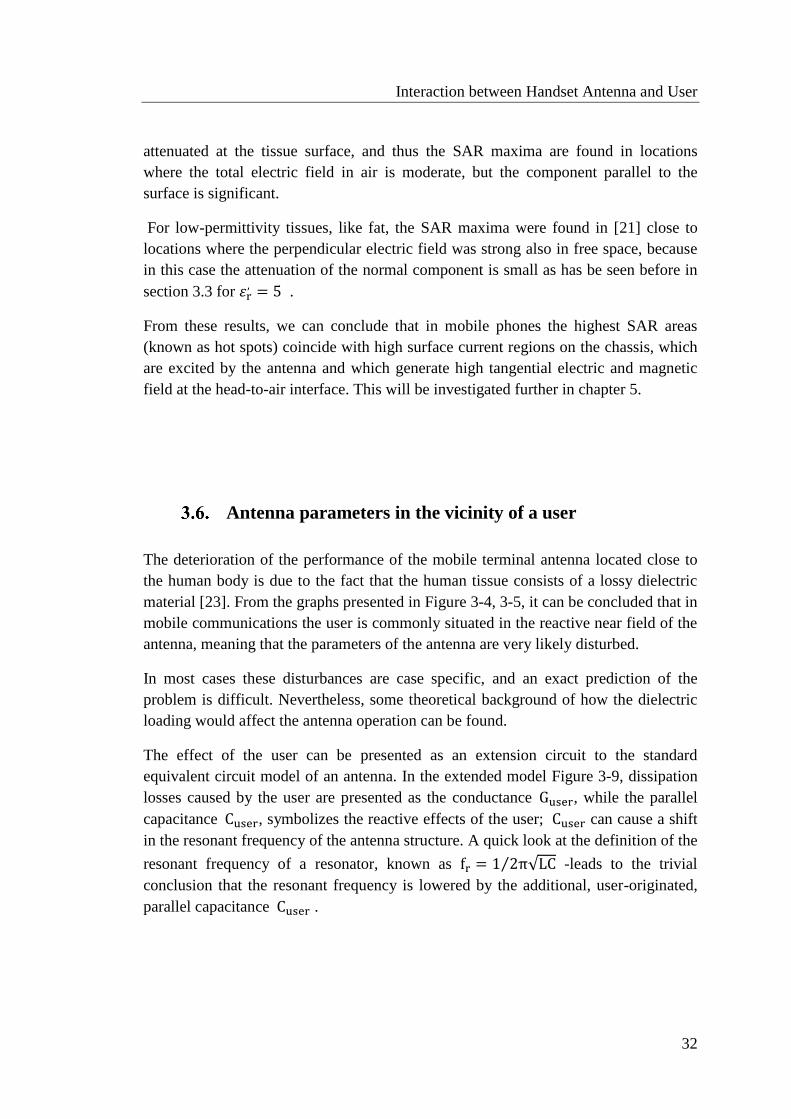
The effect of the user can be presented as an extension circuit to the standard
equivalent circuit model of an antenna. In the extended model Figure 3-9, dissipation
losses caused by the user are presented as the conductance Guser, while the parallel
capacitance Cuser, symbolizes the reactive effects of the user; Cuser can cause a shift
in the resonant frequency of the antenna structure. A quick look at the definition of the
resonant frequency of a resonator, known as fr = 1 2π√LC⁄ -leads to the trivial
conclusion that the resonant frequency is lowered by the additional, user-originated,
parallel capacitance Cuser .
Interaction between Handset Antenna and User
33
Figure 3-9: Equivalent circuit model of an antenna, including the effect of the user.

Numerical Techniques
34
Chapter 4
4. EM Simulation Technology (Numerical Techniques)
The current evolution of wireless personal communications has necessitated a
comprehensive understanding of electromagnetic (EM) interactions between handset
antennas and the human body.
These human-antenna interactions influence the electromagnetic performance of the
antenna by altering antenna input impedance, and modifying the antenna radiation
patterns and polarization state, absorbing antenna-delivered power, and so on.
Also questions concerning health hazards have necessitated a more thorough
evaluation and characterization of the specific absorption rate (SAR) in the human
tissue. Recently, significant progress in understanding human–antenna interactions has
been achieved due to advanced computational techniques as well as accurate near field
measurements.
Common numerical techniques, Figure 4-1, currently used for electromagnetic
interaction computations are finite difference time domain (FDTD) method, the
method of moments (MoM), the finite element method (FEM), and in addition,
software codes that use hybrid methods, software that applies more than one
Maxwell’s
Equations
Numerical Methods
Integral
Equation
Based
FD
(Frequency Domain)
MoM
TD
(Time Domain)
Differential
Equation
Based
FD
(Frequency Domain)
TD
(Time Domain)
FDTD
Figure 4-1: Common numerical techniques

Interaction between Handset Antenna and User
35
numerical method. All these techniques are using numerical approximations of
Maxwell’s equation to calculate the electromagnetic fields.
In the Finite Difference Time Domain Method FDTD the discretization grid is
rectangular in general and the Maxwell equations are discretized by simple finite
difference equations [24]. The solution is created via a time step-by-step propagation
on the discretized grid. In most implementations there are two separate grids, one for
the unknown electric field E and one for the unknown magnetic field H components.
The two grids are displaced by a half-cell, such that the nodes of the ones are in the
centers of the other cells. The software “CST Microwave Studio” from CST AG,
which is used in this thesis, uses this method to simulate the antenna inside the mobile
phone.
The Method of Moments MOM is a numerical computational method of solving linear
partial differential equations which have been formulated as integral equations (IE)
and Green’s functions and it is sometimes called the Boundary Elements Method
(BEM). MOM is used in frequency domain and has the advantage of applying easily
to long thin wires or thin patches, and layered configurations such as EBG; these
situations can present serious challenges to the finite difference methods since they
have to discretize the entire domain where the presence of thin structures requires a
very fine mesh. The software “High Frequency Structure Simulator (HFSS)” from
Ansys in this study uses an MOM solver and this was used for simulations of antenna
backed by EBG in free space and beside the head.
The Finite Element Method FEM is used to find approximate solution of partial
differential equations (PDE) and integral equations. FEM is based on frequency
domain and each solving of the matrix system gives the solution for one frequency
[25]. Repeated runs and interpolation are used to obtain the systems response over a
frequency band. This might give problems for resonant systems, especially those with
high Q, where it is not easy to get the resonant frequency unless you sweep the
frequency carefully. One solver using FEM is called Eigen Mode in CST software,
which was used for EBG reflection phase tuning.
In the SAR simulation, the average SAR (10g) calculation employs two methods,
IEEE C95.3 and CST legacy. For each point a cube with a defined 10 g mass is found
and the power loss density is integrated over this cube, Figure 4-2.
In the standard IEEE C95.3 [26], if one face of the averaging cube is outside the tissue
the cube is invalid and an inner point with maximum SAR value is copied. Therefore,
a flat curve is seen at the phantom boundary and this method comes closer to the
measurement setup. In the standard CST legacy (CST C95.3) the averaging cube at
the boundary is increased until the biological mass reaches 10 g. In this standard, a
slowly rising curve at the boundary is seen and takes for invalid averaging volumes

Numerical Techniques
36
not the maximum but the closest valid SAR. The SAR distribution shape is different
in Figure 4.2, but the maximum averaged SAR value stays equal in both procedures.
EM simulation, fields and SAR calculations in this thesis have used these three
methods.
Search for the 10 g cube (iteratively)
Point of the average SAR calculation
At boundary, treatment depends on
chosen averaging standard: IEEE
C95.3, CST legacy.
air air
Figure 4-2: SAR Averaging procedure [CST Microwave Studio].
Grid cells
with point
SAR
Averaging
SAR volume

Analysis of near-field distribution
37
Chapter 5
5. Analysis of near-field distribution
Introduction
A review of studies [20] [21] [22] concerning the general mechanisms of interaction
between antenna and user may lead to better understanding. However, results from
these studies do not provide us with fully reliable clarification about the issue.
Especially conclusions made concerning the general energy absorption mechanism in
human tissue have been quite deviating. The study [20] concluded that the peak SAR
is not related to antenna currents, the locations of peak SAR were clarified by
exploring the real part of tissue permittivity and its effect on the electric field
components perpendicular and parallel to the surface of the tissue.
The study in [21] is discussed in chapter 3 and it is suggested that the main
absorption mechanism is current induction on the surface of human tissue by incident
magnetic fields. SAR values proportional to the square of the incident magnetic field
strength lead to the conclusion that the spatial peak SAR is related to spatial radiator
currents. In [22], the EM energy deposition into the body with and without a fat layer
at 915 MHz are presented and compared. A hot spot is observed on the muscle surface
near the antenna feed point location for the pure muscle body and as shown also in
chapter 3, two hot spots on the fat surface near the ends of the antenna are observed.
Due to low permittivity of the fat 휀𝑟 = 5.5 the vertical E-field at the end of the dipole
penetrates the boundary surface with slight dissipation loss.
In addition to the incomplete understanding of the general energy absorption
mechanism in human tissue, studies that are related to user interaction have most
commonly been case-specific, focusing simply on determining certain parameters
related to a specific problem.
However, many things were still left in the previous studies without a suitable
explanation. The main reason for the difficulties in explaining every phenomenon was
considered to be the excessive complexity of the used simulation models, which

Analysis of near-field distribution
38
included two different antenna models, two different phantoms as the head or body
model. Also, the wide frequency range in question made things more complicated.
The studies that are reported in this chapter are motivated by the lack of full
understanding of the mechanisms of how antennas actually interact with the user. The
main goal is to improve the understanding of the near field interaction with the user.
This chapter is structured in the following way. First, in Section 5.2, the used antenna
model is introduced, and properties of this particular antenna in free space are
discussed to provide us with a sufficient background and points of comparison with
the user interaction studies reported in the later parts of the thesis. In Section 5.3, the
effects of dielectric material on the field distributions of the antenna are studied by a
very simple model; field distributions inside and nearby a dielectric half space situated
beside the antenna are studied as a function of different parameters. All the presented
results in this chapter are based on simulations that have been carried out with
commercial FDTD-based software CST-Microwave Studio.
Antenna model for the simulations
The versatility and on the other hand the simplicity of the structure provided
motivation for selecting a monopole antenna structure on a mobile terminal in the user
interaction studies of this thesis.
In addition, the highest SAR values in modern handsets usually come from the
monopole antenna. As Figure 5-1 shows, two monopole antennas are used for both the
low and high frequency bands (900MHz,1900MHz), both placed on the top position
of the PCB ground plane , whose dimensions are 60 mm wide,1 mm thick and having
the popular length of 95 mm. Grilamid LV-5H (휀r=3, tanδ=0.02) standard plastic
mobile antenna carrier supports the antennas.
Figure 5-1: Geometry of the handset model with monopole antennas for 1900 MHz (high-
band antenna) and 900 MHz (low-band antenna). FR4 for the PCB with 휀r = 4.9,
tanδ=0.025.
Z
X
Y
Z
Analysis of near-field distribution
39
The following section includes discussion about the behaviour of the reflection
coefficient, current distribution and distributions of electric and magnetic near fields,
and also radiation efficiency, which is an important factor in user interaction studies.
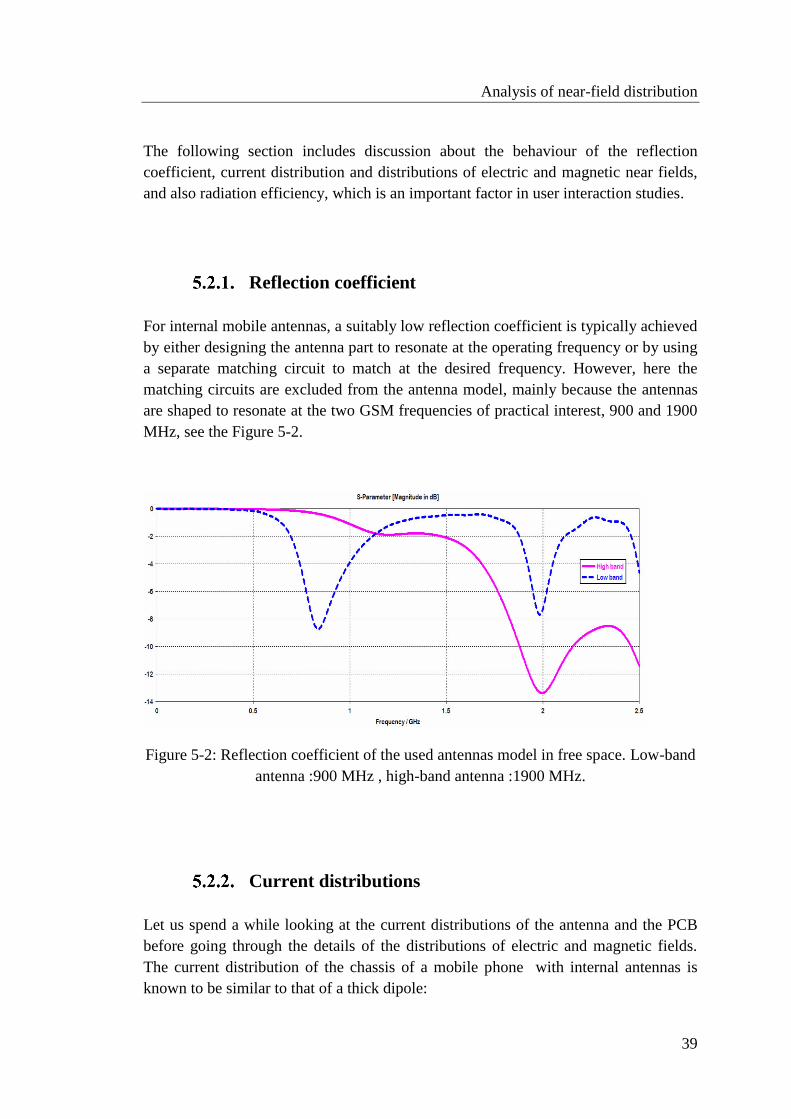
Reflection coefficient
For internal mobile antennas, a suitably low reflection coefficient is typically achieved
by either designing the antenna part to resonate at the operating frequency or by using
a separate matching circuit to match at the desired frequency. However, here the
matching circuits are excluded from the antenna model, mainly because the antennas
are shaped to resonate at the two GSM frequencies of practical interest, 900 and 1900
MHz, see the Figure 5-2.
Figure 5-2: Reflection coefficient of the used antennas model in free space. Low-band
antenna :900 MHz , high-band antenna :1900 MHz.
Current distributions
Let us spend a while looking at the current distributions of the antenna and the PCB
before going through the details of the distributions of electric and magnetic fields.
The current distribution of the chassis of a mobile phone with internal antennas is
known to be similar to that of a thick dipole:

Analysis of near-field distribution
40
Figure 5.3 illustrates current distributions on the surface of the PCB ground plane at
900 MHz and 1900 MHz. At 900 MHz , the current on the monopole and chassis has
one maximum value corresponding to a half-wave dipole type current distribution
(close to the monopole feed point). At 1900 MHz, the effective length of the
monopole with chassis is close to full-wave length, leading to two current maxima at
the surface of the PCB. The surface current is concentrating at the PCB’s edge.
The current distributions of the PCB can be interpreted as the two lowest order current
modes of the chassis [27].
The first order current mode exists when the combination of chassis and monopole
represents an electrically half-wavelength dipole. The second current mode is reached
with an electrically longer chassis.
Near field distributions
The issue of how dielectric materials and the electromagnetic fields interact with each
other was discussed in Chapter 3.Dissipation losses inside the dielectric material were
found to be caused by the electrical field inside the material. In the following sections
the issue is re-studied to improve the understanding of the process. At the beginning
of this section, the antenna field distributions are studied in free space.
Figure 5-3: Current distributions on the surface of the PCB (in free
space) at frequencies (a) 900 MHz,(b) 1900 MHz. 𝑃inc=1W.
(b) (a)

Analysis of near-field distribution
41
Figure 5-4 shows the distributions of the electric and magnetic fields in free space on
the YZ plane. The magnitudes of the fields are coded in colours, and all values are
normalized to 1 W input power. The fields are noted at 900 MHz and 1900 MHz. It
can be seen that at 900 MHz the resonator of antenna and chassis is excited close to
the first resonance mode and at 1900 MHz is close to the second one.
At 900 MHz the electric field (a) is strong around both ends of the resonator (PCB +
Antenna) and similar to a half wave dipole. Magnetic field (c) is concentrated
significantly around the vertical (Y direction) feed point of the antenna. At 1900 MHz
the length of the PCB is close to full wavelength, therefore the current has two
maxima in z-direction along the PCB and a minimum close to the center of the PCB.
Figure 5-4 : Field distributions on YZ-plane(X=0mm) in free space. 𝑃inc=1W,
(a) E field at 900 MHz,(b) E field at 1900 MHz,(c) H field at 900 MHz,(d) H
field at 1900 MHz .
Y (a) (b)
(c) (d)
Z

Analysis of near-field distribution
42
Consequently, the electric field has a strong area around the center of the PCB in
addition to the strong areas at the ends of the resonator, and magnetic field high values
around areas in which the current on the resonator is high. The relation between
surface currents and fields of the antenna can be detected by comparing Figures 5-3
and 5-4.
The effect of chassis length on antenna
performance and SAR
The effect of the handset chassis (PCB) length on the antenna performance and
interaction between the antenna and near dielectric material was studied before [2],
[28], [29]. While most of the earlier studies were done with PIFA or capacitive
coupling element, in this chapter the chassis with monopole antenna is simulated near
a dielectric block of 120 x 180 x 110 mm3. Distance between the ground plane of the
antenna (PCB) and the dielectric block is d=10mm.The dielectric block has properties
of head tissue-equivalent material given before in Table 3.1.
Figure 5-5: Radiation efficiency of the two antennas beside the dielectric block and
peak SAR(10g) at 4 mm below the surface of the dielectric block; 𝑃acc= 0.2 W.
The length of 95 mm of the chassis (as in Figure 5-1) is less than half-wavelength at
900 MHz; from the Figure 5-5 it can be seen, that the radiation efficiency is low at this
chassis length, and as the chassis length increases, efficiency increases rapidly, while
the peak SAR value decreases. This can be explained by the increasing distribution of
the current over the chassis length when the length approaches half-wavelength. With
this, the peak current density on the chassis and the peak current density inside the
dielectric block reduce accordingly. Since the power dissipation (SAR) is proportional

Analysis of near-field distribution
43
to the product of current density and E-field, see (3.5), the peak SAR reduces more
than proportional and even the total dissipated power(used to calculate the radiation
efficiency) reduces.
Figure 5-6: SAR distribution in XY-plane at 4mm below the surface of the
dielectric block, at frequency 900 MHz as function of chassis length; 𝑃acc= 0.2 W.
λ/8 ≈ 40mm λ/4 ≈ 80mm
λ/2 ≈ 160mm 3λ/8 ≈ 120mm
Figure 5-7 : SAR distribution in XY-plane at 4mm below the surface of the
dielectric block, at frequency1900 MHz as function of chassis length; 𝑃acc= 0.2 W.
λ/2 ≈ 80mm
λ ≈ 160mm 3λ/4 ≈ 120mm
λ/4 ≈ 40mm

Analysis of near-field distribution
44
At 1900 MHz, the monopole antenna is the main radiator and the effect of the ground
plane current mode on the radiation efficiency is small. However, we see a similar
effect on the peak SAR when the surface current approaches the half-wavelength
distribution near 80 mm length. Figure 5-6 and Figure 5-7 show the SAR distribution
with IEEE C95.3 calculation standard at 900 MHz and 1900 MHz respectively.
In all cases at 1900 MHz, the current distribution is more concentrated close to the
monopole (even in λ/2 –case) than at 900 MHz. Never-the-less , the peak SAR values
at 1900 MHz reduce in a similar pattern as at 900 MHz , producing a minimum at
half-wavelength due to the effective current distribution over most of the chassis.
It is interesting to see that the radiation efficiency is less at 900 MHz than at 1900
MHz even at chassis sizes larger than 100 mm where peak SAR is lower at 900 MHz.
This is an indication of the much smaller decay of the reactive near field at 900 MHz
which extends into the lossy dielectric medium and creates the dissipation loss over a
larger volume than at 1900 MHz.
From the Figure5-6 & Figure 5-7, it is found for mobile phones with chassis length 90
to 110 mm, that for 900 MHz the SAR distribution is dominated by the chassis
currents, in accordance with the location of the peak SAR values at the center of the
chassis. For the higher frequency (1900 MHz), the main contributor is the antenna,
since the location of peak SAR follows the location of the antenna.
When the chassis is longer than 95 mm, the peak SAR (10g) at 4 mm below the
phantom surface at 1900 MHz is higher than at 900 MHz. Since the transmit power to
cover the requirements of WCDMA can be as high as 30 dBm, the 1900 MHz band is
considered critical with respect to SAR limits.

SAR Control Mechanisms
45
Chapter 6
6. SAR control mechanisms and concepts for mobile
phone antennas with reduced SAR
Introduction:
As we already see from the analysis of absorption mechanisms for mobile phones and
behaviour of mobile terminal antennas near dielectric material, the currents of the
chassis at the low cellular frequencies (GSM 900) and of the antenna element at the
high cellular frequencies (GSM 1900) cause high peak SAR values, which especially
at the GSM 1900 band is quite often problematic. Most of earlier studies on SAR
reduction methods are of limited use because the antenna efficiency in free space
before and after reduction of SAR was neglected, or because there is not enough space
in the phone to realize the proposed concept. This is why the actual solution in present
commercial phone products is simply reducing the input power of the antenna.
In this chapter, SAR control mechanisms and state of the art solutions for reducing
SAR of internal antennas are introduced. In addition, some own solutions are
proposed with simulation and experimental results.
State of the art of SAR control:
From earlier studies, solutions to SAR control for mobile phones can be categorized
into three methods: Controlling the direction of radiation to weaken radiation toward
the human body by redirecting the currents on the chassis, optimizing the
antenna/PCB configuration and shielding the EM fields against the human body.
Parasitic elements, directive control antenna pairs fed in 180° phase difference,
wavetraps and slots in the PCB ground plane are the methods used to control the
current distribution and the direction of radiation in the near field, while ferrite,
conductors and AMC (Artificial Magnetic Conductor) can be used to disperse or
attenuate the EM fields radiated against the human body.

SAR Control Mechanisms
46
Parasitic Elements
The proposed method in [30] comprised a (900/1800 MHz) PIFA combined with a
parasitic radiator placed on the backside of the ground plane and connected by two
conductors. It was shown in [30] that peak SAR reached a minimum when the length
of the parasitic radiator was L=45 mm (at 900 MHz). When the results were compared
to the case when no parasitic radiator was attached to the ground plane, the SAR
reduced by approximately 5 dB in the simulations (from 1.5 W/kg to 0.5 W/kg for
0.25 W antenna accepted power). In measurements, the reported reduction in SAR
was 6 dB, total efficiency in talk-position (beside phantom) was approximately 1 dB
higher with the 45 mm long parasitic radiator compared to the reference case (no
parasitic radiator). Even if this SAR control method seems to be working quite nicely
at 900 MHz, the operating principle of the parasitic radiator was left somewhat
unclear at 1900 MHz. It was only mentioned that the effect of the parasitic radiator
would be to cancel a part of the near field that is coupled into the head. Furthermore, it
was concluded that the cancellation of the near field would be caused by the currents
of the parasitic radiator, which are opposite in direction to the currents on the chassis.
Figure 6-1 : Geometry of the simulation structure, showing PIFA antenna with
parasitic element, both above the dielectric block (body) 𝜎eff =1.4 S/m, 휀𝑟, = 40.
The concept was investigated by an own simulation using CST Microwave Studio.
Figure 6-1 shows the simulation structure of an antenna model including a parasitic
element as a SAR shield sitting beside a dielectric block. A PIFA antenna is mounted
on a metal chassis (45×100 mm) with a metal parasitic radiator (L×45 mm) on the
backside. A dielectric block is located at 10 mm below the structure and filled with
head tissue equivalent material; dimensions of the dielectric block (Body) are 120 ×
180 × 110 mm3, L is 45 mm for 900 MHz and 22 mm for 1900 MHz .
Y
Z

SAR Control Mechanisms
47
From the Figures 6-2, 6-3, it is observed that at 900 MHz this method can reduce SAR
(10g) from 1.2 W/Kg to 0.87 W/Kg with a corresponding 1.5 dB increase in the
efficiency beside the dielectric block, due to reduced E-field in the block (body) where
most of the losses are generated. While the free space radiation efficiency is very
slightly reduced by 0.12 dB at 900 MHz, and at the high frequency 1900 MHz the
peak SAR is not affected by the parasitic radiator.
Figure 6-2: Radiation efficiency at low-band (900 MHz) without and with parasitic
element, L=45 mm, (a) in free space, (b) beside the body.
(a) (b)

SAR Control Mechanisms
48
Figure 6-4 shows the radiation pattern of the PIFA antenna with and without parasitic
element at 900 MHz and 1900 MHz. At 1900 MHz the radiation pattern is not affected
by the parasitic element with L=45 mm; therefore the parasitic element is a good
solution to reduce SAR at 900 MHz without affecting the antenna parameters at 1900
MHz.
With a parasitic element’s length of L=22 mm ,matched for the high frequency 1900
MHz, the max SAR value is even slightly increased, Figure 6-5; therefore the parasitic
element could not be a solution for high SAR at the critical frequency 1900 MHz.
(a): 900 MHz with parasitic element (b): 900 MHz without parasitic element
(c): 1900 MHz with parasitic element (d): 1900 MHz without parasitic element
Figure 6-3: Simulated SAR distribution inside the dielectric block (body) 4mm
below the surface at 900 MHz and 1900 MHz. 𝑃acc=0.25 W , L=45 mm.

SAR Control Mechanisms
49
1900 MHz 900 MHz
Figure 6-5: Simulated SAR distribution inside the dielectric block (body) 4mm below
the surface at 1900 MHz . 𝑃acc=0.25 W, L= 22 mm.
(a): 1900 MHz with parasitic element,
Peak SAR(10g)=0.722 w/kg
(b): 1900 MHz without parasitic element,
Peak SAR(10g)=0.65 w/kg
Figure 6-4: Far-field radiation pattern of PIFA antenna at 900 MHz and 1900 MHz, in free
space or near block and with or without parasitic element.

SAR Control Mechanisms
50
WaveTraps:
As was shown, the chassis of the mobile terminal has a significant effect on the
antenna operation because the chassis operates as a significant radiator below 2 GHz.
In [31], wavetraps are used to control the current distribution on the chassis and by
this the near field of a mobile terminal antenna at GSM 900 and GSM 1900
frequencies. This concept was investigated by own simulations:
Figure 6-6 shows the structure with wavetraps after [31], which work efficiently when
they are in resonance, i.e. the structure represents a quarter wavelength transmission
line, with the impedance equation:
𝑍in = j𝑍otan (𝛾𝐿WT) (6.1)
𝑍o: The characteristic impedance of the transmission line formed by the wavetraps
and the ground plane, 𝐿WT is the length of the wavetrap, γ=α+jβ is the propagation
constant with real part α being the attenuation constant and imaginary part β being the
phase constant.
Figure 6-6 : Low-band 960 MHz terminal antenna with 8 mm height of the monopole
antenna, and wavetraps height 𝐷WT =0.5 mm above the ground plane and thickness
T=6mm, 𝐿WT=77mm, 𝐿GP,
=40 mm (after [31]).
Without wavetraps Figure 6-7 (b) the chassis shows a thick half-wavelength dipole-
type current distribution, and the currents induced by the antenna element are
concentrated at the edges of the chassis.
Short
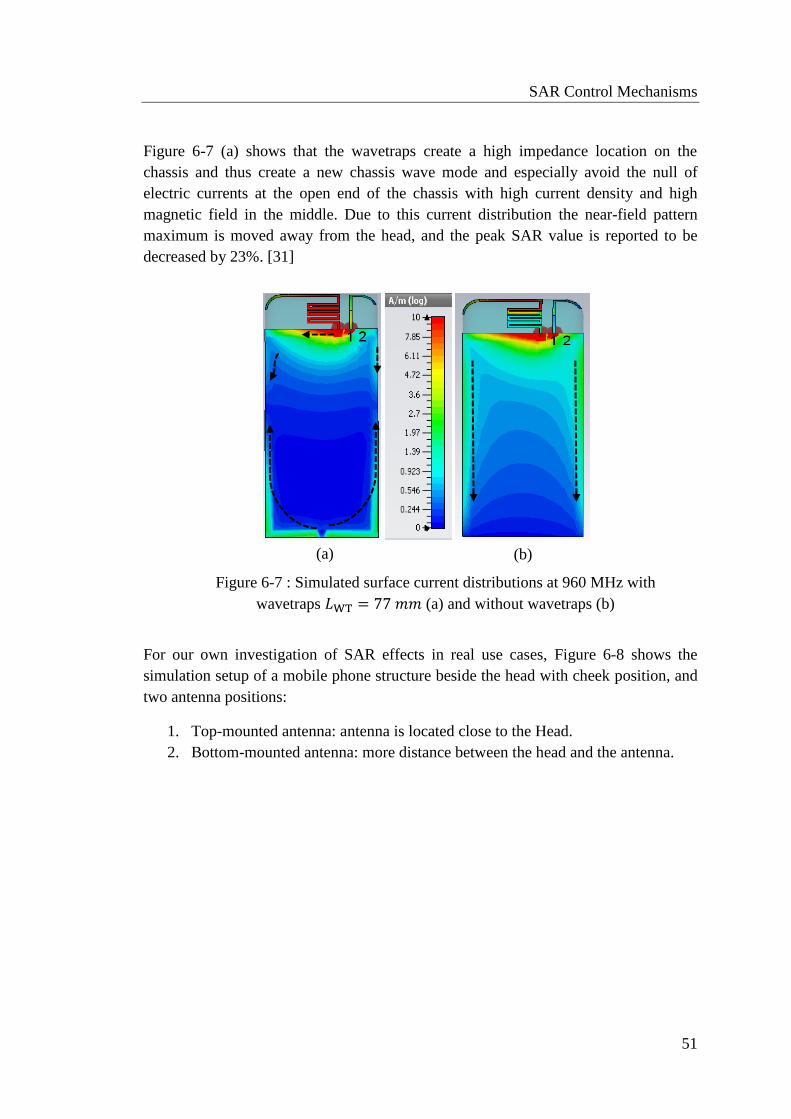
SAR Control Mechanisms
51
Figure 6-7 (a) shows that the wavetraps create a high impedance location on the
chassis and thus create a new chassis wave mode and especially avoid the null of
electric currents at the open end of the chassis with high current density and high
magnetic field in the middle. Due to this current distribution the near-field pattern
maximum is moved away from the head, and the peak SAR value is reported to be
decreased by 23%. [31]
For our own investigation of SAR effects in real use cases, Figure 6-8 shows the
simulation setup of a mobile phone structure beside the head with cheek position, and
two antenna positions:
1. Top-mounted antenna: antenna is located close to the Head.
2. Bottom-mounted antenna: more distance between the head and the antenna.
Figure 6-7 : Simulated surface current distributions at 960 MHz with
wavetraps 𝐿WT = 77 𝑚𝑚 (a) and without wavetraps (b)
(a) (b)

SAR Control Mechanisms
52
For the top-mounted antenna position, simulation results in Figure 6-9 show the E-
field & H-field distribution close to the head with and without wavetraps at the
resonance frequency of the wavetraps 960 MHz.
Figure 6-9 : Simulated E & H field distributions for the top-mounted low-band
monopole antenna beside the head, with and without wavetraps at the resonance
frequency of the wavetraps 960 MHz.
E-Field without wavetraps E-Field with wavetraps
H-Field without wavetraps H-Field with wavetraps
Figure 6-8 : Simulation of the mobile phone beside the phantom
head in cheek position.

SAR Control Mechanisms
53
Figure 6-11: SAR distributions inside the phantom’s head at 960 MHz, with and
without wavetraps, in top mounted antenna configuration, 𝑃acc=0.25 W.
The effect of the wavetraps operated at its λ/4-resonance is seen at 960 MHz from the
change in the E&H-field distributions, where the new maximum E-field and minimum
H-field appear at the center of the PCB (open-circuit of wavetraps), producing
reduction in the E&H-field distributions inside the phantom, while increasing the
E&H-field outside the phantom. Therefore, the SAR peak value is reduced from 2.18
Without wavetraps. With wavetraps.
Figure 6-10: Simulated antenna radiation efficiency and peak SAR (10g) values
with/without wavetraps for the top-mounted low-band monopole antenna beside
the phantom’s head, 𝑃acc=0.25 W.

SAR Control Mechanisms
54
to 1.53 W/kg, as seen in Figure 6-10 as a function of frequency. By this, also the
radiation efficiency increases by nearly 2dB.
Figure 6-11 shows the SAR distribution for this case. We see that the peak SAR
position still is the same with and without wavetraps, and remains close to the feed
point of the top-mounted monopole antenna, yet the peak SAR level is lower with the
wavetraps.
Most of the handsets in the market have the bottom mounted antenna position,
because of the favoured antenna type has shifted from PIFA (metal ground between
the antenna and the user) to monopole type (off ground antenna concept), which has
higher SAR value compared to PIFA antenna ,and with the bottom-mounted
monopole antenna has less interaction between the antenna and the user’s body .
Figure 6-12 shows the E- field & H-field distributions close to the head with and
without wavetraps at 960 MHz in bottom-mounted antenna configuration.
H-Field with wavetraps
E-Field with wavetraps E-Field without wavetraps
H-Field without wavetraps
Figure 6-12: Simulated E-& H-field distributions for the bottom mounted low-band
monopole antenna beside the head, with and without wavetraps at the resonance
frequency of the wavetraps 960 MHz, 𝑃acc=0.25 W.

SAR Control Mechanisms
55
Figure 6-13 : Simulated antenna radiation efficiency and peak SAR (10g) values
with/without wavetraps beside the phantom’s head in bottom-mounted antenna
configuration, 𝑃acc=0.25 W.
Due to the location of the open end of the wavetraps, strong E-&H-fields move closer
to the head, producing higher magnitudes inside the phantom’s head. As a
consequence, Figure 6-13 shows that the peak SAR at the wavetraps resonance
frequency is increased while the antenna efficiency drops due to the wavetraps.
Figure 6-14: SAR distributions inside the phantom’s head, SAR (10g) values are 1.7 W/kg
standard antenna without wavetraps, 2.27 w/kg with wavetraps at 960 MHz, 𝑃acc=0.25 W.
Without wavetraps
)
With wavetraps
)

SAR Control Mechanisms
56
Figure 6-14 plots the SAR distributions and the peak SAR location inside the phantom
by 4 mm with and without wavetraps. Due to the shift of the surface current
distribution to the upper end the hot spot (peak SAR location) move to the upper end
of the PCB, compared to the case without the wavetraps.
From the wavetraps investigation, it is found that they are not suitable as solution to
reduce SAR in all antenna positions. In addition the wavetraps have some
disadvantages, such as size, operation bandwidth, and require careful design to avoid
high SAR and lower antenna efficiency under special user conditions, and due to the
effect of the battery, metal cover, and other relevant parts of real handset on the
wavetraps functionality. Due to these disadvantages, no further study is done at the
GSM 1900 band.
Directive control antenna
This solution is used to control the direction of radiation pattern so as to weaken
radiation toward the human body [32], [33]. In the study [32], the dividing feed
directive control antenna (DFDCA) is proposed for a clamshell type handy phone.
Figure 6-15: Antenna structure with power divider and 90° phase shifter and switch, at
2.14GHz; from [32] .
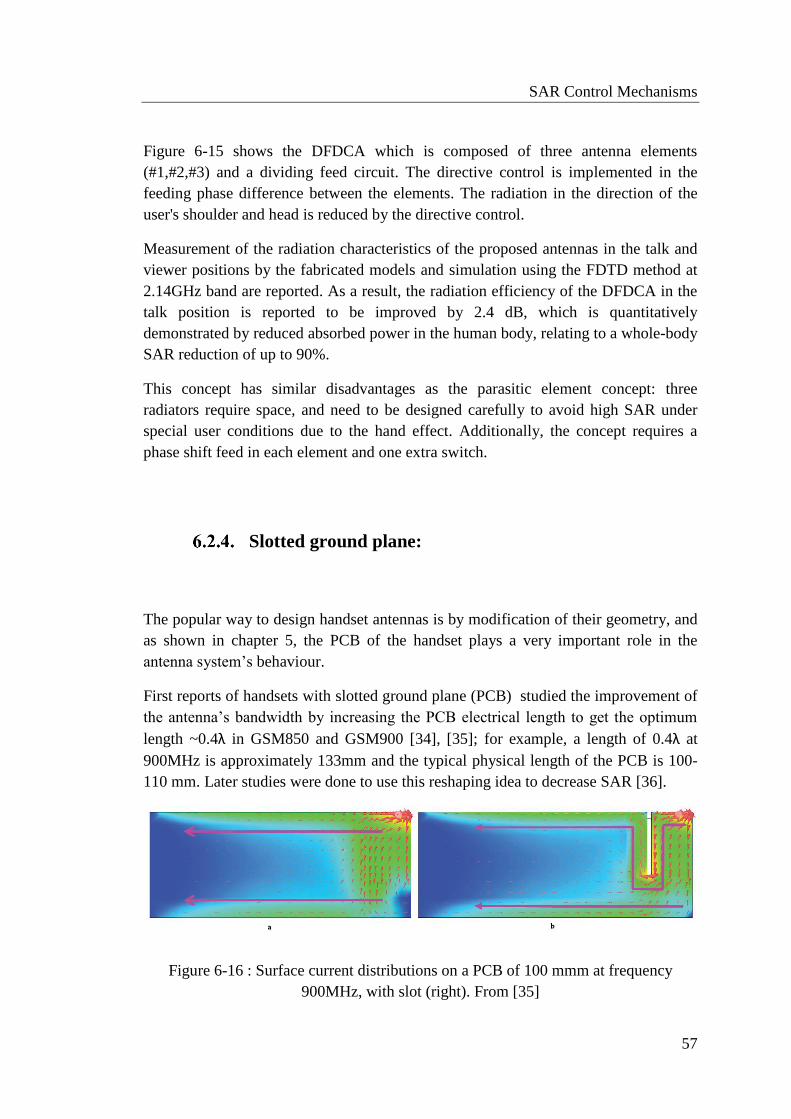
SAR Control Mechanisms
57
Figure 6-15 shows the DFDCA which is composed of three antenna elements
(#1,#2,#3) and a dividing feed circuit. The directive control is implemented in the
feeding phase difference between the elements. The radiation in the direction of the
user's shoulder and head is reduced by the directive control.
Measurement of the radiation characteristics of the proposed antennas in the talk and
viewer positions by the fabricated models and simulation using the FDTD method at
2.14GHz band are reported. As a result, the radiation efficiency of the DFDCA in the
talk position is reported to be improved by 2.4 dB, which is quantitatively
demonstrated by reduced absorbed power in the human body, relating to a whole-body
SAR reduction of up to 90%.
This concept has similar disadvantages as the parasitic element concept: three
radiators require space, and need to be designed carefully to avoid high SAR under
special user conditions due to the hand effect. Additionally, the concept requires a
phase shift feed in each element and one extra switch.
Slotted ground plane:
The popular way to design handset antennas is by modification of their geometry, and
as shown in chapter 5, the PCB of the handset plays a very important role in the
antenna system’s behaviour.
First reports of handsets with slotted ground plane (PCB) studied the improvement of
the antenna’s bandwidth by increasing the PCB electrical length to get the optimum
length ~0.4λ in GSM850 and GSM900 [34], [35]; for example, a length of 0.4λ at
900MHz is approximately 133mm and the typical physical length of the PCB is 100-
110 mm. Later studies were done to use this reshaping idea to decrease SAR [36].
Figure 6-16 : Surface current distributions on a PCB of 100 mmm at frequency
900MHz, with slot (right). From [35]

SAR Control Mechanisms
58
.For illustration, Figure 6-16 shows the simulated surface current distribution on a
PCB with and without a slot. The reforming of the current distribution increases the
electrical length of the PCB. Reference [35] studies the reduction of the interaction
between the head and the handset PIFA antenna by using a slotted ground plane and
evaluates two positions top and bottom. At 900 MHz, which was representative of
the low-frequency region, the SAR values did not vary between the top (up) and
bottom (down) mounted antenna positions.
In the first position, the handset’s antenna is located near the phantom ear (up
position), in the second position, the handset device was rotated 180°(down
position),and SAR is decreased in high-band 1900 from 2.7 to 1.2 W/kg (70%) and
radiation efficiency is improved 67% with the U-shaped slot in its ground plane and
up position ,Figure 6-17.
Figure 6-17: The measured SAR (1g) values for the PIFA with slot when the handset
antenna was located above the phantom's ear (up position), and for a 180° rotation
(down position).From [35]
The high frequency selectivity of the slot was the first problem with using a slot in the
PCB as high SAR solution in handsets. The second problem can arise in the practical

SAR Control Mechanisms
59
structure from the effect of the metal parts (battery, battery metal cover,..) on the slots
functionality.
Advanced concepts for SAR control:
In this part some concepts for SAR reduction are presented, and evaluated. iSAR is
used as SAR measurement tool to evaluate the SAR distribution improvements.
Antenna Type Optimization (Dual-Loop,)
In practical handsets, most monopole type antennas suffer from excessive SAR
values; therefore antenna designers seek antennas with multiband capabilities and low
SAR values. As one suitable candidate, Figure 6-18 shows a single-loop antenna,
which is a multiple-resonance antenna; this antenna can lead to small-excited surface
current distributions on the system ground plane (PCB).
Figure 6-18: Principle layout of a single-loop antenna mounted on the
PCB with one feed pin and short pin.
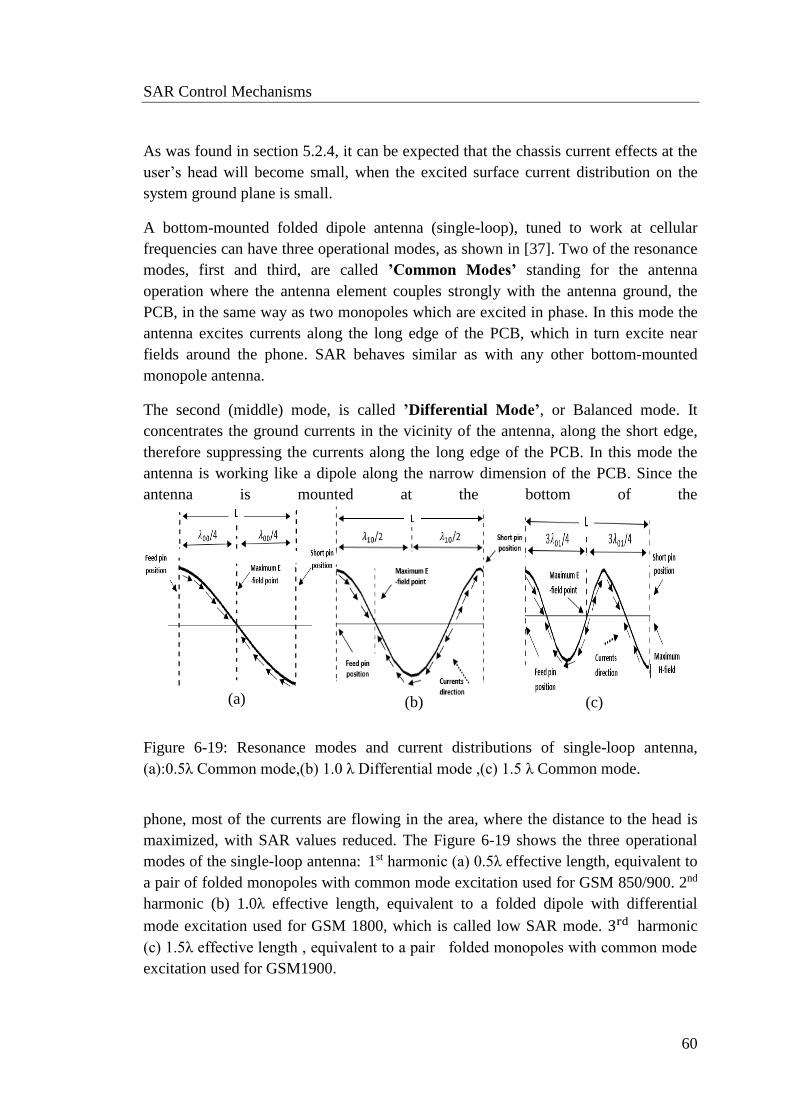
SAR Control Mechanisms
60
As was found in section 5.2.4, it can be expected that the chassis current effects at the
user’s head will become small, when the excited surface current distribution on the
system ground plane is small.
A bottom-mounted folded dipole antenna (single-loop), tuned to work at cellular
frequencies can have three operational modes, as shown in [37]. Two of the resonance
modes, first and third, are called ’Common Modes’ standing for the antenna
operation where the antenna element couples strongly with the antenna ground, the
PCB, in the same way as two monopoles which are excited in phase. In this mode the
antenna excites currents along the long edge of the PCB, which in turn excite near
fields around the phone. SAR behaves similar as with any other bottom-mounted
monopole antenna.
The second (middle) mode, is called ’Differential Mode’, or Balanced mode. It
concentrates the ground currents in the vicinity of the antenna, along the short edge,
therefore suppressing the currents along the long edge of the PCB. In this mode the
antenna is working like a dipole along the narrow dimension of the PCB. Since the
antenna is mounted at the bottom of the
Figure 6-19: Resonance modes and current distributions of single-loop antenna,
(a):0.5λ Common mode,(b) 1.0 λ Differential mode ,(c) 1.5 λ Common mode.
phone, most of the currents are flowing in the area, where the distance to the head is
maximized, with SAR values reduced. The Figure 6-19 shows the three operational
modes of the single-loop antenna: 1st harmonic (a) 0.5λ effective length, equivalent to
a pair of folded monopoles with common mode excitation used for GSM 850/900. 2nd
harmonic (b) 1.0λ effective length, equivalent to a folded dipole with differential
mode excitation used for GSM 1800, which is called low SAR mode. 3rd harmonic
(c) 1.5λ effective length , equivalent to a pair folded monopoles with common mode
excitation used for GSM1900.
(a) (b) (c)

SAR Control Mechanisms
61
Figure 6-20: Geometry of the investigated structure with single-loop antenna’s
dimensions (15×40×10mm3). The ground plane (PCB) is represented by a copper
sheet of 0.1 mm thickness.
Figure 6-20 shows a single-loop antenna at one end of a PCB of 1×80×40mm3; the
feeding and shorting pins locations are at the center of the antenna in order to make
the current distributions symmetrical on the ground plane. This structure is used in the
following to investigate the loop antenna as low-SAR antenna design in simulation
and measurement. This loop has three resonance frequencies at 0.92 GHz, and 1.75
GHz, 1.87 GHz.
Figure 6-21: The total amplitude of electric field distributions at resonance
frequencies 0.92 GHz, and 1.75 GHz, 1.87 GHz.

SAR Control Mechanisms
62
At 1.0 effective loop length the differential mode or balanced mode is excited, the
excited current at the PCB suppressed to zero since the feed bin current equal to the
return current and in the opposite direction from the short pin.
Figure 6-21 shows the absolute value of E-field on the Y-Z plane at the three antenna
resonance frequencies 0.92 GHz, and 1.75 GHz, 1.87 GHz. The coupling between the
PCB and the antenna is suppressed at the balance mode, as seen at 1.75 GHz.
Therefore, this antenna type is used at the balanced mode improve the Hearing Aid
Compatibility (HAC) [38] and can be considered a low-SAR antenna.
For the problematic frequency band GSM 1900 (1.86 to 1.92 GHz), a major reduction
of SAR values is sought. This could be realized by using the balanced/differential
mode at GSM 1900 in place of GSM 1800 band with less change of the antenna’s
bandwidth. For the normal folded loop the mode order is always common
differential common; therefore, the loop can be used to cover the GSM 850/900,
GSM 1800, and GSM 1900 bands, where favourable SAR performance occurs at
GSM1800 band.
However, adding a second loop path to the folded loop, to form a dual-loop [39],
makes it possible to change the mode order to common common differential.
Therefore, the dual-loop can be used to cover 850/900 1800 1900 bands,
establishing the favourable SAR performance at the 1900 band. Figure 6-22 shows the
proposed dual-loop antenna.
Feed Short Figure 6-22: Dual-loop etched over plastic carrier [39], with current
distributions (a): common mode 0.5λ for short and long loops,(b): long
loop 1.5λ common mode,(c):1.0λ short loop differential mode.
(a) (b) (c)

SAR Control Mechanisms
63
In addition, it is possible to increase the bandwidth by using the dual-loop because the
radiation resistance is stepped up and the reactance can be made to cancel in the
balanced and unbalanced current modes. The mutual capacitance between the lines
depends on the distance between them. Increasing the distance between two metal
strips or decreasing the strip width in the meander line reduces the mutual coupling
and the resonance frequency shifts down, as shown in Figure 6-23. The three
resonance modes are: Single loop-short and Single loop-long and Dual-loop modes.
In the dual-loop antenna mode, the 0.5λ resonance of the short and the long branches
overlap; the second resonance appears at 1.85 GHz and the third resonance at 2.0
GHz, producing a high-band bandwidth of about 235 MHz, which is suited for GSM
and WCDMA bands.
Figure 6-23: The reflection coefficient S11 of dual loop (red), S11 of single loop-long
branch(green),S11 of single loop-short branch(blue).
In practice, when the handset antenna has bottom position, the PCB of the handset is
closer to the user’s head, which is an important factor in human head interaction and
requires further investigation.

SAR Control Mechanisms
64
Common Mode
Differential Mode
Figure 6-24: Simulated surface current distribution on the dual-loop antenna for
common and differential modes.
Figure 6-24 shows the current flow on the antenna for the common mode excitation
compared to the current on the chassis for the differential mode (balanced mode); the
loop antenna is seen to be the main radiator in the mobile phone at the balanced mode,
while in the common mode the PCB carries high current and considerably contributes
to the fields, which is also seen from Figure 6-25.
Figure 6-25: Simulated absolute E&H-field distributions in free space at
Z=10mm level below the PCB. Common mode (1.85 GHz) (a): E-field (c): H-
field. Differential mode (2 GHz), (b): E-field, (d): H-field.
PCB
Antenna

SAR Control Mechanisms
65
Figure 6-25 shows the absolute E-and H-fields for the two modes in free space, where
the absolute E-field is dominated by 𝐸z in (a), and (b).
At 2 GHz, differential mode, the two current minima are causing two balanced E field
maxima at the two sides of the loop (full wave mode), which shows similar
functionality as a folded dipole. In addition, the current maximum produces an H field
maximum at the middle of the loop’s electric length.
For the measurement of a fabricated prototype antenna structure, the iSAR (2D SAR)
was used to investigate the E-field and SAR values of common and different current
modes. Figure 6-26 shows the fabricated structure, which is placed 10mm above the
iSAR surface and is fed with 13dBm input power from a signal generator.
Figure 6-27 shows the Ey field distribution 4 mm underneath the surface of the
phantom flat body (iSAR’s Dielectric Block). Two symmetric electrical field
concentrations are seen at the differential mode frequency of 2 GHz, similar to what
can be expected from a folded dipole.
Figure 6-26: Dual-Loop prototype, PCB 80×40 mm, antenna is etched
over the plastic carrier.

SAR Control Mechanisms
66
(a) (b)
Figure 6-27: Y-component of E-field’s distribution 4mm inside the phantom,
𝑃inc=13dBm. (a) 1.85 GHz Common mode,(b) 2 GHz Differential mode.
(a) (b)
Figure 6-28: Measurement of the absolute value of total E-field 4mm inside the iSAR
phantom, 𝑃inc=13dBm. (a) 1.85 GHz, Common mode (left), (b) 2 GHz, Differential
mode (right).
Y
Y
PCB
X
Antenna
PCB X
Antenna
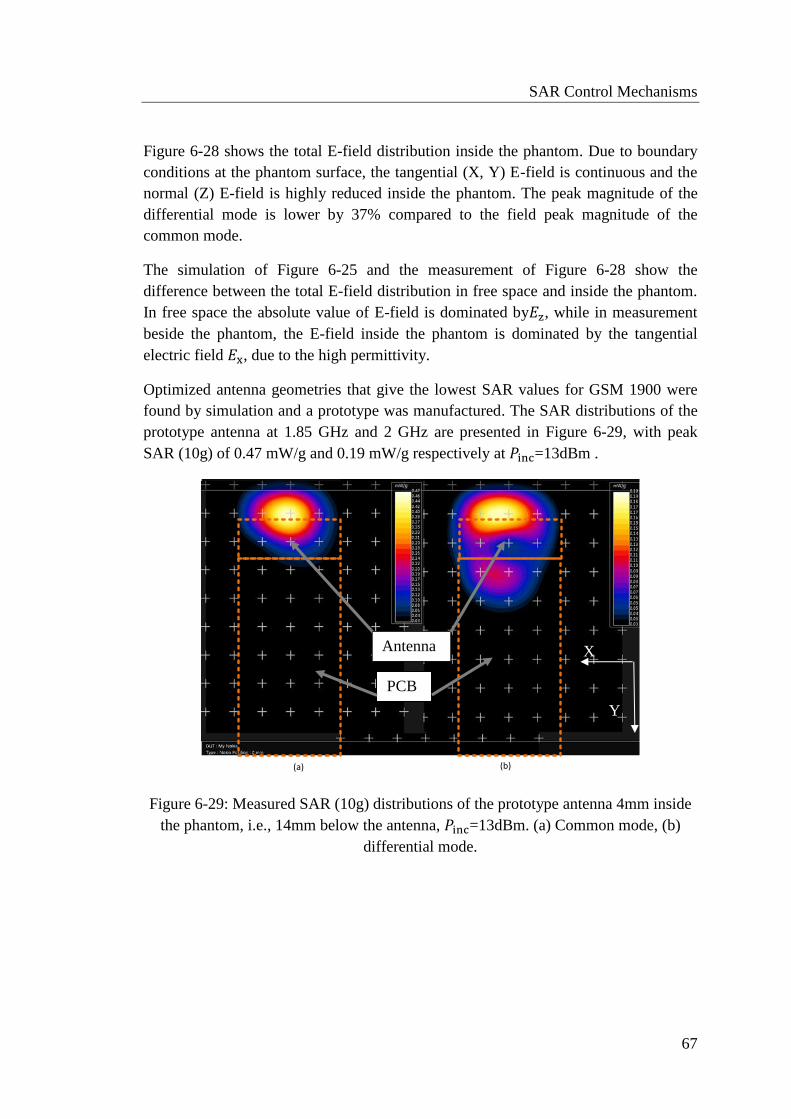
SAR Control Mechanisms
67
Figure 6-28 shows the total E-field distribution inside the phantom. Due to boundary
conditions at the phantom surface, the tangential (X, Y) E-field is continuous and the
normal (Z) E-field is highly reduced inside the phantom. The peak magnitude of the
differential mode is lower by 37% compared to the field peak magnitude of the
common mode.
The simulation of Figure 6-25 and the measurement of Figure 6-28 show the
difference between the total E-field distribution in free space and inside the phantom.
In free space the absolute value of E-field is dominated by𝐸z, while in measurement
beside the phantom, the E-field inside the phantom is dominated by the tangential
electric field 𝐸x, due to the high permittivity.
Optimized antenna geometries that give the lowest SAR values for GSM 1900 were
found by simulation and a prototype was manufactured. The SAR distributions of the
prototype antenna at 1.85 GHz and 2 GHz are presented in Figure 6-29, with peak
SAR (10g) of 0.47 mW/g and 0.19 mW/g respectively at 𝑃inc=13dBm .
(a) (b)
Figure 6-29: Measured SAR (10g) distributions of the prototype antenna 4mm inside
the phantom, i.e., 14mm below the antenna, 𝑃inc=13dBm. (a) Common mode, (b)
differential mode.
Y
PCB
Antenna X

SAR Control Mechanisms
68
RF Shields (Ferrite, Conductor, PMC)
Within the many studies on SAR compliance in the last decade, some studies inserted
a reflector between the radiator and the head [40], [41].Other studies applied a ferrite
sheet [42], [43] or other shielding materials [44], [45].
Figure 6-30: Concept of shielding material
Figure 6-30 shows the two main electromagnetic shielding concepts, the EM reflector
and the EM absorber. The following section uses simulation and measurement to
present an overview of SAR reduction by using reflection, absorption or dispersion of
the radiation against the human body.
In the analysis, it is important to discriminate the components of the power that is
delivered by the antenna.
The antenna output power can be separated into:
𝑃out = 𝑃head + 𝑃sch + 𝑃rad
Where:
𝑃head: The power absorbed by the head
𝑃sch: The power dissipated in the RF shield
𝑃rad: The radiated power of the antenna.

SAR Control Mechanisms
69
A. Ferrite:
RF shields made of ferromagnetic material are used to suppress surface current on
antennas with medical implantation [46]. This was the strong motive behind most of
the studies.
Ferrite has been shown to offer potential for SAR reduction. Some low-SAR antenna
designs have considered the use of a ferrite sheet behind the handset antenna to reduce
the surface currents on the back of the PCB that cause electromagnetic fields directed
to the user [42] [43]. SAR improvement by 40-57% was achieved, but the radiation
efficiency of the antenna with ferrite was not considered .
The disadvantage of this technique as shown in [46] [47], is the high cost of material
itself and the special properties of permittivity and permeability that the ferrite has to
comply with in order to obtain low SAR. On the other hand, [42] reports the SAR
value reduced by 88% compared to conventional phones and an efficiency of 38% at
1.8 GHz. Unfortunately, the radiation efficiency of the antenna installed on the mobile
phone without phantom (in free space) was not considered.
Our own experimental investigation of a handset antenna backed by ferrite material
was done with one commercial phone employing a PIFA-antenna. The ferrite sheet
thickness t=0.25mm and relative magnetic permeability 𝜇r =15 at 1.88 GHz [48] is
placed on the backside of the PCB.
Figure 6-31 shows the mobile phone with the PIFA antenna position and the ferrite
sheet. The SAR (10g) distributions of the antenna at 1.88 GHz is displayed by iSAR
with and without the ferrite sheet located between the antenna and the phantom.

SAR Control Mechanisms
70
From SAR and OTA investigations of this configuration, the ferrite can reduce SAR
by about 30%, while the total radiated power (in free space) drops by about 41%, from
25.4dBm to 23.1dBm, due to absorption by the ferrite. Due to that power loss, the
ferrite is not considered a viable solution for SAR reduction in mobile phones, where
high radiation efficiency is one of the key antenna-design requirements.
B. Electric conductor as RF shield:
In section 6.2.1, the metal a parasitic element was connected to the ground plane of
the PCB with two conductors. In this section, a metal sheet or Perfect Electrical
Conductor (PEC) is investigated as EM reflector. Electrical conductors are used as
EM reflectors in many applications, and are used in some SAR investigations [49]
[50]. These recent investigations are based on simulation just for 900 MHz and
without consideration of the antenna’s radiation efficiency.
In order to study the effects on SAR reduction effectiveness due to PEC shielding
material at 1900 MHz, a simulation was set up as shown in Figure 6-32.
Ferrite
Figure 6-31 : Mobile phone and SAR distribution measurement 4 mm inside the iSAR
phantom. 𝑃inc=30dBm. SAR(10g) distribution for (a) antenna without Ferrite ,max.
0.33mW/g, (b) antenna with ferrite, max. 0.229mW/g.
PIFA

SAR Control Mechanisms
71
A monopole antenna is mounted on the top of a PCB matching a frequency of 1.9
GHz. A Non-connected sheet of perfect electric conductor as RF shield is inserted
below the antenna and PCB by 8 mm distance with dimensions of 46mm × X mm, X:
is the variable length of the metal sheet. The metal model of the PCB of dimensions
46 × 100 mm with the monopole antenna is located at 18 mm above the phantom.
Figure 6-32: Simulation structure consisting of monopole antenna with the PCB
(46×100 mm) and phantom with dielectric properties of head tissue-equivalent
material, and PEC sheet (46 × X mm) as reflector.
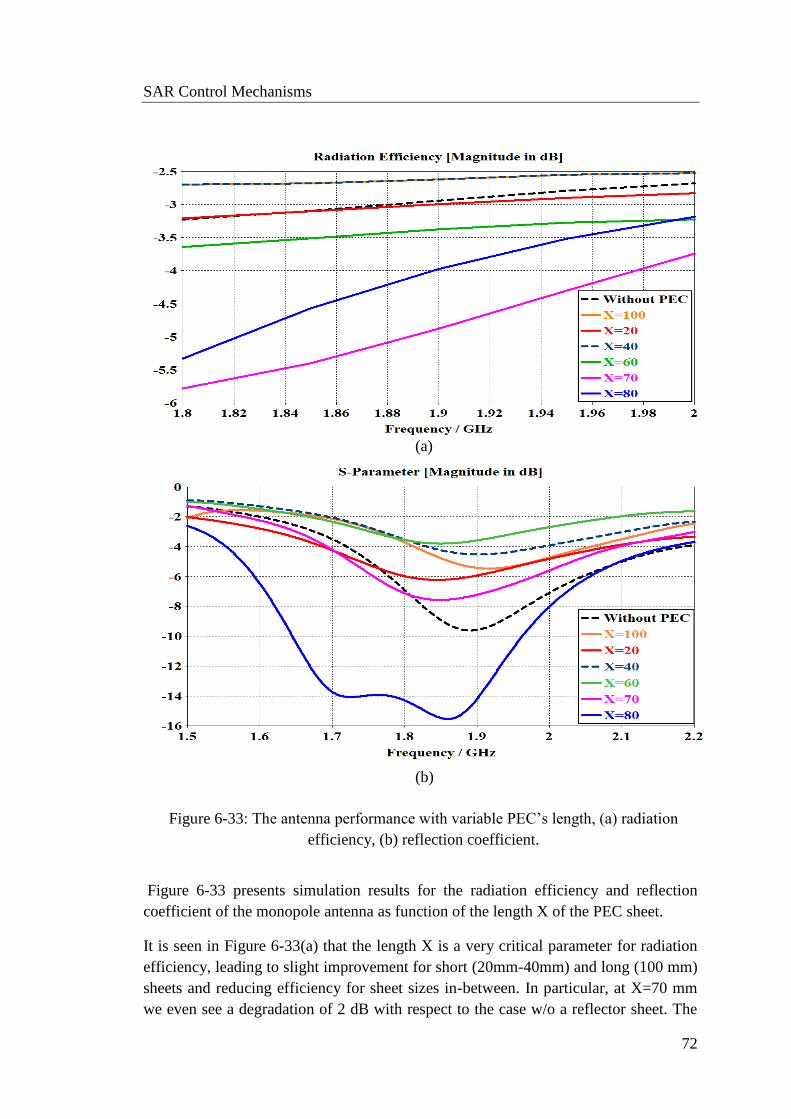
SAR Control Mechanisms
72
Figure 6-33 presents simulation results for the radiation efficiency and reflection
coefficient of the monopole antenna as function of the length X of the PEC sheet.
It is seen in Figure 6-33(a) that the length X is a very critical parameter for radiation
efficiency, leading to slight improvement for short (20mm-40mm) and long (100 mm)
sheets and reducing efficiency for sheet sizes in-between. In particular, at X=70 mm
we even see a degradation of 2 dB with respect to the case w/o a reflector sheet. The
(a)
(b)
Figure 6-33: The antenna performance with variable PEC’s length, (a) radiation
efficiency, (b) reflection coefficient.

SAR Control Mechanisms
73
two extreme cases are investigated in Figure 6-34 where the E-fields are plotted and
the surface currents on the back (towards the phantom) of the PEC sheet are shown. It
is obvious that the 70 mm sheet acts as a half-wavelength resonator with high field
strength between the sheet and PCB as well as between the sheet and the phantom.
The resonator wave length is seen to be much reduced with respect to free space due
to high permittivity of the phantom dielectric.
With the closer coupling to the phantom than w/o the sheet more power is dissipated
and the radiation efficiency drops. In contrast, the 40 mm sheet shows little surface
current and moderate field intensities between the sheet and the phantom which can be
attributed to the length X much less than the resonant length.
As a side-effect, the PEC sheet also detunes the monopole antenna, as seen in Figure
6-33(b), improving or degrading the match depending on length X. While this could
affect total efficiency, matching of the antenna could be restored by modification of
the matching network for any length X.
The evaluation of the maximum SAR inside the phantom as a function of the sheet
length is shown in Figure 6-35. Due to the high power loss into the phantom at the
Figure 6-34: E-field and surface current distribution for metal sheet of (a),(c) 40 mm
length (b),(d) 70 mm length.
(c) (d)
(b) (a)

SAR Control Mechanisms
74
resonant length of X= 70 mm, we observe a peak in the calculated peak SAR at 2.01
W/kg while the simulation scenario w/o PEC sheet gives only 1.08 W/kg. For smaller
or larger PEC sheet with X much less or much more than the resonant length of 70
mm, the calculated peak SAR is found lower than w/o a PEC sheet. This indicates
some potential of a metal reflector sheet as a SAR control concept. However, the
metal sheet has the disadvantages of requiring extra space below the PCB and needing
special design modifications to avoid lower total antenna efficiencies under special
user conditions such as the location of the user fingers, and with respect to other
relevant parts of the real handset, like the metal cover and the LCD. Never-the-less,
the major reason why the metal reflector sheet has not been considered a viable
approach for SAR control in mobile phones is the strict design rule in the industry to
avoid non-grounded metal parts.
Figure 6-35: Peak SAR (10g) inside the phantom for the monopole antenna backed by
PEC sheet as function of PEC’s length, 𝑃inc=0.25 W, peak SAR (10g) =1.08 W/kg for
the antenna without shielding.

SAR Control Mechanisms
75
C. PMC:
Any metallic sheet as ground plane or reflector can partially shield objects located on
the other side [16].When a monopole antenna is placed near to a metallic reflector, as
shown in Figure 6-34, the antenna will radiate into free space and generate currents
flowing on both sides of the metal sheet. The surface currents on the PEC generate an
EM field between the PEC and the phantom, and because the metal sheet can be
considered a dielectrically loaded transmission line (together with the phantom), SAR
value is increased in the phantom and the antenna performance is degraded when the
(metal sheet) transmission line becomes resonant at λ/2 length.
Therefore a new investigation is focusing on a new special material that can suppress
the wave excitation below the shield. This material is the Perfect Magnetic Conductor
(PMC), which can be approximated by a Metamaterial [51]. The PMC can be
characterized by a vanishing tangential magnetic field at the surface and the boundary
condition at the surface of such materials then becomes: �⃗⃗� × 𝐻s = 0 .
Figure 6-36 shows the simulation structure of a monopole antenna backed by an RF
shield of PEC material or of PMC material, which is modelled by a very high
magnetic conductivity 6𝑒301/Sm and zero losses.
Figure 6-36: Simulation structure for monopole antenna backed by 1mm× 46mm×X
mm PEC or PMC shield.

SAR Control Mechanisms
76
Figure 6-37 shows the E-&H-field distributions of the monopole antenna backed by a
PMC sheet. The antenna is mounted on the PCB and placed above the phantom’s
body with 18mm distance and the sheet is placed 8mm below the antenna and PCB.
On the backside of the sheet the amplitude of E-&H-fields are found very small,
proving the PMC as perfect reflector .The tangential H-field component at the PMC
surface and the vertical E-field component are zero, combined with zero surface
electric currents due to the boundary condition. However, still at the left corner (below
the antenna) of the sheet we see strong field intensifies which generate a hotspot in the
SAR distribution.
The radiation efficiency at the frequency band (1.8 - 2 GHz) with different RF
shielding material 1 mm×46 mm×X mm at 8 mm below the monopole antenna is
shown in Figure 6-38. Results for 40 mm and 70 mm show that the sheet length has
negligible effect on the antenna performance and even the short reflector sheet
improves radiation efficiency considerably.
Figure 6-37: Simulated field distributions of monopole antenna backed by
PMC with 40 mm and 70 mm length.(a) E-field,(b) H-field.
(a)
(b)
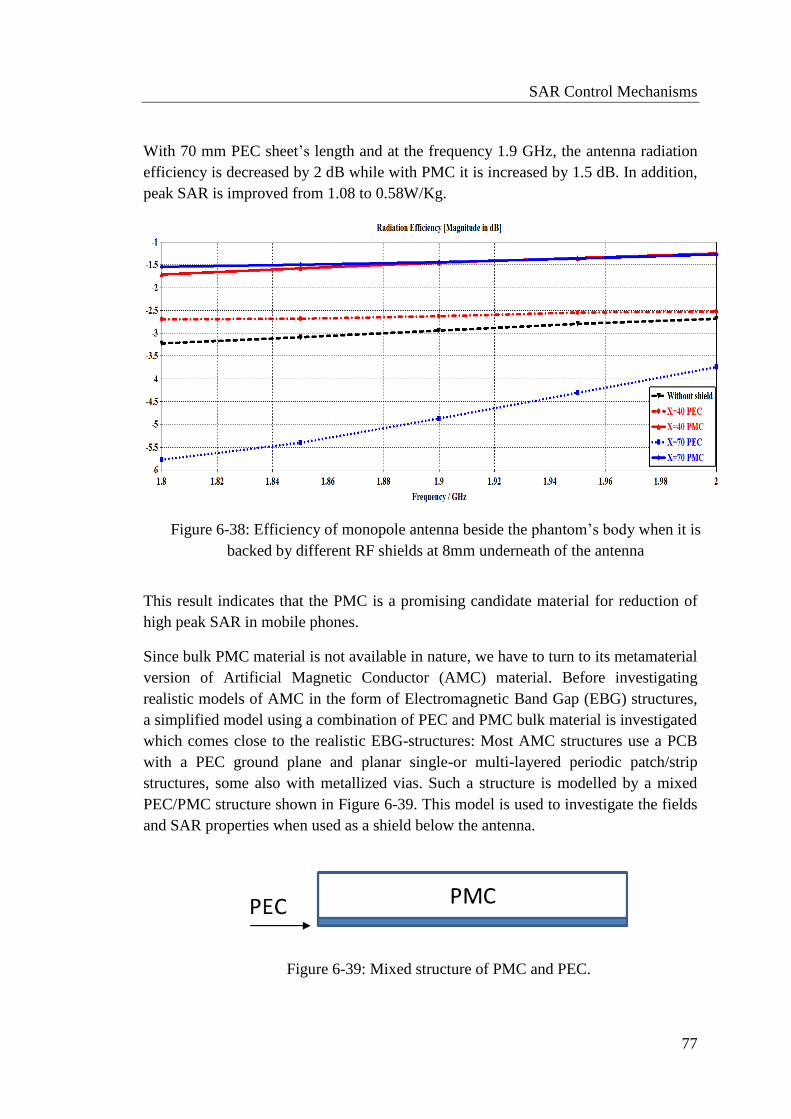
SAR Control Mechanisms
77
With 70 mm PEC sheet’s length and at the frequency 1.9 GHz, the antenna radiation
efficiency is decreased by 2 dB while with PMC it is increased by 1.5 dB. In addition,
peak SAR is improved from 1.08 to 0.58W/Kg.
This result indicates that the PMC is a promising candidate material for reduction of
high peak SAR in mobile phones.
Since bulk PMC material is not available in nature, we have to turn to its metamaterial
version of Artificial Magnetic Conductor (AMC) material. Before investigating
realistic models of AMC in the form of Electromagnetic Band Gap (EBG) structures,
a simplified model using a combination of PEC and PMC bulk material is investigated
which comes close to the realistic EBG-structures: Most AMC structures use a PCB
with a PEC ground plane and planar single-or multi-layered periodic patch/strip
structures, some also with metallized vias. Such a structure is modelled by a mixed
PEC/PMC structure shown in Figure 6-39. This model is used to investigate the fields
and SAR properties when used as a shield below the antenna.
Figure 6-39: Mixed structure of PMC and PEC.
Figure 6-38: Efficiency of monopole antenna beside the phantom’s body when it is
backed by different RF shields at 8mm underneath of the antenna

SAR Control Mechanisms
78
Figure 6-40: Simulated E-&H-field distributions of monopole antenna backed by
mixed structure of 70 mm length. E-field (above), H-field (below).
The EM field distributions are shown in the Figure 6-40. Due to the PEC in the mixed
structure, the normal component of the E-field and the tangential component of the H-
field are generated on the bottom side, together with electrical surface current,
however to a lesser extent and magnitude when compared to a pure PEC sheet.
With the mixed structure, the peak SAR (10g) value is less than with a pure PMC
sheet as seen in Figure 6-41. Part of the radiated power causes a wave propagating
between the PEC and the phantom, which increase the SAR value below the shield.

SAR Control Mechanisms
79
Figure 6-41: SAR (10g) distribution at 5 mm below the phantom’s surface, the
antenna backed by (a) PMC peak SAR (10g) =0.4 W/kg, (b) PMC+PEC peak SAR
(10g) =0.3 W/kg.
(b) (a)

80
Chapter 7
7. EBG structures and application for SAR reduction
This chapter concentrates on EBG structures as a SAR reduction technique for GSM
1900. Max SAR location and SAR amplitude inside the phantom’s head are
investigated using a sample dipole antenna backed by an EBG ground plane as
compared without EBG. In addition, the proposed EBG below real antennas in a
mobile phone is investigated comparing the radiation efficiency and SAR when the
antenna is backed by EBG ground plane to the case without EBG ground plane.
New potential concept: Electromagnetic Band Gap
(EBG) structures
The electromagnetic properties of metamaterial have led to various terminologies
found in the literature, such as: double negative (DNG) materials, left-handed (LH)
materials, negative refractive index (NRI) materials, magneto dielectric material, soft
and hard surfaces, high impedance surface (HIS), and artificial magnetic conductor
(AMC). In the literature, also various terms are used based on the domain of the
applications. In general, EBG structures are artificial periodic objects that prevent the
propagation of electromagnetic waves in a specified band of frequency [52].
The basic characteristics of EBG-structures, the surface wave suppression band gap
and the frequency band where the structure reflects vertically incident waves in-phase
can be extracted from the dispersion diagram and the reflection coefficient plot over
frequency, respectively.
In the recently published investigation [53] the EBG is proposed to protect the human
body from the exposure of EM fields and to suppress the excited surface waves on the
ground plane. In the examination done with a capacitive antenna element (PIFA) and
with an EBG with vias and without vias as shown in Figure 7-1, the SAR (1g)
measurement values are reduced by up to 75% when the PIFA antenna is backed by
an EBG structure as compared with the PIFA backed by a metallic ground plane .
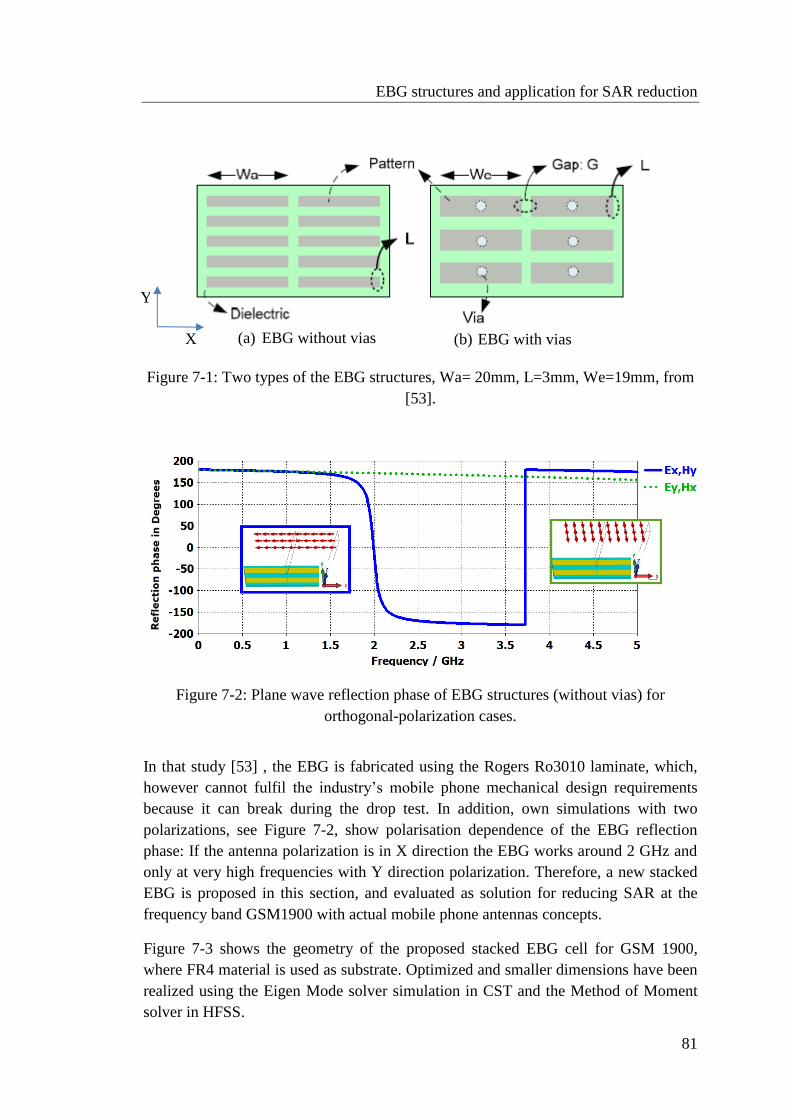
EBG structures and application for SAR reduction
81
(a) EBG without vias (b) EBG with vias
Figure 7-1: Two types of the EBG structures, Wa= 20mm, L=3mm, We=19mm, from
[53].
Figure 7-2: Plane wave reflection phase of EBG structures (without vias) for
orthogonal-polarization cases.
In that study [53] , the EBG is fabricated using the Rogers Ro3010 laminate, which,
however cannot fulfil the industry’s mobile phone mechanical design requirements
because it can break during the drop test. In addition, own simulations with two
polarizations, see Figure 7-2, show polarisation dependence of the EBG reflection
phase: If the antenna polarization is in X direction the EBG works around 2 GHz and
only at very high frequencies with Y direction polarization. Therefore, a new stacked
EBG is proposed in this section, and evaluated as solution for reducing SAR at the
frequency band GSM1900 with actual mobile phone antennas concepts.
Figure 7-3 shows the geometry of the proposed stacked EBG cell for GSM 1900,
where FR4 material is used as substrate. Optimized and smaller dimensions have been
realized using the Eigen Mode solver simulation in CST and the Method of Moment
solver in HFSS.
X
Y

EBG structures and application for SAR reduction
82
Figure 7-4 : The reflection phase for vertical plane wave incidence.
Hz
-Measurement
- Simulation
(b)
(a)
Figure 7-3: A planar stacked EBG which is investigated to reduce SAR at the
frequency band GSM1900. (a) Geometry of one unit cell, (b) Equivalent circuit
model for one unit cell.

EBG structures and application for SAR reduction
83
Figure 7-4 shows the EBG reflection phase from the measurement as shown in Figure
7-5: The reference measurement is taken of a surface with known reflection
properties, a sheet of metal.
The metal surface is then removed and replaced by the surface under test (EBG) and
the subsequent measurement is normalized to the reference. When performing phase
measurements, the surface under test must be placed in exactly the same location as
the reference metal surface, because variations in path length would create an
additional phase shift.
A 180° is added to the phase data to account for the reference phase of the metal sheet,
which is known to have a reflection phase of 180°.Since the assumption is that a plane
wave is normally impinging on the surface of EBG, the distance between the horn
antenna and the EBG’s surface has to fulfill the far field condition.
The reflection phase, Figure 7-4 shows that the proposed EBG operates between the
frequencies 1.74 and 2 GHz which includes it the GSM 1900 frequency band (1.86-
1.92 GHz) .
Figure 7-5: The EBG reflection phase measurement. Two vertical polarization horn
antennas are used as receiver and transmitter.
EBG
Horn antennas
R
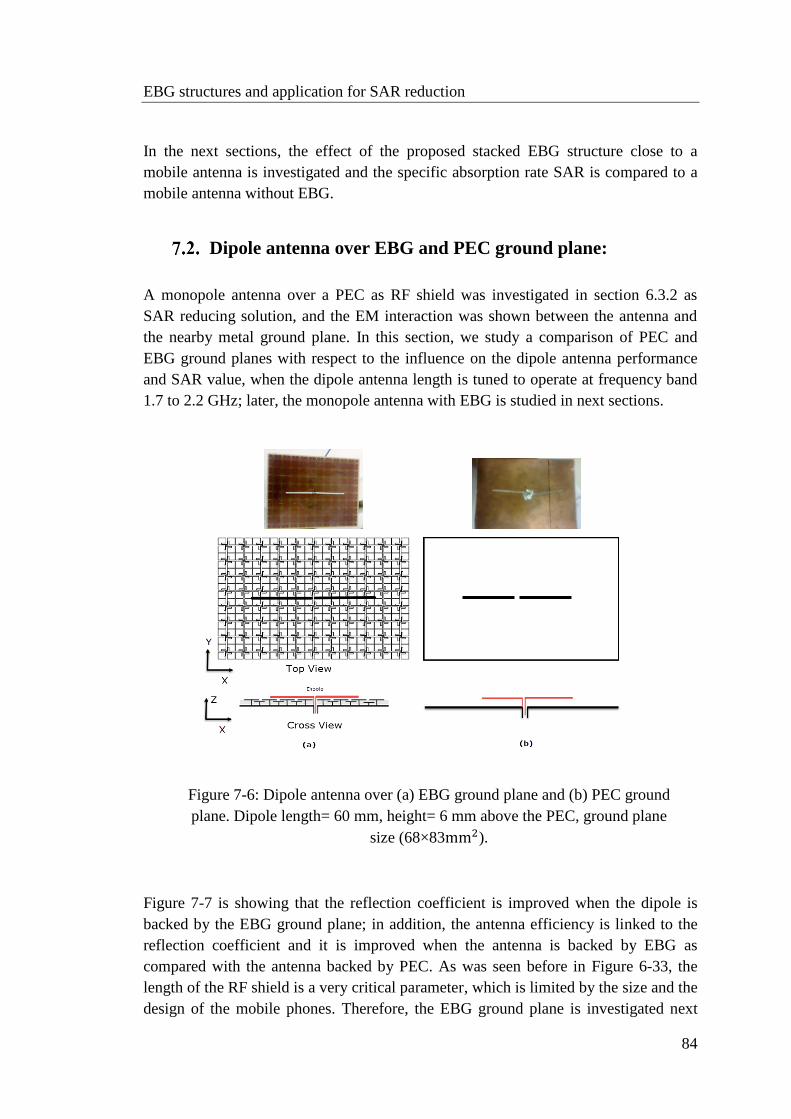
EBG structures and application for SAR reduction
84
In the next sections, the effect of the proposed stacked EBG structure close to a
mobile antenna is investigated and the specific absorption rate SAR is compared to a
mobile antenna without EBG.
Dipole antenna over EBG and PEC ground plane:
A monopole antenna over a PEC as RF shield was investigated in section 6.3.2 as
SAR reducing solution, and the EM interaction was shown between the antenna and
the nearby metal ground plane. In this section, we study a comparison of PEC and
EBG ground planes with respect to the influence on the dipole antenna performance
and SAR value, when the dipole antenna length is tuned to operate at frequency band
1.7 to 2.2 GHz; later, the monopole antenna with EBG is studied in next sections.
Figure 7-7 is showing that the reflection coefficient is improved when the dipole is
backed by the EBG ground plane; in addition, the antenna efficiency is linked to the
reflection coefficient and it is improved when the antenna is backed by EBG as
compared with the antenna backed by PEC. As was seen before in Figure 6-33, the
length of the RF shield is a very critical parameter, which is limited by the size and the
design of the mobile phones. Therefore, the EBG ground plane is investigated next
5mm
Figure 7-6: Dipole antenna over (a) EBG ground plane and (b) PEC ground
plane. Dipole length= 60 mm, height= 6 mm above the PEC, ground plane
size (68×83mm2).
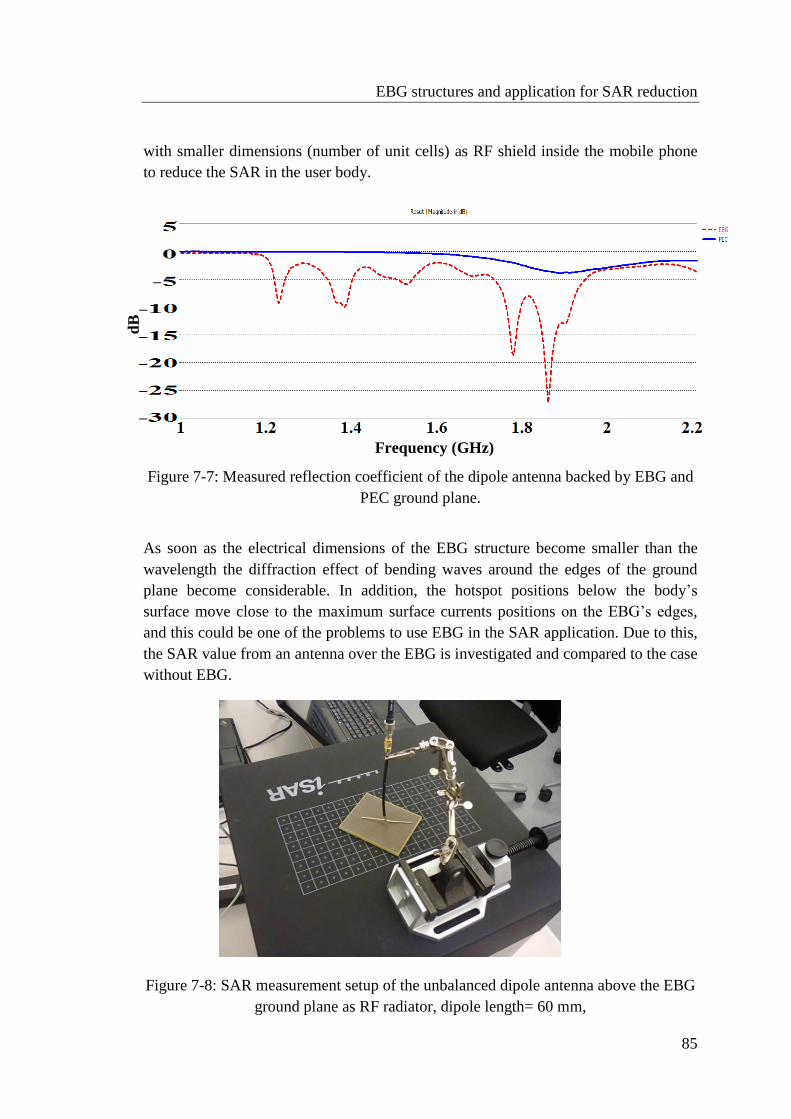
EBG structures and application for SAR reduction
85
with smaller dimensions (number of unit cells) as RF shield inside the mobile phone
to reduce the SAR in the user body.
Figure 7-7: Measured reflection coefficient of the dipole antenna backed by EBG and
PEC ground plane.
As soon as the electrical dimensions of the EBG structure become smaller than the
wavelength the diffraction effect of bending waves around the edges of the ground
plane become considerable. In addition, the hotspot positions below the body’s
surface move close to the maximum surface currents positions on the EBG’s edges,
and this could be one of the problems to use EBG in the SAR application. Due to this,
the SAR value from an antenna over the EBG is investigated and compared to the case
without EBG.
Figure 7-8: SAR measurement setup of the unbalanced dipole antenna above the EBG
ground plane as RF radiator, dipole length= 60 mm,
Frequency (GHz)
dB
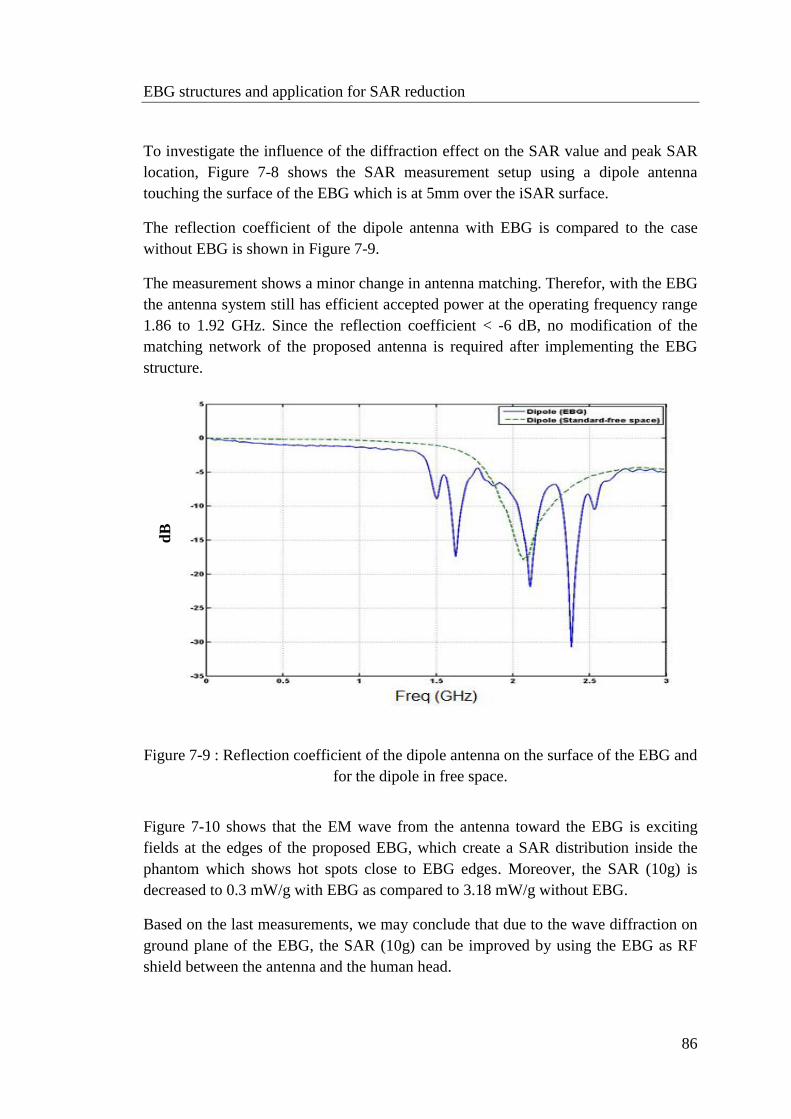
EBG structures and application for SAR reduction
86
To investigate the influence of the diffraction effect on the SAR value and peak SAR
location, Figure 7-8 shows the SAR measurement setup using a dipole antenna
touching the surface of the EBG which is at 5mm over the iSAR surface.
The reflection coefficient of the dipole antenna with EBG is compared to the case
without EBG is shown in Figure 7-9.
The measurement shows a minor change in antenna matching. Therefor, with the EBG
the antenna system still has efficient accepted power at the operating frequency range
1.86 to 1.92 GHz. Since the reflection coefficient < -6 dB, no modification of the
matching network of the proposed antenna is required after implementing the EBG
structure.
Figure 7-9 : Reflection coefficient of the dipole antenna on the surface of the EBG and
for the dipole in free space.
Figure 7-10 shows that the EM wave from the antenna toward the EBG is exciting
fields at the edges of the proposed EBG, which create a SAR distribution inside the
phantom which shows hot spots close to EBG edges. Moreover, the SAR (10g) is
decreased to 0.3 mW/g with EBG as compared to 3.18 mW/g without EBG.
Based on the last measurements, we may conclude that due to the wave diffraction on
ground plane of the EBG, the SAR (10g) can be improved by using the EBG as RF
shield between the antenna and the human head.
dB

EBG structures and application for SAR reduction
87
Figure 7-10: Hot spot locations and SAR values from dipole antenna over the EBG,
𝑃inc= 23 dBm.
Without EBG
SAR(10g)=0.29 mW/g SAR(10g)=0.23 mW/g SAR(10g)=0.3 mW/g
SAR(10g)=3.1 mW/g
SAR(10g)=0.24 mW/g SAR(10g)=0.26 mW/g
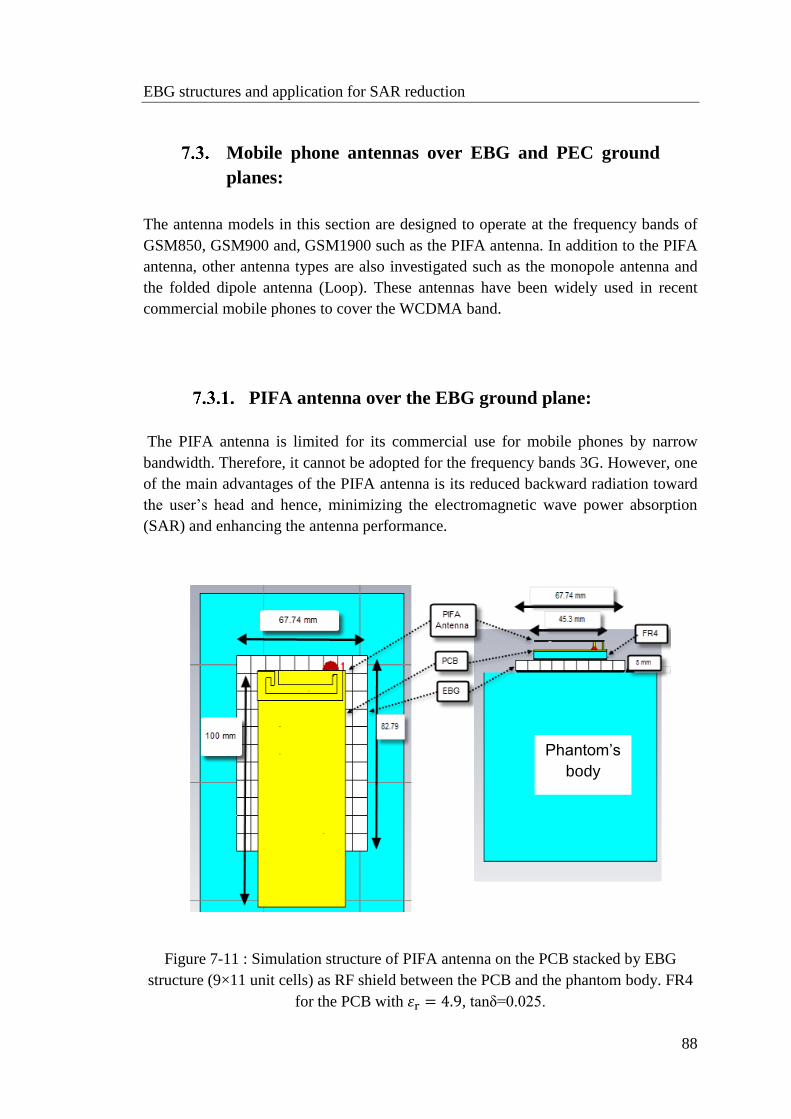
EBG structures and application for SAR reduction
88
Mobile phone antennas over EBG and PEC ground
planes:
The antenna models in this section are designed to operate at the frequency bands of
GSM850, GSM900 and, GSM1900 such as the PIFA antenna. In addition to the PIFA
antenna, other antenna types are also investigated such as the monopole antenna and
the folded dipole antenna (Loop). These antennas have been widely used in recent
commercial mobile phones to cover the WCDMA band.
PIFA antenna over the EBG ground plane:
The PIFA antenna is limited for its commercial use for mobile phones by narrow
bandwidth. Therefore, it cannot be adopted for the frequency bands 3G. However, one
of the main advantages of the PIFA antenna is its reduced backward radiation toward
the user’s head and hence, minimizing the electromagnetic wave power absorption
(SAR) and enhancing the antenna performance.
Figure 7-11 : Simulation structure of PIFA antenna on the PCB stacked by EBG
structure (9×11 unit cells) as RF shield between the PCB and the phantom body. FR4
for the PCB with 휀r = 4.9, tanδ=0.025.
Phantom’s
body

EBG structures and application for SAR reduction
89
Figure 7-11 shows the PIFA antenna mounted on top of the PCB (46mm×100mm);
the antenna shape is tuned to operate at the frequency band GSM 1900. From the
simulation results in Figure 7-12 the antenna radiation efficiency beside the phantom
is seen to be improved by 1dB by using the EBG. With the use of the EBG, the
absorbed electromagnetic fields inside the phantom is decreased, as seen in Figure 7-
13, and the radiation efficiency is improved; therefore the total efficiency is increased
by 42%. In free space: we find no change in the radiation efficiency while the total
antenna efficiency is increased with EBG due to the matching network used in the
simulation model.
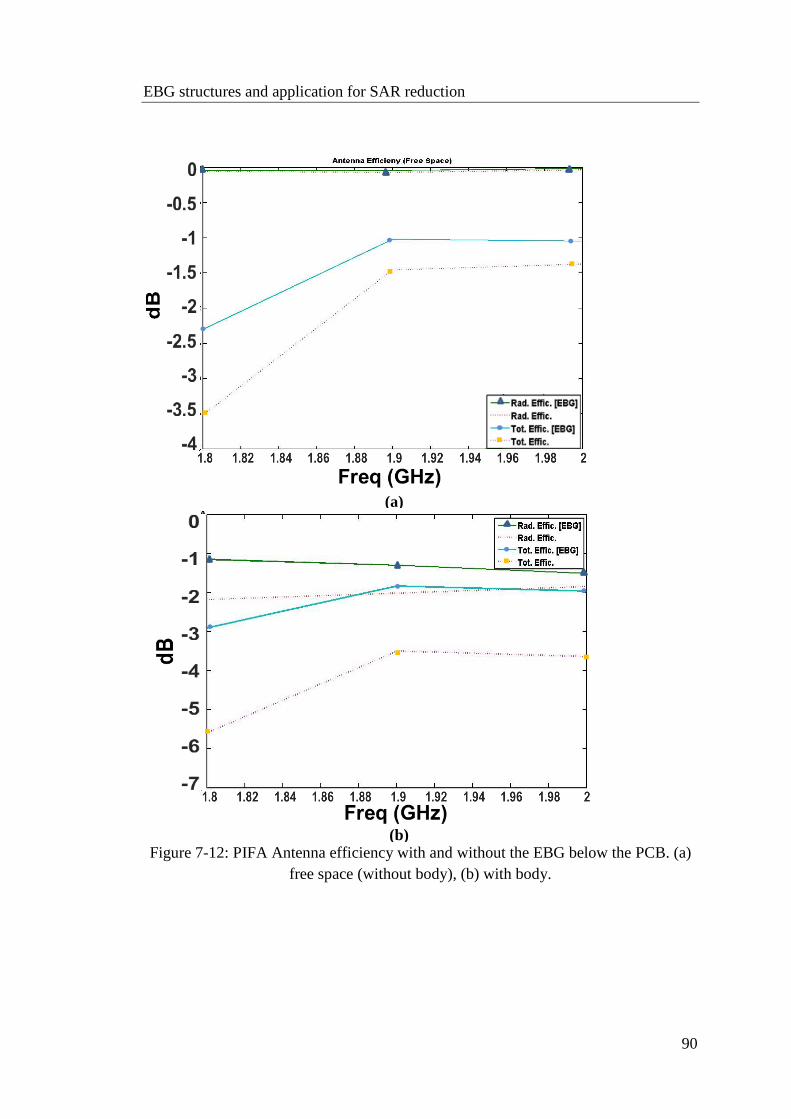
EBG structures and application for SAR reduction
90
Figure 7-12: PIFA Antenna efficiency with and without the EBG below the PCB. (a)
free space (without body), (b) with body.
(a)
(b)

EBG structures and application for SAR reduction
91
Figure 7-13 : Peak SAR (10g) value inside the phantom with 𝑃acc= 0.25 W.
Results in Figure 7-13 show that if the EBG structure is inserted between the mobile
and the phantom, then the Peak SAR (10g) is reduced by around 55%.
A commercial mobile phone with PIFA antenna, as presented in chapter 6, Figure 6-
Figure 7-14: SAR measurement of commercial mobile at 1.88GHz and 𝑃inc= 30dBm,
with EBG (right) and without the EBG (left) inserted between the mobile and the
phantom. Peak 𝐒𝐀𝐑𝟏𝟎𝐠=0.13W/kg (with EBG), peak 𝐒𝐀𝐑𝟏𝟎𝐠=0.36W/kg (without
EBG).
EBG
Mobile
Antenna
position
Antenna
position

EBG structures and application for SAR reduction
92
31, was used to experimentally investigate SAR levels inside the phantom when the
EBG is implemented under the mobile.
Figure 7-14 shows that the EBG (9×11 unit cells) can reduce SAR by 65% from 0.36
W/kg without EBG to 0.13 W/kg when EBG is used as RF shield between the mobile
phone and the phantom. The device under test is operated at the frequency band of
GSM1900 and fed with output power=𝑃inc= 30dBm from the IC transmitter; the SAR
measurements are done at the middle uplink channel of the frequency band GSM
1900, which is 1.88 GHz.
The SAR distribution measurements can be compared to the simulations presented in
section 6.3.2 under headline C.PMC for the mixed structure of PMC and PEC to
understand the distribution of SAR. The normal component of the E-field and the
tangential component of the H-field generated on the bottom side as shown in Figure
6-40 excite surface waves on the backside of the EBG, which supports a wave
propagating between the PEC and the phantom, as seen also in Figure 6.41, and which
generates SAR below the shield.
A check of the total radiated power in free space using the OTA measurement, Figure
2-5, shows that with the EBG, the total radiated power is reduced by a maximum of
13% at the EBG frequency band (GSM 1900 ) and 33% outside the EBG frequency
15,0
17,0
19,0
21,0
23,0
25,0
27,0
29,0
Low CH Mid CH High CH Low CH Mid CH High CH
GSM1800 GSM1900
dB
m
TRP
Orginal phone without RF shielding Ferrite as RF shielding
EBG as RF shielding
Figure 7-15: Measured Total Radiated Power (TRP) of the mobile phone with 30dBm
transmitter’s output power and with ferrite or EBG material as RF shield measured in
free space (without head).

EBG structures and application for SAR reduction
93
band (GSM 1800) ,which is less degradation than when ferrite material is used as RF
shield in free space, see Figure 7-15.
As a conclusion, it is found that the use of an EBG below a PIFA antenna leads to
SAR reduction by 55% inside the phantom while the total radiated power in free space
is reduced by 15%, possibility due to miss-match of the antenna and/or due to
dissipation loss in the EBG structure.
Dual-Loop Antenna over the EBG ground plane:
The commercial demand for multisystem handset equipment has recently increased
rapidly. Therefore, the antenna in the smart phone must be capable of operating at four
or more frequency bands. In this section the commercial mobile phone with dual-loop
antenna and multiband characteristics, presented in section 6.3.1.is investigated with
the EBG below its PCB.
Figure 7-16 : Measurement of SAR distribution at 1.88GHz for a commercial phone
with loop antenna at 𝑃inc= 30dBm. Without EBG (left) peak 𝐒𝐀𝐑𝟏𝟎𝐠=0.81 mW/g,
with EBG (right) peak 𝐒𝐀𝐑𝟏𝟎𝐠=0.21 mW/g.
This dual-loop antenna with EBG is investigated to study the effect of the
electromagnetic band gap EBG on the loop antenna radiation efficiency and SAR
Antenna
position
Antenna
position
EBG
Mobile

EBG structures and application for SAR reduction
94
distribution inside the phantom body. Figure 7-16 shows that the maximum SAR
value is decreased by about 74% at 1.88 GHz.
Figure 7-17 shows the TRP measurement values of the mobile phone with and without
using the EBG as RF shield in free space case , at the GSM 1800 and GSM 1900
frequency bands with feeding power 𝑃inc=30 dBm . The radiated power without
shielding is between 25.6 and 27.2 dBm and with EBG is between 22.5 and 25.5 dBm.
Figure 7-17 : TRP for commercial mobile phone with loop antenna at 30dBm Tx
power and using the EBG as RF shield in free space (without phantom).
The TRP measurement is showing that the efficiency of the antenna is decreased in
the out of phase frequency band (GSM1800) more than the in-phase EBG frequency
band (GSM 1900). From the measurement, it is found that, by using EBG below the
dual-loop antenna the maximum SAR value is decreased by about 74% with losses in
the total radiation power in free space situation by 2.1 dB (around 37%) at 1.88 GHz.
However, from the TRP measurement, it is not possible to decide whether the losses
in the antenna radiated power are due to the antenna’s miss-match or the dissipation
loss in the EBG.
From the results for the two antenna types, it can be concluded that the EBG (9×11
unit cells) can reduce SAR in the phantom considerably and it may be assumed that
such improvement should be realizable with other antenna types also.
In the next section, a reduced size of the EBG structure with 2×6 unit cells
(5.1×15×45mm3) is investigated with real mobile phone size and placed directly
below the antenna.
16,0
18,0
20,0
22,0
24,0
26,0
28,0
Low CH Mid CH High CH Low CH Mid CH High CH
GSM1800 GSM1900
dB
m
TRP
Orginal phone EBG as RF shield

EBG structures and application for SAR reduction
95
Mobile Phone Antennas with integrated EBG
structure:
In this section, a quarter-lambda monopole antenna is placed horizontally on the
plastic carrier without metal ground underneath. Then, the stacked EBG (2×6 unit
cells) of 5.1×15×45mm3 is inserted below the antenna. The antenna performance and
SAR were simulated and measured.
Figure 7-18 shows the proposed structure of a monopole antenna as high-band radiator
mounted on a copper PCB 95×60 mm. The antenna length is tuned to work at the
frequency band GSM1900.The distance between the radiator and the surface of the
EBG is significantly reduced to 2 mm.
The mobile phone in investigated for two conditions:
Free space (without the head) or in “stand by” position: the results are
represented in section 7.4.1.
Beside the head “talking” position: the results are represented in section 7.4.2.
Antenna in free space:
The antenna performance is studied without the phantom head to disclose the
influence of the EBG on the antenna performance in free space.
Figure 7-18 : Monopole antenna mounted on the top position of the PCB
with plastic carrier, and EBG (2×6 unit cells). FR4 for the PCB with 휀r =
4.9, tanδ=0.025,antenna carrier (휀r=3, tanδ=0.02).
EBG

EBG structures and application for SAR reduction
96
The distribution of surface current density on the PCB is shown in Figure 7-19. For
the standard scenario (a) without EBG the surface current distribution is forming a
half-wavelength chassis mode as shown before in chapter 5. The currents are
spreading at the edges of the PCB and the maximum amplitude is close to the antenna
feed point. With the EBG structure located below the antenna (b), due to the
characteristics of the EBG structure a high surface impedance point is formed on the
PCB close to the EBG that reshapes the current distribution on the PCB.
Figure 7-19: Surface current distribution on the back side of the PCB in free space at
1.9 GHz. (a) without shield,(b) with 2×6 unit cells EBG below the antenna, 𝑃inc=1W.
The EBG reduces the operating bands width of the antenna when compared with the
antenna not backed by EBG; Figure 7-20 shows the simulation of the radiation
efficiency and reflection coefficient for both cases.

EBG structures and application for SAR reduction
97
Figure 7-20 : Monopole antenna performance in free space. (a) Reflection coefficient,
(b) radiation efficiency.
The radiation efficiency by using the EBG in the free space is reduced by around 2 dB
over the frequency band GSM 1900 (1.86-1.92 GHz) due to the losses inside the EBG.
As shown in [54], the EBG can be used to design high directivity resonator antennas.
Figure 7-21 shows the directivity of the monopole antenna with the EBG (b), and
without the EBG (a), at 1.9 GHz, we recognize a clear improvement of directivity of
the monopole antenna into the upper hemisphere and a weakening into the back
hemisphere where the user’s head would be placed in actual operation.
(a) (b)

EBG structures and application for SAR reduction
98
The radiation efficiency comparison shows about 1.8 dB to 2 dB losses by using the
EBG. The reflection phase of the EBG structure is in the range of ±90°, which
produces constructive superposition of incident and reflected signals. At Phi from 0°
to 180 ° is the direction of the human head and as is shown in Figure 7-21,the
electromagnetic wave is damped (the radiation pattern is reduced) at around Phi =90°,
and increased around Phi=270°,which is away from the head.
For the measurement, the proposed monopole antenna is fabricated on a PCB with
dielectric FR4 substrate. A 50-Ohm coaxial cable feeds the antenna, Figure 7-22.
Ferrite core suppressor beads of 9.8 mm length are stacked on the cable to reduce the
(b)
(a)
Figure 7-21 : Simulated directivity of the monopole antenna at 1.9 GHz in free space. (a)
Without EBG, (b) with EBG as RF shield.

EBG structures and application for SAR reduction
99
EM coupling between the PCB with the coaxial cable via current flow on the outer
conductor.
Figure 7-22: The proposed antenna structure in free space and passive antenna
measurement tool with 15 Probes, (between two probes: 22.5°and rotation of the arch
11.25°), arranged at internal diameter of 0.9m.
Figure 7-23 shows the reflection coefficient of the proposed monopole antenna with
EBG structure (2×6 unit cells), which is measured by the VNA. The frequency
bandwidth at -6 dB of the monopole with the EBG covers the GSM1900 upload
frequency band (1.86-1.92 GHz). Excellent matching of the reflection coefficient
between the measurement and the FDTD simulation is seen.
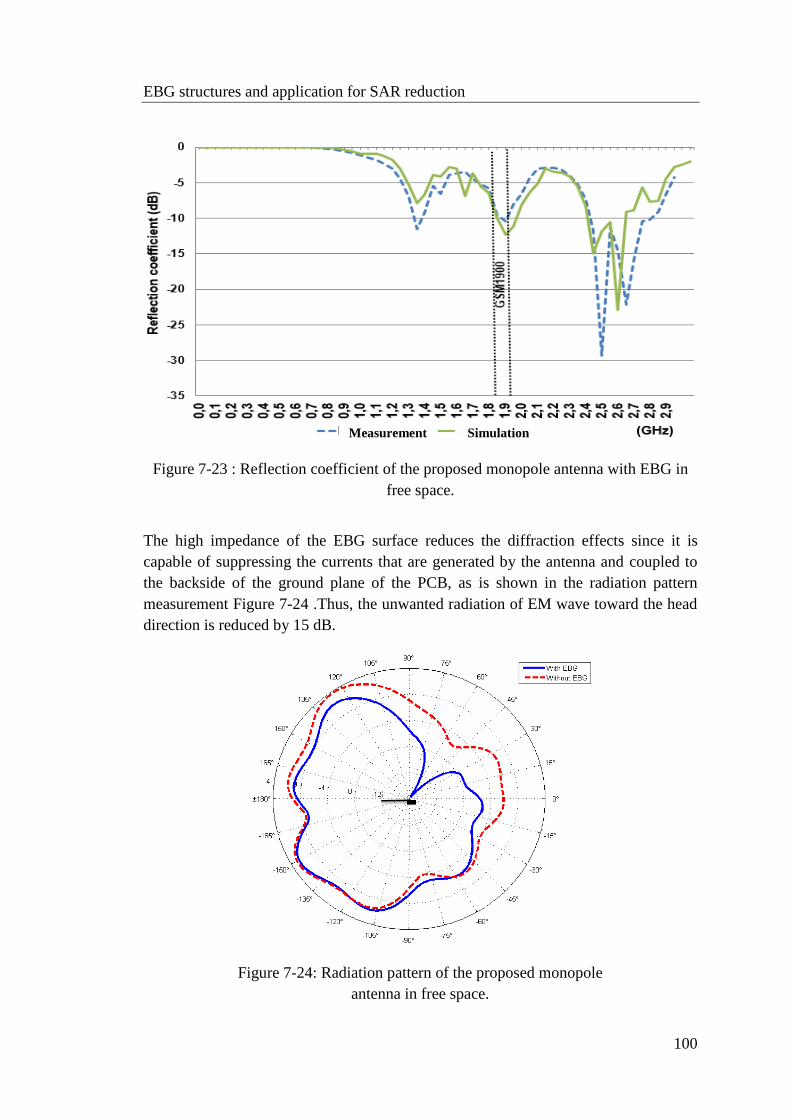
EBG structures and application for SAR reduction
100
Figure 7-23 : Reflection coefficient of the proposed monopole antenna with EBG in
free space.
The high impedance of the EBG surface reduces the diffraction effects since it is
capable of suppressing the currents that are generated by the antenna and coupled to
the backside of the ground plane of the PCB, as is shown in the radiation pattern
measurement Figure 7-24 .Thus, the unwanted radiation of EM wave toward the head
direction is reduced by 15 dB.
Figure 7-24: Radiation pattern of the proposed monopole
antenna in free space.
Measurement Simulation

EBG structures and application for SAR reduction
101
Complementary results of measurements in free space using the setup of Figure 7-22
are shown in Figure 7-25. We see that, the radiation efficiency of the antenna has
dropped after using the EBG by about 0.2dB at GSM 1900 and about 2dB in the rest
of high-band 1.695-2.170 GHz, matching the simulation results of Figure 7-20.
Figure 7-25 : Measurement results of monopole antenna with and without EBG.

EBG structures and application for SAR reduction
102
Antenna beside the head:
The antenna performance with the phantom head is investigated to disclose the impact
of the EBG on the antenna radiation efficiency and SAR value. In addition to the
magnitude of SAR, it was seen interesting to study the location of the hotspots (Peak
SAR) after applying the EBG structure. As seen in chapter 5, at the higher frequency
around 1900 MHz, the main contributor should be expected to be the antenna.
Figure 7-26 shows the front view of the proposed structure placed above the phantom
by 5 mm, with the space filled by low density rigid foam spacer for highly repeatable
positioning of devices on the iSAR Flat. The spacer is precision-milled with a low
dielectric loss tan δ =0.0008 and low permittivity 휀r = 1.07 [55]. The measurements
in Figure 7-26 show SAR distributions at 4 mm below the surface of the phantom with
and without EBG structure.
Figure 7-26 : Measurement of SAR distributions of monopole antenna with
EBG peak 𝐒𝐀𝐑𝟏𝟎𝐠=0.52 mW/g (a) and w/o EBG peak 𝐒𝐀𝐑𝟏𝟎𝐠=2.44 mW/g
(b), 𝑃inc=23dBm feed power at 1.88 GHz.
(b)
Antenna
(a)
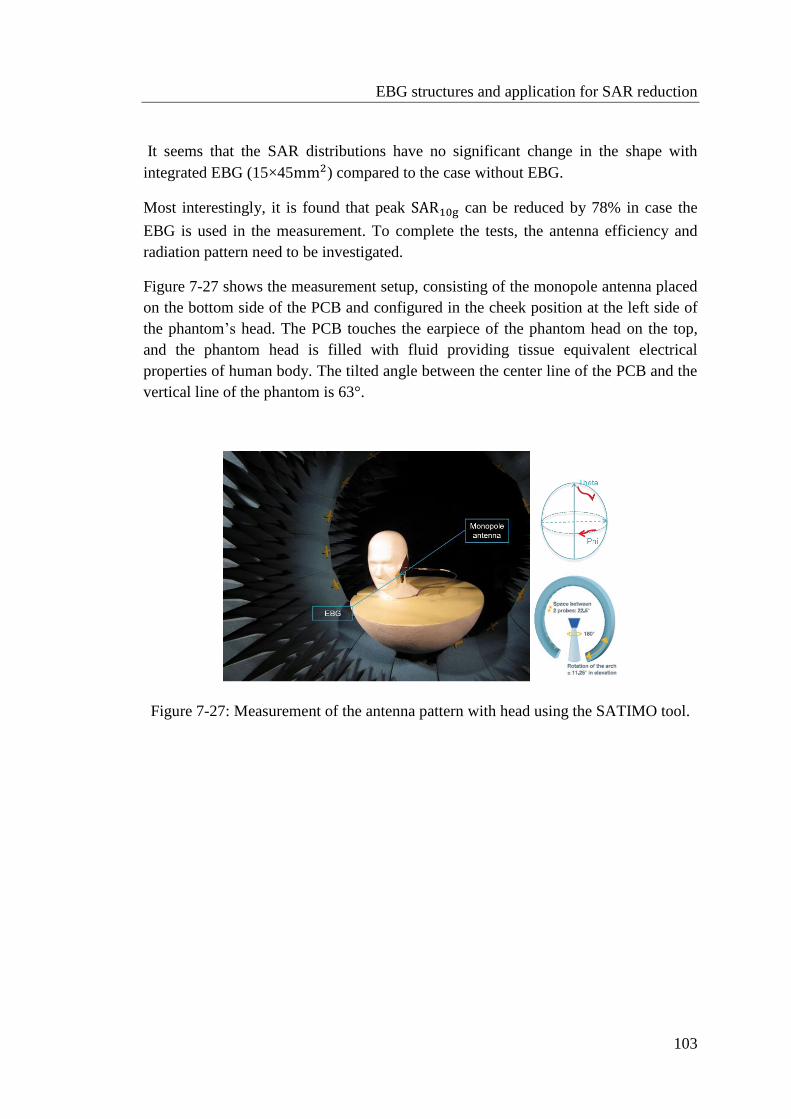
EBG structures and application for SAR reduction
103
It seems that the SAR distributions have no significant change in the shape with
integrated EBG (15×45mm2) compared to the case without EBG.
Most interestingly, it is found that peak SAR10g can be reduced by 78% in case the
EBG is used in the measurement. To complete the tests, the antenna efficiency and
radiation pattern need to be investigated.
Figure 7-27 shows the measurement setup, consisting of the monopole antenna placed
on the bottom side of the PCB and configured in the cheek position at the left side of
the phantom’s head. The PCB touches the earpiece of the phantom head on the top,
and the phantom head is filled with fluid providing tissue equivalent electrical
properties of human body. The tilted angle between the center line of the PCB and the
vertical line of the phantom is 63°.
Figure 7-27: Measurement of the antenna pattern with head using the SATIMO tool.

EBG structures and application for SAR reduction
104
Figure 7-28: Monopole antenna parameters measured with/ without EBG in cheek
position beside the head.
Figure 7-28 shows the antenna performance at the frequency band of interest (GSM
1900): From 1886 MHz to 1920 MHz the radiation efficiency drops from -3.3 dB
without EBG to -3.8 dB (10% ) when the antenna is backed by EBG; furthermore, the
reflection coefficient is still under -6 dB such that there is no need to re-tune the
antenna and the total efficiency is slightly degraded by the EBG.

EBG structures and application for SAR reduction
105
Figure 7-29 : Radiation pattern of the monopole antenna beside a phantom head in the
horizontal plane, with and without EBG at 1.88 GHz.
The radiation pattern presented in Figure 7-29, is a conventional Omni-directional
pattern of the normal monopole in the horizontal plane attenuated by dissipation loss
in the head. Using the EBG, the induced fields inside the head are decreased because
the radiation power is reduced in the direction of the human head, and therefore, the
dissipation inside head is reduced. This reduction of dissipation loss is compensated
by the dissipation inside the EBG: We see a slight drop in the antenna efficiency after
implementing the EBG, as shown in Figure 7-28 and Figure 7-29. The EBG reduces
the SAR inside the phantom head with very small effect at the radiation efficiency of
the mobile’s antenna in this position beside the head.
As is shown in chapter 2, the DASY 4 tool is used to measure the SAR10g in the
phantom head. Figure 7-30 shows the calibrated measurement system which consists
of a 3D probe to measure the E-fields inside the phantom at 4mm from surface with
mechanical surface detection. The scan area is 81×141mm2 inside the head phantom
which is filled with liquid (휀r=38.8, σ=1.39 S/m) and has a shell (휀r=4.5, tanδ = 0.05).
The measurements were taken over a grid of 𝑑X=10mm, and 𝑑Y=10mm.
The mobile phone structure touches the phantom head, with bottom antenna position.
Incident power 𝑃inc= 24dBm, which is the standard power level of the RF transmitter
at the frequency band GSM 1900.
Antenna
Head
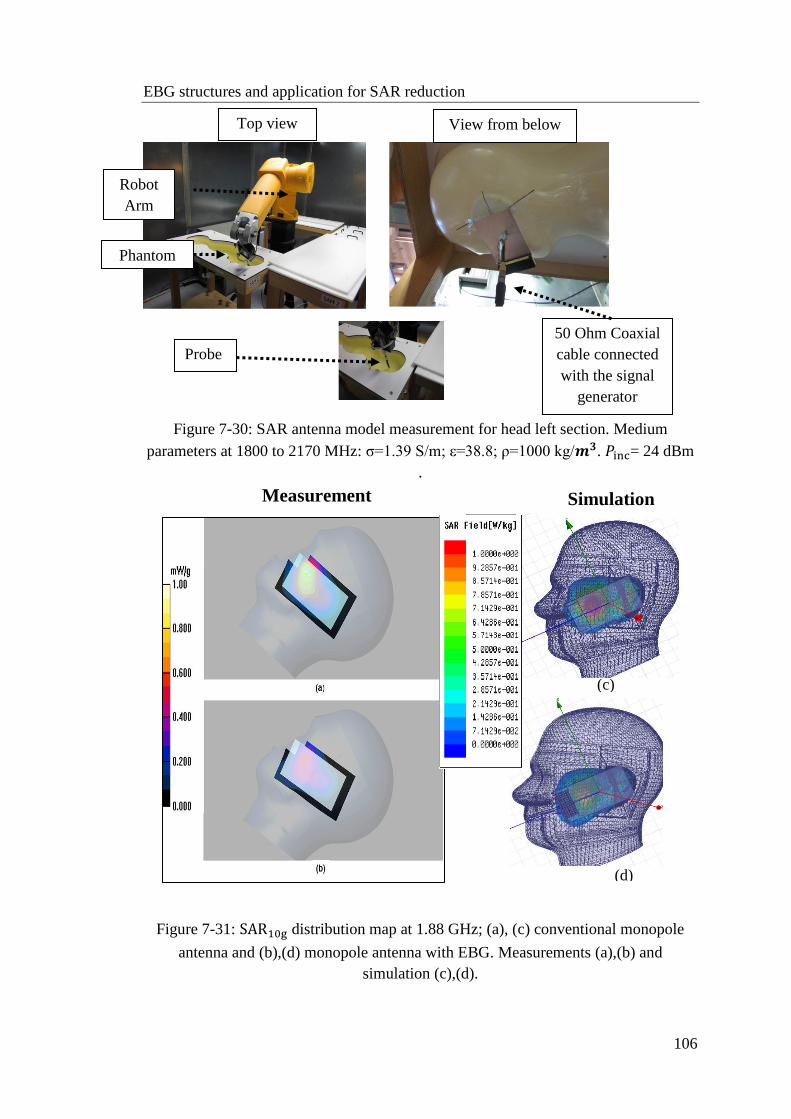
EBG structures and application for SAR reduction
106
Figure 7-30: SAR antenna model measurement for head left section. Medium
parameters at 1800 to 2170 MHz: σ=1.39 S/m; ε=38.8; ρ=1000 kg/𝒎𝟑. 𝑃inc= 24 dBm
.
Figure 7-31: SAR10g distribution map at 1.88 GHz; (a), (c) conventional monopole
antenna and (b),(d) monopole antenna with EBG. Measurements (a),(b) and
simulation (c),(d).
(c)
(d)
Probe
Robot
Arm
Phantom
liquid
50 Ohm Coaxial
cable connected
with the signal
generator
Top view View from below
Measurement Simulation

EBG structures and application for SAR reduction
107
Figure 7-31 shows the SAR distributions inside the head from measurement (a),(b)
and from simulation by HFSS (c),(d) . The peak SAR location and amplitude are
exactly the same in simulation and measurement. The Table 7-1 shows the measured
SAR values of the monopole antenna for 1g and 10 g: With the proposed EBG
structure SAR is reduced by ~39 % at the center frequency of the GSM 1900.
SAR(mW/g)
1g/10g(Avg.) 1852.4 MHz 1880 MHz 1907.6 MHz
Monopole 0.748 / 0.47 0.753 / 0.465 0.867 / 0.532
Monopole with
EBG 0.499 / 0.311 0.453 / 0.283 0.539 / 0.333
𝐒𝐀𝐑 − 𝐒𝐀𝐑(𝐄𝐁𝐆)
𝐒𝐀𝐑× 𝟏𝟎𝟎
33.3 % / 33.8 % 39.8 % / 39.1 % 37.8 % / 37.4 %
Low channel Middle channel High channel
Table 7-1: Comparison of measured SAR values with/without EBG at GSM 1900.
The results show that the SAR value inside the head is reduced by 39% at the cost of
reduced radiation efficiency by 10% at the GSM1900 Band (Uplink frequency 1850-
1910 MHz).However practically it would be possible to increase the generated power
to recover the 10% loss in the antenna efficiency and still reduce the SAR level.
As conclusion, the EBG with high impedance surface properties in a specified
frequency band is capable of suppressing surface currents on the PCB and thus
reducing the radiation toward the head. Therefore it is found a good solution to reduce
SAR in the user’s head.

EBG structures and application for SAR reduction
108
Impact of EBG on antenna performance at GSM 900:
At the frequency band GSM1900, the proposed EBG successfully suppresses surface
currents and reflects incident electromagnetic waves without phase reversal, but for
out-of-band frequencies the EBG behaves similar to conductive sheet with phase
reversal, and that causes a reduction in total antenna efficiency as seen in section
6.3.2. Thus, if a low-band antenna or Bluetooth antenna is placed near a EBG it will
also generate strong surface currents that propagate along the conductive EBG
surface. Mobile phones incorporate multi antennas operating at different frequencies
most importantly at GSM 900 frequencies. Therefore antenna efficiency is
investigated for the case of a loop antenna for GSM 900 when it is backed by the
proposed EBG.
The effect of the stacked EBG which is designed to work at around 1900 MHz on
antenna performance at 900 MHz is investigated in this section.
Figure 7-32 shows the geometry of the proposed antenna model with the EBG
structure below the antennas, a monopole antenna for high-band GSM1900 and a loop
antenna for GSM 900.
Figure 7-32 : Geometry of the two-antenna model. Monopole antenna for the 1900
MHz band and loop antenna for 900 MHz on a PCB with FR4 휀r = 4.9, tanδ=0.025
and with a stacked EBG integrated. Antenna carrier (휀r=3, tanδ=0.02).
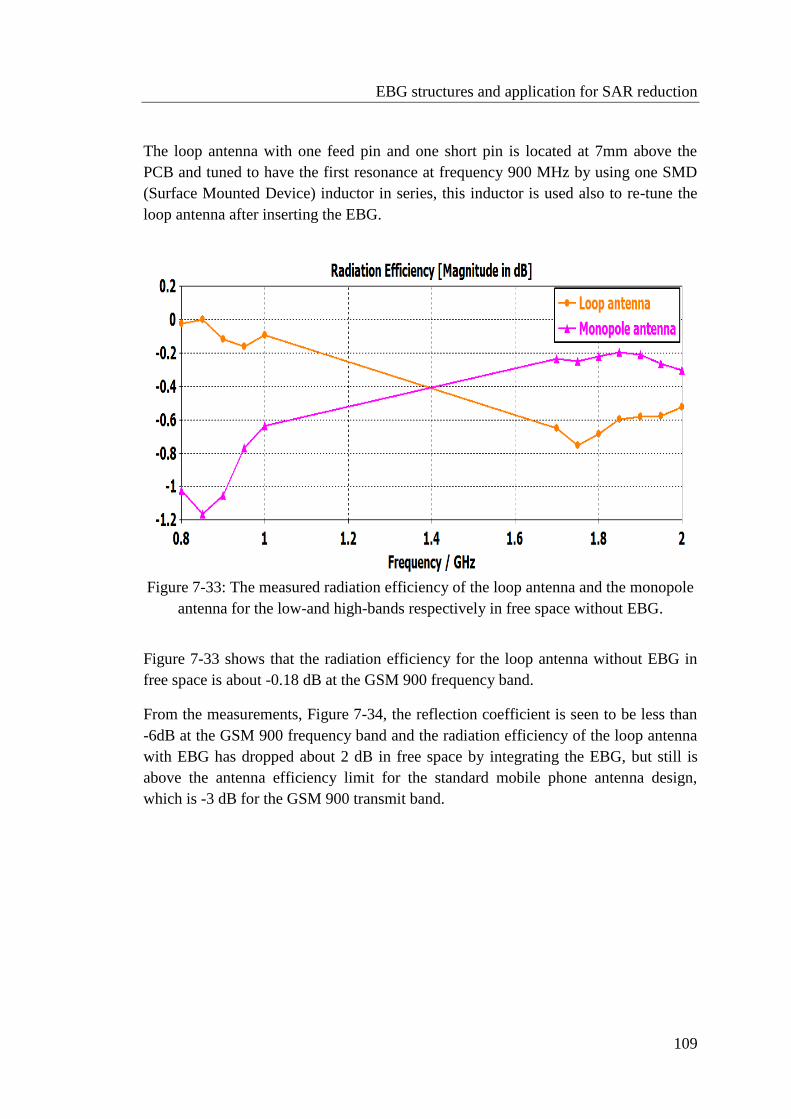
EBG structures and application for SAR reduction
109
The loop antenna with one feed pin and one short pin is located at 7mm above the
PCB and tuned to have the first resonance at frequency 900 MHz by using one SMD
(Surface Mounted Device) inductor in series, this inductor is used also to re-tune the
loop antenna after inserting the EBG.
Figure 7-33: The measured radiation efficiency of the loop antenna and the monopole
antenna for the low-and high-bands respectively in free space without EBG.
Figure 7-33 shows that the radiation efficiency for the loop antenna without EBG in
free space is about -0.18 dB at the GSM 900 frequency band.
From the measurements, Figure 7-34, the reflection coefficient is seen to be less than
-6dB at the GSM 900 frequency band and the radiation efficiency of the loop antenna
with EBG has dropped about 2 dB in free space by integrating the EBG, but still is
above the antenna efficiency limit for the standard mobile phone antenna design,
which is -3 dB for the GSM 900 transmit band.

EBG structures and application for SAR reduction
110
Loop antenna beside the head:
This simulation assumes that the mobile phone structure touches the phantom head,
with bottom antenna position and with accepted power 𝑃acc= 24dBm at the frequency
band GSM 900. Figure 7-35 shows the radiation efficiency of the loop antenna beside
(a)
Figure 7-34: The reflection coefficient and the radiation efficiency of the loop antenna
and the monopole antenna for the low-and high-bands respectively and with
integrated EBG measured in free space.

EBG structures and application for SAR reduction
111
Figure 7-36: SAR10g distribution map at 900 MHz; (a) loop antenna without EBG
and (b) loop antenna with integrated EBG. Peak 𝐒𝐀𝐑𝟏𝟎𝐠=1.23 mW/g with EBG,
and w/o EBG peak 𝐒𝐀𝐑𝟏𝟎𝐠=1.18 mW/g. 𝑃acc= 24 dBm.
the head dropped by 0.5 dB with the integrated EBG, obviously due to dissipated
power inside and at the back of the EBG.
Figure 7-35: The radiation efficiency of the loop antenna for GSM 900 beside the
head with and without integrated EBG.
Figure 7-36 shows the SAR distributions inside the head. The peak SAR is located
close to the middle of the PCB and the SAR10g distribution inside the head is
practically equal for the two cases (with and without integrated EBG).
(a) (b)

EBG structures and application for SAR reduction
112
Conclusion
The stacked EBG structure is found to be the best solution to reduce the specific
absorption rate SAR value of the standard monopole antenna for GSM 1900.
The monopole backed by the proposed EBG structure demonstrates a significant SAR
reduction by 78 % and radiation efficiency losses by only 10% compared to the case
of the monopole antenna without EBG beside the head.
Deteriorating effects of the EBG on other antennas on the PCB can be assumed to be
acceptably low.
In particular, in the most critical case of the GSM 900 antenna, the loop antenna
efficiency of -2 dB still satisfies commercial mobile antenna transmit requirements
and no considerable degradation in SAR performance is seen.

113
Chapter 8
8. Conclusions and Future Work
As we already see from the analysis of absorption mechanisms for mobile phones and
behaviour of mobile terminal antennas near dielectric material, the currents of the
chassis at the low cellular frequencies (GSM 900) and of the antenna element at the
high cellular frequencies (GSM 1900) cause high peak specific absorption rate (SAR)
values, which especially at the GSM 1900 band is quite often problematic.
Fundamental descriptions of the interaction between the user and the antenna are
found to be the antenna efficiency and most importantly SAR; which are investigated
using EM simulation and measurement technologies. It is found that the interaction
between the human head and the antenna is located in near field region. Therefore the
near field distributions which are excited from the assumed small antennas and which
propagate inside the phantom and lead to absorption are investigated. It is found that
at 1900 MHz the PCB resembles a full wavelength resonator such that the electric
field has a strong area around the center of the PCB in addition to the open ends of the
resonator, while the magnetic field peaks around areas in which the surface current on
the resonator is high.
The EM interaction between the antenna and the human head has been discussed in
this thesis with different SAR reduction methods, such as parasitic elements,
wavetraps, directive control antenna, slotted ground plane, antenna type optimization,
and RF shields (Ferrite, PEC, and PMC). These methods either cause reduction in the
antenna efficiency in free space after reduction of SAR or they are hard to produce
and integrated below the antenna and inside the mobile phone. Due to that, a stacked
EBG structure has been investigated in this thesis as EM shield placed underneath the
RF antenna tuned to reflect the field with zero phase reversal. At the mobile operating
frequency band of GSM 1900 upload band (1860-1920 MHz) the propagation of
surface waves is suppressed, and the EM fields against the human body are dispersed.
The stop band gap property of the proposed EBG is shown to be in excellent
agreement between the simulation and the measured results.
The stacked EBG structure is found to be the best solution to reduce SAR value of the
standard monopole antenna for GSM 1900 with a slight drop of antenna radiation
efficiency in free space and beside the head.
Conclusions and Future Work
114
A commonly used antenna for the low frequency band GSM 900 , the loop antenna
has been designed and fabricated, and the impact of the EBG on the loop antenna
performance and SAR value at GSM 900 was investigated. It is found from
measurements that the loop antenna efficiency with integrated EBG still satisfies
commercial mobile antenna transmit requirements and no significant degradation in
SAR performance is seen.
For the future, the antenna performance and SAR value should be investigated for new
antenna designs such as the dual-loop (multi-band antenna) with integrated EBG
structure .

115
References
[1] 3GPP TS 05.05 version 8.20.0 Release 1999.
[2] D. Manteuffel, A. Bahr, D. Heberling and I. Wolff, “Design considerations for
integrated mobile phone antennas,” in Antennas and Propagation, 2001. Eleventh
International Conference, Manchester, 2001.
[3] Satimo, “Satimo products,” SATIMO, [Online]. Available:
http://www.satimo.com/content/products/starlab. [Accessed 16 January 2015].
[4] Satimo, “Electromagnetic Field Measurements,” SG64, [Online]. Available:
http://www.satimo.com/content/products/sg-64. [Accessed 15 January 2015].
[5] “ICNIRP GUIDELINES FOR LIMITING EXPOSURE TO TIME‐VARYING
ELECTRIC, MAGNETIC AND ELECTROMAGNETIC FIELDS (UP TO 300
GHZ),” HEALTH PHYSICS, vol. 74, no. 4, pp. 494-522, April 1998.
[6] J. Jokela, D. Leszczynski, W. Paile, S. Salomaa, L. Puranen and P. Hyysalo,
“Radiation safety of handheld mobile phones and base stations,” Radiation and
Nuclear Safety Authority, Helsinki, 1999.
[7] C. H. Durney, H. Massoudi and M. F. Iskander, Radiofrequency radiation
dosimetry handbook, Brooks Air Force Base, May 2002.
[8] D. Conover, E. Moss, R. Edwards, C. Clinton, B. Grajewski, D. Werren and J.
Smith, “Foot currents and ankle SARs induced by dielectric heaters,”
Bioelectromagnetics, vol. 13, no. 2, pp. 103-110, 1998.
[9] D. Hill, “The effect of frequency and grounding on whole-body absorption of
humans in E-polarized radiofrequency fields,” Bioelectromagnetics, vol. 5, pp.
131-146, 1984.
[10] "SPEAG," DASY5, [Online]. Available:
http://www.speag.com/products/dasy/dasy-systems/. [Accessed 10 January
2015].
[11] I. S. 1528-2003, “IEEE Recommended Practice for Determining the Peak Spatial-
Average Specific Absorption Rate (SAR) in the Human Head from Wireless
Communications Devices: Measurement Techniques,” pp. 1-120, 2003.
References
116
[12] A. Drossos, V. Santomaa and N. Kuster, "The dependence of electromagnetic
energy absorption upon human head tissue composition in the frequency range of
300-3000 MHz," Microwave Theory and Techniques, IEEE Transactions on, vol.
48, no. 11, pp. 1988-1995, 2000.
[13] A. Faraone, D. O. McCoy, C. -K. Chou and Q. Balzano, “Characterization of
miniaturized E-field probes for SAR measurements,” in Electromagnetic
Compatibility, 2000. IEEE International Symposium on, Washington, DC, IEEE,
2000, pp. 749-754 vol.2.
[14] “iSAR Flat,” Speag AG, [Online]. Available:
http://www.speag.com/products/isar2/isar2-systems/isar-flat/. [Accessed 15
January 2015].
[15] M. Y. Kanda, M. G. Douglas, E. D. Mendivil, M. Ballen, A. V. Gessner and K.
Chung, "Faster determination of mass-averaged SAR from 2-D area scans,"
Microwave Theory and Techniques, IEEE Transactions on, vol. 52, no. 8, pp.
2013-2020, 2004.
[16] C. Balanis, Antenna Theory,Analysis and Design, New York: John Wiley and
Sons, 2005.
[17] P. Vainikainen, J. Ollikainen, O. Kivekas and I. Kelander, “Resonator-based
analysis of the combination of mobile handset antenna and chassis,” Antennas
and Propagation, IEEE Transactions on, vol. 50, no. 10, pp. 1433-1444, 2002.
[18] “WaveForm Global Pty Ltd - EME Solutions,” [Online]. Available:
http://waveformglobal.com.au/. [Accessed 10 01 2015].
[19] S. Gabriel, R. W. Lau and C. Gabriel, “The dielectric properties of biological
tissues: III. Parametric models for the dielectric spectrum of tissues,” Physics in
Medicine and Biology, vol. 41, pp. 2271-2293, 1996.
[20] O. Kivekäs, T. Lehtiniemi and P. Vainikainen, “On the general energy absorption
mechanism in the human tissue,” MICROWAVE AND OPTICAL TECHNOLOGY
LETTERS, vol. 43, no. 3, pp. 195-201, 2004.
[21] N. Kuster and Q. Balzano, “Energy absorption mechanism by biological bodies
in the near field of dipole antennas above 300 MHz,” Vehicular Technology,
IEEE Transactions on, vol. 41, no. 1, pp. 17-23, 1992.
[22] H. -R. Chuang, “Numerical computation of fat layer effects on microwave near-
field radiation to the abdomen of a full-scale human body model,” Microwave

References
117
Theory and Techniques, IEEE Transactions on, vol. 45, no. 1, pp. 118-125, 1997.
[23] J. Holopainen, R. Valkonen, O. Kivekas, J. Ilvonen, L. Martinez, P. Vainikainen,
J. Kelly and P. Hall, “Equivalent circuit model-based approach on the user body
effect of a mobile terminal antenna,” in Antennas and Propagation Conference
(LAPC), Loughborough, 2010.
[24] K. Yee, “Numerical solution of initial boundary value problems involving
maxwell's equations in isotropic media,” Antennas and Propagation, IEEE
Transactions on, vol. 14, no. 5, pp. 302-307, 1966.
[25] F. Demming-Janssen and W. Koch, “3D Field simulation of sparse arrays using
various solver techniques within CST MICROWAVE STUDIO,” in Radar
Conference, 2006. EuRAD 2006. 3rd European.
[26] IEEE, “IEEE Recommended Practice for Measurements and Computations of
Radio Frequency Electromagnetic Fields With Respect to Human Exposure to
Such Fields,100 kHz-300 GHz,” IEEE Std C95.3, pp. i-126, 2002.
[27] C. T. Famdie, Schroeder, L. Werner and K. Solbach, “Numerical analysis of
characteristic modes on the chassis of mobile phones,” Antennas and
Propagation, no. 11, pp. 1-6, 2006.
[28] J. Poutanen, J. Villanen, C. Icheln and P. Vainikainen, “Behaviour of Mobile
Terminal Antennas near Human Tissue at a Wide Frequency Range,” Antenna
Technology: Small Antennas and Novel Metamaterials, vol. 4, no. 3, pp. 219-222,
2008.
[29] D. Manteuffel, A. Bahr, P. Waldow and I. Wolff, “Numerical analysis of
absorption mechanisms for mobile phones with integrated multiband antennas,”
Antennas and Propagation Society International Symposium,IEEE, vol. 3, no. 7,
pp. 82-85, 2001.
[30] M. Sager, M. Forcucci and T. Kristensen, “A novel technique to increase the
realized efficiency of a mobile phone antenna placed beside a head-phantom,”
Antennas and Propagation Society International Symposium, 2003. IEEE, vol. 2,
no. 6, pp. 1013-1016 , 2003.
[31] J. Holopainen, J. Ilvonen, O. Kivekas, R. Valkonen, C. Icheln and P.
Vainikainen, “Near-Field Control of Handset Antennas Based on Inverted-Top
Wavetraps: Focus on Hearing-Aid Compatibility,” Antennas and Wireless
Propagation Letters,IEEE, vol. 8, pp. 592,595, 2009.

References
118
[32] H. Haruki, Y. Koyanagi and K. Egawa, “Radiation Characteristics of an Antenna
System with a Dividing Feed Circuit for a Handy Phone in the Talk Position,”
IEICE Technical Report, p. 164, 2003.
[33] T. Nishikido, Y. Saito , M. Hasegawa, H. Haruki and Y. Koyanagi, “Multi-
antenna system for a handy phone to reduce influence by user's hand,” in
Personal, Indoor and Mobile Radio Communications, 14th IEEE Proceedings on,
2003, pp. 1898-1901.
[34] K. Wong, J. Kuo and T. Chiou, “Compact microstrip antennas with slots loaded
in the ground plane,” in Antennas and Propagation, 2001.
[35] C. Picher, J. Anguera, A. Andujar, C. Puente and S. Kahng, “Analysis of the
Human Head Interaction in Handset Antennas with Slotted Ground Planes,”
Antennas and Propagation Magazine, IEEE, vol. 54, no. 4, pp. 36-56, 2012.
[36] A. Andujar, J. Anguera, C. Picher and C. Puente, “Ground plane booster antenna
technology: Human head interaction: Functional and biological analysis,” in
Antennas and Propagation (EUCAP), 2012 6th European Conference on, 2012.
[37] A. Ikram, C. Beckman and S. Irmscher, “Design and development of a multiband
loop antenna for cellular mobile handsets,” in Antenna Technology (iWAT), Hong
Kong, IEEE, 2011, pp. 251-254.
[38] P. Hui, “Near fields of phased antennas for mobile phones,” in Microwave
Conference,APMC 2009. , Singapore, IEEE, 2009, pp. 2718-2721.
[39] A. Arkko, J. Troelsen and R. So, “Apparatus for wireless communication
comprising a loop like antenna”. US Patent 2012/0194404 A1, Aug 2012.
[40] K. Chan, K. Chow, L. Fung and S. Leung, “Effects of using conductive materials
for SAR reduction in mobile phones,” Microwave and Optical Technology
Letters, vol. 44, no. 2, pp. 140-144, 2005.
[41] A. Hirata, T. Adachi and T. Shiozawa, “Folded-loop antenna with a reflector for
mobile handsets at 2.0 GHz,” Microwave and Optical Technology Letters, vol.
40, no. 4, pp. 272-275, 2004.
[42] J. Minseok and L. Bomson, “SAR reduction for mobile phones based on analysis
of EM absorbing material characteristics,” in Antennas and Propagation Society
International Symposium, IEEE, 2003, pp. 1017-1020.

References
119
[43] M. Islam, M. Faruque and N. Misran, “Design analysis of ferrite sheet attachment
for sar reduction in human head,” Progress In Electromagnetics Research, vol.
98, pp. 191-205, 2009.
[44] L. Fung, S. Leung and K. Chan, “Experimental study of SAR reduction on
commercial products and shielding materials in mobile phone applications,”
Microwave and Optical Technology Letters, vol. 36, no. 6, pp. 419-422, 2003.
[45] M. Kitra, P. Mcevoy, J. Vardaxoglou and J. James, “A theoretical and
experimental study of dielectrically loaded antennas and their contribution
towards low-SAR,” Antennas and Propagation Society International Symposium,
vol. 4, no. 6 pp. 3593-3596, 2004.
[46] L. Ragha and M. Bhatia, “Evaluation of SAR Reduction in Implanted Spherical
Head Model Using RF Shield,” India Conference (INDICON), pp. 1-4, 2009.
[47] M. Kitra, C. Panagamuwa, P. McEvoy, J. Vardaxoglou and J. James, “Low SAR
Ferrite Handset Antenna Design,” Antennas and Propagation, IEEE Transactions
on, vol. 55, no. 4, pp. 1155-1164, 2007.
[48] “NEC,” Flex suppressor, [Online]. Available: http://www.nec-
tokin.com/english/guide/flexsuppressor/pdf/flex_rfid_rm4a_e.pdf. [Accessed 20
March 2015].
[49] N. Hanafi, M. Islam, N. Misran and M. Faruque, “Numerical analysis of
aluminium sheet for SAR reduction,” in Space Science and Communication
(IconSpace), IEEE International Conference on, 2011, pp. 281-285.
[50] L. Ragha and M. Bhatia, “Evaluation of SAR Reduction for Dipole Antenna
Using RF Shield,” in Emerging Trends in Engineering and Technology
(ICETET), 2nd International Conference on, 2009, pp. 1075-1079.
[51] D. SIEVENPIPER, High-Impedance Electromagnetic Surfaces, Los Angeles,CA:
University of California (UCLA) , 1999.
[52] F. Yang and Y. Rahmat Samii, Electromagnetic Band Gap Structures in Antenna
Engineering, Cambridge: Cambridge University Press, 2008.
[53] S. i. Kwak, D.-U. Sim and J. H. Kwon, “SAR reduction on a mobile phone
antenna using the EBG structures,” in Microwave Conference,EuMC 2008. 38th
European, Amsterdam, IEEE, 2008, pp. 1308-1311.
References
120
[54] A. Weily, L. Horvath, K. Esselle, B. Sanders and T. Bird, “A planar resonator
antenna based on a woodpile EBG material,” Antennas and Propagation, IEEE
Transactions on, vol. 53, no. 1, pp. 216-223, 2005.
[55] Speag, “Spacers for iSAR Flat,” Schmid & Partner Engineering AG, [Online].
Available: http://www.speag.com/products/isar2/isar2-accessories/isar2-spacers/.
[Accessed 15 June 2015].
[56] B. A. Munk, Frequency Selective Surfaces: Theory and Design, John Wiley &
Sons Inc., 2000.
[57] J. D. Joannopoulos, R. D. Meade and J. N. Winn, Photonic Crystals, Princeton
University Press, 1995.
[58] E. Yablonovitch, “Inhibited spontaneous emission in solid-state physics and
electronics,” Phys. Rev. Lett., vol. 58, pp. 2059-2063, 1987.