investigation of fmri neurofeedback of differential ... · pdf fileinvestigation of fmri...
TRANSCRIPT
NeuroImage 61 (2012) 21–31
Contents lists available at SciVerse ScienceDirect
NeuroImage
j ourna l homepage: www.e lsev ie r .com/ locate /yn img
Investigation of fMRI neurofeedback of differential primary motor cortex activityusing kinesthetic motor imagery
Mark Chiew a,b,⁎, Stephen M. LaConte c,d, Simon J. Graham a,b,e
a Department of Medical Biophysics, University of Toronto, Ontario, Canadab Rotman Research Institute, Baycrest, Toronto, Ontario, Canadac Virginia Tech Carilion Research Institute, Virginia Tech, Roanoke, VA, USAd Virginia Tech-Wake Forest University School of Biomedical Engineering and Sciences, Virginia Tech, Blacksburg, VA, USAe Imaging Research, Sunnybrook Research Institute, Toronto, Ontario, Canada
⁎ Corresponding author at: Rotman Research InstituBathurst St, Toronto, Ontario, Canada M6A 2E1. Fax: +1 4
E-mail address: [email protected] (M.
1053-8119/$ – see front matter © 2012 Elsevier Inc. Alldoi:10.1016/j.neuroimage.2012.02.053
a b s t r a c t
a r t i c l e i n f oArticle history:Accepted 20 February 2012Available online 3 March 2012
Keywords:Real-time fMRIBiofeedbackNeurofeedbackMotor imagery
FunctionalMRI neurofeedback (fMRI NF) is an emerging technique that trains subjects to regulate their brain ac-tivity while they manipulate sensory stimulus representations of fMRI signals in “real-time”. Here we report anfMRI NF study of brain activity associated with kinesthetic motor imagery (kMI), analyzed using partial leastsquares (PLS), a multivariate analysis technique. Thirteen healthy young adult subjects performed kMI involvingeach hand separately, with NF training targeting regions of interest (ROIs) in the left and right primary motorcortex (M1). Throughout, subjects attempted to maximize a laterality index (LI) of brain activity—the differencein activity between the contralateral ROI (relative to the hand involved in kMI) and the ipsilateralM1 ROI—whilereceiving real-time updates on a visual display. Six of 13 subjects were successful in increasing the LI value,whereas the other 7 were not successful and performed similarly to 5 control subjects who received sham NFtraining. Ability to suppress activity in the ipsilateral M1 ROI was the primary driver of successful NF perfor-mance. Multiple PLS analyses depicted activated networks of brain regions involved with imagery,self-awareness, and feedback processing, and additionally showed that activation of the task positive networkwas correlated with task performance. These results indicate that fMRI NF of kMI is capable of modulatingbrain activity in primary motor regions in a subset of the population. In the future, such methods may be usefulin the development of NF training methods for enhancing motor rehabilitation following stroke.
© 2012 Elsevier Inc. All rights reserved.
Introduction
Functional magnetic resonance imaging (fMRI) has become a viabletechnique for investigating how individuals can regulate their brainactivity. Real-time fMRI (rt-fMRI) enables measurements and analysesof blood oxygenation level dependent (BOLD) signals spatially localizedon the scale of millimeters to centimeters (Cox et al., 1995; Voyvodic,1999) with a temporal resolution of approximately seconds or less.These signals can then be presented in the form of sensory stimuli forthe subject to regulate, in a biofeedback process that is often termed“neurofeedback” (NF). Although it is possible to derive feedback signalsusing whole brain analysis methods like support vector machine classi-fication and othermultivariate supervised learning approaches (Eklundet al., 2009; Hollmann et al., 2009; LaConte et al., 2007), most studies todate have involved NF of signals from localized regions of interest
te, Baycrest, Room 916, 356016 785 4299.Chiew).
rights reserved.
(ROIs). Work using ROI-based NF has targeted diverse brain regions in-volved in emotion (Caria et al., 2007; Hamilton et al., 2011; Johnstonet al., 2010, 2011; Posse et al., 2003; Weiskopf et al., 2003), pain(deCharms et al., 2005), audition (Haller et al., 2010; Yoo et al., 2006,2007), and language (Rota et al., 2009). In these reports, there havebeen overt behavioral manifestations of NF training, such as changesin emotional state or the sensation of pain, which have potentialmedical and therapeutic importance (deCharms, 2007).
There have also been a number of NF studies investigating themotorsystem, with overt hand movement (Yoo and Jolesz, 2002) and withmotor imagery (Bray et al., 2007; deCharms et al., 2004; Johnson etal., 2012; Yoo et al., 2008). Neurofeedback methods using motor imag-ery may be potentially useful to enhance motor rehabilitation of strokeor other physical disabilities (Sharma et al., 2006). For example, onestudy has found evidence for regional enhancement of BOLD activationusing motor imagery NF (deCharms et al., 2004), compared to a controlgroup that received sham NF. Such an approach could potentially beused to enhance neuronal activity from damaged regions of the brain,improving stroke recovery. Others have improved motor imagery NFmethodology with the addition of instrumental conditioning (Bray
22 M. Chiew et al. / NeuroImage 61 (2012) 21–31
et al., 2007) and selection of optimal feedback presentation schemes(Johnson et al., 2012) to maximize BOLD signals in the targeted regionsafter NF training. The longer-term effects of imagery-mediated fMRI NFhave also been investigated (Yoo et al., 2008). Importantly, this studyshowed that a single session of fMRI NF involving motor imagery,followed by a two-week period of self-practice, enabled healthyindividuals to consolidate and sustain elevated activity levels in brainregions associated with motor skill learning.
Despite the success of these NF studies, they should be viewed aspreliminary. For example, brain and motor behavior changes observedin response to NF training need to be evaluated not only in the contextof the individuals that respond to training, but also the non-responders.It has been commonly reported in past studies that not all participantswere able to self-regulate successfully (Bray et al., 2007; Johnsonet al., 2012; Yoo et al., 2008), although the neural differences betweenresponders and non-responders remains poorly understood. In theabsence of NF, motor imagery has been reported to elicit heterogenousbrain responses across subjects (Stephan et al., 1995). Additionally, onlyone study has attempted to characterize the impact of motor imageryNF training in a behavioral test of overt motor function (Bray et al.,2007). As a last example, although the neural mechanisms underlyingNF have been initially assessed and are thought to require a cortico-basal ganglia-thalamic circuit (Hinterberger et al., 2005; Yoo et al.,2008), different NF applications will likely engage slightly differentnetworks of regions (deCharms, 2008), and a detailed investigation ofthe brain networks involved in successful NF of motor imagery signalsstill remains to be undertaken.
The present study focuses on fMRI NF of the hand motor systemusing an ROI-based method targeting the primary motor cortex (M1),similar to the work of Bray et al. (2007), but with some notable designdifferences. Bray et al. suggested that subjects tended towards perform-ing kinesthetic motor imagery (kMI) during their NF study; here, kMI isused explicitly to access the motor system because a major topic ofinterest in the laboratory is the application of fMRI to enhance strokerecovery through optimization of physical rehabilitation methods.Studies have shown that the brain regions involved in kMI resemblethose for overt motor response more closely than in the case of visualmotor imagery (vMI) (Guillot et al., 2009). As kMI therapy has potentialto improve stroke recovery outcome (Braun et al., 2006) it is of interest,therefore, to explore the initial hypothesis that fMRI NF training inyoung healthy adults can enhance the brain activity associated withkMI. This represents an early step toward possibly using fMRI NF inthe future to enhance the ability to perform kMI, stimulate neurons inthe motor system, and thereby improve motor recovery in strokepatients.
The primary focus of this paper is the exploration of the distributednetworks and brain responses to NF involving kMI, through a post-hoc(offline) analysis of the fMRI data using the partial least squares (PLS)method (McIntosh et al., 1996). This multivariate approach is novel inthe fMRI NF literature, as all previous ROI-based studies have mappedbrain activity based on the general linear model (GLM) approach(Friston et al., 1995). The resulting networks of brain activity generatedby PLS are expected to be consistent with the networks previouslyreported in the literature for NF (Hinterberger et al., 2005) and for NFwith motor imagery (Bray et al., 2007; deCharms et al., 2004; Johnsonet al., 2012; Yoo et al., 2008), while also accounting for responsevariability in kMI and NF across participants.
A secondary objective of this work is the characterization of inter-hemispheric interactions between the dominant and non-dominantM1 ROIs, while using a laterality index as the NF signal of interest.This is also novel in the NF literature and has relevance to the use ofkMI for stroke recovery, considering cases in which the stroke lesionimpacts either the dominant or non-dominant hand. Based on thesmall behavioral literature on kMI and lateralization (Stinear et al.,2006) it is of interest to explore the hypothesis that kMI NF relating tothe non-dominant hand is less effective than that for the dominant
hand in right-handed subjects, and how dominant/non-dominant M1interactions modulate the NF signal.
Methods
Experimental overview
Subjects first performed a functional localizer task designed to iden-tify ROIs over the left and right M1 regions involved in both overt andimagined movement. These ROIs served as the subsequent signalsources for kMI NF involving either the dominant or non-dominanthand. During the NF training, consisting of 4 experimental runs eachlasting 9 min, subjects attempted to maximize a specific activationlaterality (either left or right) based on fMRI signals from both ROIsduring kMI of the hand, assisted by a real-time visual feedback display.
Subjects
Eighteen young, healthy, right-handed adult subjects participatedwith informed consent and with the approval of the Research EthicsBoard at Baycrest Hospital, Toronto. To control for practice effects andassess responses to feedback information, subjects were split into twogroups: 13 subjects in the experimental group (27±3 years, 7 male)received “true” NF, whereas 5 subjects in the control group(24±3 years, 2 male) received “sham” NF. The sham NF was yoked tofeedback from a randomly chosen subject in the NF group. The controlgroup treatment was identical to that of the NF group in every otherrespect, allowing for a direct comparison between subjects whoreceived relevant feedback and thosewhose feedbackwas independentof their brain activity.
Imaging
Imaging was performed on a 3.0 T Magnetom TIM Trio system(VB15 software, Siemens Healthcare, Erlangen, Germany) using a 32-channel phased array head coil. Structural imaging was performedusing a T1-weighted 3D MPRAGE sequence, at 1×1×1 mm3 isotropicresolution. All fMRI scans were performed using a modified 16 slice(5 mm) gradient echo T2*-weighted echo-planar imaging (EPI) acquisi-tion, with 3×3 mm2 in-plane resolution, 64×64 matrix, 30 ms TE and1 s TR. Physiological recording of respiratory and cardiac signals wasperformed for all fMRI runs using a respiratory bellows and a pulseoximeter, respectively.
Real-time setup
The Siemens image reconstruction software was modified to pro-vide real-time data transfer to a computer running AFNI (Cox, 1996)on Scientific Linux (www.scientificlinux.org) over a local network con-nection. The “AFNI computer” received one multi-slice, volumetric setof brain image data from the scanner immediately after each TR. Inthe initial functional localizer phase of the experiment, the AFNI com-puter was used to perform a rapid, scripted analysis using the generallinear model (GLM) approach to produce statistical parametric maps(SPMs) identifying subject-specific regions of brain activity suitablefor NF. The localizer experiment employed a simple blocked designalternating 15 s of rest, with 15 s of bilateral hand clenching, left hand(LH) imagery, and right hand (RH) imagery respectively, for a total of300 s. The AFNI computer received the localizer images immediately,and the scripted GLM analysis produced parametric maps identifyingregionsmost active across both the overtmovement andmotor imager-y tasks. Two 5×5×2 voxel (15×15×10 mm3) ROI masks were manu-ally defined over left and rightM1 locations, centered on theM1 regionswith the maximum r2 value in the full F-statistic parametric maps. M1was targeted due to its ease of location and principal role in motoraction, and because potential NF applications in recovery of motor
23M. Chiew et al. / NeuroImage 61 (2012) 21–31
function after stroke may target this region. The ROIs were made largeenough to capture the entire hand motor area in all subjects.
During subsequent NF experiments, mean BOLD signal amplitudeswere calculated for each ROI using the subject-specific masks definedfrom the localizer experiment. A separate “stimulus computer” run-ning Windows XP received these calculated values from the AFNIcomputer with ~300 ms latency from acquisition, using a customdata server built with Python and real-time AFNI protocols. Stimuliwere then calculated and rendered graphically using the VisionEggpython library (Straw, 2008), then presented to the subjects usingan LCD projector, projection screen, and a mirror mounted on thehead coil.
NF experiment
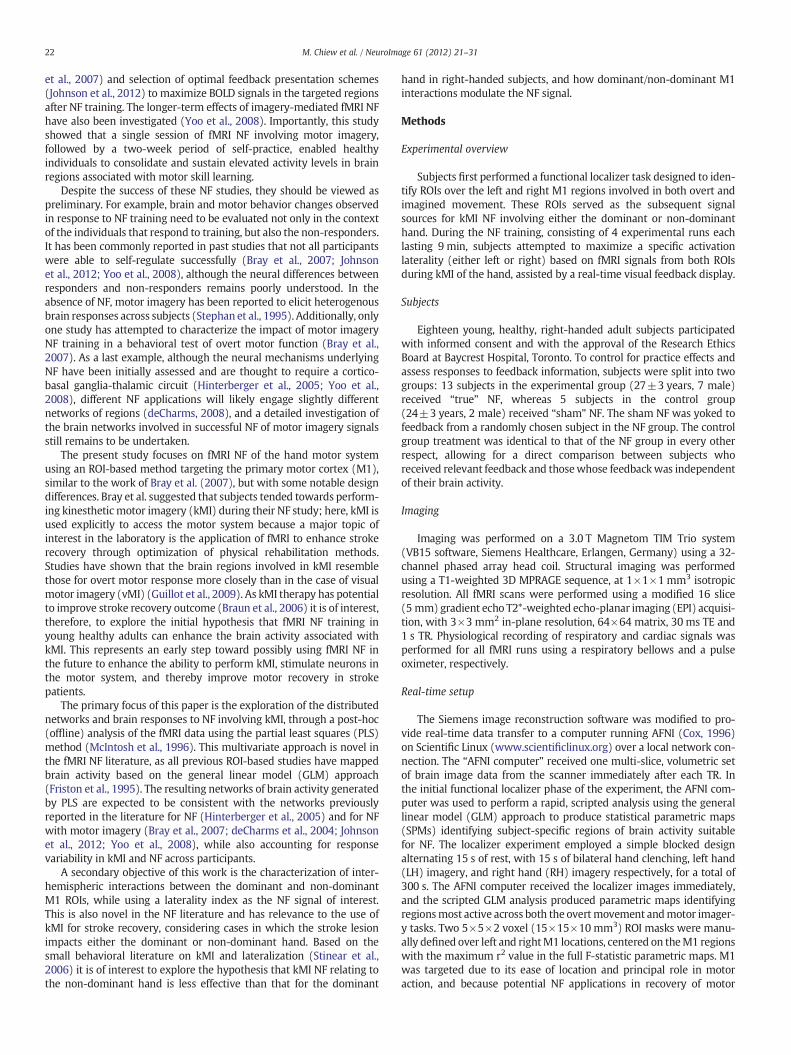
All subjects performed 4 sequential NF training runs, each separatedby 1–2 min of rest. Each run consisted of 12 NF trials: 6 RH trials, and 6LH trials, pseudorandomly ordered. A diagramof an idealizedNF trial is il-lustrated in Fig. 1. Each trial lasted 45 s, consisting of: 20 s rest, cued witha fractal image and text; 5 s of NF cue represented by one of two fractalimages; 15 s of real-time feedback; and 5 s of trial results. The NF cuewas displayed for 5 s to accommodate the associated hemodynamicresponse, so that NF display began after BOLD onset. Cue images werebalanced across subjects, representing RH and LH trials respectively, andremained constant throughout the experiment for each subject.
Subjects were carefully instructed prior to the onset of NF experi-ments. They were asked not to make any overt hand movementsthroughout, except when specifically instructed to do so (see Reactiontime tests, below). When performing imagery, they were specifically
Fig. 1. Example diagram of NF experiment following the functional localizer. Each subject peconsists of twelve 45 s blocks, (6 RH and 6 LH trials each), pseudorandomly ordered. The 45 simagery, and a 5 s result (reward) display. The subjects earned 1 point for each successful trial,trials, 5 for each combination of cue 1×cue 2. Cue 1 was one of the 2 fractal cue images used d
instructed to avoid vMI techniques (seeing in the “mind's eye”), andto focus only on kMI by imagining the execution and feeling of handmovements. Subjects all started with imagined hand clenching, al-though they were free to use any kMI strategy to increase the NF signalas long as the strategy was restricted to single hand movements. Theywere asked to perform kMI immediately on display of the cue and tosustain their performance throughout the NF period. They were nottold which cue was associated with which type of trial; rather, theywere asked to determine the correct associations based on NF. The in-structions were identical for both experimental and control subjects.
During the real-time feedback, subjects viewed a horizontal arrow.The length of the arrow was scaled for every TR in proportion to thelaterality index (LIn), calculated as:
LIn ¼ k � lROInlROIRest
− rROInrROIRest
� �; ð1Þ
where the integer k=+1 for a RH trial, and−1 for a LH trial, lROIn andrROIn indicate the BOLD signal amplitude in the left and right ROIs in thenth TR interval during kMI, respectively; and lROIRest and rROIRest arethe mean BOLD signal amplitude during rest, respectively. This NF sig-nal (a fractional signal difference) was used to control for global ornon-specific activation changes, as well as to explore laterality-specificinteractions. An additional vertical line was overlaid on the display, toprovide subjects with a cumulative, time-averaged representation ofthe laterality index over the duration of the trial:
LI ¼ 1N
XNn¼1
LIn; ð2Þ
rformed four 9 min NF training runs and a pre- and post-reaction time test. Each NF runblock is made up of a 20 s rest period, a 5 s cue, a 15 s period of real-time NF and motorand earned nothing for each failed trial. The two reaction time tests consisted of 20 jittereduring NF, and cue 2 indicated either R or L denoting a RH or LH finger response.
24 M. Chiew et al. / NeuroImage 61 (2012) 21–31
where n is the number of TR intervals from the beginning of the trial,and LIn is the instantaneous value of LI calculated from Eq. (1). Thedirection of LI polarity (positive or negative) was visually presentedsuch that the indicators moved right when RH activity was detected,and vice versa.
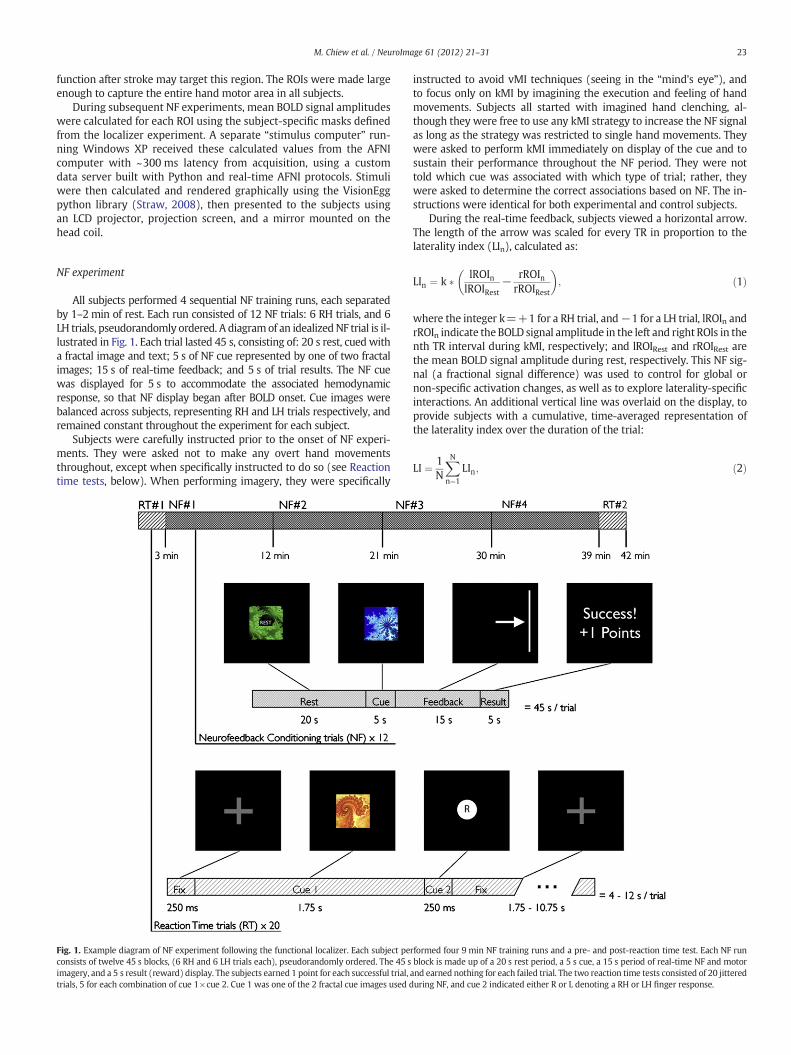
Subjects were asked tomaximize the length of the instantaneous NFarrow once they had determined the cue associations, and trial perfor-mance was evaluated based on the average LI over the entire trial dura-tion. The NF training employed an operant conditioning strategy, wheretrial success was dependent on the LI surpassing a threshold (T) thatwas invisible to the subject. The value of T was changed according to aconditioning schedule (Fig. 2), where 4 consecutive successful trials in-creased T to the smallest value from the previous 4 trials. After 4 consec-utive failed trials, T decreased to the previous T value, to a minimum of0. Subjects received points for each successful trial, and were asked toattain as many points possible. This measure of success was used solelyfor the purpose of accruing reward points in the conditioning proce-dure, and was not used as a measure of NF performance ability. The LIdata were subsequently analyzed using a 3-factor mixed factorialANOVA, with run (1–4) and hand (LH or RH) as the within-subjectfactors, and group as the between-subjects factor.
Reaction time tests
Two reaction time assessments were performed in the scanner,immediately pre- and post-NF to consider the impact of the NF condi-tioning cue associations, and the potential effect of the NF training ona simple overt motor behavior test. Given a logistical requirement toconduct the experiment within a 1 h time frame, the reaction timeassessmentswere eachundertaken in short, 3 min. intervals. The exper-iments were identical, each consisting of 20 time-jittered and pseudor-andomly ordered trials of visually cued button press responsesperformed with the index finger. Two cues were used to prompt thesubjects for each trial: an image cue appeared for 1.75 s, and a reactioncue displaying the letter “R” or “L”was displayed immediately after for
Fig. 2. Flow chart of the instrumental conditioning reward schedule used to change thesuccess thresholds. The threshold starts at 0, and after 4 consecutive above-thresholdtrials, a new threshold is set to be the smallest time averaged LI value from the 4 previoustrials. The threshold decreases only after 4 consecutive below-threshold trials, and is set tobe the previous threshold.
0.25 s, prompting the subjects to respond with their right or left handrespectively. Each test was composed of: 5 RH congruent, 5 RH incon-gruent, 5 LH congruent, and 5 LH incongruent trials. For congruenttrials, the image cue was identical to the cue used in the NF training toperform kMI for the associated hand. For incongruent trials, the imagecue opposed the NF association. Reaction times were measured usingan8-buttonfiber-optic response box system (Current Designs, Philadel-phia, PA), recording button responses from the index finger of eachhand timed from the onset of the reaction cue.
The reaction time data were analyzed using a 4-factor mixedfactorial ANOVA, with time (pre- or post-training), hand (LH or RH),and cue-type (congruent or incongruent) as within-subject factors,and group (NF or control) as the between-subjects factor. Data werenormalized using a log transform to meet normality conditions forparametric statistical testing.
Electromyography
Electromyography (EMG) was recorded for 9 subjects in the NFgroup to verify that no overt muscle activity occurred during imagery.The recordings were performed with an fMRI-compatible EEG system(BrainAmp ExGMR, Brain Products, Munich, Germany), using differen-tial electrodes placed on the extensor carpi radialis longusmuscle of theright forearm. Recordings from 4 subjects in the NF group and thesubjects in the control groupwere not possible due to equipment avail-ability. All subjects were also asked to report any overt movement thatoccurred duringNF. The EMG time courseswere analyzed by comparingthe RMS voltage values for the rest periods and the NF periods usingplanned paired t-tests, after MRI gradient artifact removal using theBrainAmp Analyzer 2 software (version 2.01, Brain Products, Munich,Germany).
Post-experiment
Immediately after the fMRI session, each subject was debriefedregarding their ability determine the NF conditioning cue associations,and were asked to report the degree of engagement they felt with thefeedback signal during NF trials. Control subjects were also askedwhether they perceived that the NF signal was a sham. Severalmonths after the experiment, subjects were assessed using theMIQ-RS questionnaire for motor imagery (Gregg et al., 2010) to assessbaseline ability to perform kMI.
fMRI data analysis
The fMRI data were pre-processed using the AFNI software package(Cox, 1996) to perform rigid body motion correction, physiologicalnoise correction, and spatial smoothing (6 mm Gaussian kernel). Theindividual subject data were then spatially normalized to the MontrealNeurological Institute (MNI) template for group comparison.
Brain activation maps were generated using PLS, a multivariatemethod for determining spatial patterns or networks in brain activitythat maximizes covariances between neuroimaging data and externalmeasures. The external measures can include task design contrasts(task-PLS), external behavioral measures (behavioral-PLS), or fMRIsignals from “seed” voxels (seed-PLS) (McIntosh et al., 1996). Latentvariables (LVs) are output from a singular value decomposition of thecovariance matrix created by cross-covarying the imaging data withthe external measures. These LVs are similar to parametric map outputfrom traditional GLM analysis, except that voxel saliences or weightsreplace model estimates, and bootstrap ratios replace t-values orz-scores. The LVs capture networks of activity spread across the entirebrain. Often the PLS output contains a large number of LVs, and onlythe most interesting and most significant are retained for analysis.Statistical significance and stability are assessed using permutationtests and bootstrap resampling. Bootstrap ratios for each voxel are
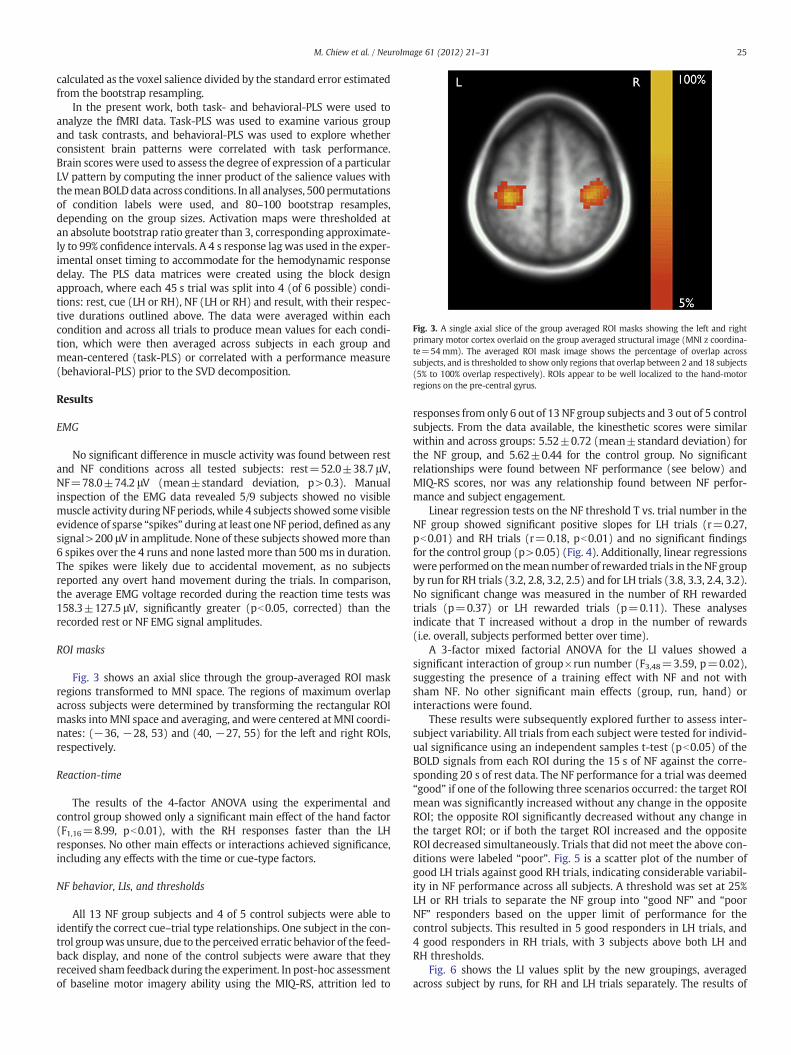
Fig. 3. A single axial slice of the group averaged ROI masks showing the left and rightprimary motor cortex overlaid on the group averaged structural image (MNI z coordina-te=54mm). The averaged ROI mask image shows the percentage of overlap acrosssubjects, and is thresholded to show only regions that overlap between 2 and 18 subjects(5% to 100% overlap respectively). ROIs appear to be well localized to the hand-motorregions on the pre-central gyrus.
25M. Chiew et al. / NeuroImage 61 (2012) 21–31
calculated as the voxel salience divided by the standard error estimatedfrom the bootstrap resampling.
In the present work, both task- and behavioral-PLS were used toanalyze the fMRI data. Task-PLS was used to examine various groupand task contrasts, and behavioral-PLS was used to explore whetherconsistent brain patterns were correlated with task performance.Brain scores were used to assess the degree of expression of a particularLV pattern by computing the inner product of the salience values withthemeanBOLDdata across conditions. In all analyses, 500 permutationsof condition labels were used, and 80–100 bootstrap resamples,depending on the group sizes. Activation maps were thresholded atan absolute bootstrap ratio greater than 3, corresponding approximate-ly to 99% confidence intervals. A 4 s response lagwas used in the exper-imental onset timing to accommodate for the hemodynamic responsedelay. The PLS data matrices were created using the block designapproach, where each 45 s trial was split into 4 (of 6 possible) condi-tions: rest, cue (LH or RH), NF (LH or RH) and result, with their respec-tive durations outlined above. The data were averaged within eachcondition and across all trials to produce mean values for each condi-tion, which were then averaged across subjects in each group andmean-centered (task-PLS) or correlated with a performance measure(behavioral-PLS) prior to the SVD decomposition.
Results
EMG
No significant difference in muscle activity was found between restand NF conditions across all tested subjects: rest=52.0±38.7 μV,NF=78.0±74.2 μV (mean±standard deviation, p>0.3). Manualinspection of the EMG data revealed 5/9 subjects showed no visiblemuscle activity duringNFperiods, while 4 subjects showed somevisibleevidence of sparse “spikes” during at least oneNF period, defined as anysignal>200 μV in amplitude. None of these subjects showedmore than6 spikes over the 4 runs and none lasted more than 500 ms in duration.The spikes were likely due to accidental movement, as no subjectsreported any overt hand movement during the trials. In comparison,the average EMG voltage recorded during the reaction time tests was158.3±127.5 μV, significantly greater (pb0.05, corrected) than therecorded rest or NF EMG signal amplitudes.
ROI masks
Fig. 3 shows an axial slice through the group-averaged ROI maskregions transformed to MNI space. The regions of maximum overlapacross subjects were determined by transforming the rectangular ROImasks intoMNI space and averaging, andwere centered atMNI coordi-nates: (−36, −28, 53) and (40, −27, 55) for the left and right ROIs,respectively.
Reaction-time
The results of the 4-factor ANOVA using the experimental andcontrol group showed only a significant main effect of the hand factor(F1,16=8.99, pb0.01), with the RH responses faster than the LHresponses. No other main effects or interactions achieved significance,including any effects with the time or cue-type factors.
NF behavior, LIs, and thresholds
All 13 NF group subjects and 4 of 5 control subjects were able toidentify the correct cue–trial type relationships. One subject in the con-trol groupwas unsure, due to the perceived erratic behavior of the feed-back display, and none of the control subjects were aware that theyreceived sham feedback during the experiment. In post-hoc assessmentof baseline motor imagery ability using the MIQ-RS, attrition led to
responses from only 6 out of 13 NF group subjects and 3 out of 5 controlsubjects. From the data available, the kinesthetic scores were similarwithin and across groups: 5.52±0.72 (mean±standard deviation) forthe NF group, and 5.62±0.44 for the control group. No significantrelationships were found between NF performance (see below) andMIQ-RS scores, nor was any relationship found between NF perfor-mance and subject engagement.
Linear regression tests on the NF threshold T vs. trial number in theNF group showed significant positive slopes for LH trials (r=0.27,pb0.01) and RH trials (r=0.18, pb0.01) and no significant findingsfor the control group (p>0.05) (Fig. 4). Additionally, linear regressionswere performed on themean number of rewarded trials in theNF groupby run for RH trials (3.2, 2.8, 3.2, 2.5) and for LH trials (3.8, 3.3, 2.4, 3.2).No significant change was measured in the number of RH rewardedtrials (p=0.37) or LH rewarded trials (p=0.11). These analysesindicate that T increased without a drop in the number of rewards(i.e. overall, subjects performed better over time).
A 3-factor mixed factorial ANOVA for the LI values showed asignificant interaction of group×run number (F3,48=3.59, p=0.02),suggesting the presence of a training effect with NF and not withsham NF. No other significant main effects (group, run, hand) orinteractions were found.
These results were subsequently explored further to assess inter-subject variability. All trials from each subject were tested for individ-ual significance using an independent samples t-test (pb0.05) of theBOLD signals from each ROI during the 15 s of NF against the corre-sponding 20 s of rest data. The NF performance for a trial was deemed“good” if one of the following three scenarios occurred: the target ROImean was significantly increased without any change in the oppositeROI; the opposite ROI significantly decreased without any change inthe target ROI; or if both the target ROI increased and the oppositeROI decreased simultaneously. Trials that did not meet the above con-ditions were labeled “poor”. Fig. 5 is a scatter plot of the number ofgood LH trials against good RH trials, indicating considerable variabil-ity in NF performance across all subjects. A threshold was set at 25%LH or RH trials to separate the NF group into “good NF” and “poorNF” responders based on the upper limit of performance for thecontrol subjects. This resulted in 5 good responders in LH trials, and4 good responders in RH trials, with 3 subjects above both LH andRH thresholds.
Fig. 6 shows the LI values split by the new groupings, averagedacross subject by runs, for RH and LH trials separately. The results of
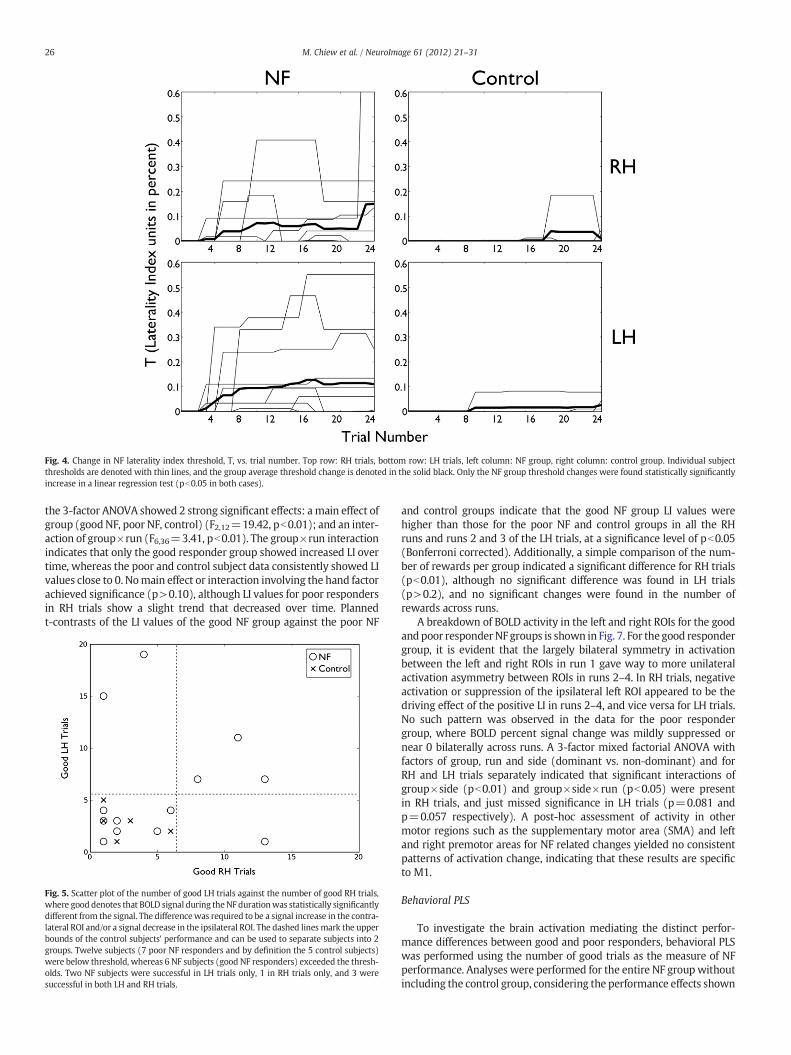
Fig. 4. Change in NF laterality index threshold, T, vs. trial number. Top row: RH trials, bottom row: LH trials, left column: NF group, right column: control group. Individual subjectthresholds are denoted with thin lines, and the group average threshold change is denoted in the solid black. Only the NF group threshold changes were found statistically significantlyincrease in a linear regression test (pb0.05 in both cases).
26 M. Chiew et al. / NeuroImage 61 (2012) 21–31
the 3-factor ANOVA showed 2 strong significant effects: a main effect ofgroup (goodNF, poor NF, control) (F2,12=19.42, pb0.01); and an inter-action of group×run (F6,36=3.41, pb0.01). The group×run interactionindicates that only the good responder group showed increased LI overtime, whereas the poor and control subject data consistently showed LIvalues close to 0. Nomain effect or interaction involving the hand factorachieved significance (p>0.10), although LI values for poor respondersin RH trials show a slight trend that decreased over time. Plannedt-contrasts of the LI values of the good NF group against the poor NF
Fig. 5. Scatter plot of the number of good LH trials against the number of good RH trials,where good denotes that BOLD signal during theNF durationwas statistically significantlydifferent from the signal. The differencewas required to be a signal increase in the contra-lateral ROI and/or a signal decrease in the ipsilateral ROI. The dashed lines mark the upperbounds of the control subjects' performance and can be used to separate subjects into 2groups. Twelve subjects (7 poor NF responders and by definition the 5 control subjects)were below threshold, whereas 6 NF subjects (good NF responders) exceeded the thresh-olds. Two NF subjects were successful in LH trials only, 1 in RH trials only, and 3 weresuccessful in both LH and RH trials.
and control groups indicate that the good NF group LI values werehigher than those for the poor NF and control groups in all the RHruns and runs 2 and 3 of the LH trials, at a significance level of pb0.05(Bonferroni corrected). Additionally, a simple comparison of the num-ber of rewards per group indicated a significant difference for RH trials(pb0.01), although no significant difference was found in LH trials(p>0.2), and no significant changes were found in the number ofrewards across runs.
A breakdown of BOLD activity in the left and right ROIs for the goodandpoor responderNF groups is shown in Fig. 7. For the good respondergroup, it is evident that the largely bilateral symmetry in activationbetween the left and right ROIs in run 1 gave way to more unilateralactivation asymmetry between ROIs in runs 2–4. In RH trials, negativeactivation or suppression of the ipsilateral left ROI appeared to be thedriving effect of the positive LI in runs 2–4, and vice versa for LH trials.No such pattern was observed in the data for the poor respondergroup, where BOLD percent signal change was mildly suppressed ornear 0 bilaterally across runs. A 3-factor mixed factorial ANOVA withfactors of group, run and side (dominant vs. non-dominant) and forRH and LH trials separately indicated that significant interactions ofgroup×side (pb0.01) and group×side×run (pb0.05) were presentin RH trials, and just missed significance in LH trials (p=0.081 andp=0.057 respectively). A post-hoc assessment of activity in othermotor regions such as the supplementary motor area (SMA) and leftand right premotor areas for NF related changes yielded no consistentpatterns of activation change, indicating that these results are specificto M1.
Behavioral PLS
To investigate the brain activation mediating the distinct perfor-mance differences between good and poor responders, behavioral PLSwas performed using the number of good trials as the measure of NFperformance. Analyses were performed for the entire NF groupwithoutincluding the control group, considering the performance effects shown
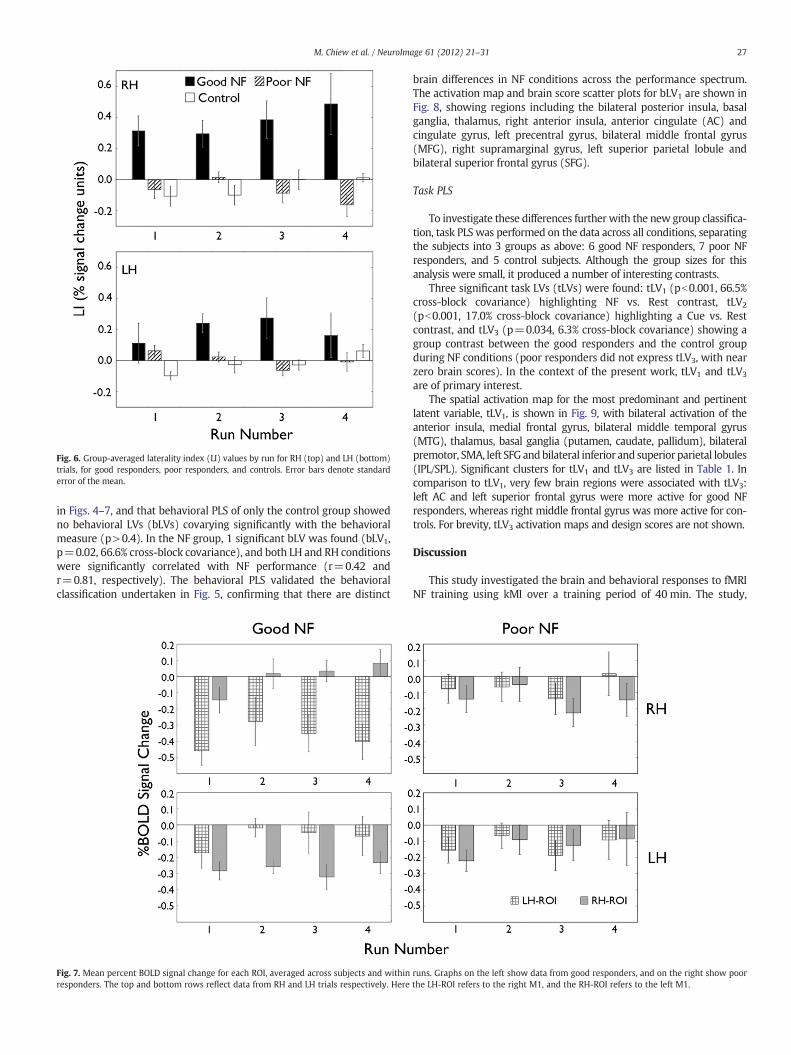
Fig. 6. Group-averaged laterality index (LI) values by run for RH (top) and LH (bottom)trials, for good responders, poor responders, and controls. Error bars denote standarderror of the mean.
27M. Chiew et al. / NeuroImage 61 (2012) 21–31
in Figs. 4–7, and that behavioral PLS of only the control group showedno behavioral LVs (bLVs) covarying significantly with the behavioralmeasure (p>0.4). In the NF group, 1 significant bLV was found (bLV1,p=0.02, 66.6% cross-block covariance), and both LH and RH conditionswere significantly correlated with NF performance (r=0.42 andr=0.81, respectively). The behavioral PLS validated the behavioralclassification undertaken in Fig. 5, confirming that there are distinct
Fig. 7. Mean percent BOLD signal change for each ROI, averaged across subjects and withinresponders. The top and bottom rows reflect data from RH and LH trials respectively. Here
brain differences in NF conditions across the performance spectrum.The activation map and brain score scatter plots for bLV1 are shown inFig. 8, showing regions including the bilateral posterior insula, basalganglia, thalamus, right anterior insula, anterior cingulate (AC) andcingulate gyrus, left precentral gyrus, bilateral middle frontal gyrus(MFG), right supramarginal gyrus, left superior parietal lobule andbilateral superior frontal gyrus (SFG).
Task PLS
To investigate these differences further with the new group classifica-tion, task PLS was performed on the data across all conditions, separatingthe subjects into 3 groups as above: 6 good NF responders, 7 poor NFresponders, and 5 control subjects. Although the group sizes for thisanalysis were small, it produced a number of interesting contrasts.
Three significant task LVs (tLVs) were found: tLV1 (pb0.001, 66.5%cross-block covariance) highlighting NF vs. Rest contrast, tLV2
(pb0.001, 17.0% cross-block covariance) highlighting a Cue vs. Restcontrast, and tLV3 (p=0.034, 6.3% cross-block covariance) showing agroup contrast between the good responders and the control groupduring NF conditions (poor responders did not express tLV3, with nearzero brain scores). In the context of the present work, tLV1 and tLV3
are of primary interest.The spatial activation map for the most predominant and pertinent
latent variable, tLV1, is shown in Fig. 9, with bilateral activation of theanterior insula, medial frontal gyrus, bilateral middle temporal gyrus(MTG), thalamus, basal ganglia (putamen, caudate, pallidum), bilateralpremotor, SMA, left SFG andbilateral inferior and superior parietal lobules(IPL/SPL). Significant clusters for tLV1 and tLV3 are listed in Table 1. Incomparison to tLV1, very few brain regions were associated with tLV3:left AC and left superior frontal gyrus were more active for good NFresponders, whereas right middle frontal gyrus was more active for con-trols. For brevity, tLV3 activation maps and design scores are not shown.
Discussion
This study investigated the brain and behavioral responses to fMRINF training using kMI over a training period of 40 min. The study,
runs. Graphs on the left show data from good responders, and on the right show poorthe LH-ROI refers to the right M1, and the RH-ROI refers to the left M1.
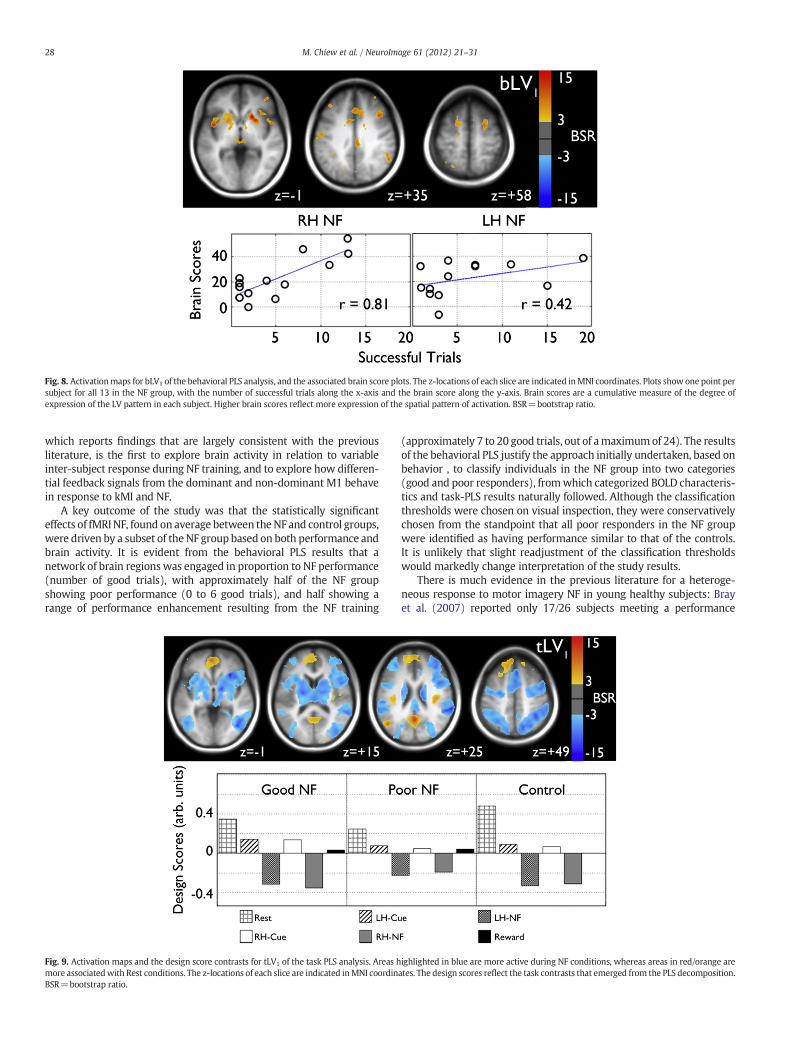
Fig. 8. Activationmaps for bLV1 of the behavioral PLS analysis, and the associated brain score plots. The z-locations of each slice are indicated inMNI coordinates. Plots show one point persubject for all 13 in the NF group, with the number of successful trials along the x-axis and the brain score along the y-axis. Brain scores are a cumulative measure of the degree ofexpression of the LV pattern in each subject. Higher brain scores reflect more expression of the spatial pattern of activation. BSR=bootstrap ratio.
28 M. Chiew et al. / NeuroImage 61 (2012) 21–31
which reports findings that are largely consistent with the previousliterature, is the first to explore brain activity in relation to variableinter-subject response during NF training, and to explore how differen-tial feedback signals from the dominant and non-dominant M1 behavein response to kMI and NF.
A key outcome of the study was that the statistically significanteffects of fMRINF, found on average between theNF and control groups,were driven by a subset of theNF group based on both performance andbrain activity. It is evident from the behavioral PLS results that anetwork of brain regions was engaged in proportion to NF performance(number of good trials), with approximately half of the NF groupshowing poor performance (0 to 6 good trials), and half showing arange of performance enhancement resulting from the NF training
Fig. 9. Activation maps and the design score contrasts for tLV1 of the task PLS analysis. Areas hmore associatedwith Rest conditions. The z-locations of each slice are indicated inMNI coordinBSR=bootstrap ratio.
(approximately 7 to 20 good trials, out of amaximumof 24). The resultsof the behavioral PLS justify the approach initially undertaken, based onbehavior , to classify individuals in the NF group into two categories(good and poor responders), fromwhich categorized BOLD characteris-tics and task-PLS results naturally followed. Although the classificationthresholds were chosen on visual inspection, they were conservativelychosen from the standpoint that all poor responders in the NF groupwere identified as having performance similar to that of the controls.It is unlikely that slight readjustment of the classification thresholdswould markedly change interpretation of the study results.
There is much evidence in the previous literature for a heteroge-neous response to motor imagery NF in young healthy subjects: Brayet al. (2007) reported only 17/26 subjects meeting a performance
ighlighted in blue are more active during NF conditions, whereas areas in red/orange areates. The design scores reflect the task contrasts that emerged from the PLS decomposition.
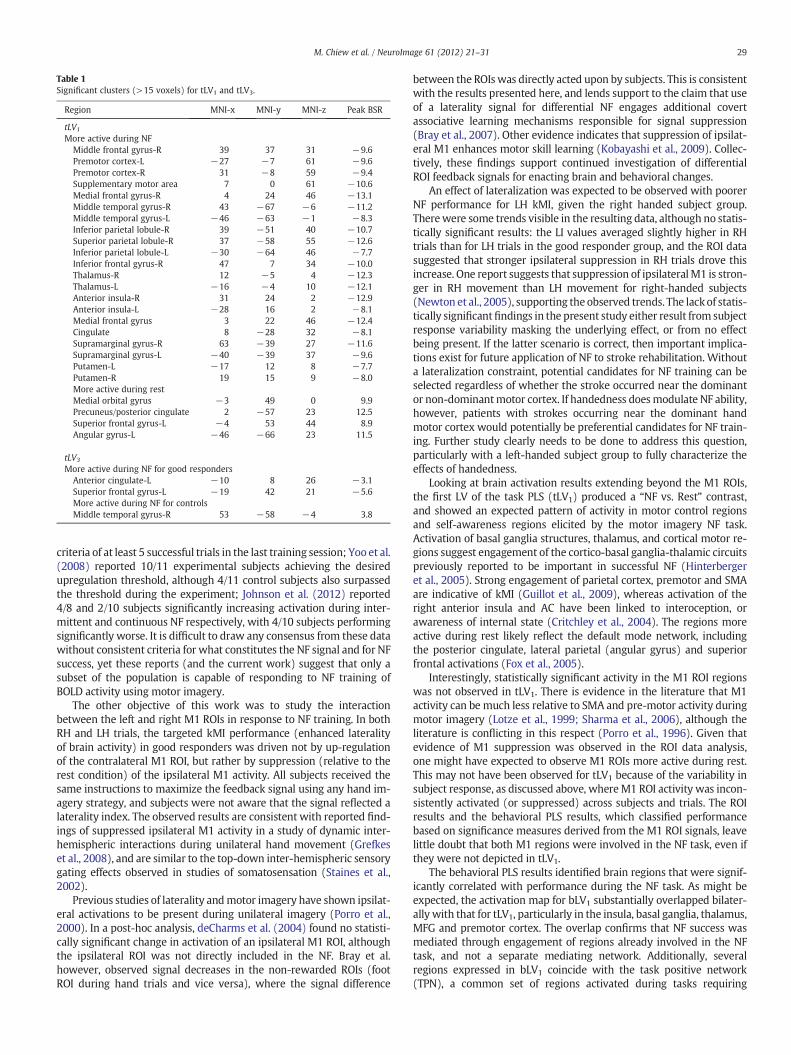
Table 1Significant clusters (>15 voxels) for tLV1 and tLV3.
Region MNI-x MNI-y MNI-z Peak BSR
tLV1
More active during NFMiddle frontal gyrus-R 39 37 31 −9.6Premotor cortex-L −27 −7 61 −9.6Premotor cortex-R 31 −8 59 −9.4Supplementary motor area 7 0 61 −10.6Medial frontal gyrus-R 4 24 46 −13.1Middle temporal gyrus-R 43 −67 −6 −11.2Middle temporal gyrus-L −46 −63 −1 −8.3Inferior parietal lobule-R 39 −51 40 −10.7Superior parietal lobule-R 37 −58 55 −12.6Inferior parietal lobule-L −30 −64 46 −7.7Inferior frontal gyrus-R 47 7 34 −10.0Thalamus-R 12 −5 4 −12.3Thalamus-L −16 −4 10 −12.1Anterior insula-R 31 24 2 −12.9Anterior insula-L −28 16 2 −8.1Medial frontal gyrus 3 22 46 −12.4Cingulate 8 −28 32 −8.1Supramarginal gyrus-R 63 −39 27 −11.6Supramarginal gyrus-L −40 −39 37 −9.6Putamen-L −17 12 8 −7.7Putamen-R 19 15 9 −8.0More active during restMedial orbital gyrus −3 49 0 9.9Precuneus/posterior cingulate 2 −57 23 12.5Superior frontal gyrus-L −4 53 44 8.9Angular gyrus-L −46 −66 23 11.5
tLV3
More active during NF for good respondersAnterior cingulate-L −10 8 26 −3.1Superior frontal gyrus-L −19 42 21 −5.6More active during NF for controlsMiddle temporal gyrus-R 53 −58 −4 3.8
29M. Chiew et al. / NeuroImage 61 (2012) 21–31
criteria of at least 5 successful trials in the last training session; Yoo et al.(2008) reported 10/11 experimental subjects achieving the desiredupregulation threshold, although 4/11 control subjects also surpassedthe threshold during the experiment; Johnson et al. (2012) reported4/8 and 2/10 subjects significantly increasing activation during inter-mittent and continuous NF respectively, with 4/10 subjects performingsignificantly worse. It is difficult to draw any consensus from these datawithout consistent criteria for what constitutes the NF signal and for NFsuccess, yet these reports (and the current work) suggest that only asubset of the population is capable of responding to NF training ofBOLD activity using motor imagery.
The other objective of this work was to study the interactionbetween the left and right M1 ROIs in response to NF training. In bothRH and LH trials, the targeted kMI performance (enhanced lateralityof brain activity) in good responders was driven not by up-regulationof the contralateral M1 ROI, but rather by suppression (relative to therest condition) of the ipsilateral M1 activity. All subjects received thesame instructions to maximize the feedback signal using any hand im-agery strategy, and subjects were not aware that the signal reflected alaterality index. The observed results are consistent with reported find-ings of suppressed ipsilateral M1 activity in a study of dynamic inter-hemispheric interactions during unilateral hand movement (Grefkeset al., 2008), and are similar to the top-down inter-hemispheric sensorygating effects observed in studies of somatosensation (Staines et al.,2002).
Previous studies of laterality andmotor imagery have shown ipsilat-eral activations to be present during unilateral imagery (Porro et al.,2000). In a post-hoc analysis, deCharms et al. (2004) found no statisti-cally significant change in activation of an ipsilateral M1 ROI, althoughthe ipsilateral ROI was not directly included in the NF. Bray et al.however, observed signal decreases in the non-rewarded ROIs (footROI during hand trials and vice versa), where the signal difference
between the ROIswas directly acted upon by subjects. This is consistentwith the results presented here, and lends support to the claim that useof a laterality signal for differential NF engages additional covertassociative learning mechanisms responsible for signal suppression(Bray et al., 2007). Other evidence indicates that suppression of ipsilat-eral M1 enhances motor skill learning (Kobayashi et al., 2009). Collec-tively, these findings support continued investigation of differentialROI feedback signals for enacting brain and behavioral changes.
An effect of lateralization was expected to be observed with poorerNF performance for LH kMI, given the right handed subject group.Therewere some trends visible in the resulting data, although no statis-tically significant results: the LI values averaged slightly higher in RHtrials than for LH trials in the good responder group, and the ROI datasuggested that stronger ipsilateral suppression in RH trials drove thisincrease. One report suggests that suppression of ipsilateralM1 is stron-ger in RH movement than LH movement for right-handed subjects(Newton et al., 2005), supporting the observed trends. The lack of statis-tically significantfindings in the present study either result from subjectresponse variability masking the underlying effect, or from no effectbeing present. If the latter scenario is correct, then important implica-tions exist for future application of NF to stroke rehabilitation. Withouta lateralization constraint, potential candidates for NF training can beselected regardless of whether the stroke occurred near the dominantor non-dominantmotor cortex. If handedness doesmodulate NF ability,however, patients with strokes occurring near the dominant handmotor cortex would potentially be preferential candidates for NF train-ing. Further study clearly needs to be done to address this question,particularly with a left-handed subject group to fully characterize theeffects of handedness.
Looking at brain activation results extending beyond the M1 ROIs,the first LV of the task PLS (tLV1) produced a “NF vs. Rest” contrast,and showed an expected pattern of activity in motor control regionsand self-awareness regions elicited by the motor imagery NF task.Activation of basal ganglia structures, thalamus, and cortical motor re-gions suggest engagement of the cortico-basal ganglia-thalamic circuitspreviously reported to be important in successful NF (Hinterbergeret al., 2005). Strong engagement of parietal cortex, premotor and SMAare indicative of kMI (Guillot et al., 2009), whereas activation of theright anterior insula and AC have been linked to interoception, orawareness of internal state (Critchley et al., 2004). The regions moreactive during rest likely reflect the default mode network, includingthe posterior cingulate, lateral parietal (angular gyrus) and superiorfrontal activations (Fox et al., 2005).
Interestingly, statistically significant activity in the M1 ROI regionswas not observed in tLV1. There is evidence in the literature that M1activity can be much less relative to SMA and pre-motor activity duringmotor imagery (Lotze et al., 1999; Sharma et al., 2006), although theliterature is conflicting in this respect (Porro et al., 1996). Given thatevidence of M1 suppression was observed in the ROI data analysis,one might have expected to observe M1 ROIs more active during rest.This may not have been observed for tLV1 because of the variability insubject response, as discussed above, whereM1 ROI activity was incon-sistently activated (or suppressed) across subjects and trials. The ROIresults and the behavioral PLS results, which classified performancebased on significance measures derived from the M1 ROI signals, leavelittle doubt that both M1 regions were involved in the NF task, even ifthey were not depicted in tLV1.
The behavioral PLS results identified brain regions that were signif-icantly correlated with performance during the NF task. As might beexpected, the activation map for bLV1 substantially overlapped bilater-ally with that for tLV1, particularly in the insula, basal ganglia, thalamus,MFG and premotor cortex. The overlap confirms that NF success wasmediated through engagement of regions already involved in the NFtask, and not a separate mediating network. Additionally, severalregions expressed in bLV1 coincide with the task positive network(TPN), a common set of regions activated during tasks requiring
30 M. Chiew et al. / NeuroImage 61 (2012) 21–31
attention modulation (Fox et al., 2005). These regions include the fron-tal eye fields (premotor), insula and dorsolateral prefrontal areas. Thisobservation suggests that expression of the TPN is positively correlatedwith successful NF, and that expression of the TPN may reflect subjectengagement in the NF training. Empirically, TPN expression representsa strong marker for NF performance in RH trials with 65.6% explainedvariance, and to a lesser extent in LH trials with 17.6% explainedvariance. Although this study did not control for the effects of attention,evidence for co-expression of attentional networks during NF possiblyindicates that attentional processes are a major factor mediating NFperformance. This is supported by the fact that the difference in thenumber of rewards given between good and poor responders for RHtrials is constant with time, and evident even in the first run, indicatingthat success is not a learning effect and may be better explained as anattentional effect. Because no significant differences were found in thenumber of rewards given between groups in LH trials, however, thebehavior of all good responders cannot be explained solely by an atten-tional effect of having more rewards. Future work could be undertakento assess the underlying causal linkage of TPN expression andNFperfor-mance, and a deeper exploration into other factors contributing to per-formance variation.
The tLV3 results account for much less of the explained covariance(6.3% versus 66.5% for tLV1), but are of interest nevertheless becausethey highlight brain regions that were significantly different in thegood responder group compared to the control group during the NFtrials. To date, only two studies employing sham feedback controlgroups have looked at group differences in brain activity, both using aGLM analysis (Johnson et al., 2012; Yoo et al., 2008). In the presentwork, left lateralized AC and SFG were found to be significantly moreactive in the good responder group, compared to increased right MTGactivation in the control group. Both theAC and SFGhave been implicat-ed in studies of general feedback processing (Mies et al., 2011), withboth responding more to positive feedback, and the left SFG also sensi-tive to feedback validity. Response variability, particularly across goodresponders in the NF group, may account for the sparse pattern ofbrain activity observed in tLV3.
In comparison, Yoo et al. (2008) found left pre-central gyrus, bilater-al post-central gyrus, right MTG and right parahippocampal gyrusactivation in an experimental>control contrast, and right medial fron-tal gyrus, right inferior parietal lobule, left cuneus and bilateral precu-neus in the control>experimental contrast. Interestingly, Johnsonet al. (2012) did not find any significant activation in an experimen-tal>control contrast, but didfind activation in the control>experimen-tal contrast, including the right MTG reported here. The lack of strongconsensus between these studies and the tLV3 results of the presentstudymay be due to differences in experiment design and the particularaspect of brain activity chosen for NF training, and in the details of thetraining procedure.
In the simple reaction time analysis, the significant main effect ofhand (indicating subjects reacted faster in RH trials compared to LHtrials) is an expected result given that subjects were all RH dominant.The lack of any significant main or interaction effects for the groupfactor suggests that the NF training did not affect visuomotor responsetimes over the duration tested, but it should also be acknowledgedthat the number of reaction time trials was rather low in this experi-ment (5 per condition per hand, 40 total), limiting statistical power todetect changes. Further studies specifically investigating the effect ofNF training on overt motor performance will be necessary to providea more conclusive picture of NF training effects.
Future directions for NF investigation include analyses to determinepredictors for NF success, toward improving NF technology forresponders and the exclusion of non-responders. One potential targetfor the selection process could involve expression of the TPN as foundin this work. Adoption of whole brain classification approaches(LaConte, 2011) may prove advantageous in targeting entire networksof regions, and for enhancing overall NF efficacy. Future work may
also include investigation of NF ROIs in non-primary motor regionsinvolved in motor learning and skill acquisition (Ungerleider et al.,2002), or use of more sophisticated methods for calculating real-timeBOLD estimates (Hinds et al., 2011), which may lead to more sensitiveand robust feedback measures. Alternative feedback signals may alsobe of interest, including targeting BOLD signal variance measures(Garrett et al., 2010) instead of the commonly employed mean BOLDmeasures.
Lastly, NF might potentially be used in the long term as an aid inlearning to perform kMI more effectively for use in imagery therapy topromote stroke recovery (Braun et al., 2006; de Vries and Mulder,2007; Sharma et al., 2006). For example, NF could potentially be usedto train individuals to perform kMI over vMI by rewarding increasedactivity in primary motor regions and decreased activity in primaryvisual areas. Alternatively, NF training could be used potentially to iden-tify those who can perform kMIwell, distinguishing them as candidatesfor imagery-based therapeutic intervention.We anticipate that some ofthe above issues will be topics of future investigation in our laboratory.
Acknowledgments
The authors would like to thank the anonymous reviewers for theirinsightful and helpful comments. This research was funded by theCanadian Institutes of Health Research (CIHR) and the Heart and StrokeFoundation of Ontario (HSFO).
References
Braun, S.M., Beurskens, A.J., Borm, P.J., Schack, T., Wade, D.T., 2006. The effects of mentalpractice in stroke rehabilitation: a systematic review. Arch. Phys. Med. Rehabil. 87,842–852.
Bray, S., Shimojo, S., O'Doherty, J.P., 2007. Direct instrumental conditioning of neuralactivity using functional magnetic resonance imaging-derived reward feedback.J. Neurosci. 27, 7498–7507.
Caria, A., Veit, R., Sitaram, R., Lotze, M., Weiskopf, N., Grodd, W., Birbaumer, N., 2007.Regulation of anterior insular cortex activity using real-time fMRI. NeuroImage35, 1238–1246.
Cox, R.W., 1996. AFNI: software for analysis and visualization of functional magneticresonance neuroimages. Comput. Biomed. Res. 29, 162–173.
Cox, R.W., Jesmanowicz, A., Hyde, J.S., 1995. Real-time functional magnetic resonanceimaging. Magn. Reson. Med. 33, 230–236.
Critchley, H.D., Wiens, S., Rotshtein, P., Ohman, A., Dolan, R.J., 2004. Neural systemssupporting interoceptive awareness. Nat. Neurosci. 7, 189–195.
de Vries, S., Mulder, T., 2007. Motor imagery and stroke rehabilitation: a critical discussion.J. Rehab. Med. 39, 5–13.
deCharms, R.C., 2007. Reading and controlling human brain activation using real-timefunctional magnetic resonance imaging. Trends Cogn. Sci. (Regul. Ed.) 11, 473–481.
deCharms, R.C., 2008. Applications of real-time fMRI. Nat. Rev. Neurosci. 9, 720–729.deCharms, R.C., Christoff, K., Glover, G.H., Pauly, J.M., Whitfield, S., Gabrieli, J.D.E., 2004.
Learned regulation of spatially localized brain activation using real-time fMRI.NeuroImage 21, 436–443.
deCharms, R.C., Maeda, F., Glover, G.H., Ludlow, D., Pauly, J.M., Soneji, D., Gabrieli, J.D.E.,Mackey, S.C., 2005. Control over brain activation and pain learned by usingreal-time functional MRI. Proc. Natl. Acad. Sci. U. S. A. 102, 18626–18631.
Eklund, A., Ohlsson, H., Andersson, M., Rydell, J., Ynnerman, A., Knutsson, H., 2009.Using real-time fMRI to control a dynamical system by brain activity classification.MICCAI 12, 1000–1008.
Fox, M.D., Snyder, A.Z., Vincent, J.L., Corbetta, M., Van Essen, D.C., Raichle, M.E., 2005.The human brain is intrinsically organized into dynamic, anticorrelated functionalnetworks. Proc. Natl. Acad. Sci. U. S. A. 102, 9673–9678.
Friston, K.J., Holmes, A.P., Worsley, K.J., Poline, J.P., Frith, C.D., Frackowiak, R.S.J., 1995.Statistical parametric maps in functional imaging: a general linear approach.Hum. Brain Mapp. 2, 189–210.
Garrett, D.D., Kovacevic, N., McIntosh, A.R., Grady, C.L., 2010. Blood oxygen level-dependent signal variability is more than just noise. J. Neurosci. 30, 4914–4921.
Grefkes, C., Eickhoff, S.B., Nowak, D.A., Dafotakis, M., Fink, G.R., 2008. Dynamic intra- andinterhemispheric interactions during unilateral and bilateral hand movementsassessed with fMRI and DCM. NeuroImage 41, 1382–1394.
Gregg, M., Hall, C., Butler, A., 2010. The MIQ-RS: a suitable option for examining movementimagery ability. Evid. Based Complement. Altern. Med. 7, 249–257.
Guillot, A., Collet, C., Nguyen, V.A., Malouin, F., Richards, C., Doyon, J., 2009. Brain activityduring visual versus kinesthetic imagery: an fMRI study. Hum Brain Mapp. 30,2157–2172.
Haller, S., Birbaumer, N., Veit, R., 2010. Real-time fMRI feedback training may improvechronic tinnitus. Eur. Radiol. 20, 696–703.
Hamilton, J.P., Glover, G.H., Hsu, J.-J., Johnson, R.F., Gotlib, I.H., 2011. Modulation ofsubgenual anterior cingulate cortex activity with real-time neurofeedback. Hum.Brain Mapp. 32, 22–31.
31M. Chiew et al. / NeuroImage 61 (2012) 21–31
Hinds, O., Ghosh, S., Thompson, T.W., Yoo, J.J., Whitfield-Gabrieli, S., Triantafyllou, C.,Gabrieli, J.D.E., 2011. Computing moment-to-moment BOLD activation for real-timeneurofeedback. NeuroImage 54, 361–368.
Hinterberger, T., Veit, R., Wilhelm, B., Weiskopf, N., Vatine, J.-J., Birbaumer, N., 2005.Neuronal mechanisms underlying control of a brain–computer interface. Eur. J.Neurosci. 21, 3169–3181.
Hollmann, M., Mönch, T., Müller, C., Bernarding, J., 2009. Predicting human decisions insocioeconomic interaction using real-time functional magnetic resonance imaging(rtfMRI). Proc. SPIE - Med. Imaging 7262, 72621K.
Johnson, K.A., Hartwell, K., Lematty, T., Borckardt, J., Morgan, P.S., Govindarajan, K.,Brady, K., George, M.S., 2012. Intermittent "real-time" fMRI feedback is superiorto continuous presentation for a motor imagery task: a pilot study. J Neuroimaging22, 58–66.
Johnston, S.J., Boehm, S.G., Healy, D., Goebel, R., Linden, D.E.J., 2010. Neurofeedback: apromising tool for the self-regulation of emotion networks. NeuroImage 49,1066–1072.
Johnston, S., Linden, D.E.J., Healy, D., Goebel, R., Habes, I., Boehm, S.G., 2011. Upregulationof emotion areas through neurofeedback with a focus on positive mood. Cogn. Affect.Behav. Neurosci. 11, 44–51.
Kobayashi, M., Théoret, H., Pascual-Leone, A., 2009. Suppression of ipsilateral motorcortex facilitates motor skill learning. Eur. J. Neurosci. 29, 833–836.
LaConte, S.M., 2011. Decoding fMRI brain states in real-time. NeuroImage 56, 440–454.LaConte, S.M., Peltier, S.J., Hu, X.P., 2007. Real-time fMRI using brain-state classification.
Hum. Brain Mapp. 28, 1033–1044.Lotze, M., Montoya, P., Erb, M., Hülsmann, E., Flor, H., Klose, U., Birbaumer, N., Grodd,
W., 1999. Activation of cortical and cerebellar motor areas during executed andimagined hand movements: an fMRI study. J. Cogn. Neurosci. 11, 491–501.
McIntosh, A.R., Bookstein, F.L., Haxby, J.V., Grady, C.L., 1996. Spatial pattern analysis offunctional brain images using partial least squares. NeuroImage 3, 143–157.
Mies, G.W., van der Molen, M.W., Smits, M., Hengeveld, M.W., van der Veen, F.M., 2011.The anterior cingulate cortex responds differently to the validity and valence offeedback in a time-estimation task. Neuroimage 56, 2321–2328.
Newton, J.M., Sunderland, A., Gowland, P.A., 2005. fMRI signal decreases in ipsilateralprimary motor cortex during unilateral hand movements are related to durationand side of movement. NeuroImage 24, 1080–1087.
Porro, C.A., Francescato, M.P., Cettolo, V., Diamond, M.E., Baraldi, P., Zuiani, C., Bazzocchi,M., di Prampero, P.E., 1996. Primary motor and sensory cortex activation duringmotor performance and motor imagery: a functional magnetic resonance imagingstudy. J. Neurosci. 16, 7688–7698.
Porro, C.A., Cettolo, V., Francescato, M.P., Baraldi, P., 2000. Ipsilateral involvement ofprimary motor cortex during motor imagery. Eur. J. Neurosci. 12, 3059–3063.
Posse, S., Fitzgerald, D., Gao, K., Habel, U., Rosenberg, D., Moore, G.J., Schneider, F., 2003.Real-time fMRI of temporolimbic regions detects amygdala activation duringsingle-trial self-induced sadness. NeuroImage 18, 760–768.
Rota, G., Sitaram, R., Veit, R., Erb, M., Weiskopf, N., Dogil, G., Birbaumer, N., 2009. Self-regulation of regional cortical activity using real-time fMRI: the right inferior frontalgyrus and linguistic processing. Hum. Brain Mapp. 30, 1605–1614.
Sharma, N., Pomeroy, V.M., Baron, J.-C., 2006. Motor imagery: a backdoor to the motorsystem after stroke? Stroke 37, 1941–1952.
Staines, W.R., Graham, S.J., Black, S.E., McIlroy, W.E., 2002. Task-relevant modulation ofcontralateral and ipsilateral primary somatosensory cortex and the role of aprefrontal-cortical sensory gating system. NeuroImage 15, 190–199.
Stephan, K.M., Fink, G.R., Passingham, R.E., Silbersweig, D., Ceballos-Baumann, A.O., Frith,C.D., Frackowiak, R.S., 1995. Functional anatomy of the mental representation ofupper extremity movements in healthy subjects. J. Neurophysiol. 73, 373–386.
Stinear, C.M., Fleming, M.K., Byblow, W.D., 2006. Lateralization of unimanual and bi-manual motor imagery. Brain Res. 1095, 139–147.
Straw, A.D., 2008. Vision egg: an open-source library for realtime visual stimulus generation.Front. Neuroinform. 2, 4.
Ungerleider, L.G., Doyon, J., Karni, A., 2002. Imaging brain plasticity during motor skilllearning. Neurobiol. Learn. Mem. 78, 553–564.
Voyvodic, J.T., 1999. Real-time fMRI paradigm control, physiology, and behavior combinedwith near real-time statistical analysis. NeuroImage 10, 91–106.
Weiskopf, N., Veit, R., Erb, M., Mathiak, K., Grodd, W., Goebel, R., Birbaumer, N., 2003.Physiological self-regulation of regional brain activity using real-time functionalmagnetic resonance imaging (fMRI): methodology and exemplary data. NeuroImage19, 577–586.
Yoo, S.-S., Jolesz, F.A., 2002. Functional MRI for neurofeedback: feasibility study on ahand motor task. Neuroreport 13, 1377–1381.
Yoo, S.-S., O'Leary, H.M., Fairneny, T., Chen, N.-K., Panych, L.P., Park, H., Jolesz, F.A., 2006.Increasing cortical activity in auditory areas through neurofeedback functionalmagnetic resonance imaging. Neuroreport 17, 1273–1278.
Yoo, S.-S., Lee, J.-H., O'Leary, H.M., Lee, V., Choo, S.-E., Jolesz, F.A., 2007. Functionalmagnetic resonance imaging-mediated learning of increased activity in auditoryareas. Neuroreport 18, 1915–1920.
Yoo, S.-S., Lee, J.-H., O'Leary, H., Panych, L.P., Jolesz, F.A., 2008. Neurofeedback fMRI-mediatedlearning and consolidation of regional brain activation during motor imagery. Int. J.Imaging Syst. Technol. 18, 69–78.