investigation of bridge abutment displacements constructed...
TRANSCRIPT
1
Investigation of bridge abutment displacements
constructed on piles and geogrid reinforced soil using
the finite element method
Hasan Taherkhani1*
Assistant Professor, Civil Engineering Department, University of Zanjan
Milad Tajdini
2
Ph.D. Candidate of Civil engineering, University of Tabriz
Abdolreza Rezaee Arjroodi3
Associated Researcher,Road, Housing & Urban Development Research Center,
Tehran
Hosein Zartaj4
Ph.D. Candidate of Civil engineering, University of Tabriz
1- e-mail: [email protected]
Address: Civil Engineering Department, University of Zanjan, Zanjan, Iran
Phone Number:+982433054206
Mobile Number: 2- e-mail: [email protected]
Address: Tabriz University-Department of Civil Engineering-East Azarbaijan Province-Iran
Phone Number: +9821-22114681
Mobile Number: 3- e-mal: [email protected]
Address: Hekmat St., Marvi St., Next to Shahrak Farhangian, Sheikh Fazlollah Noori Exp. Way,
Tehran, Iran
Phone Number.: +98-21-88255942-6
Mobile Number:
4- e-mail: [email protected]
Address: Tabriz University-Department of Civil Engineering-East Azarbaijan Province-Iran
Phone Number: +98131-4861369
Mobile Number:
ABSTRACT:

2
One of the major problems in highway and railway bridges is the settlement of
the bridge abutments, which its reduction has always been set as the research
target. Two methods which have been widely used for controlling the settlement
are either reinforcing the abutment subsoil with geogrid orconstructing the
abutments on piles. This paper describes the application of a two-dimensional
finite element method (FEM) by using Plaxis2D V8.5 for comparing the
performance of these two methods. The effect of the geogrid normal stiffness,
length and depth of reinforcement on the horizontal and vertical displacement of
abutment is also investigated. Data from an instrumented bridge abutment has
been used for the model verification. The reduction of the bridge abutment,the
vertical settlement and the horizontal displacement by pile and geogrid have
been analysed and compared.It is found that constructing the abutment on piles
has a better performance in reducing the vertical settlement of the bridge
abutment. However, lower lateral displacement can be obtained by using a
geogrid with a higher normal stiffness. It is also found that, while the vertical
settlement is not affected by the geogrid stiffness, the horizontal displacement of
the abutment decreases with increasing the stiffness.
Key words: Abutment, pile, geogrid, displacement, FEM.
1 INTRODUCTION
One of the geotechnical problems in highway construction is encountering with
soft soils in pavement sub-grade and foundation of bridge abutments [1]. The
soft soils can easily cause settlement of bridge and pavement resulting in uneven
surface on the roadway. To overcome this problem, a variety of approaches have
been proposed by the engineers worldwide, whereas the optimum solution is
subjective. For a long time, piles have been used for transferring the bridge
abutment loads to the competent soil in depth or taking that by the friction
between the piles' surface and the surrounding soil [2]. Another method for
controlling the settlement of abutment on soft soil is reinforcing the sub soil by
geosynthetics [3]. A number of studies have been carried out for investigating
each method, that some of them would be presented, which are relevant to our
study, in following:
Hara et al. [4] conducted two field tests on bridge abutment constructed on a
weak soil and investigated the pile behaviour by monitoring the responses, and
using them for verification of the numerical modelling by finite elements
method. According to their results Biot’s theory could well predict the pile
displacements; thus they suggested using this theory in modelling.
Lee and Wu [5] used geosynthetics and their combination with preloading for
reinforcing bridge abutments in 4 different projects and studied their behaviour
by monitoring the responses. They found that the lateral displacements and
settlement are significantly reduced by geogrid reinforcement and preloading,
such that the horizontal strains under a load level of 80kPa is about 0.2%.

3
Skinner and Rowe [6] studied a 6m long bridge abutment reinforced by
geosynthetic. They found that the increase of length and stiffness of underlying
layers is more significant than increasing the overall bearing capacity on the
stability of bridge.
Ellis and Springman [7] investigated the interaction of soil and a bridge
abutment constructed on clay soil and found its 2D plane strain model for
determination of load-displacement using non-linear method. The model was
also placed in centrifuge and resulted that the plain strain model can well predict
the load-displacement behaviour.
Wang et al. [8] investigated the behaviour of bridge abutments on soft soil using
finite elements modelling in ABAQUS. Assuming plane strain in finite element
modelling the behaviour of embankment and abutment was well predicted.
Cam-clay model was used for simulating the behaviour of clay soil. They found
that the cam-clay model can well predict the consolidation behaviour of
saturated clay in interaction of soil-structure.
Fahel et al. [9] investigated the behaviour of geogrid reinforced soil and its
interaction with bridge abutment in highway SC-101 in Brazil. Their results
showed that reinforcement of soil results in decrease of lateral displacement of
bridge abutment and is more effective than the traditional methods such as berm.
Zheng and Fox [10] investigated the performance of bridge abutments
reinforced by geogrid using discrete elements method, and found that, the results
obtained by discrete elements method for vertical and horizontal displacements
and the tensile stresses and the corresponding strains are consistent with those
measured in field. They also found that the soil compaction, the distance
between anchors, the loads on bridge have the highest effect on the lateral
displacements and settlement of bridge abutment. As can be seen, their
performance in the same conditions for reducing the displacement has not been
compared yet, where comparing of them is novelty of this research.
With the objective of comparing the performance of pile and geogrid in
reducing the vertical and lateral deformation of a bridge abutment settled on soft
soil, a two-dimensional finite element analysis is conducted using the Plaxis 2D
V8.5. For verification of the model, the data obtained from monitoring the
deformations in a real scale project have been applied. Next, numerical
modelling is carried out for the analysis and comparison of two cases of piled
bridge abutment (PA) and geogrid reinforced abutment (GRA).Furthermore, a
parametric investigation is performedon the effects of the properties of the
geogrid reinforcement, namely the length, depth of reinforcement and normal
stiffness on the displacement of abutments.
2 REAL-SCALE ABUTMENT MODELLING
2.1 Modelling the piled bridge abutment (PA)
Figure 1 shows a section of the abutment used in this study. From top to the
bottom, the soil types are: highly organic soil (Ap) with a thickness of 6.2m,

4
Alluvial clay 1 (Ac1) with a thickness of 5.2m, volcanic ash (Av) with a
thickness of 3.8m, Alluvial clay 2(Ac2) with a thickness of 6.1 m, and bedrock.
The abutment is designed with dimensions of 10m width, 10m length and 9m
height, which is supported by a group of 25 (5×5) piles. The piles are made of
steel with circular cross section with 800mm in diameter, 12mm in thickness
and 12m in length. Also in Figure 1, the cross section of the fill and the
abutment perpendicular to the bridge axis are illustrated (Figure 1-b). For
reducing the vertical and horizontal displacement of the ground due to the
filling, a layer of sand with a thickness of 3m have been constructed as pre-
loadingprior to theconstruction of the piles and abutment.
Figure 2 shows the process of constructing the fill, from a to h, as follow:
a) After constructing the sand drains, the sandmat was constructed up to the
level of 1.3m from the initial ground level, and then laid out for 150
days.
b) For pre-loading, the fill with a height of 1.7m was constructed with a rate
of 10cm/day on the sand mat and was laid out for 60 days. Therefore, the
total height of the sand mat and the fill for pre-loading from the initial
ground level is 3m.
c) A part of the pre-loading layer was removed to construct the abutment
and the piles. Then, the fill behind the abutment was constructed again,
up to a height of 3m.
d) The filling was continued to the height of 7.6m with a rate of 4cm/day,
and then left for 400 days
e) 3meters of the upper part of the fill was removed and the rest was left for
150 days.
f) The fill was constructed up to the height of 8.5m at a rate of 5cm per
day.
g) The deck load was applied on the abutment and was left for 200 days to
be consolidated.
In Figure 2, the solid line shows the thickness of the filled soil from the
original ground level, and the grey line shows the height of fill from the
ground level. Due to the settlement of the original ground during the
construction process, the height of the filled soil is higher than the height
from the original level of the ground.
Thefill soilswere simulated using the Mohr-Coulomb model. The soil density
was obtained from in situ density tests,γt1, and modified for the settlement
during construction and transferring the weight in 3-D space in 2-D. The

5
cohesion (c) and the internal friction of the soil(φ), have been obtained from
CD-tests results. The abutment material was assumed to be linear and
itsproperties, such as density, elastic modulus and Poisson's ratio were assumed
as those for reinforced concrete.In 2-D analysis, a row of piles have been
simplified as a wall of plane strain, as recommended by Randolph [2003]. The
arrangement of the piles beneath the abutment can be seen in Figure 3. The
plane strain wall has been assumed to be linear in the analysis. The behavior of
clay and organic soils were simulated by modified Cam-clay model. Table 1
shows all of the materials properties and their configurationused in the analysis.
For the sand drains, instead of their circular cross section, equivalent rectangular
section, perpendicular to the bridge axis, has been used. Thus, the flow rate of
the two sections should be equal, and Equation (1) must be satisfied.
1 2V VT T (1)
Where, Tv is Time factor (in consolidation). The behavior of sand drains
materials was simulated using Mohr-Coloumb model.
The loads applied on the abutment trough bridge deck were calculated according
to local loading code, for which the dead load, live load, and braking load were
considered. Figure 4 shows the geometry of the abutment as well asthe dead,
live and braking load applied per unit length of the abutment.
2.1.1 Analysis of the model
15-noded triangular elements with 12 Guassian points have been used for
modelling. Plate elements have been used for piles. For considering time-
dependentdissipation of excess pore pressure, the analysis in all phases
isperformedusing the consolidation analysis. Standard boundary conditions in
Plaxishave been considered in modelling, in which the left and right boundaries
havebeen constrained horizontally and the boundary at the bottom of the model
has been constrained in both vertical and horizontal directions. The left and right
boundaries are far enough to minimize the effect of the abutment displacements.
After defining the geometry of the model and assigning the materials properties,
the meshing was designed, for which finer meshes were considered for the
spaces between the piles and sand drains. Figure 5 shows the modeltogether
withthe FE mesh. For the boundary at the bottom constrained flow and
consolidation were considered to prevent the water flow and allow for the
establishment of the excess pore water pressure. For the left and right
boundaries constrained consolidation was considered as the conditions of pore

6
water pressure during the consolidation. Computation of the constructed
abutment on pile has been done in 9 consolidation analysis phases, and the
whole process of construction and consolidation has lasted 1380 days. The
analysis was conducted to determine the horizontal and vertical displacement of
the model.
2.2 Modelling the Geogrid reinforced abutment (GRA)
The abutment constructed on the piles, as described in previous sections, were
analysed again with replacing the piles and the embankment with geogrid
reinforced soil beneath and behind the abutment (Figure 6). The geometry of the
GRA is the same as that of the PA, as described in the previous section. The
process of constructing the abutment is also the same as that of the PA, except
that during filling the embankment soil, the geogrid layers are placed in 40cm
intervals, and 7 layers of geogrid have been used for reinforcing the soil beneath
the abutment.
A soil with higher quality was used between the geogrid, for which, the
properties are presented in Table 2.The same behaviour and parameters, in
resemblance to the case of PA, were utilized for the case of GRA. In numerical
analysis, the geogrid element has been assumed to be elastic. The distance
between the geogrid layers is 0.4 m and their base normal stiffness was assumed
to be 500kN/m and the depth of reinforced soil beneath the abutment is 3.2m. In
order to investigate the effects of different properties of geogrid reinforcement
on the vertical and horizontal displacement of abutment, different lengths,
normal stiffness values and depths of reinforced soil were investigated, as
shown in Table 3.
15 noded triangular elements with 12 Guassian points are used in modelling the
GRA. Geogrid element are employed for modelling the geogrids. The
computation of geogrid reinforced abutment (GRA) was conducted in 37 phases
of consolidation analysis. The total time of construction process was 1380 days.
3 RESULTS OF ANALYSIS
3.1 Piled bridge abutment (PA)
Figure 7-a shows the history of the maximum settlement of ground from its
initial level. As can be seen, the measured and calculated values are well
consistent. Figure 7-b shows the maximum horizontal displacement of the pile
head on the inner side of bridge's abutment. As can be seen, there is a slight
discrepancy between the measured and calculated values, which is more
noticeable after removing the 3 meter of the upper part of the abutment. As can
be seen, the maximum horizontal displacement under the abutment, has been
calculated to be 12cm, while the measured value is 17cm. This discrepancy is
attributed to the modelling assumptions and that the 3-dimensional interaction

7
mechanisms between the soil and piles has not been well simulated by the 2-
dimensional modelling in this analysis. In general, before removing the upper
part, the horizontal displacement of the piles head, calculated by the model, is
reliable and is not accurate after that.
Figure 8 shows the vertical settlement of the points E, G, H, I and J on the foot
of abutment as shown in Figure 5. As can be seen, point G has the highest
vertical settlement before construction of piles. However, after construction of
the piles, the settlement of the points has been stopped, indicating that the piles
under the abutment prevented the settlement of the abutment.
3.2 Geogrid reinforced abutment (GRA)
In order to investigate the effect of geogrid length on the vertical and horizontal
displacements of abutment, different lengths of 11, 17, 21 and 25m, all with the
normal stiffness of 500kN/m and depth of reinforcement of 3.2m were used in
the modelling. Figure 9 and 10, show, respectively, the history of the vertical
and horizontal displacement of the abutment for different lengths of geogrid. As
can be seen, the maximum vertical settlement of 60cm is obtained after
construction of abutment by using 11m long geogrids, which could be due to the
occurrence of punching under the abutment caused by insufficient length of
geogrid. However, the vertical settlement of the abutment is almost identical for
the lengths of 17, 21 and 25m and much lower than that for 11m long geogrids.
As can also be seen in Figure 9, the horizontal displacement for the 17m long
geogrids is approximately 5cm higher than those for 21 and 25m long geogrids.
Therefore, the geogrid length of 21m was selected for investigating the other
properties of geogrid.
As mentioned earlier, the effect of the depth of reinforced soil on the vertical
settlement and horizontal displacement of abutment was investigated by
modelling the GRA using 21m geogrids with 500kN/m normal stiffness. Figure
11 and 12show, respectively, the history of the maximum vertical settlement and
the maximum horizontal displacement of the abutment for different depths of
reinforcement. As can be see in Figures11 and 12,the vertical settlement and
lateral displacement of abutment decreases with increasing the depth of
reinforcement. By increasing the depth of reinforcement from 3.2m to 8m (20
layers of geogrid), the vertical settlement decreases from 104cm to 60cm and the
horizontal displacement decreases from 14 to 6cm.
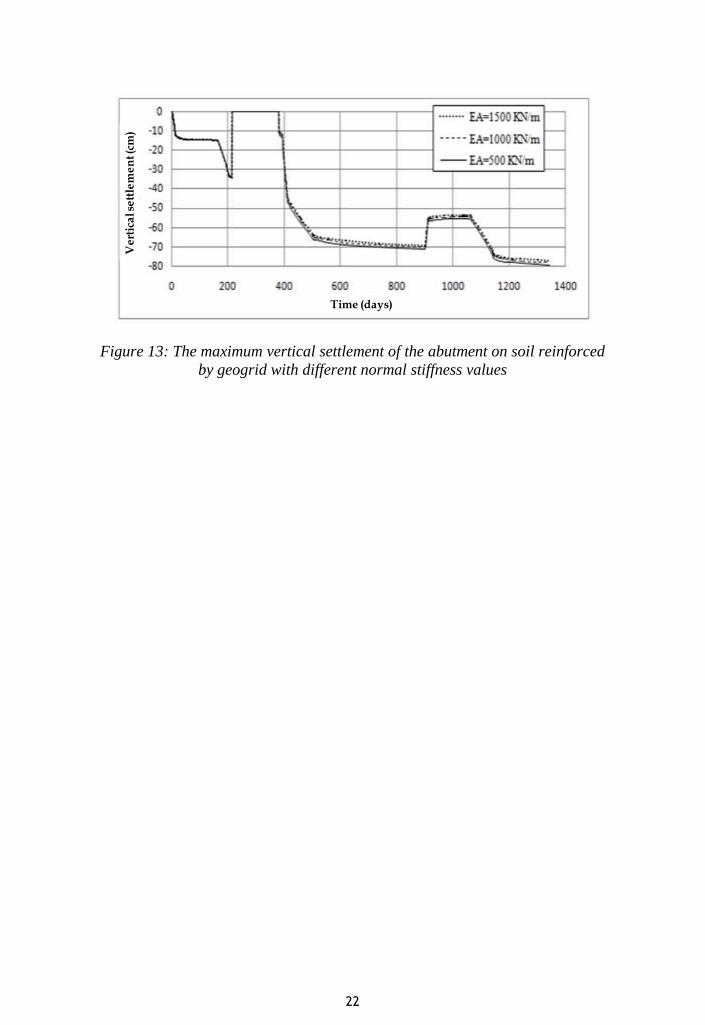
In order to investigate the effect of the normal stiffness of geogrids on the
displacements of abutment, geogrids with different normal stiffness of 500,
1000 and 1500KN/m were used. For all cases, the depth of reinforced soil was
6.2m and the length of the geogrids was 21m. Figure 13 shows the maximum

8
settlement of the abutment for geogrids with different normal stiffness values.As
can be seen, the vertical settlement of abutment is not affected by the normal
stiffness of geogrid. Figure 14 shows the maximum horizontal displacement of
abutment head for different normal stiffness values of geogrid. As can be seen,
the horizontal displacement of abutment decreases with increasing the normal
stiffness of geogrid. The maximum horizontal displacement of 11cm for the
geogrid with normal stiffness of 500kN/m has been reduced to approximately
5cm for the geogrid with normal stiffness of 1500kN/m.
3.3 Comparison of PA and GRA
Figure 15 shows the vertical settlement of the abutment on piles (PA) and the
abutment on geogrid reinforced soil (GRA). As can be seen, in equal
conditions, the maximum vertical settlement of the PA is less than that of the
GRA. The figure also shows that, after constructing the pile, the vertical
settlement of the PA does not increase anymore.
Figure 16 shows the maximum horizontal displacement of the PA and GRA
with different stiffness values of geogrid. As can be seen, increasing the
stiffness of the geogrid decreases the horizontal displacement. The horizontal
displacement of the abutment decreases by 82%, as the stiffness increases from
500KN/m to 1500KN/m.In this figure, it can also be seen that, the horizontal
displacement of the abutment on soil reinforced by geogrids with normal
stiffness of 500KN/m is higher than that of the PA. However, as the stiffness
increases to 1500KN/m, the maximum horizontal displacement reduces to a
value less than that of the PA.
4 CONCLUSIONS
In this research the performance of constructing bridge abutment on piles and
geogrid reinforced soils in reducing the vertical and horizontal settlement of the
abutments has been investigated. The following are brief conclusions.
Verification of the model showed that it can well predict the vertical
settlement, occurring throughout the construction of the embankment,
piles and abutment, however, the lateral displacement of the pile, after
removing the upper part of the fill, cannot accurately predict the vertical
displacement.
Constructing the abutment on piles and geogrid reinforced soil both can
reduce the horizontal and vertical displacements.
The vertical settlement of the GRA is higher than that of PA, and is
independent from the stiffness of the geogrid. However, the horizontal
displacement of the GRA can be less than that of the abutment on pile,
when stiffer geogrid is used for reinforcement.
The horizontal displacement and the vertical settlement of the abutment
decreases with increase inthe length of geogrid layers.
9
The horizontal and vertical displacement of the abutment decreases with
increase in the reinforcementdepth.
As the vertical displacement of the bridge abutment is more important
than the horizontal displacement for highway ride quality, it is suggested
that piles to be used for construction of the abutments on soft soils.
REFERENCES
1- Randolph, M. F. “Science and empiricism in pile foundation design”,
Geotechnique 53(10) , pp. 847-875 (2003).
2- Zhang, W., Qin, B., Wang, B. and Ye, J. “Reduction of earth pressure and
displacement of abutment with reinforcement filling”, Geotechnical Eng. for
disaster mitigation and rehabilitation 20, pp. 815-820 (2008).
3- Detert, O. and Alexiew, D. “Physical and numerical analyses of Geogrid-
Reinforced soil system for bridge abutments”, From Research to Design in
Europe. Practice Conf. Bratislava, Slovak Republic (2010).
4- Hara , T. Yu , Y. and Ugai , K. “Behavior of piled bridge abutments on soft
ground : A design method proposal based on 2D elasto-plastic-consolidation
coupled FEM”, Comput. and Geotech. 31, pp. 339–355(2004).
5- Lee, K. Z. Z. and Wu, J. T. H. “A synthesis of case histories on GRS bridge-
supporting structures with flexible facing”, J. Int. Geotex. and Geomembr, 20.
pp.181–204 (2004).
6- Skinner, G. D. Rowe, R. K. “Design and behavior of a geosynthetic reinforced
retaining wall and bridge abutment on a yielding foundation”, Geotex. and
Geomembr. 23, pp. 234-260 (2005).
7- Ellis, E.A. and Springman , S.M. “Modelling of soil-structure interaction for
piles bridge abutment in plane strain FEM analyses”, Comput.s and Geotech.
28 ,pp.79–98 (2001).
8- Wang, H.T. Chen, Z.P. Xiao, L.J. “Plane Strain Finite Element Analysis of a
Piled bridge Abutment on Soft Ground”, 1st Conf. Comput. Meth. in eng. and
science. Tsinghua university press and springer pp. 600-607 (2006).
9- Fahel, S. Palmeria, E.M. Ortigao, J. A. R “Behaviour of geogrid reinforced
abutments on soft soil in the BR 101-SC highway, Brazil”, Conf. on advances
in transport. and geo-environ. Sys. using geosynthetics, ASCE, pp. 257-270
(2000).
10- Zheng, Y. Fox, P. “Numerical Investigation of Geosynthetic-Reinforced Soil
bridge Abutments Under static loading.”, J. of geotec. and geoen. Eng. 40,
pp.1-13.

10
FIGURES:
a) Longitudinal section
b) Transverse section
Figure 1: Cross section of abutment: a) Longitudinal section b) Transverse
section

11
Figure 2: Process of constructing the filling
He
igh
t (m
)
Time (days)
Fill thickness
Base elevation
a
b
c
d
h
f
eg

12
Figure 3: Arrangement of piles beneath the abutment

13
Figure 4: the geometry and applied loads on abutment
0.5m 1
Dead and live load
1.86 ton/m
1.5
Brake force
9m
10m

14
Figure 5: schematic presentation of model for PA

15
Figure 6:The geometry of GRA

16
a) The maximum vertical settlement
b) The maximum lateral displacement
Figure 7: the comparison of measured and calculated values of a) the maximum
vertical settlement and b) the maximum lateral displacement of pile head
Time (days)
Calculated
Measured V
ert
ica
l se
ttle
me
nt (c
m)
Time (days)La
tera
l d
isp
lace
me
nt (c
m)
Deck load application
Measured
Calculated

17
Figure 8: The history of vertical settlement of abutment at different points
Ve
rtic
al se
ttle
me
nt (c
m)
Time (days)

18
Figure 9:The vertical settlement of abutment for different lengths of geogrid
Ve
rtic
al s
ett
lem
en
t (cm
)
Time (days)
Abutment construction

19
Figure 10:The horizontal displacement of abutment for different lengths of
geogrid
Time (days)
La
tera
l Dis
pla
cem
en
t (cm
)

20
Figure 11: The maximum vertical settlement of abutment for different depths of
reinforcement
Ve
rtic
al s
ett
lem
en
t (cm
)
Time (days)
Abutment construction

21
Figure 12: The maximum horizontal settlement of abutment for different depths
of reinforcement
La
tera
l Dis
pla
cem
en
t (cm
)
Time (days)
22
Figure 13: The maximum vertical settlement of the abutment on soil reinforced
by geogrid with different normal stiffness values
Ve
rtic
al s
ett
lem
en
t (cm
)
Time (days)

23
Figure 14: The maximum horizontal displacement of the abutment on soil
reinforced by geogrid with different normal stiffness values
La
tera
l Dis
pla
cem
en
t (cm
)
Time (days)

24
Figure 15: The maximum settlement of the abutment in PA and GRA
Ve
rtic
al s
ett
lem
en
t (cm
)
Time (days)
Abutment on piles
Construction of abutment
Applying deck load
GRA
PA

25
Figure 16: The maximum lateral displacement of the PA and GRA
La
tera
l D
isp
lace
me
nt (c
m)
Time (days)
Applying deck load
PA

26
TABLES:
Table 1:Embankment and ground properties
k
(m/s) K0
γ´
(kN/m3)
pc
(kN/m2)
e0 К λ Material
Cam-Clay Materials ( Thickness of embankment is 7.6m )
1E -10 0.8 3 52 3.44 0.169 0.846 Ap
1E -10 0.5 6 135 1.51 0.052 0.260 Ac1
1E -10 0.5 6 137 1.75 0.078 0.391 Ac2 k
(m/s) γt
(kN/m3)
c
(kN/m2)
φ
(°) 𝜗
E
(kN/m2)
Material
Mohr-Coulomb Materials
1E -04 18 0 30 0.30 5000 Sand mat
1.7E -06 16 50 30 0.30 15000 Av
k
(m/s) γt
(kN/m3)
𝜗 E
(kN/m2)
Material
Elastic Materials
1E -20 24.5 0.17 2.5E+07 abutment
1E -05 20 0.30 300000 Bed rock c
(kN/m2)
φ
(°) 𝜗
E
(kN/m2)
γt
(kN/m3)
H(m)
Embankment
55 16.5 0.30 5000 23 0 - 4.0
55 16.5 0.30 5000 21.5 4.0 – 6.1
55 16.5 0.30 5000 19.5 6.1 – 7.6

27
Table 2: Properties of the soil used between the geogrid layers
materials Φ(˚) C(kN/m2) υ E(kN/m
2) γunsat(kN/m
3) γunsat(kN/m
3)
Soil between
the geogrids 35 1 0.3 3000 19 21

28
Table 3:Evaluated properties of GRA
Property Values
Length (m) 11 17 21 25
Normal stiffness (Kn/m) 500 1000 1500 -
Depth of reinforcement (m) 3.2 4.8 6.2 8
بیوگرافی علمی:
Hasan Taherkhani finished his Ph.D in the field of Pavement
Engineering in University of Nottingham, in 2006. After finishing
his Ph.D studies he has been working at the University of Zanjan.
From that time he works with that department. His main activities
include teaching undergraduate and graduate courses, advising
master and Ph.d students and administration works. His interest is
working on pavement materials, pavement analysis and design. Until
now, he has published more than 45 papers in national and
international journals, and presented more than 100 papers in
national and international conferences. He has also authored two
books in the field of pavement analysis.
Milad Tajdini is 4th year Ph.D. student in Civil Engineering in
Tabriz university. He is a member of national Elite Students
Foundation that has accepted only 7000 members among merely
3,000,000 Iranian students. He was ranked 65th in the National
University Entrance Exam in his country among 350,000
participants and He received my Bachelor’s degree from Sharif
University of Technology, which is the highest ranked in his
country. Right now he is studying in Tabriz University in
Geotechnics where ranked first among all his peers. His publications
during his Ph.D. educations includes two books focused on soil
dynamics, one of which approaches the subject from an Earthquake
Engineering perspective and the other from a Geotechnical one.
These books are the first of their kind in my country and are being
used as references for M.Sc. and Ph.D. students for their studies. His
research interests are mainly in the area of Soil improvement and
recently using nanotechnology in this path.
Abdolreza Rezaee Arjroodi- is Associated researcher in Road,
housing and urban development research center in part of
transportation Engineering. He was manager of economic of
transportation of BHRC for years. He is M.Sc of road engineering in
Islamic Azad University of Central Tehran branch.

29
Hosein Zartaj is a 4th year Ph.D. student in Civil Engineering in
Tabriz university. His researches focused on soil improvement and
interaction between soil and foundations. He is technical expert of
KNAUF company in middle east and he trains to some experts from
Turkey, Iran and Afghanistan.