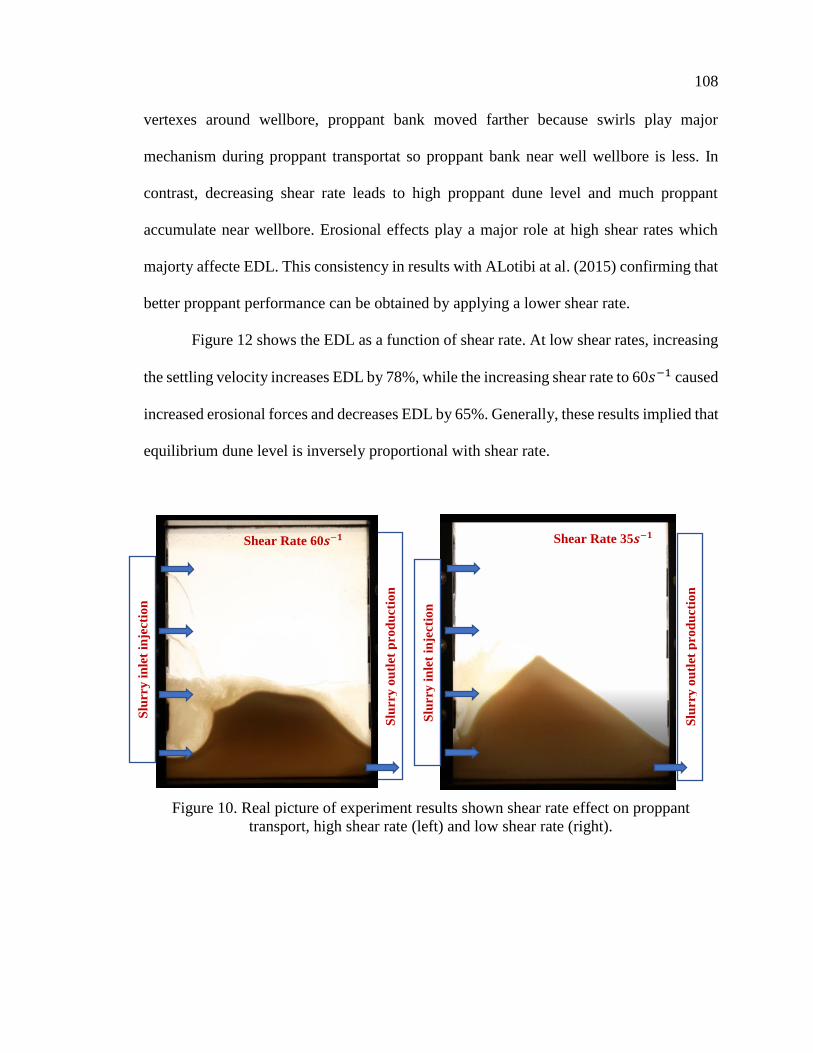
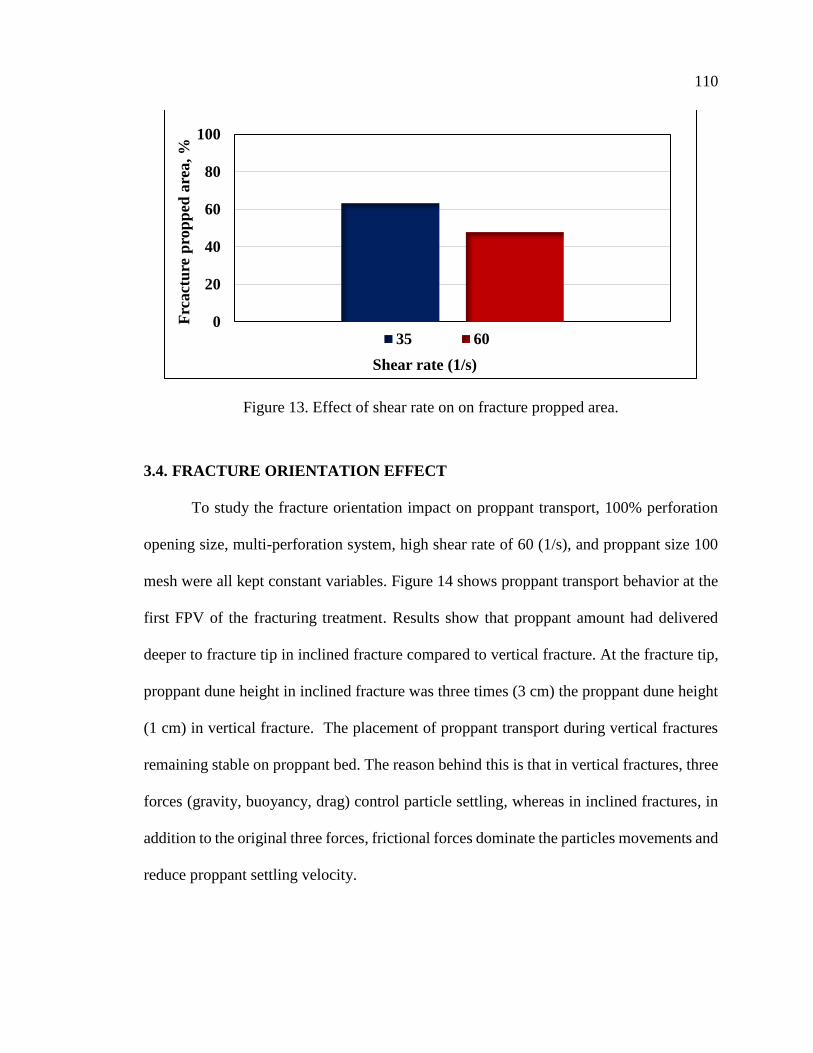
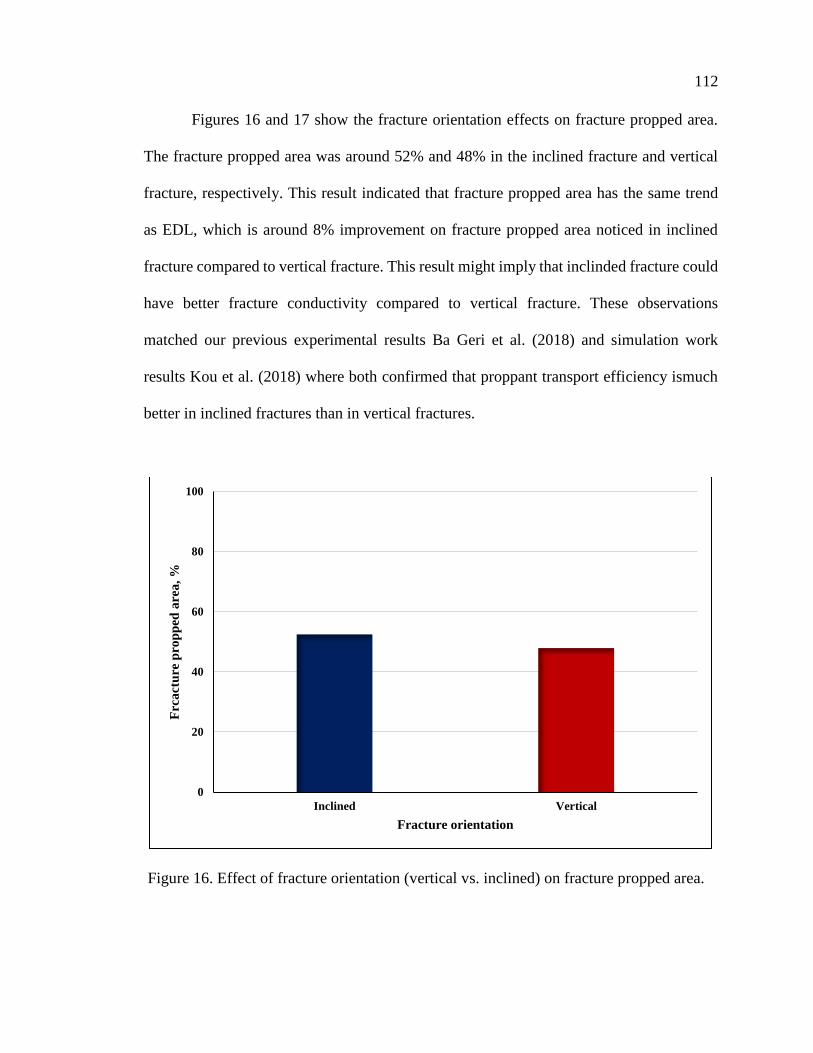
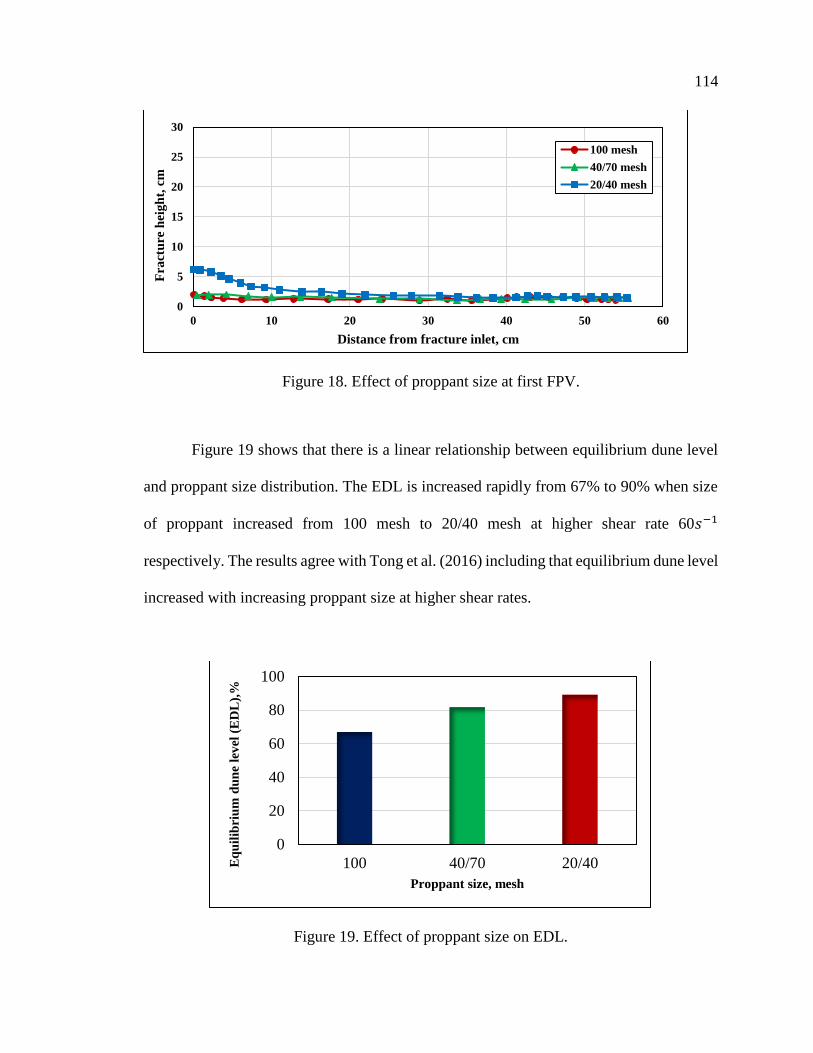
investigating the performance of high viscosity friction
TRANSCRIPT

Scholars Mine Scholars Mine
Doctoral Dissertations Student Theses and Dissertations
Fall 2019
Investigating the performance of high viscosity friction reducers Investigating the performance of high viscosity friction reducers
used for proppant transport during hydraulic fracturing used for proppant transport during hydraulic fracturing
Mohammed Salem Ba Geri
Follow this and additional works at httpsscholarsminemstedudoctoral_dissertations
Part of the Petroleum Engineering Commons
Department Geosciences and Geological and Petroleum Engineering Department Geosciences and Geological and Petroleum Engineering
Recommended Citation Recommended Citation Ba Geri Mohammed Salem Investigating the performance of high viscosity friction reducers used for proppant transport during hydraulic fracturing (2019) Doctoral Dissertations 2827 httpsscholarsminemstedudoctoral_dissertations2827
This thesis is brought to you by Scholars Mine a service of the Missouri SampT Library and Learning Resources This work is protected by U S Copyright Law Unauthorized use including reproduction for redistribution requires the permission of the copyright holder For more information please contact scholarsminemstedu
INVESTIGATING THE PERFORMANCE OF HIGH VISCOSITY FRICTION
REDUCERS USED FOR PROPPANT TRANSPORT DURING HYDRAULIC
FRACTURING
by
MOHAMMED SALEM BA GERI
A DISSERTATION
Presented to the Faculty of the Graduate School of the
MISSOURI UNIVERSITY OF SCIENCE AND TECHNOLOGY
In Partial Fulfillment of the Requirements for the Degree
DOCTOR OF PHILOSOPHY
in
PETROLEUM ENGINEERING
2019
Approved by
Ralph Flori Advisor
Mingzhen Wei
David Rogers
Kelly Liu
Vamegh Rasouli
copy 2019
Mohammed Salem Ba Geri
All Rights Reserved
iii
PUBLICATION DISSERTATION OPTION
This dissertation consists of the following six articles formatted in the style used
by the Missouri University of Science and Technology
Paper I Pages 5-34 have been published in SPE OnePetro
Paper II Pages 35-64 have been published in SPE OnePetro
Paper III Pages 65-92 have been published in SPE OnePetro
Paper IV Pages 93-123 have been published in SPE OnePetro
Paper V Pages 124-150 have been published in SPE OnePetro
Paper VI Pages 151-171 have been published in SPE OnePetro
iv
ABSTRACT
Over the last few recent years high viscosity friction reducers (HVFRs) have been
successfully used in the oil and gas industry across all premier shale plays in North America
including Permian Bakken and Eagle Ford However selecting the most suitable fracture
fluid system plays an essential role in proppant transport and minimizing or eliminating
formation damage
This study investigates the influence of the use of produced water on the rheological
behavior of HVFRs compared to a traditional linear guar gel Experimental rheological
characterization was studied to investigate the viscoelastic property of HVFRs on proppant
transport In addition the successful implication of utilizing HVFRs in the Wolfcamp
formation in the Permian Basin was discussed This study also provides a full comparative
study of viscosity and elastic modulus between HVFRs and among fracturing fluids such
as xanthan polyacrylamide-based emulsion polymer and guar
The research findings were analyzed to reach conclusions on how HVFRs can be
an alternative fracture fluid system within many unconventional reservoirs Compared to
the traditional hydraulic fracture fluid system the research shows the many potential
advantages that HVFR fluids offer including superior proppant transport capability almost
100 retained conductivity around 30 cost reduction and logistics such as minimizing
chemical usage by 50 and the ability to stoner operation equipment on location Finally
this comprehensive investigation addresses up-to-date of using HVFRs challenges and
emphasizes necessities for using HVFRs in high TDS fluids
v
ACKNOWLEDGMENTS
First and foremost I would like to thank Allah for giving me the strength and
opportunity to undertake this accomplished satisfactorily
I would like to express my sincere gratitude to my advisor Dr Ralph Flori for his
guidance patience encouragement and support during my PhD study I would also like
to thank Dr David Rogers Dr Mingzhen Wei Dr Kelly Liu DrSteven Hilgedick and Dr
Vamegh Rasouli for their great effort assistant and serving on my PhD committee
Equally I would like to express my appreciation to the police department at
Missouri SampT for their unlimited support and creative environment Million thanks go to
Chief Doug Roberts Assistant Chief Oscar Kemp Sergeant Bryan Fox and all the
Sergeants officers guards and CSOs team
Many thanks to my sponsor Al sheikh Engrsquor Abdullah Ahmed Bugshan Chief
Executive Officer of Hadramout Establishment for Human Development for sponsoring
my PhD I would also like to acknowledge the BJ Services US Silica and CoilChem LLC
that provided all the necessary materials for this research My further appreciation goes to
Jerry Noles Sangjoon Kim and CoilChem team for there unaltimate assistant during this
acadimec journey
The deepest gratefulness goes to all my friends for encouraging and propelling me
to endeavor to achieve my goals
Last but not least my cordial gratitude my precious and my love goes to my
parents my grandmother my beloved sisters brothers nephews nieces brotherrsquos in-law
sistersrsquo in-law and my sweet heart my wife thanks all for your continued support
vi
TABLE OF CONTENTS
Page
PUBLICATION DISSERTATION OPTION iii
ABSTRACT iv
ACKNOWLEDGMENTS v
LIST OF ILLUSTRATIONS xv
LIST OF TABLES xx
NOMENCLATURE xxii
SECTION
1 INTRODUCTION 1
2 RESEARCH OBJECTIVES 3
PAPER
I A CRITICAL REVIEW OF HIGH-VISCOSITY FRICTION REDUCERS
APPLICATIONS AS AN ALTERNATIVE HUDRAULIC FRACTURING
FLUIDS SYSTEM 5
ABSTRACT 5
1 INTRODUCTION 6
2 DESCRIPTION OF FRICTION REDUCERS AND HIGH-VISCOUS
FRICTION REDUCERS 9
3 LABORATORY AND FIELD STUDIES USING HVFR 13
31 DATA ANALYSIS OF USING HVFRS AT FIELD AND LAB
CONDITIONS 13
32 FRICTION REDUCER AS ADDITIVES VS AS A HVFR FRACTURE
FLUID 14
33 SCREENING CRITERIA GUIDELINES FOR HVFRS 18
vii
4 CONDUCTIVITY PROFILE 19
5 BREAKABILITY PROFILE 20
6 PRODUCED WATER WITH HVFRS 23
7 ECONOMIC ANALYSIS 26
8 CONCLUSIONS 29
REFERENCES 30
II INVESTIGATE THE RHEOLOGICAL BEHAVIOR OF HIGH
VISCOSITY FRICTION REDUCER FRACTURE FLUID AND ITS IMPACT
ON PROPPANT STATIC SETTLING VELOCITY 35
ABSTRACT 35
1 INTRODUCTION 37
2 PROPPANT STATIC SETTLING VELOCITY IN HYDRAULIC
FRACTURING 39
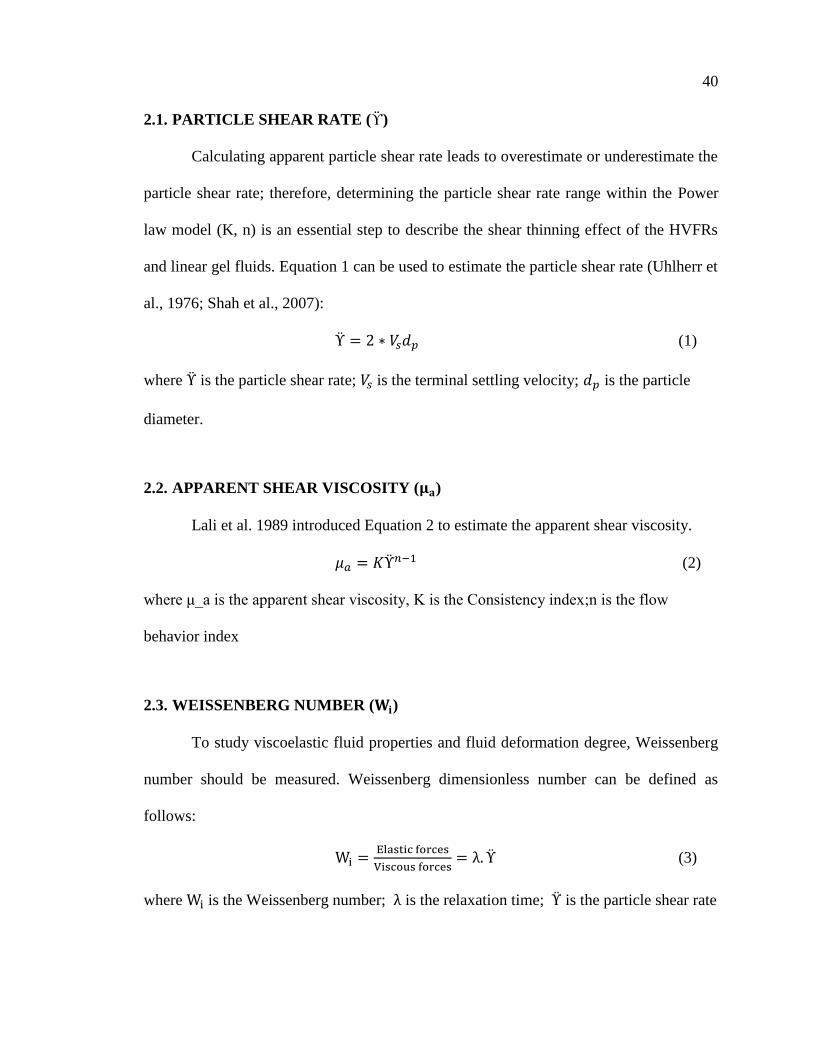
21 PARTICLE SHEAR RATE (ϔ) 40
22 APPARENT SHEAR VISCOSITY (μa) 40
23 WEISSENBERG NUMBER (Wi) 40
24 ELASTICITY TO VISCOSITY RATIO (λeυ) 41
25 FORCES INFLUENCED PARTICLES SETTLING VELOCITY 41
3 EXPERIMENT DESCRIPTION 42
31 MATERIALS 42
311 Hydraulic Fracturing Fluids 42
312 Preparing Fracturing Fluids 43
313 Proppant Sizes 43
314 Rheometer 43
32 SETTLING VELOCITY IN UNCONFINED FRACTURE SETUP 43
viii
33 RHEOLOGICAL CHARACTERIZATION OF THE HVFRS 44
331 Viscosity Profile Measurement 44
332 Elasticity Profile Measurement 44
333 Thermal Stability Measurement 44
334 Static Settling Velocity Measurement 44
4 RESULTS AND DISCUSSION 45
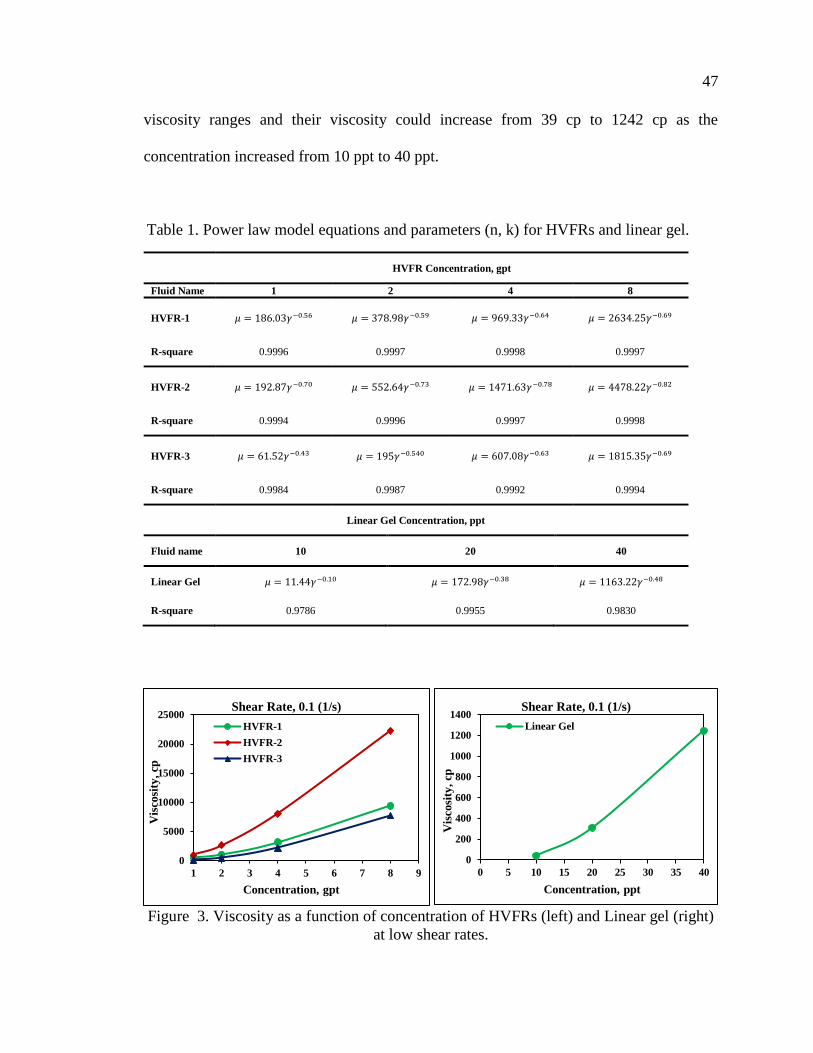
41 VISCOSITY MEASUREMENT RESULTS 45
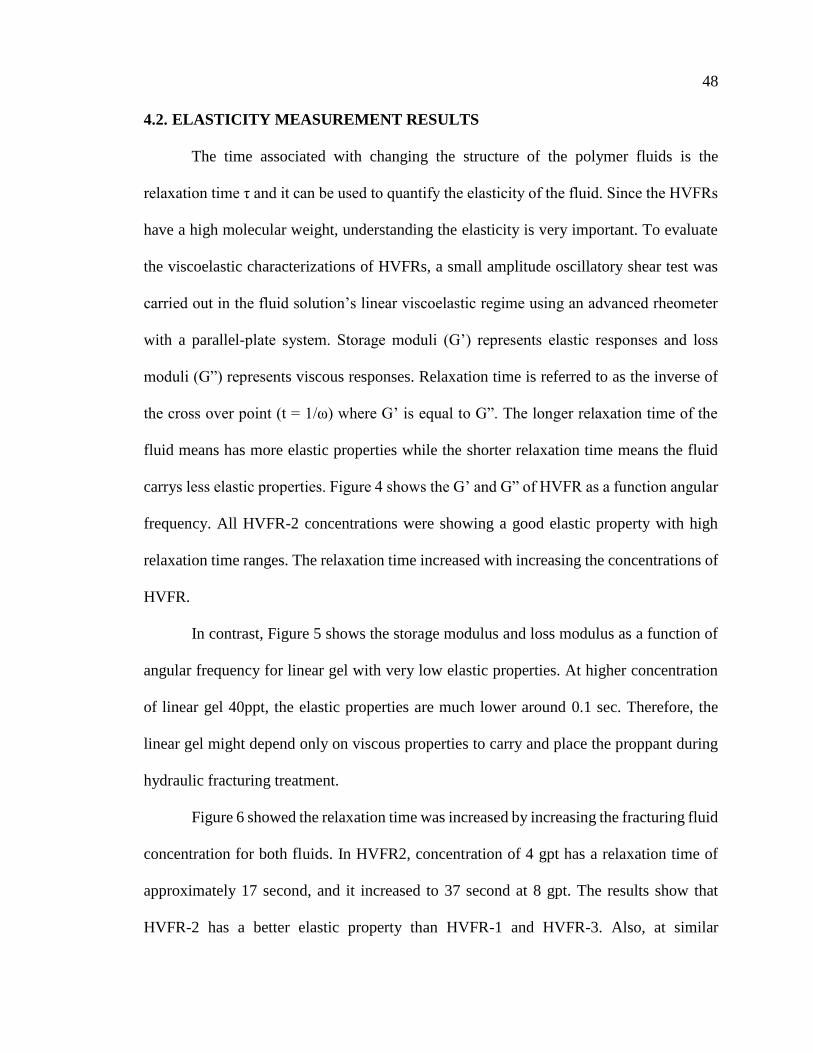
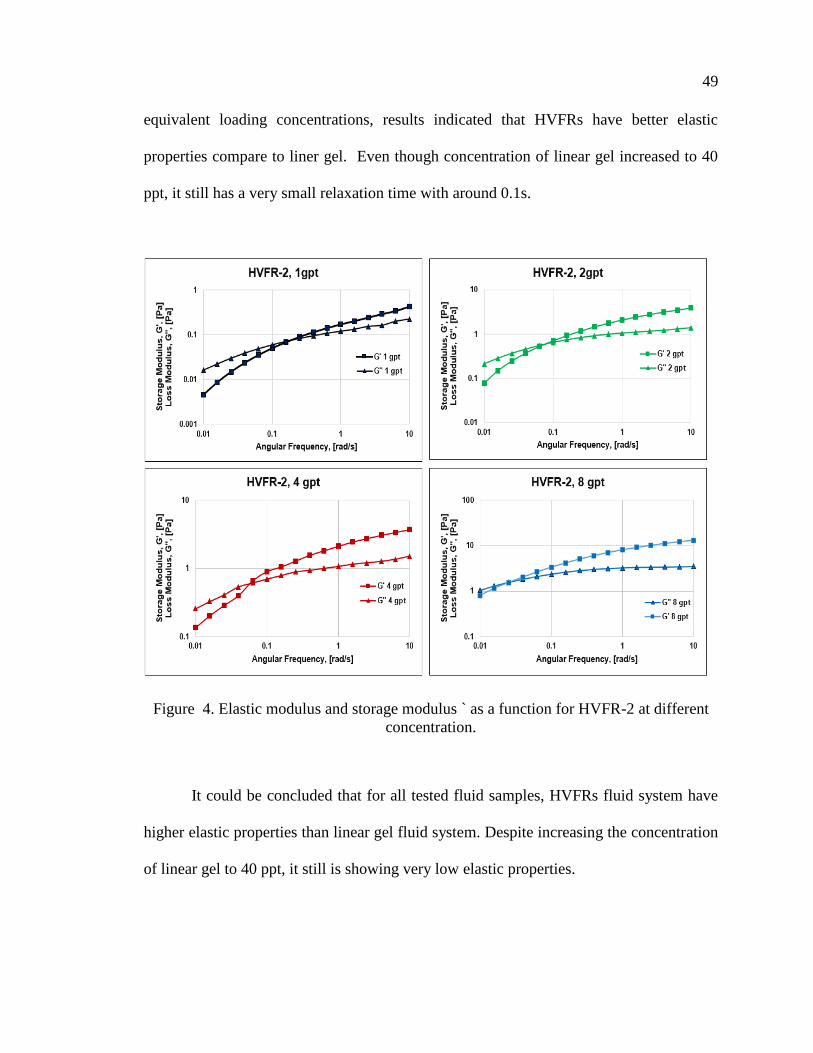
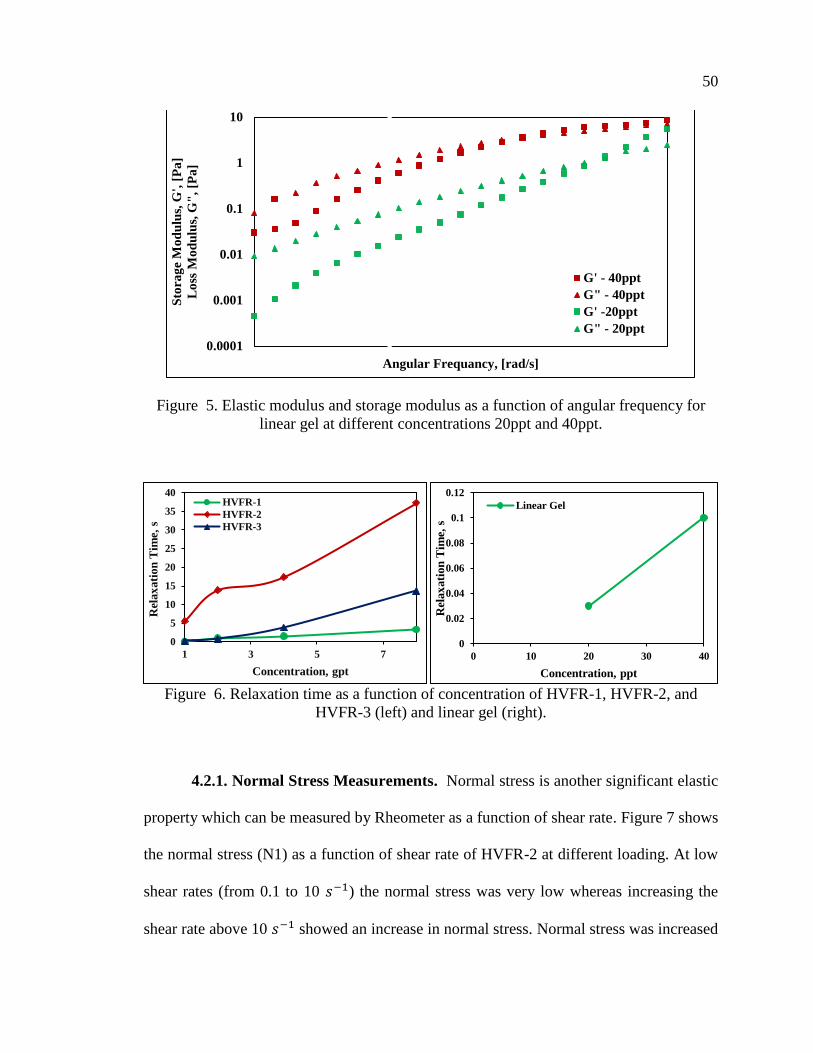
42 ELASTICITY MEASUREMENT RESULTS 48
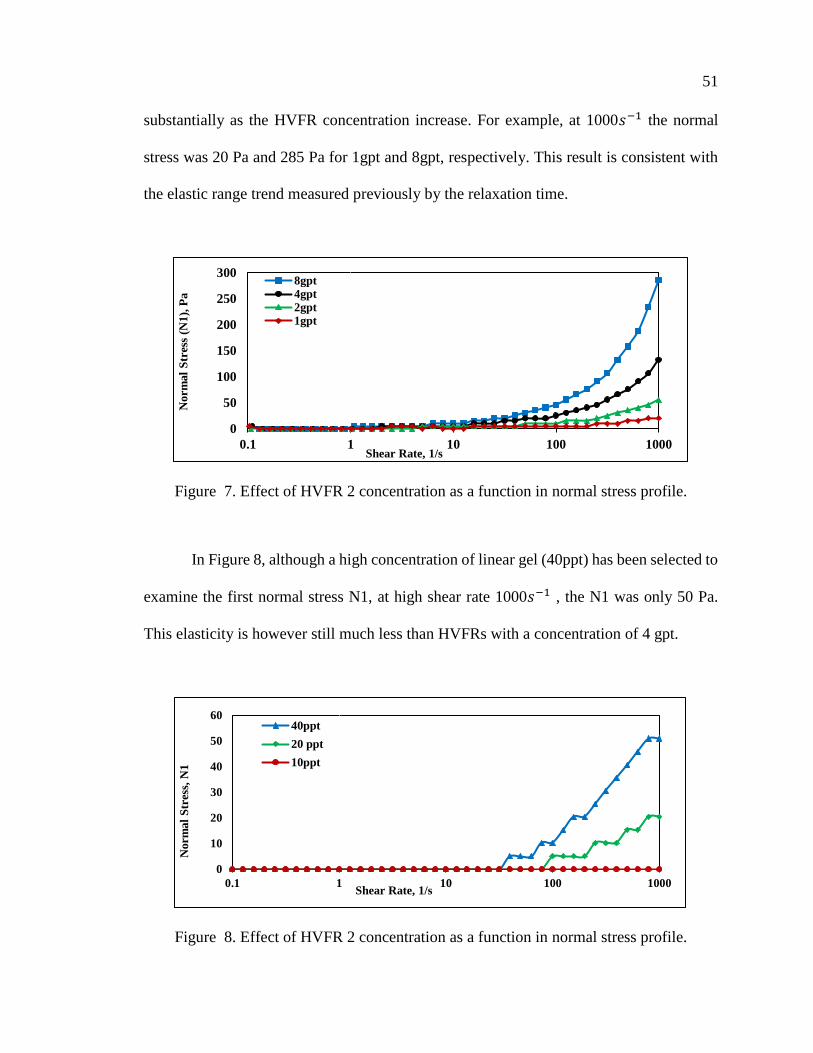
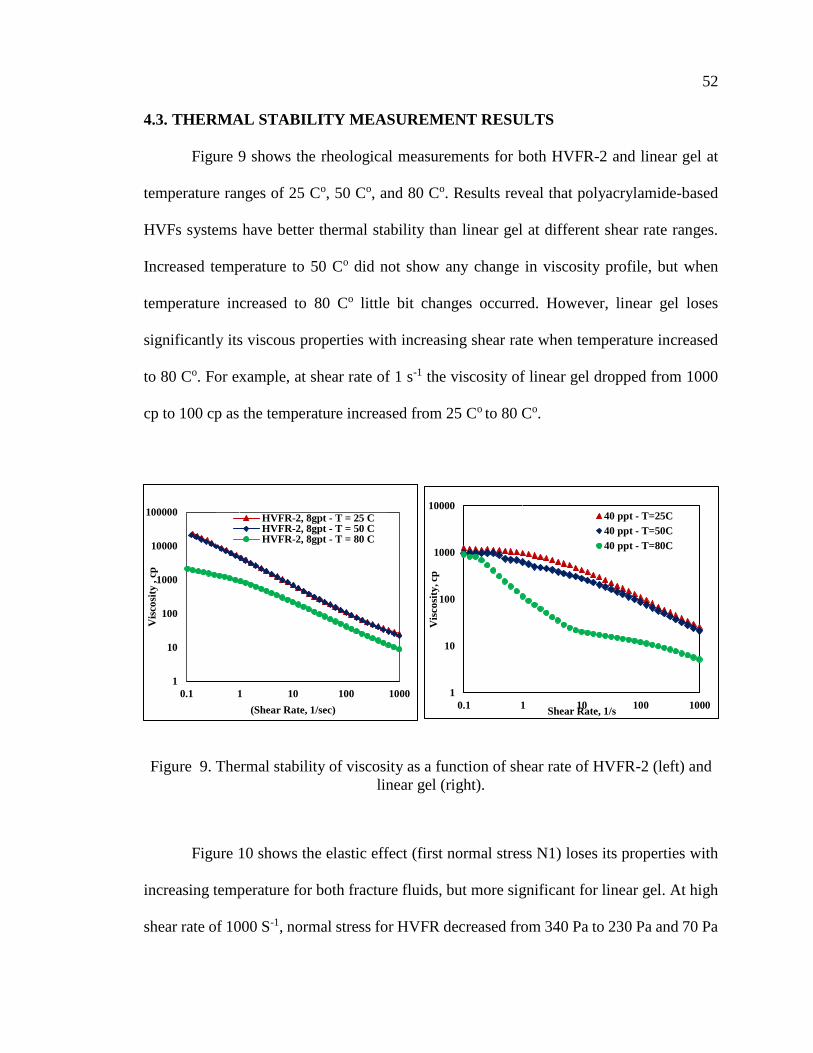
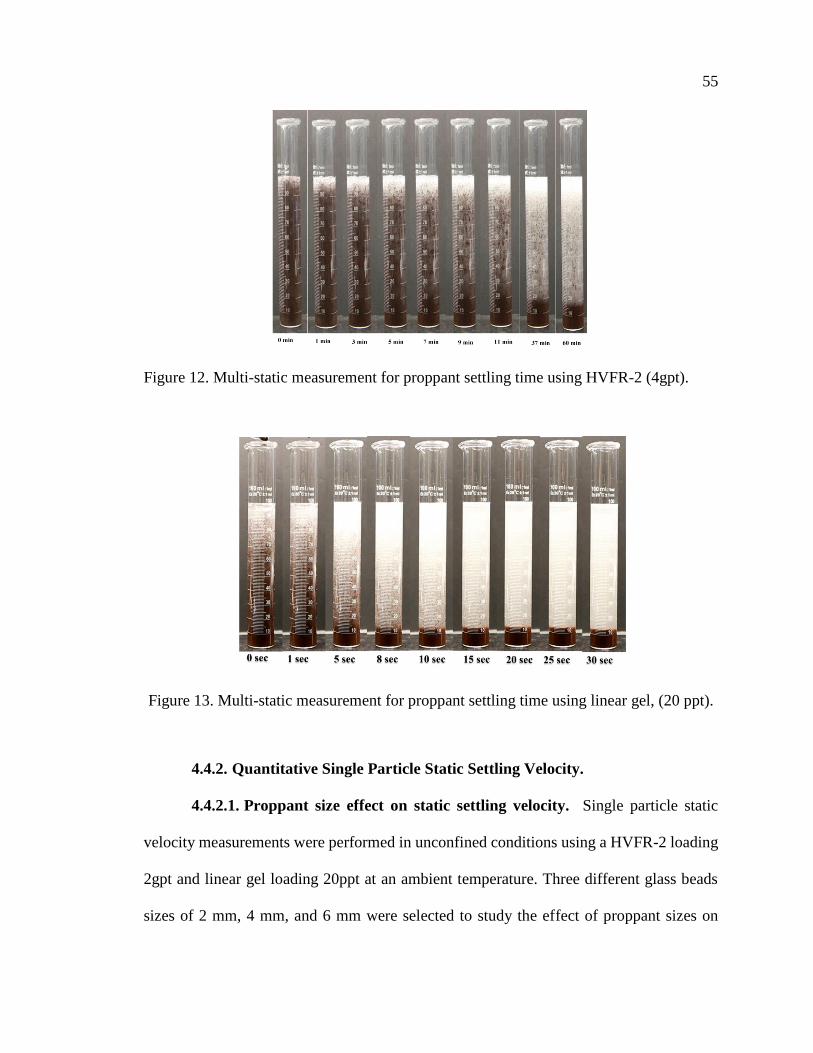
421 Normal Stress Measurements 50
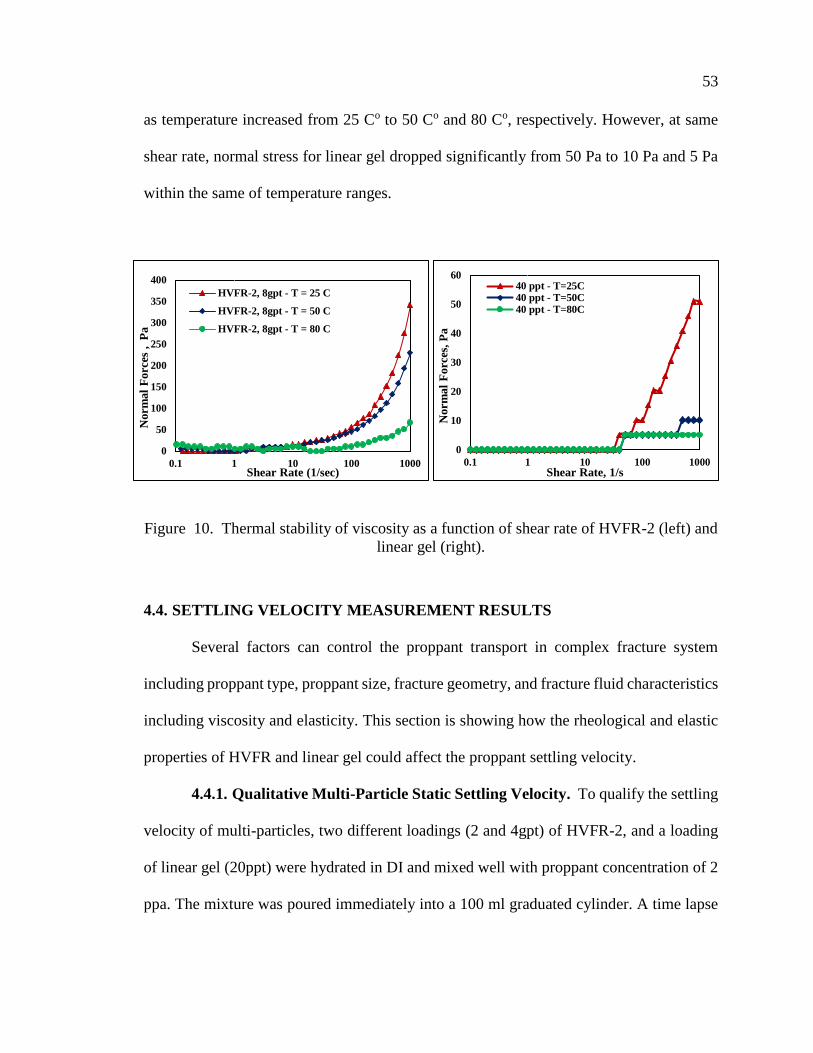
43 THERMAL STABILITY MEASUREMENT RESULTS 52
44 SETTLING VELOCITY MEASUREMENT RESULTS 53
441 Qualitative Multi-Particle Static Settling Velocity 53
442 Quantitative Single Particle Static Settling Velocity 55
4421 Proppant size effect on static settling velocity55
4422 Effect of elasticity and viscosity properties on settling
velocity 56
5 COST ANALYSIS 60
6 CONCLUSIONS 61
REFERENCES 62
III STATIC PROPPANT SETTLING VELOCITY CHARACTERISTICS IN
HIGH-VISCOSITY FRICTION REDUCERS FLUIDS FOR UNCONFINED
AND CONFINED FRACTURES 65
ABSTRACT 65
1 INTRODUCTION 66
2 PROPPANT STATIC SETTLING VELOCITY 69
ix
21 WALL EFFECT (Fw) 69
22 PARTICLE SHEAR RATE (ϔ) 69
23 ELASTICITY TO VISCOSITY RATIO (λeυ) 70
24 FORCES INFLUENCED PARTICLES SETTLING VELOCITY 71
3 EXPERIMENT DESCRIPTION 72
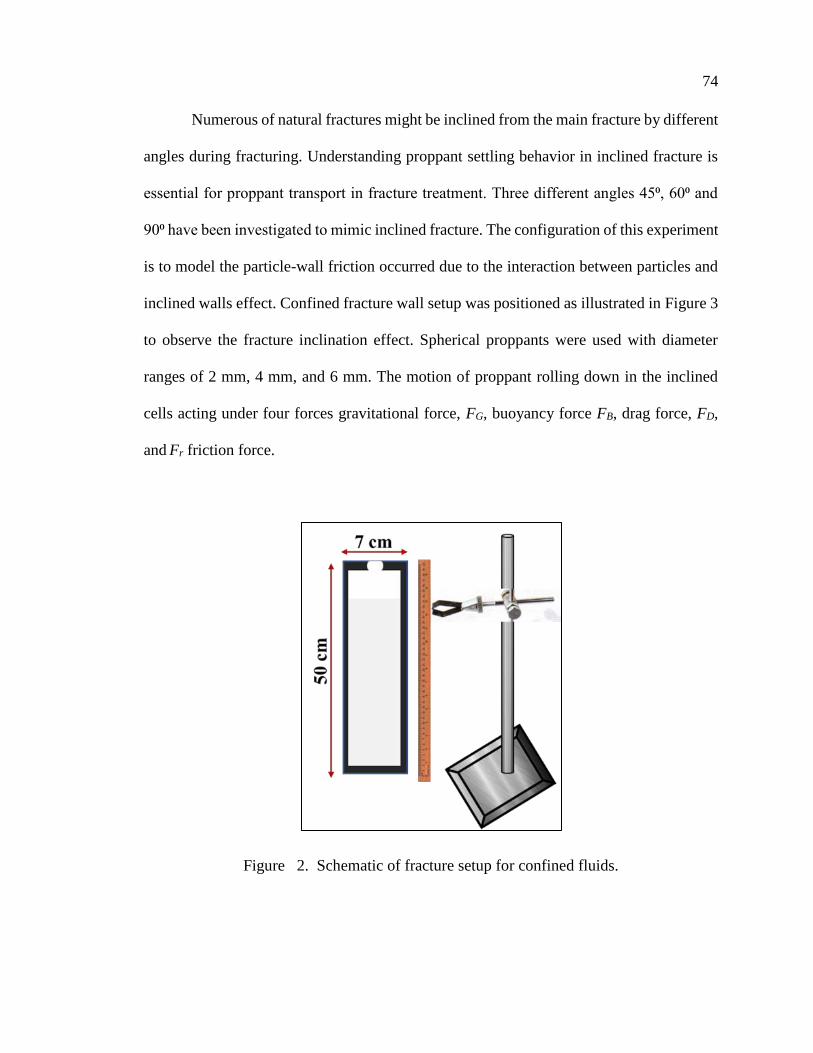
31 MATERIALS 72
311 Hydraulic Fracturing Fluids 72
312 Preparing Fracturing Fluids 72
313 Proppant Sizes 72
314 Rheometer 72
32 EXPERIMENT SETUP 72
321 Unconfined Fracture Wall Experiments 72
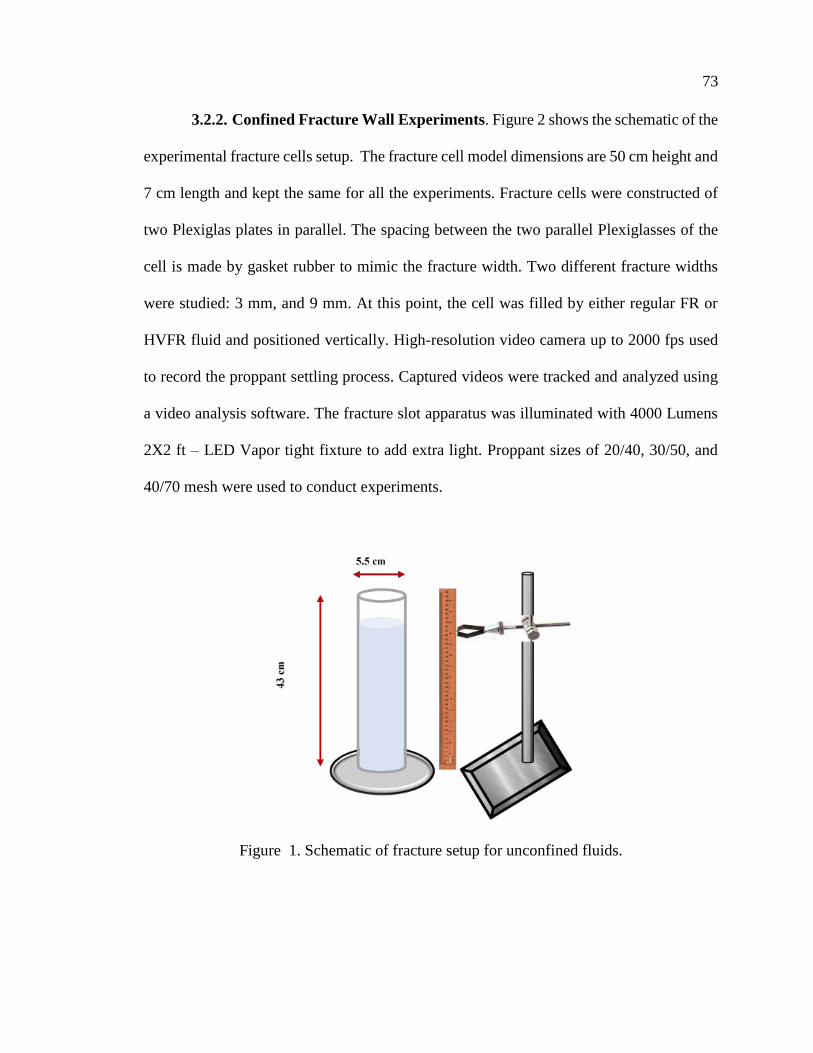
322 Confined Fracture Wall Experiments 73
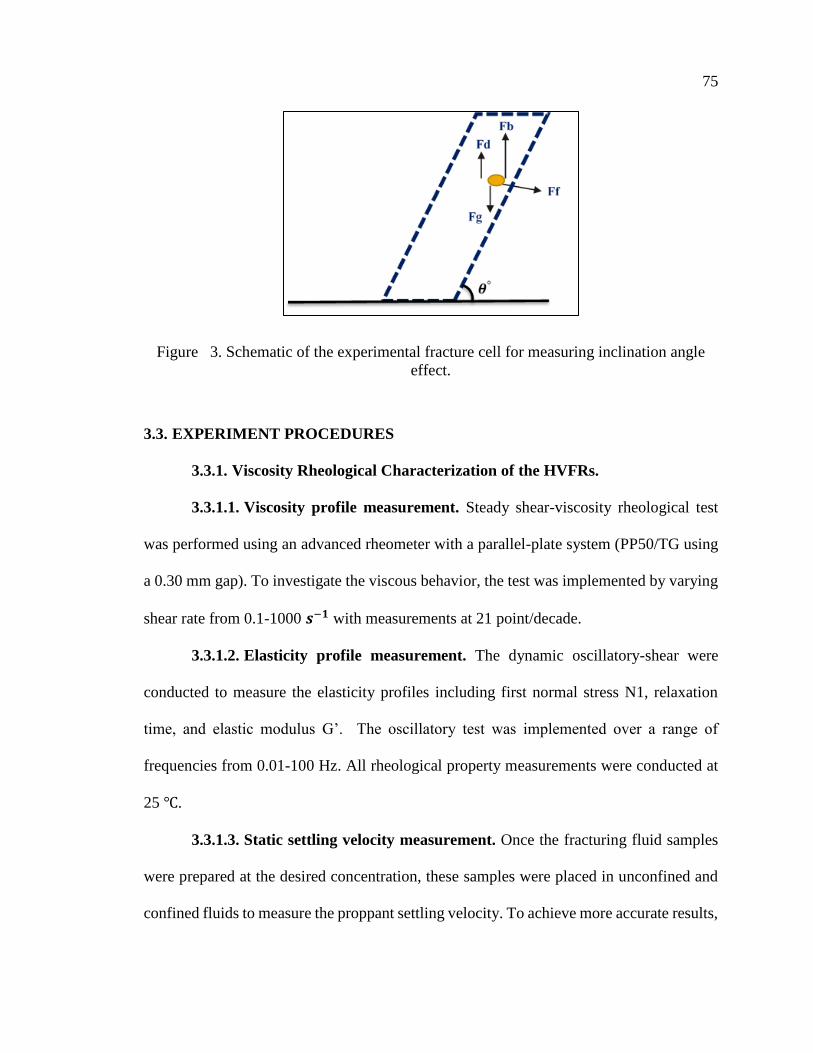
33 EXPERIMENT PROCEDURES 75
331 Viscosity Rheological Characterization of the HVFRs 75
3311 Viscosity profile measuremant 75
3312 Elasticity profile measurement 75
3313 Static settling velocity measurement 75
332 Static Settling Velocity Calculations Based on Power Law
Parameters (K n) 76
4 RESULTS AND DISCUSSION 77
41 VISCOSITY MEASUREMENT RESULTS 77
42 ELASTICITY MEASUREMENT RESULTS 78
43 SETTLING VELOCITY MEASUREMENT RESULTS 81
x
44 PROPPANT SETTLING VELOCITY PERFORMANCE IN
UNCONFINED FRACTURE WALL 81
45 PROPPANT SETTLING VELOCITY PERFORMANCE IN CONFINED
FRACTURE WALL 81
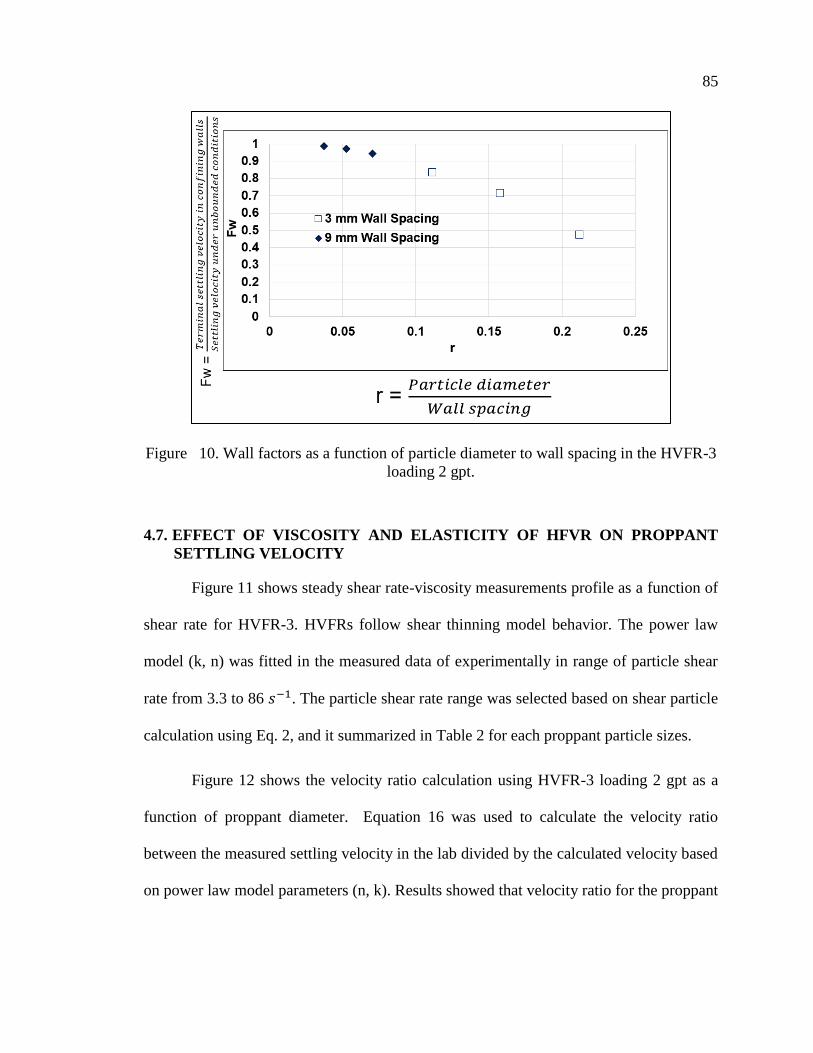
46 WALL EFFECT ON STATIC SETTLING VELOCITY 84
47 EFFECT OF VISCOSITY AND ELASTICITY OF HFVR ON PROPPANT
SETTLING VELOCITY 85
48 EFFECT OF ELASTICITY TO VISCOSITY RATIO (ΛEΥ) 87
5 COST ANALYSIS 88
REFERENCES 90
IV INVESTIGATE PROPPANT TRANSPORT WITH VARYING
PERFORATION DENSITY AND ITS IMPACT ON PROPPANT
DUNE DEVELOPMENT INSIDE HYDRAULIC FRACTURES 93
ABSTRACT 93
1 INTRODUCTION 94
2 EXPERIMENT DESCRIPTION 97
21 EXPERIMENT MATERIALS 97
22 FRACTURE MODEL SETUP 98
23 EXPERIMENT PROCEDURE 99
24 EXPERIMENT ANALYSIS APPROACHES 101
241 Equilibrium Dune Level (EDL) 101
242 Proppant Dune Level Development (PDLD) 101
243 Equilibrium Dune Length (EDX) 101
244 Pressure Losses Calculations 101
3 RESULTS AND ANALYSIS 102
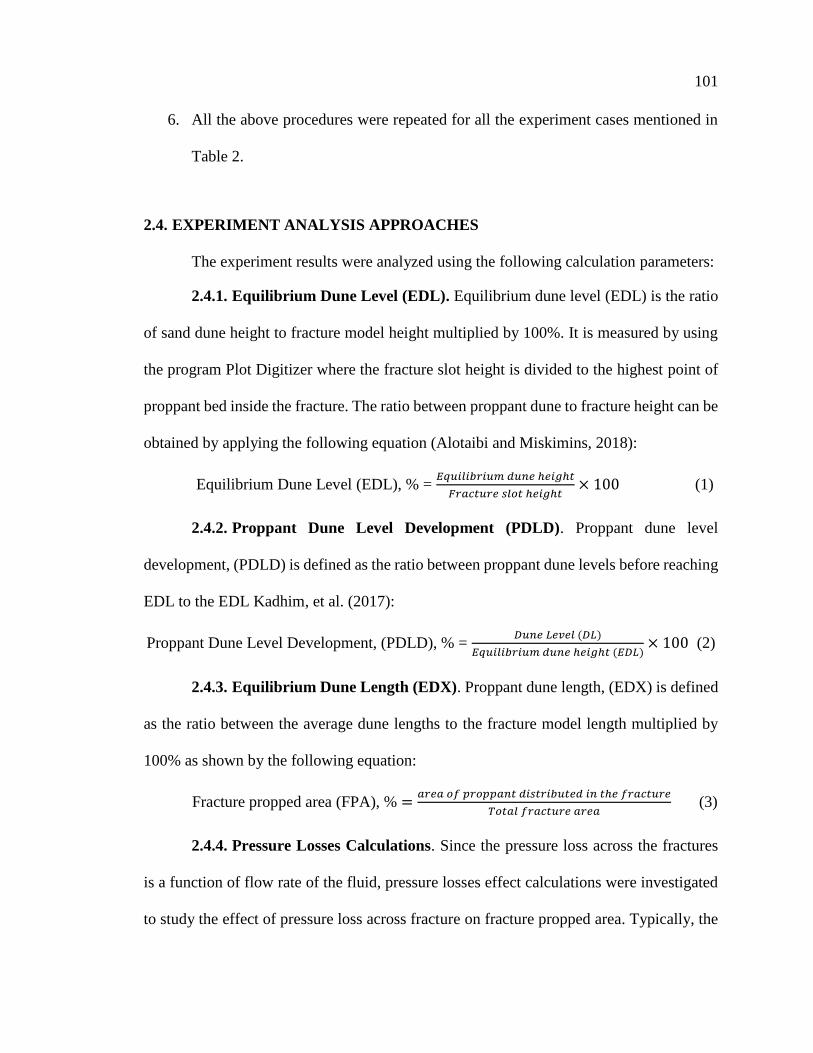
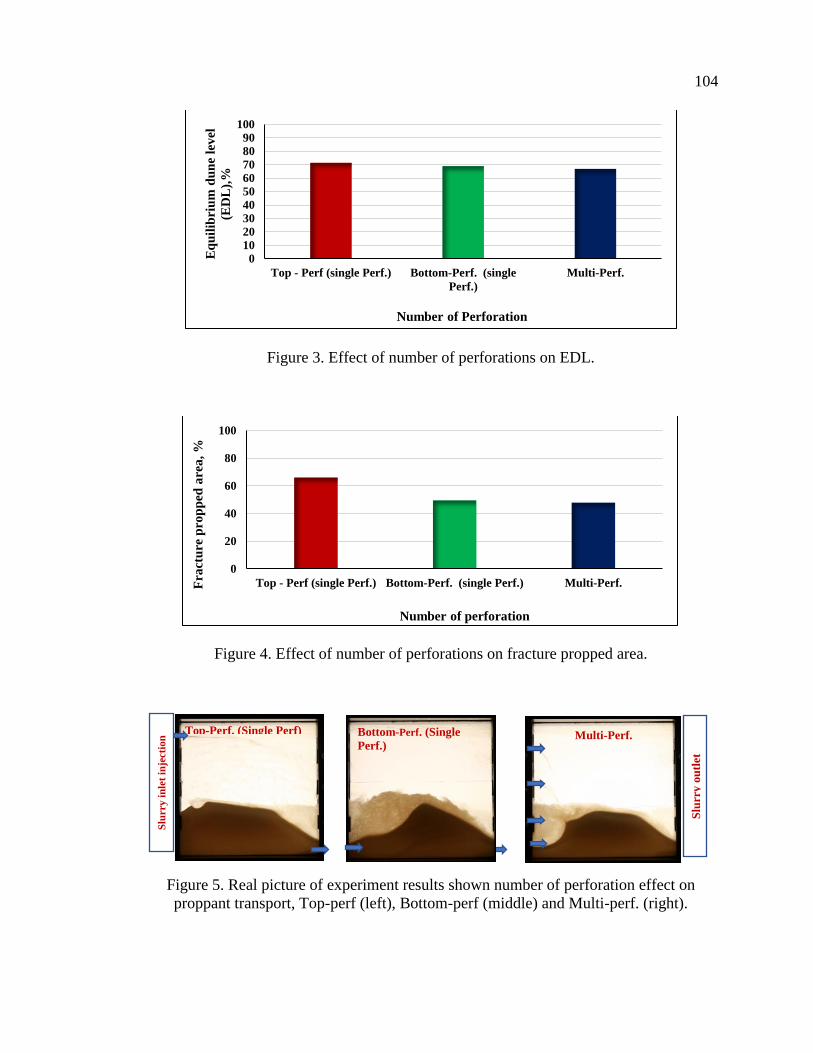
31 NUMBER OF PERFORATION EFFECT 102
xi
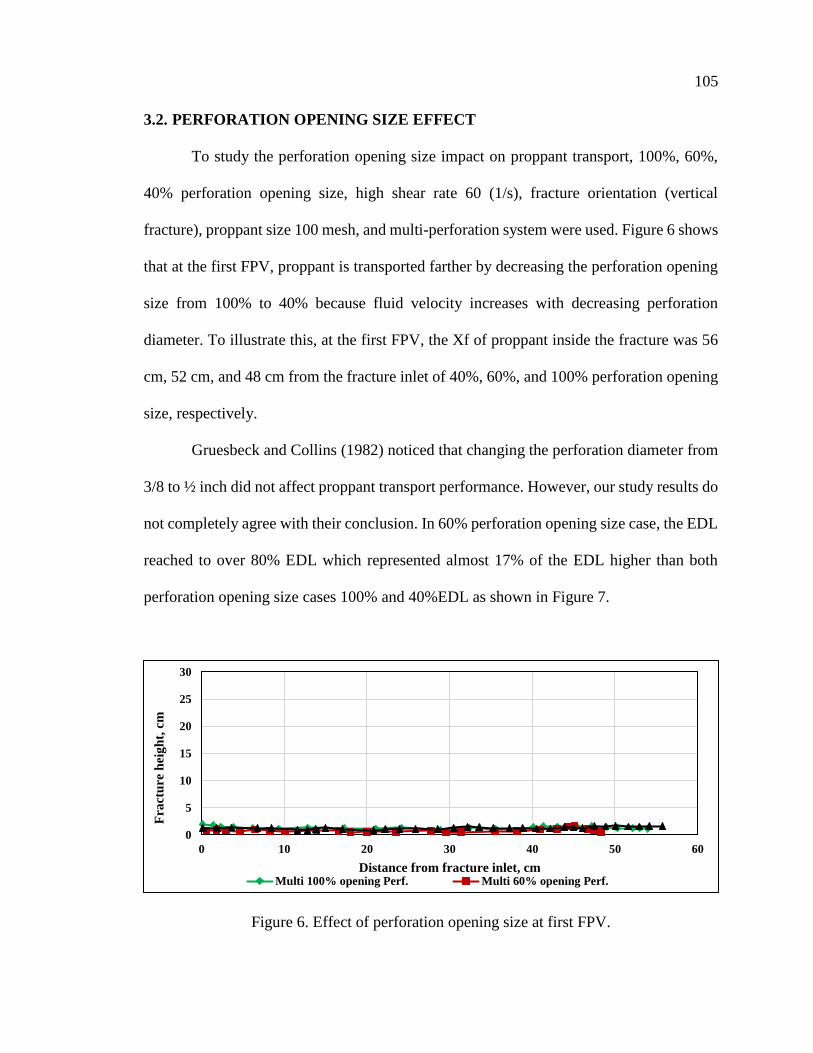
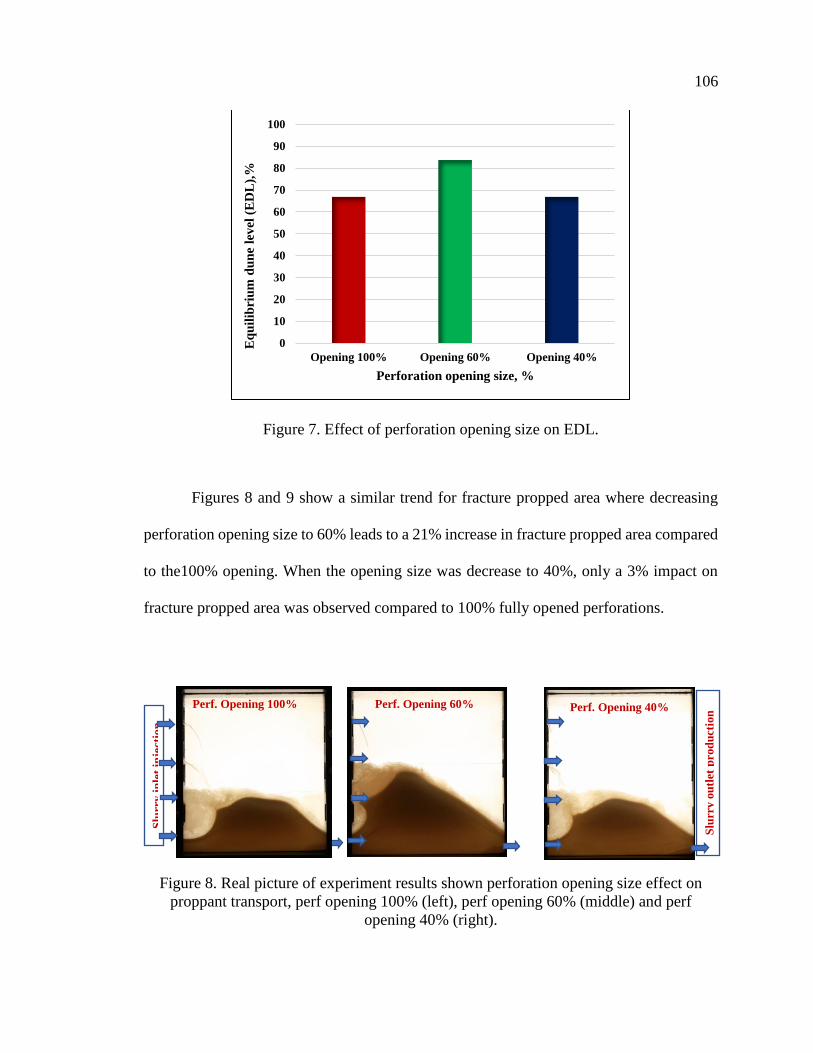
32 PERFORATION OPENING SIZE EFFECT 105
33 SHEAR RATE EFFECT 107
34 FRACTURE ORIENTATION EFFECT 110
35 PROPPANT SIZE DISTRIBUTION EFFECT 113
4 DISCUSSION 116
41 EFFECT OF PRESSURE LOSS ALONG THE FRACTURE SLOT
ON PROPPANT TRANSPORT PERFORMANCE 116
42 MECHANISMS OF PROPPANT TRANSPORT 117
421 Stage 1 Hindered and Free Settling 117
422 Stage 2 Saltation 117
423 Stage 3 Suspension Rolling and Swirl at Inlet 118
424 Stage 4 Saltation Rolling and Swirl at Inlet 118
425 Thermal Stability Measurement 119
426 Static Settling Velocity Measurement 119
5 CONCLUSIONS 120
REFERENCES 121
V VISCOELASTIC CHARACTERIZATION EFFECT OF HIGH-
VISCOSITY FRICTION REDUCERS AND PROPPANT
TRANSPORT PERFORMANCE IN HIGH-TDS ENVIRONMENT 124
ABSTRACT 124
1 INTRODUCTION 125
11 PRODUCED WATER IN USA BASINS 130
2 EXPERIMENT DESCRIPTION 131
21 EXPERIMENT MATERIALS 131
211 Fracturing Fluids 131
xii
212 Frac Sand and Dosage 132
22 MEASUREMENTS OF RHEOLOGICAL PROPERTY 132
221 Friction Reducers Preparation for Rheological Property 132
222 Fracturing Fluid Viscosity Measurement 133
223 Elasticity Characterization (Elastic Modulus Grsquo) 133
224 Friction Reducers Preparation for Elasticity Property 133
225 Elastic Modulus Measurement 133
23 THE SETTLING RATE MEASUREMENT OF FRAC SAND IN HVFR
FRACTURING FLUID 134
231 HVFR Fracturing Fluid Preparation 134
232 Test Method on Frac Sand Settlement Rate 134
3 RESULTS AND ANALYSIS 134
31 THE VISCOSITY PROFILES OF VARIOUS FRICTION REDUCERS
IN DI WATER 2 WT KCL AND 10 LBS BRINE (SATURATED
NACL SOLUTION (TDS 347000 PPM)) 134
32 THE N AND K VALUES OF VARIOUS FRICTION REDUCERS
IN DI WATER 2 WT KCL AND 10 LBS BRINE (SATURATED
NACL SOLUTION (TDS 347000 PPM)) 137
33 THE ELASTIC MODULUS COMPARISON OF VARIOUS
FRICTION REDUCERS IN DI WATER AND 10 LBS BRINE
SOLUTION (TDS347000PPM) 137
34 PROPPANT SETTLING RATE RESULT 139
35 HVFR ELASTIC MODULUS CHARACTERISTICS BY
AMPLITUDE FREQUENCY FLUID TYPE AND TEMPERATURE 141
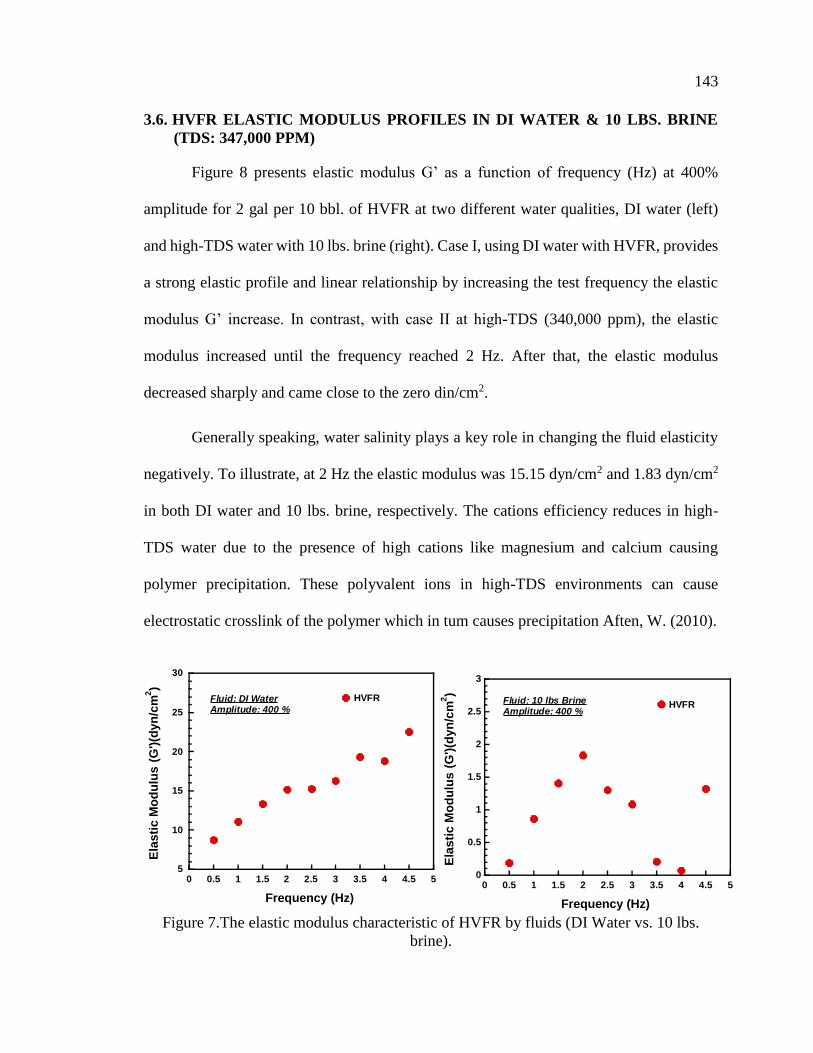
36 HVFR ELASTIC MODULUS PROFILES IN DI WATER amp 10 LBS
BRINE (TDS 347000 PPM) 143
37 HVFR ELASTIC MODULUS PROFILES BY TEMPERATURE 144
38 FIELD CASE STUDY 144
xiii
4 DISCUSSION THE POTENTIAL OF FORMATION DAMAGE 145
5 CONCLUSIONS 147
REFERENCES 148
VI A COMPREHENSIVE REVIEW OF FORMATION DAMAGE CAUSED
BY HIGH-VISCOSITY FRICTION REDUCERS WOLFCAMP CASE
STUDY 151
ABSTRACT 151
1 INTRODUCTION 152
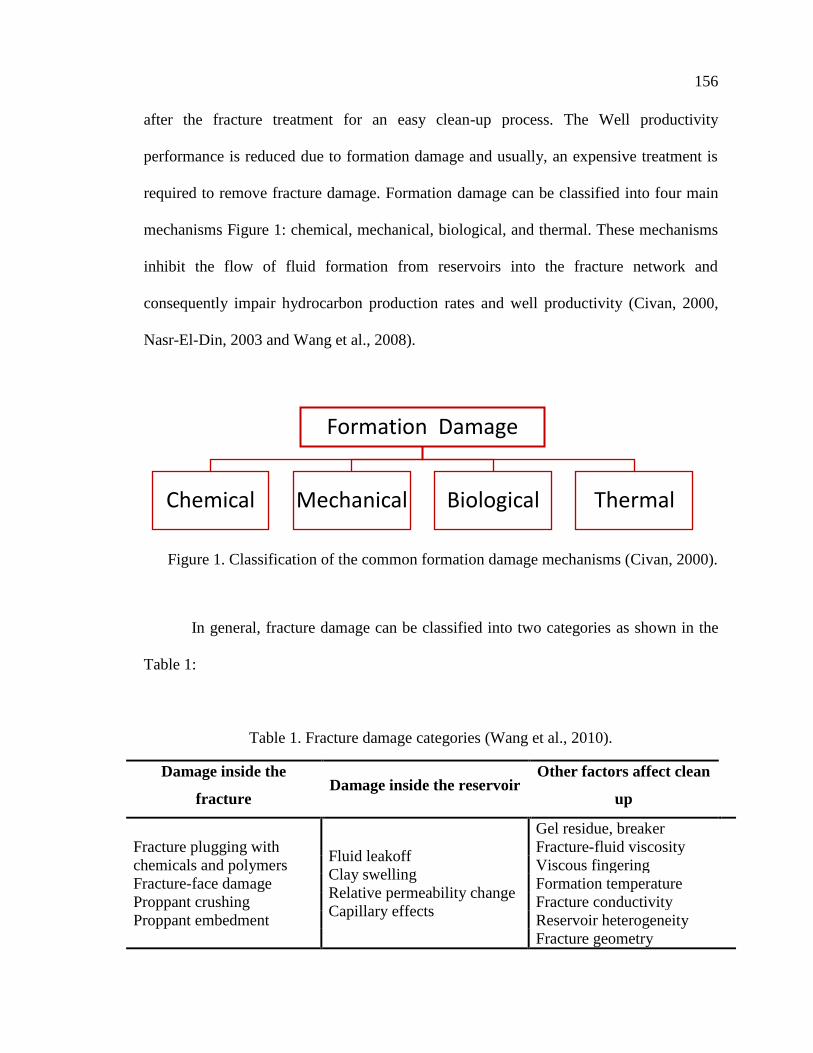
2 FORMATION DAMAGE MECHANISMS 155
3 WHY HIGH VISCOSITY FRICTION REDUCERS 157
4 EXPERIMENTAL DESCRIPTION 158
41 EXPERIMENTAL MATERIALS 158
411 Experimental Materials 158
412 Proppant 158
5 MEASUREMENTS OF RHEOLOGICAL PROPERTY 160
51 SHEAR VISCOSITY CHARACTERIZATION (K N) 160
52 SHEAR ELASTICITY CHARACTERIZATION (ELASTIC
MODULUS Grsquo) 160
53 FRACTURE CONDUCTIVITY EXPERIMENT PROCEDURE 160
6 RESULTS AND ANALYSIS 161
61 RHEOLOGICAL CHARACTERIZATION OF THE HVFRS 161
611 Viscosity Profile Measurement 161
612 Elasticity Profile Measurment 162
xiv
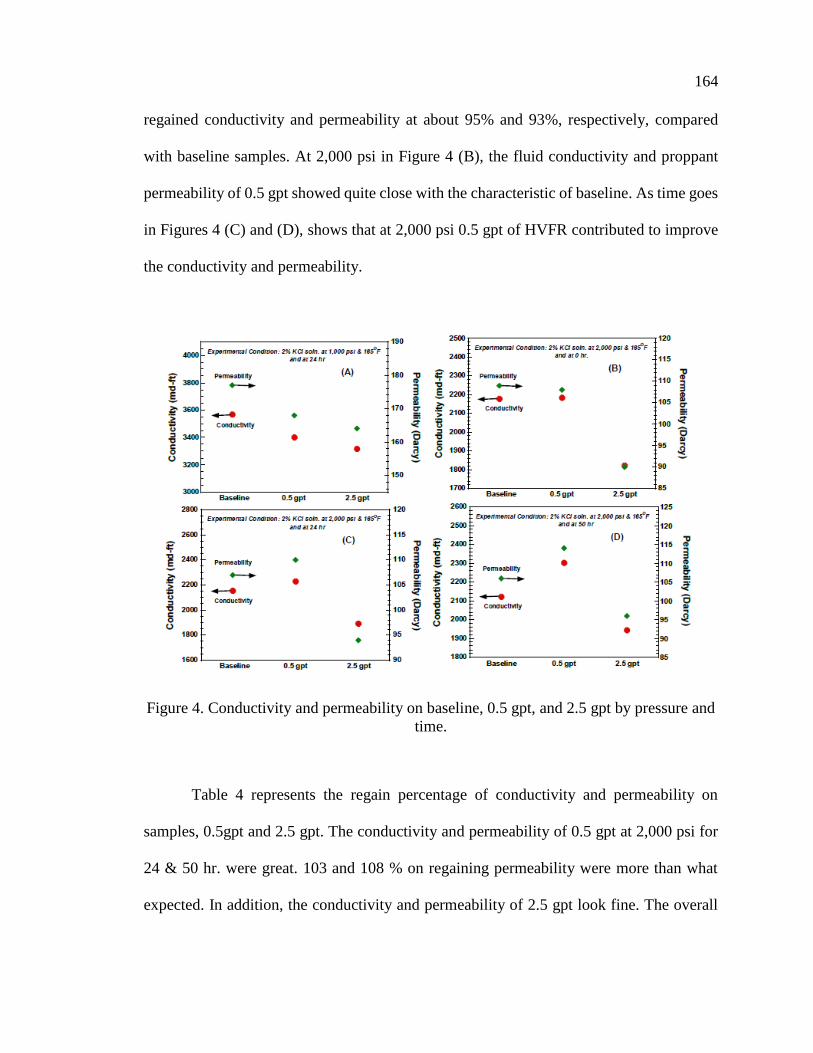
62 CONDUCTIVITY AND PERMEABILITY MEASUREMENT
ON BASELINE 05 GPT AND 25 GPT 163
63 CASE STUDY WOLFCAMP FORMATION REEVES COUNTY TX 165
631 Geological Background 165
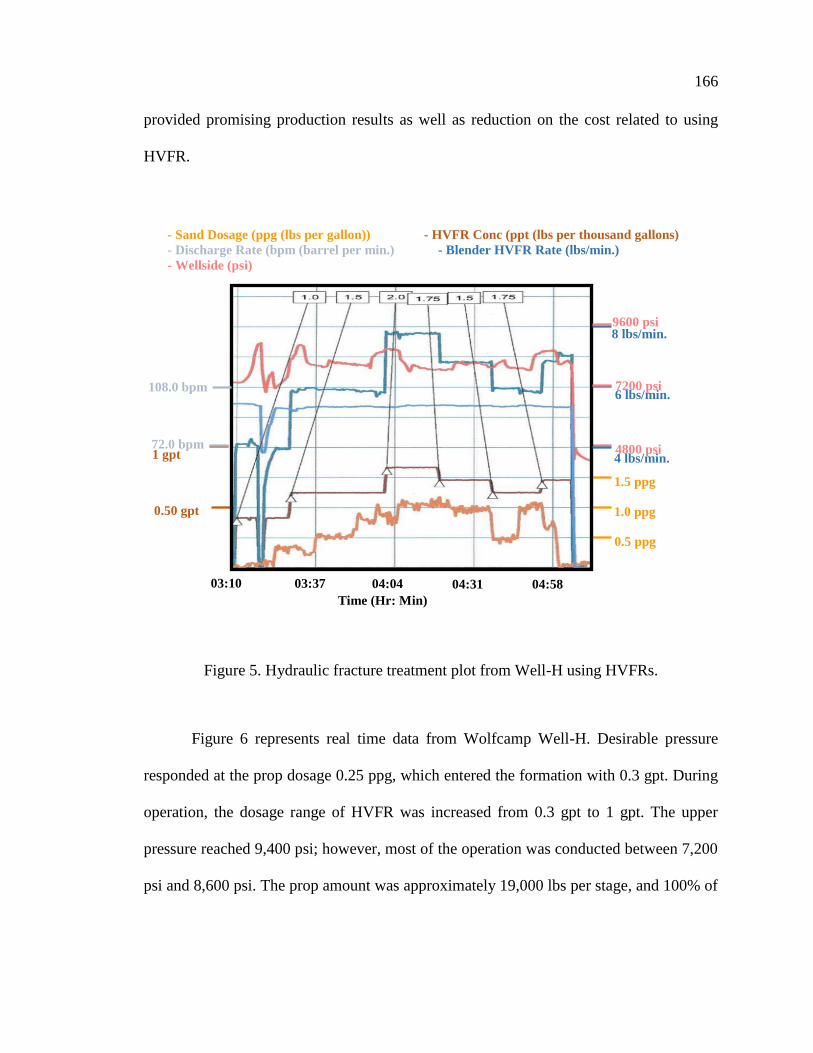
632 Fracture Design and Execution 165
7 CONCLUSIONS 167
REFERENCES 168
SECTION
3 CONCLUSIONS 172
REFERENCES 173
VITA 174
xv
LIST OF ILLUSTRATIONS
PAPER I Page
Figure 1 Visualization of proppant transport using friction reducer and high-viscosity
friction reducers 8
Figure 2 Friction reducers types 9
Figure 3 Chemical structure of various Friction Reduction (FR) agents and a
comparison of friction pressure for water containing only 2 KCl vs
water containing 2 KCl and 2 gallons per 1000 gallons (FR) and 10
Guar pumped down 4 frac12rdquo 115 4rdquo ID casing 11
Figure 4 Field case studies distribution of using HVFRs in North America 14
Figure 5 Box plots of temperature ranges of HVFRs in the lab measurements
and field application 15
Figure 6 Maximum loading of HVFRs applied in the field 15
Figure 7 Box plots of HVFR concentration ranges in the lab measurements and
field application 16
Figure 8 Box plots of concentration ranges of FR and HVFRs 16
Figure 9 Box plots of viscosity ranges of HVFRs at high shear rate 511 S-1 17
Figure 10 Box plots of viscosity ranges of HVFRs at low shear rate 70 S-1 18
Figure 11 Chemical cost reduction of using HVFRs from different case studies 27
Figure 12 Production improvement of using HVFRs from different case studies 28
Figure 13 Chemical cost comparison for standard Bakken system 29
PAPER II
Figure 1 Schematic of fracture setup for unconfined fluids 43
Figure 2 Effect of HVFR (left) and linear gel (right) concentrations as a function of
shear rate 46
Figure 3 Viscosity as a function of concentration of HVFRs (left) and linear gel
(right) at low shear rates 47
xvi
Figure 4 Elastic modulus and storage modulus as a function for HVFR-2 at
different concentration 49
Figure 5 Elastic modulus and storage modulus as a function of angular frequency
for linear gel at different concentrations 20ppt and 40ppt 50
Figure 6 Relaxation time as a function of concentration of HVFR-1 HVFR-2 and
HVFR-3 (left) and linear gel (right) 50
Figure 7 Effect of HVFR 2 concentration as a function in normal stress profile 51
Figure 8 Effect of HVFR 2 concentration as a function in normal stress profile 51
Figure 9 Thermal stability of viscosity as a function of shear rate of HVFR-2 (left)
and linear gel (right) 52
Figure 10 Thermal stability of viscosity as a function of shear rate of HVFR-2
(left) and linear gel (right) 53
Figure 11 Multi-static measurement for proppant settling time using HVFR-2 (2gpt)hellip54
Figure 12 Multi-static measurement for proppant settling time using HVFR-2 (4gpt)hellip55
Figure 13 Multi-static measurement for proppant settling time using liner gel (20 ppt)55
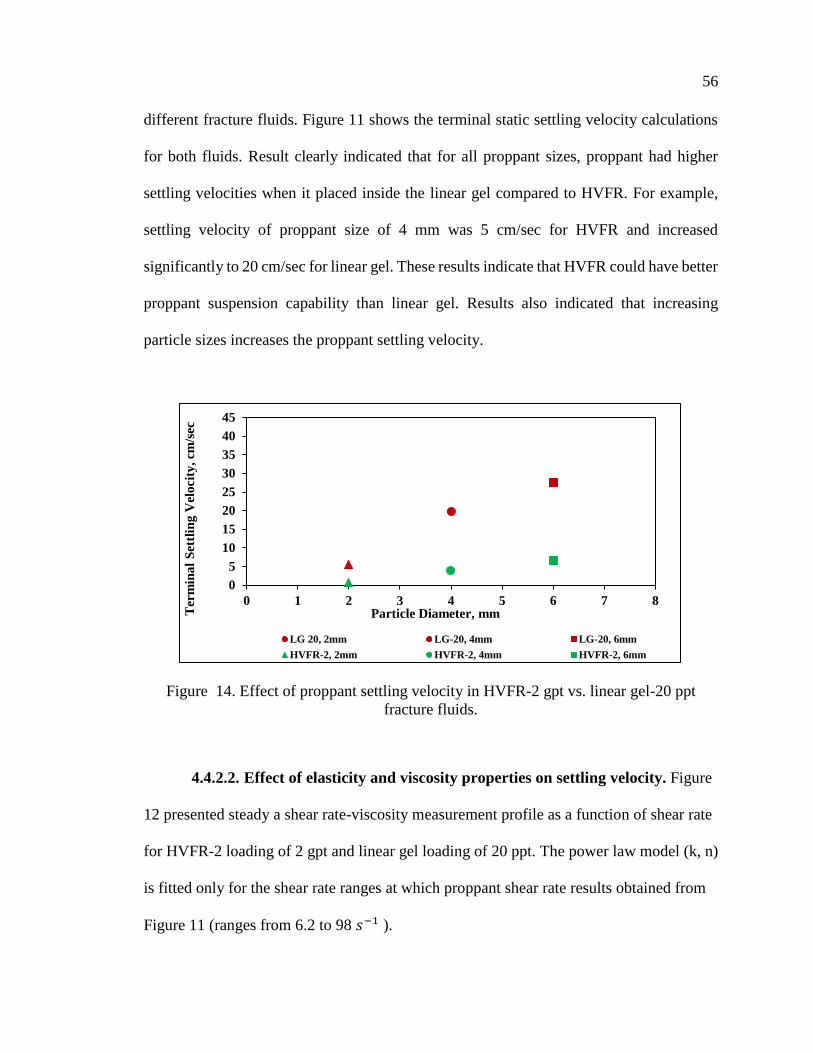
Figure 14 Effect of proppant settling velocity in HVFR-2 gpt vs linear gel-20 ppt
fracture fluids 56
Figure 15 Viscosity as a function of shear rate for HVFR-2 loading 2 gpt (left) and linear
gel loading 20 ppt (right) 57
Figure 16 Calculated elasticviscous ratio as a function of shear rate for HVFR-2
2 gpt and linear gel ndash 20 ppt 59
PAPER III
Figure 1 Schematic of fracture setup for unconfined fluids 73
Figure 2 Schematic of fracture setup for confined fluids 74
Figure 3 Schematic of the experimental fracture cell for measuring inclination
angle effect 75
Figure 4 Effect of HVFR-3 concentration as a function in viscosity shear profile 78
Figure 5 Elastic modulus Grsquo and storage modulus G`` as a function of HVFR-3
concentrations 79
xvii
Figure 6 Effect of HVFR 3 concentration as a function in Normal stress profile 80
Figure 7 Effect of proppant settling velocity in HVFR-3 gpt vs slickwater fracture
fluids 82
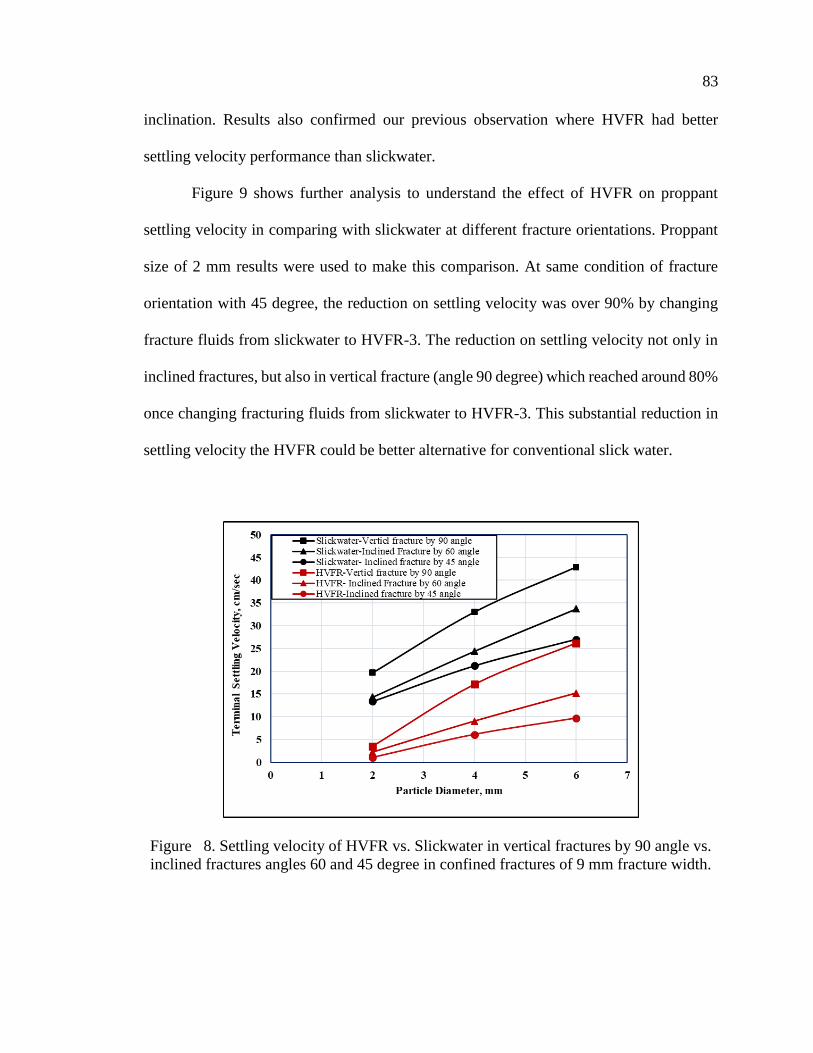
Figure 8 Settling velocity of HVFR vs slickwater in vertical fractures by 90 angle
vs inclined fractures angles 60 and 45 degree in confined fractures of
9 mm fracture width 83
Figure 9 Settling velocity reduction in slickwater versus HVFR-3 loading 2 in
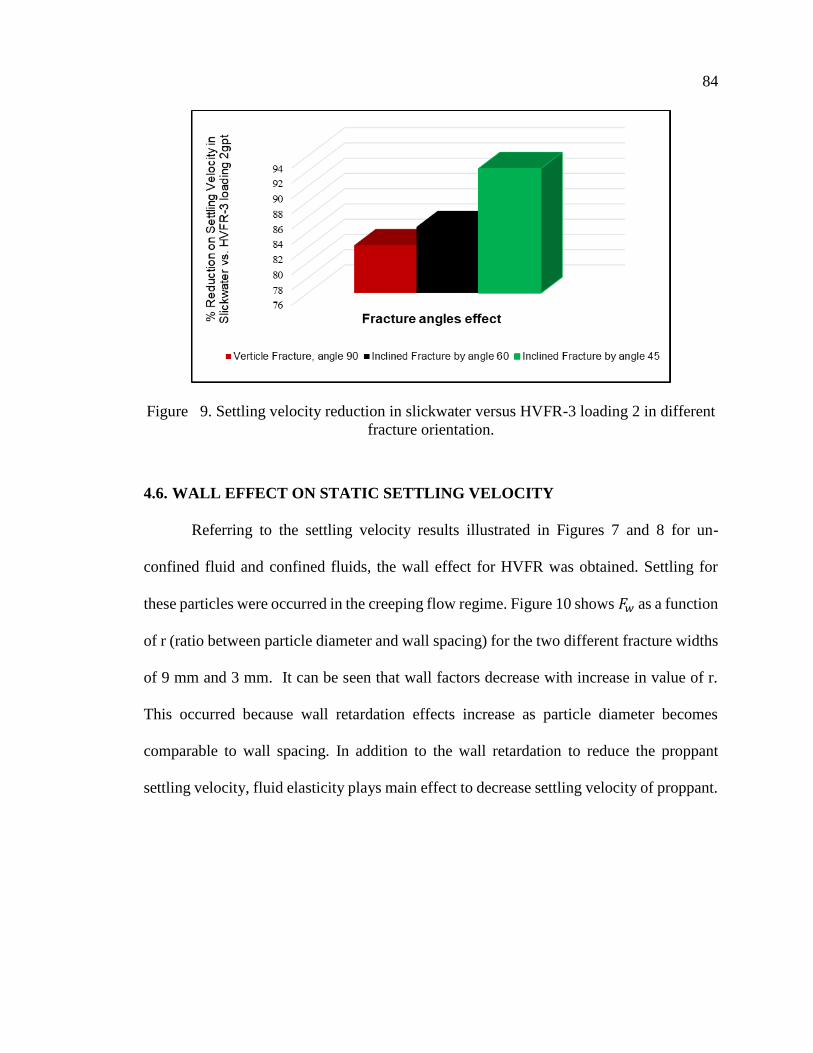
different fracture orientation 84
Figure 10 Wall factors as a function of particle diameter to wall spacing in the
HVFR-3 loading 2 gpt 85
Figure 11 Viscosity as a function of shear rate for HVFR-3 loading 2gpt 86
Figure 12 Velocity ratio as a function of proppant diameter in HVFR-3 loading
2 gpt 87
Figure 13 Calculated elasticviscous ratio as a function of shear rate for HVFR-3
loading 2 gpt 88
PAPER IV
Figure 1 Schematic schematic of the experimental proppant transport evaluation
system 99
Figure 2 Effect of number of perforations at first FPV 103
Figure 3 Effect of number of perforations on EDL 104
Figure 4 Effect of number of perforations on fracture propped area 104
Figure 5 Real picture of experiment results shown number of perforation effect on
proppant transport top-perf (left) bottom-perf (middle) and
multi-perf (right) 104
Figure 6 Effect of perforation opening size at first FPV 105
Figure 7 Effect of perforation opening size on EDL 106
Figure 8 Real picture of experiment results shown perforation opening size effect
on proppant transport perf opening 100 (left) perf opening 60
(middle) and perf opening 40 (right) 106
Figure 9 Effect of fracture shear rate at first FPV 107
xviii
Figure 10 Real picture of experiment results shown shear rate effect on proppant
transport high shear rate (left) and low shear rate (right) 108
Figure 11 Effect of high (60s minus 1) and low (35s minus 1shear rates on EDL 109
Figure 12 Effect of shear rate on EDL 109
Figure 13 Effect of shear rate on on fracture propped area 110
Figure 14 Effect of fracture orientation (vertical vs inclined) at first FPV 111
Figure 15 Effect of fracture orientation (vertical vs inclined) on EDL 111
Figure 16 Effect of fracture orientation (vertical vs inclined) on fracture propped
area 112
Figure 17 Real picture of experiment results shown perforation opening size effect
on proppant transport inclined fracture (left) and vertical fracture (right) 113
Figure 18 Effect of proppant size at first FPV 114
Figure 19 Effect of proppant size on EDL 114
Figure 20 Effect of proppant size on on fracture propped area 115
Figure 21 Real picture of experiment results shown proppant size effect on proppant
transport 100 mesh (left) 4070 mesh (middle) and 2040 mesh (right) 115
Figure 22 a and b pressure loss along fracture slot on shear rate (left) and shear rate
effect on Fracture propped area (right) 116
PAPER V
Figure 1 The viscosity profile of various friction reducers in DI water 136
Figure 2 The viscosity profile of various friction reducers in 2wt KCl solution 136
Figure 3 The viscosity profile of various friction reducers in 10 lbs brine 136
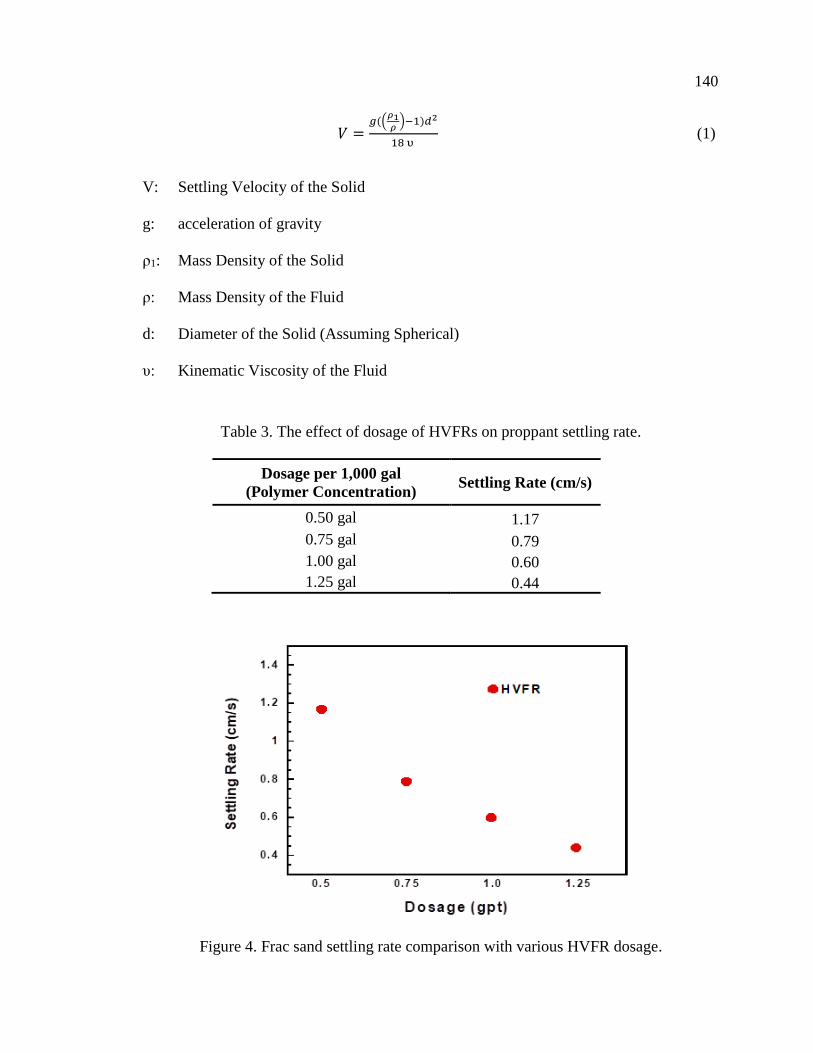
Figure 4 Frac sand settling rate comparison with various HVFR dosage 140
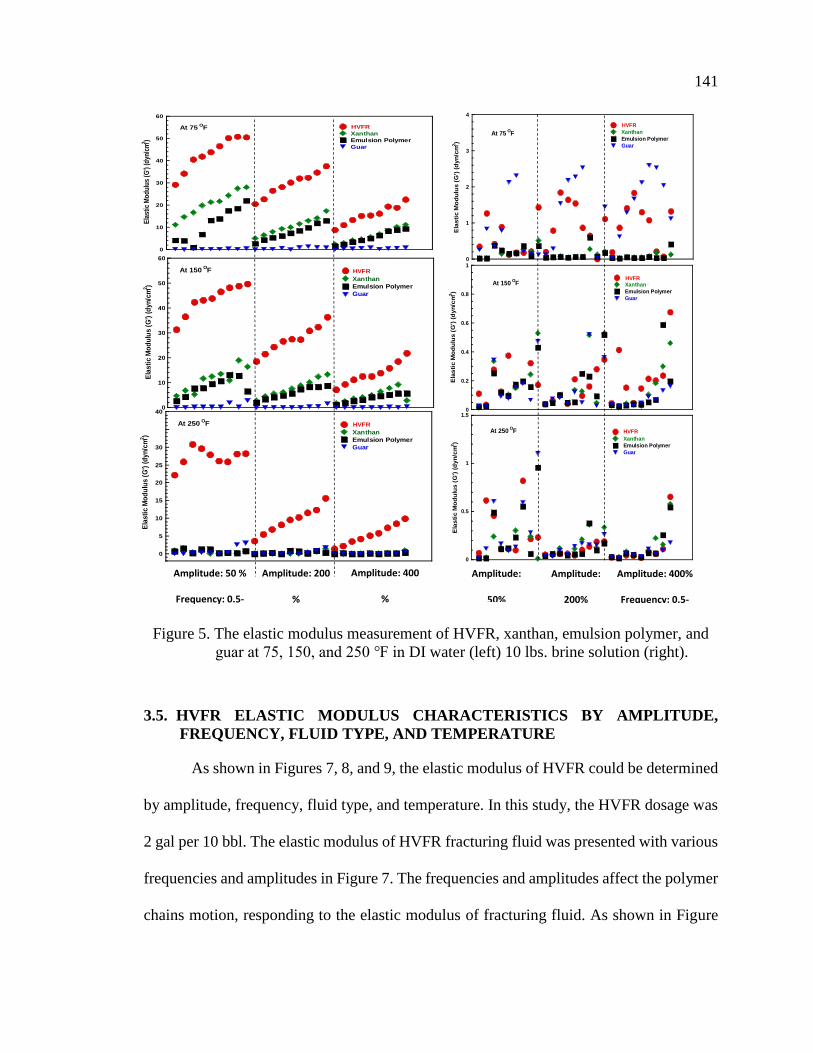
Figure 5 The elastic modulus measurement of HVFR xanthan emulsion polymer
and guar at 75 150 and 250 in DI water (left) 10 lbs brine solution
(right) 141
xix
Figure 6 The elastic modulus characteristic of HVFR by amplitude and frequency
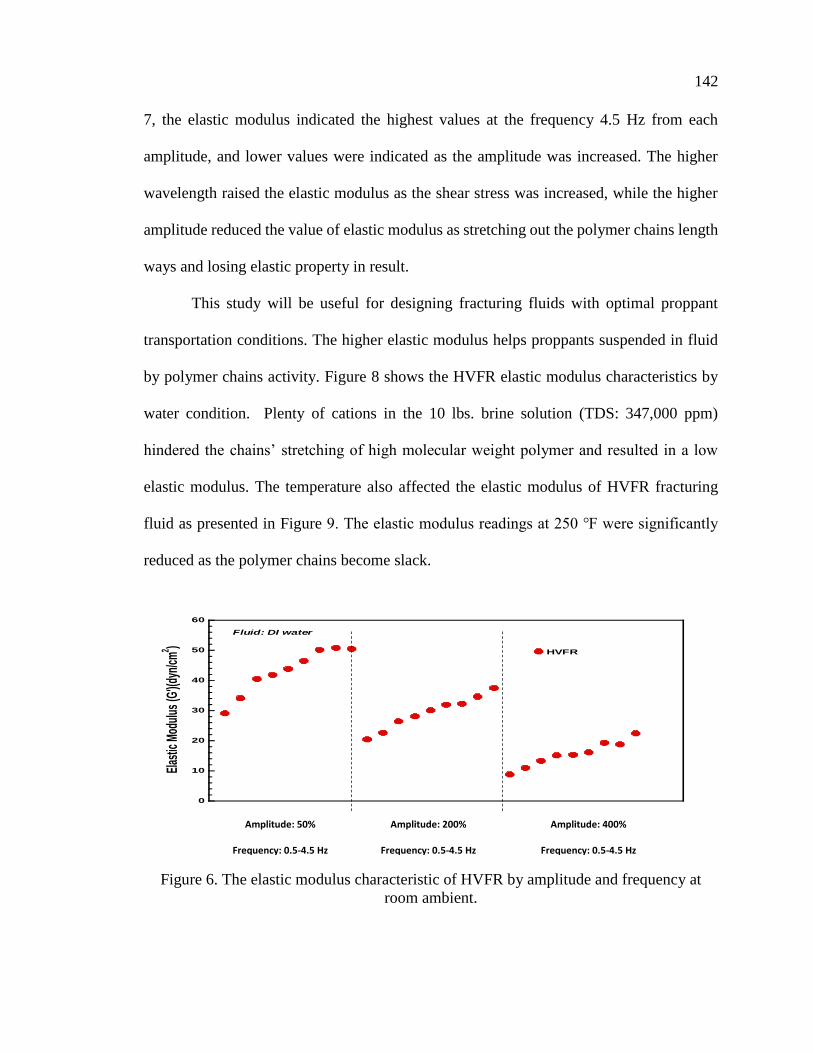
at room ambient 142
Figure 7The elastic modulus characteristic of HVFR by fluids (DI water vs
10 lbs brine) 143
Figure 8 The elastic modulus characteristic of HVFR by temperature 144
Figure 9 Hydraulic fracture treatment plot from Well-C using HVFRs 145
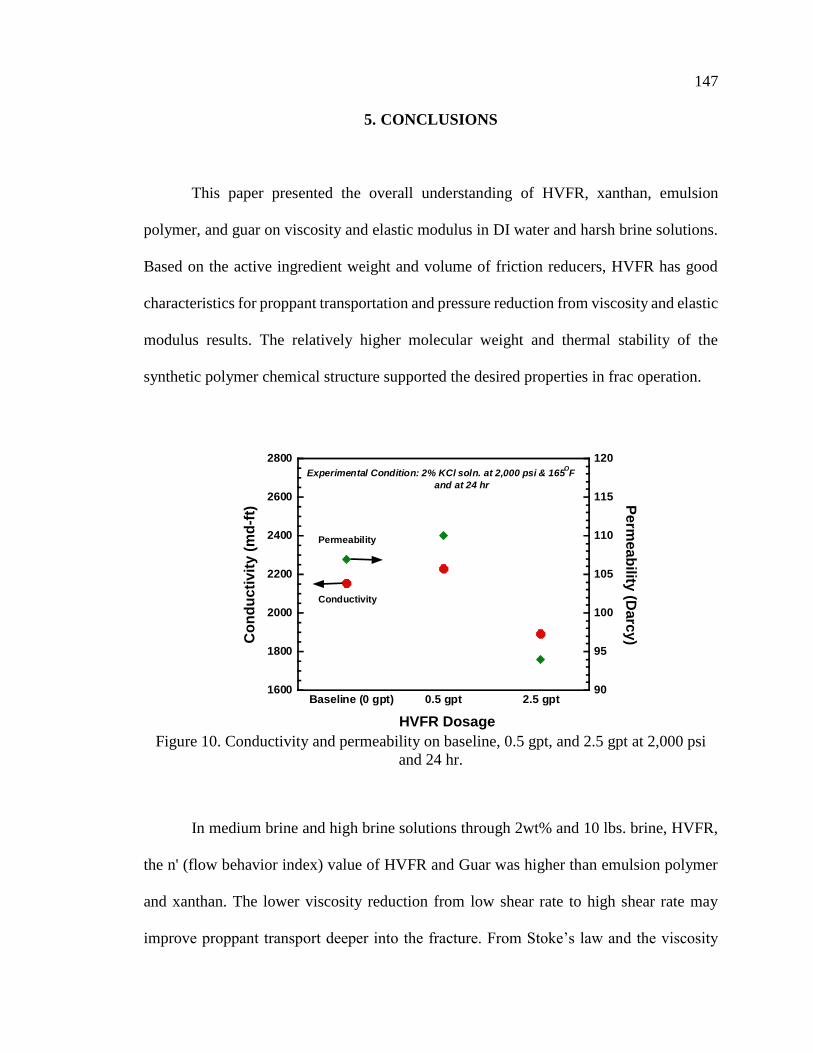
Figure 10 Conductivity and permeability on baseline 05 gpt and 25 gpt at
2000 psi and 24 hr 147
PAPER VI
Figure 1 Classification of the common formation damage mechanisms 156
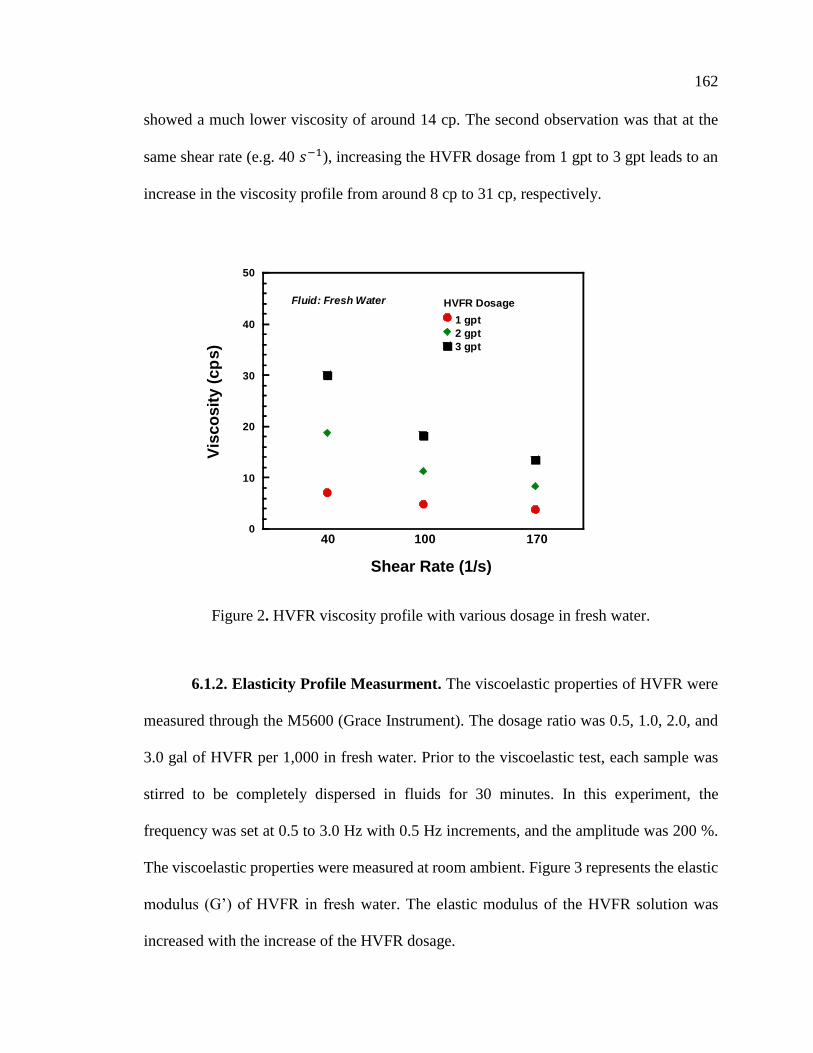
Figure 2 HVFR viscosity profile with various dosage in fresh water 162
Figure 3 HVFR elastic property with various dosage in fresh water 163
Figure 4 Conductivity and permeability on baseline 05 gpt and 25 gpt by
pressure and time 164
Figure 5 Hydraulic fracture treatment plot from Well-H using HVFRs 166
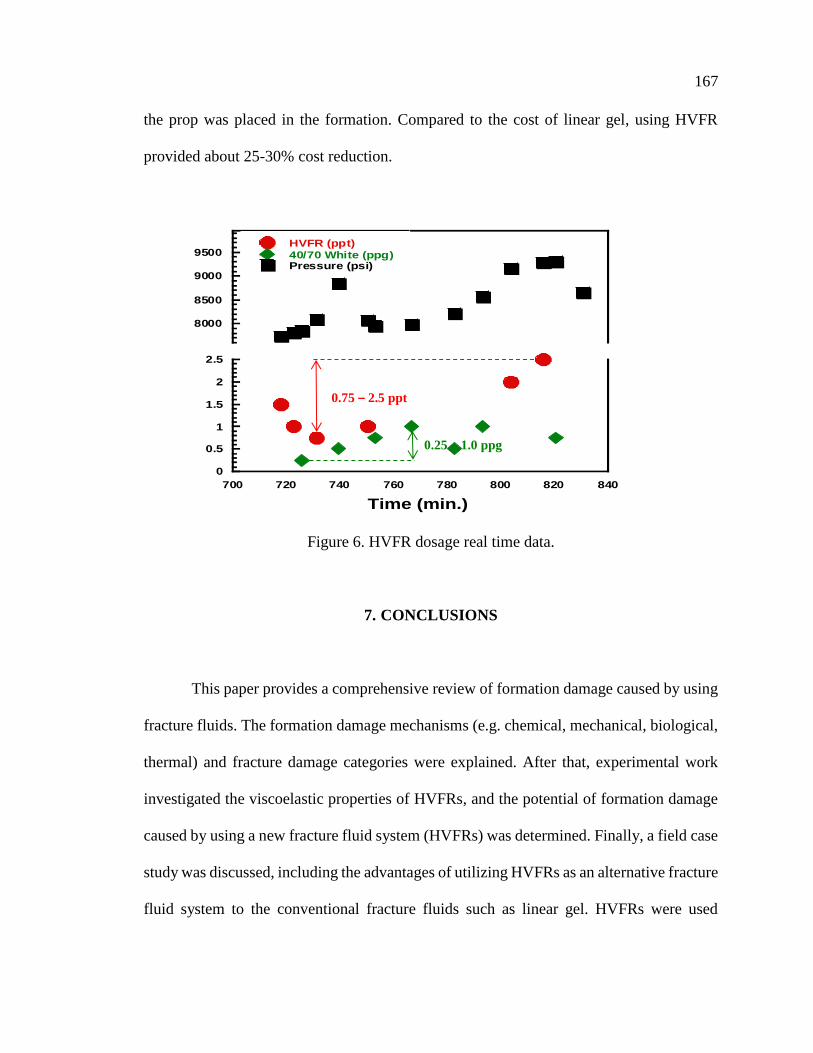
Figure 6 HVFR dosage real time data 167
xx
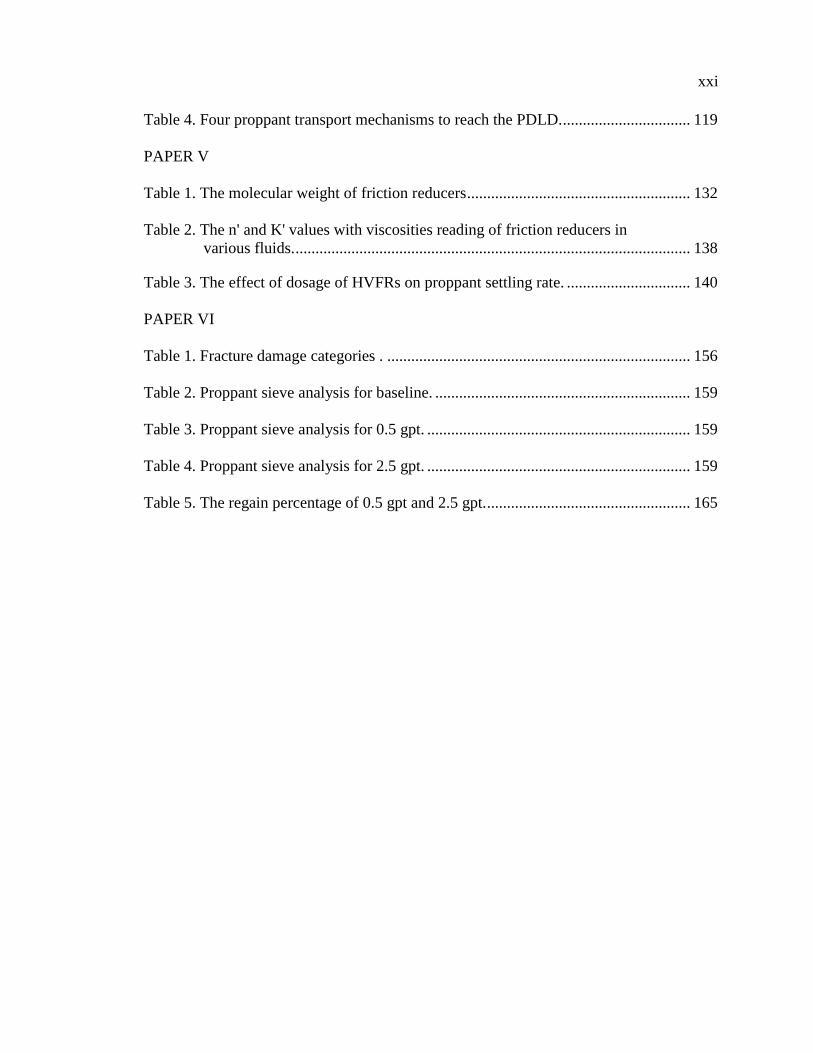
LIST OF TABLES
PAPER I Page
Table 1 Summary of viscosity data of HVFRs reviewed in this paper 19
Table 2 High viscosity friction reducers concentration gpt 19
Table 3 Fracture conductivity data of HVFRs reported in this paper 21
Table 4 Breakability data of HVFRs summarized in this paper 22
Table 5 Chemical composition of produced water in Delaware basin 24
Table 6 Produced water TDS used with HVFRs 25
Table 7 Stimulation summary of case study 29
PAPER II
Table 1 Power law model equations and parameters (n k) for HVFRs and linear gel 47
Table 2 Weissenberg number calculation as a function of relaxation time and
particle shear rate 58
Table 3 ElasticViscous ratio 120582119890120592 calculations 59
Table 4 Stimulation summary of case study 60
PAPER III
Table 1 Power law model equations and parameters (n k) for HVFR-3 78
Table 2 Particles shear rate calculations for HVFR 86
Table 3 ElasticViscous ratio 120582119890120592 calculations 89
PAPER IV
Table 1 APIISO properties of the tested US silica white sand proppants 98
Table 2 List of experiments and parameters 100
Table 3 shows pressure losses effect at 1st FPV on EDL and Xf 117
xxi
Table 4 Four proppant transport mechanisms to reach the PDLD 119
PAPER V
Table 1 The molecular weight of friction reducers 132
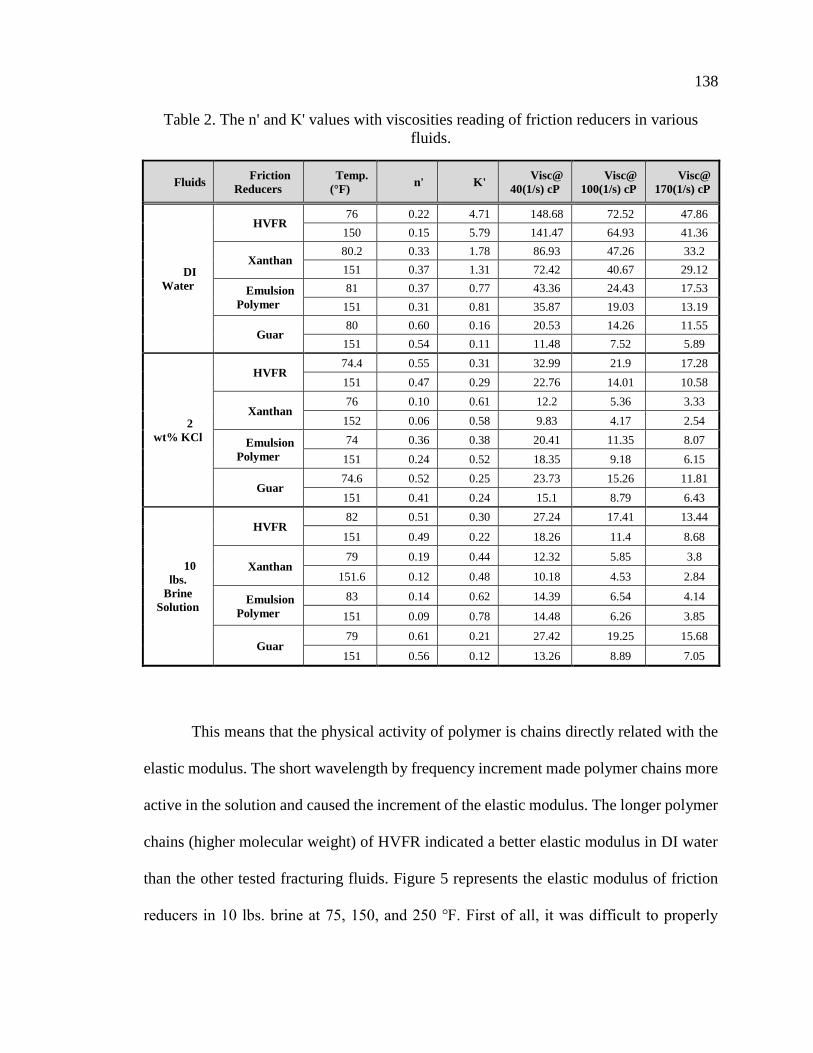
Table 2 The n and K values with viscosities reading of friction reducers in
various fluids 138
Table 3 The effect of dosage of HVFRs on proppant settling rate 140
PAPER VI
Table 1 Fracture damage categories 156
Table 2 Proppant sieve analysis for baseline 159
Table 3 Proppant sieve analysis for 05 gpt 159
Table 4 Proppant sieve analysis for 25 gpt 159
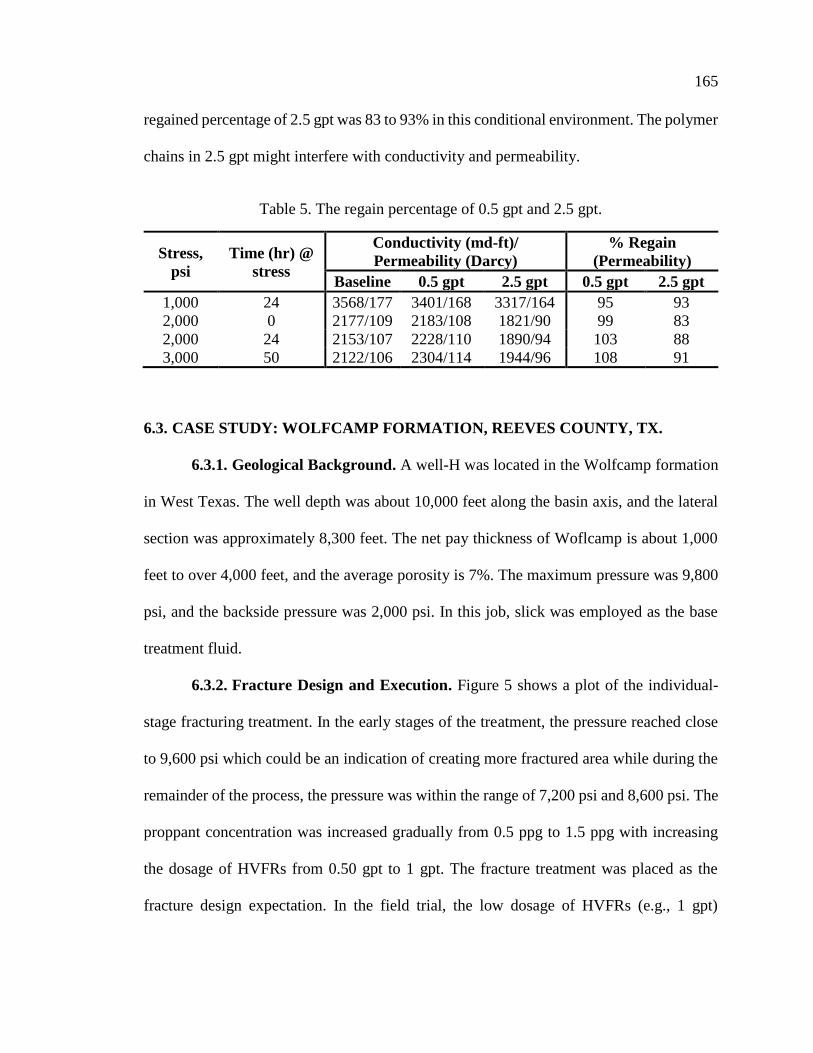
Table 5 The regain percentage of 05 gpt and 25 gpt 165
xxii
NOMENCLATURE
Symbol Description
ϔ particle shear rate
η(ϔ) Shear viscosity
N1(ϔ) First normal stress
μa Apparent shear viscosity
Wi Weissenberg number
λ Relaxation time
λeυ Elasticity to viscosity ratio
ρp Particle density
ρf Fluid density
CD Drag coefficient
1
35
1 INTRODUCTION
Hydraulic fracturing is the most efficient and effective technique enabling greater
economic access for oil and gas production in unconventional shale gas plays Increasing
production and reserves from low-permeability hydrocarbon bearing rocks prerequisite
stimulation treatment is required to make the fracturing process successfully and
economically feasible Transport of proppant into fractures that either hydraulically created
or naturally existed should be fully understood Proppant transport is influenced by a
complex combination of parameters including particle size density fracture dimensions
base fluid rheological properties Different types of fluids are used to enable the transport
of proppant into the fractures An important characteristic of fracturing fluid is to be
compatible with reservoir fluids should be cost effective environmentally friendly and
cause less damage to formation and fracture conductivity
Most of the fluids encountered in the industrial applications tend to have both the
shear thinning and the viscoelastic properties A shear-thinning characteristic indicates that
the fluid viscosity decreases with the increasing shear rate A viscoelastic fluid
demonstrates both viscous and elastic behavior under deformation in hydraulic fracturing
for effective proppant transport and to avoid their premature settling hydraulic fracturing
fluids are advised to have viscoelasticity (Acharya 1988 Adrian 2005) Therefore
knowledge of the particle settling behavior and the particle settling velocity in viscoelastic
shear thinning fluids is indispensable to optimize the properties of these industrial fluids
Essentially fluid selection and proppant placement play the main key in the hydraulic
fracturing process (Ba Geri et al 2019 Ellafi et al 2019)
2
Several types of farcing fluids have been applied including the use of slickwater
linear gel crosslinked in the USA basins The success of a fluid selection process depends
primarily on the length of the fracture and proppant distribution and placement in fracks
Thus understanding fluid composition ability to create fractures the capability to carry
and transport proppant deep into the fracture easy to flow back with minimal damage effect
through production from shale formation is the key a crucial successful fracking treatment
Even though slickwater (water fracturing with few chemical additives) used to be
one of the most common fracturing fluids several concerns are still associated with its use
including usage of freshwater high-cost operation and environmental issues Therefore
current practice in hydraulic fracturing is to use alternative fluid systems that are cost
effective and have a less environmental impact such as fluids which utilize high viscosity
friction reducers (HVFRs) which typically are high molecular weight polyacrylamides
Moreover the recent and rapid success of using HVFRs in hydraulic fracturing treatments
is due to several advantages over other fracture fluids (eg linear gel) which include better
proppant carrying capability induce more complex fracture system network with higher
fracture length and overall lower costs due to fewer chemicals and less equipment on
location
3
2 RESEARCH OBJECTIVES
The ultimate goal of this project is to expand the horizon of understanding proppant
transport using different fracture fluids in particular HVFRs in complex fracture system
Our new fracture model will be capable of achieving that goal The new fracture model can
be used to evaluate the impact of fracture geometry half-length injection pump rate
proppant type size amp shape proppant concentration fluids viscosity fluids elasticity leak-
off number of perforations natural fracture angles particle settling velocity fracture wall
roughness width heterogeneity and proppant distribution in the complex fracture network
on the transport of the proppant through fractures using different fracture fluids The
specific objectives of this research therefore include
bull To provide a better understanding of the advanced technologies of using high
viscosity friction reducer including the capability of carrying proppant in hydraulic
fracturing treatments The goal also is to statistically analyze the main associated
factors with HVFR such as concentration temperature viscosity and breakability
bull This project investigated several major factors affect proppant settling velocity
including viscosity measurement profiles elasticity properties (Normal forces and
relaxation time) and thermal stability profile
bull In addition this work conducted laboratory work intensively to fill the knowledge
gap This study investigated three factors that could affect proppant settling velocity
performance proppant size wall effect and fracture orientation
4
bull This study was deeply investigated five factors that affect proppant transport
performance number of perforations perforation opening size slurry shear rate
fracture orientation and proppant size distribution
bull This work will provide a comprehensive study of the effects of elasticity and shear
viscosity on proppant settling velocity using HVFRs and linear gel in fresh water
and produced water
bull A proper fracture lab slot will be upscaling to evaluate proppant transport
performance using HVFRs to the field implementations
5
PAPER
I A CRITICAL REVIEW OF HIGH-VISCOSITY FRICTION REDUCERS
APPLICATIONS AS AN ALTERNATIVE HUDRAULIC FRACTRUING
FLUIDS SYSTEM
Mohammed Ba Geri Abdulmohsin Imqam and Ralph Flori
Deparment of Petroleum Engineering Missouri University of Science and Technology
Rolla MO 65409
ABSTRACT
The primary purpose of using traditional friction reducers in stimulation treatments
is to overcome the tubular drag while pumping at high flow rates Hydraulic fracturing is
the main technology used to produce hydrocarbon from extremely low permeability rock
Even though slickwater (water fracturing with few chemical additives) used to be one of
the most common fracturing fluids several concerns are still associated with its use
including usage of freshwater high-cost operation and environmental issues Therefore
current practice in hydraulic fracturing is to use alternative fluid systems that are cost
effective and have less environmental impact such as fluids that utilize high-viscosity
friction reducers (HVFRs) which typically are polyacrylamides with high molecular
weight
This paper carefully reviews and summarizes over 40 published papers including
experimental work field case studies and simulation work This work summarizes the
most recent improvements of using HVFRs including the capability of carrying proppant
6
reducing water and chemical requirements compatibility with produced water and
environmental benefits in hydraulic fracturing treatments A further goal is to gain insight
into the effective design of HVFR-based fluid systems
The findings of this study are analyzed from over 26 field case studies of many
unconventional reservoirs In comparing HVFRs to the traditional hydraulic fracture fluids
system the paper summaries many potential advantages offered by HVFR fluids including
superior proppant transport capability almost 100 retained conductivity cost reduction
50 reduction in chemical use by less operating equipment on location 30 less water
consumption and fewer environmental concerns The study also reported that the common
HVFR concentration used was 4 gpt HVFRs were used in the field at temperature ranges
from 120 to 340 Finally this work addresses up-to-date challenges and emphasizes
necessities for using HVFRs as alternative fracture fluids
1 INTRODUCTION
Hydraulic fracturing has been successfully implemented since its inception in 1947
To achieve commercial production from ultra-low permeability formation development in
fracturing fluids is the key factor for stimulation operations Although a variety of
fracturing fluids have been used to increase the productivity of unconventional reservoirs
low viscous (slickwater) and high viscous (crosslinkers linear gel) fluids still have some
problems in terms of lower capability to carry proppant creating formation damage high-
cost operation and environmental concerns
7
In recent years the oil industry has adopted the use of high-viscosity friction
reducers (HVFRrsquos) in fracturing fluids due to several operational and economic reasons
(Hu et al 2018 Van Domelen et al 2017 Motiee et al 2016) Friction reducers are mostly
long-chain polyacrylamide-based (PAM) polymers Usually friction reducers are added to
water-based fracturing fluids to hydrate ldquoon the flyrdquo as water in oil emulsions (Wu et al
2013 Tomson et al 2017) Most water-soluble polymeric friction reducers have high
molecular weight (normally over 10 M) polymers Sun et al (2011) The primary function
of friction reducers is to change turbulent flow to laminar flow by reducing frictional loss
by 70-80 while pumping fracturing fluids (Tomson et al 2017 Sun et al 2011 White
and Mungal 2008)
Both academic research and industrial implementation have demonstrated the
success of friction reducers within and outside the oil industry Aften et al (2014) Because
of the ability of friction reducers to flocculate solids in liquid phase PAM polymers have
been used extensively in water treatment In the oil and gas industry PAM has primarily
been used in a variety of applications including enhanced oil recovery (EOR) acid gelling
agents clay control during drilling and hydraulic fracturing These applications require
flexibility and simplicity of PAMs stability under harsh conditions such as high reservoir
temperatures and high salinity waters (Ryles et al 1986 StimLab 2012 Clark et al 1976)
Research continues developing improved hydraulic fracturing fluids to lessen the
problems associated with current fracturing fluids like guar-based gels and slickwater
Slickwater fracturing fluids have low concentrations of friction reducers falling between
05 and 2 gallons per thousand gallon (gpt) (Rodvelt et al 2015 Ifejika et al 2017) HVFR
fluids can replace slickwater by minimizing proppant pack damage and can carry the same
8
amount of proppant as linear gel or better with less formation damage (Ba Geri et al
2019b Kunshin et al 2018) Figure 1 shows that HVFRs can have better proppant transport
capability along fractures compared to slickwater with friction reducer additives
Figure 1 Visualization of proppant transport using friction reducer and high-viscosity
friction reducers (slbcombroadband)
The objectives of this critical review study are to provide better understanding of
the advanced technologies of using high-viscosity friction reducers including capability of
carrying proppant reducing water and chemical requirements compatibility with produced
water and environmental benefits in hydraulic fracturing treatments The goal also is to
statistically analyze the main associated factors with HVFRs such as concentration
temperature viscosity and breakability
9
2 DESCRIPTION OF FRICTION REDUCERS AND HIGH-VISCOUS
FRICTION REDUCERS
Friction reducers are typically long-chain polyacrylamides (PAM) in dry powder
and liquid forms that can be added in the concentration range from 05 to 2 gpt to water to
make slickwater PAMs for unconventional reservoirs can be classified into three main
categories (see Figure 2) anionic nonionic and cationic Hashmi et al (2014) They may
also be classified as hydrophobic and amphoteric Tomson et al (2017) An anionic nature
for most friction reducers is obtained from 30 mole acrylic acid co-polymers The
maximum reduction of friction reducers can be obtained by dissolving the polymer into
aqueous solution to become fully inverted before injected as fracturing fluid Friction
reducers have high dissolvability level in water a high viscosity and sufficient energy loss
reduction
Figure 2 Friction reducers types
The most common friction reducer is anionic due to its lower cost and better drag
reduction Chung et al (2014) Water salinity and quality are the two main factors that
determine the effectiveness of friction reducers Drag reduction of friction reducers rely on
their backbone flexibility and radius of gyration (molecular size) Drag reduction decreases
by increasing the molecular weight or size In freshwater the friction reducers have large
10
radius of gyration which increases in the friction reducers performance The same amount
of friction reducers in produced water has small gyration radius so increased FR
concentration is needed to attain the same drag reduction level in high TDS water (Chung
et al 2014 Rimassa et al 2009 Shah et al 2018) Lastly less friction reduction can be
provided by uncharged (non-ionic) friction reducers than charged ones (Ozuruigbo et al
2014 Chung et al 2014)
Using polymers in oil field applications has evolved and expanded from acid
gelling agents drilling operations and EOR applications to fracturing fluid systems that
are carefully designed to have optimum characteristics To achieve these characteristics
different chemical structure forms have been developed to fit the designed purpose of each
case In addition the chemistry of the water that is used in hydraulic fracturing
treatmentsmdashand particularly its salinitymdashare two main factors considered during friction
reducer selection As presented in Figure 3 the most prevalent friction reducers used in the
oil and gas industry are polyacrylamide- (PAM-) based polymers acrylamido-methyl-
propane sulfonate polymer (AMPS) polyacrylic acid (PAAc) and hydrolyzed
polyacrylamide (PHPA) Montgomery (2013) Their structural forms are as shown in
Figure 3
There are also many forms of the friction reducer that can be delivered to the field
application The most popular forms are the liquid inverse emulsion and dried In addition
to these polymers other types of friction reducers are viscoelastic surfactants dispersion
polymers fibers metal complexed surfactants and various microscopic structures Aften
et al (2014)
11
The inclusion of a friction reducer is one of the main components of slickwater
fracture fluids and other stimulation fluids The primary function of friction reducers is
changing turbulent flow to laminar flow which can reduce frictional loss during pumping
fracturing fluids up to 80 Recently high-viscosity friction reducers (HVFRs) have
gaining popularity as drilling and hydraulic fracturing fluids because the HVFRs exhibit
numerous advantages such as the following
Figure 3 Chemical structure of various friction reduction (FR) agents and
a comparison of friction pressure for water containing only 2 KCl vs water containing
2 KCl and 2 gallons per 1000 gallons (FR) and 10 Guar pumped down 4 frac12rdquo 115 4rdquo
ID casing (Montgomery 2013)
bull Reduced pipe friction during fracturing treatments
bull High regain conductivities compared to linear and crosslinked gels
bull Lower operational cost
o Uses less water compared to conventional slickwater treatments
o Consumes 33-48 less chemicals
o Requires less equipment on location
o Requires less number of tanks trucks in the field
bull More fracture complexity using a less viscous fluid system
bull Better hydrocarbon production results compare to or greater than other fluids
12
bull Improved flexibility to design treatments that balance technical economic and
operational goals
bull Reduced freshwater proppant and equipment requirements compared with
conventional fluid systems
bull Minimized environmental footprint with selection of engineered additives
bull Simplified operations by reduced screen out risks
In order to make a successful hydraulic fracturing treatment the fracking fluid
selection process is a significant step in these ultra-low permeability reservoirs The
ultimate purpose of the fracturing fluid is to induce a complex network fracture system and
to have the capability of carrying proper amount of proppant deeply into the fractures
Essentially fluid selection and proppant placement are key to the hydraulic fracturing
process The ultimate success of the fluid selection process depends primarily on the length
of the fracture achieved and proppant distribution and placement in fracks Thus
understanding fluid properties and performance such as its composition ability to create
fractures ability to carry and transport proppant deep into the fracture and ease to flowback
with minimal damage through production from shale formations is the key to a crucial
successful fracking fluid and treatment Ideally the HVFRs should have the following
physical characterization to achieve the ultimate performance as fracturing fluids (Sareen
et al 2014 Ke et al 2006 Carman et al 2007 Aften et al 2010)
1 The polymer should have good dispersion or solubility in various aqueous
phases
2 Compatible with other fracturing fluids additives eg clay stabilizer
3 Should be less shear sensitive
13
4 Quick to hydrate in fluid ldquoon-the-flyrdquo
5 Compatible with high TDS and hardness
6 Easy to break and clean up
7 Good thermal stability and
8 Low environmental impact
3 LABORATORY AND FIELD STUDIES USING HVFR
This work analyzes data collected from more than 26 field case studies that
implemented High-viscosity friction reducers in unconventional reservoirs For example
in the Permian basin four different case studies were applied using HVFR successfully
which represent 16 of case study distribution of using HVFRs in North America The
main findings of each case are highlighted in Figure 4
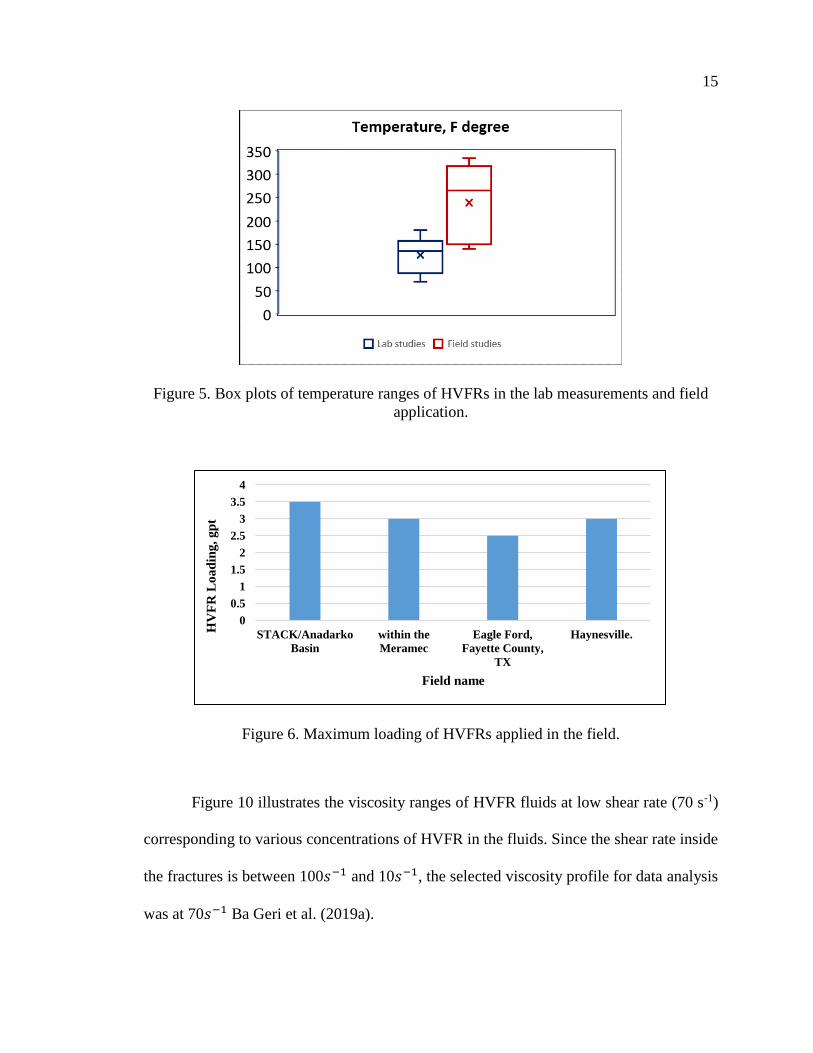
31 DATA ANALYSIS OF USING HVFRS AT FIELD AND LAB CONDITIONS
Figure 5 shows the temperature ranges for lab and field conditions HVFRrsquos were
tested at minimum temperatures of 70 in the lab and 140 at field conditions The
reported data also showed that HVFRrsquos were tested at maximum temperature of 180 in
the lab and 335 in field studies
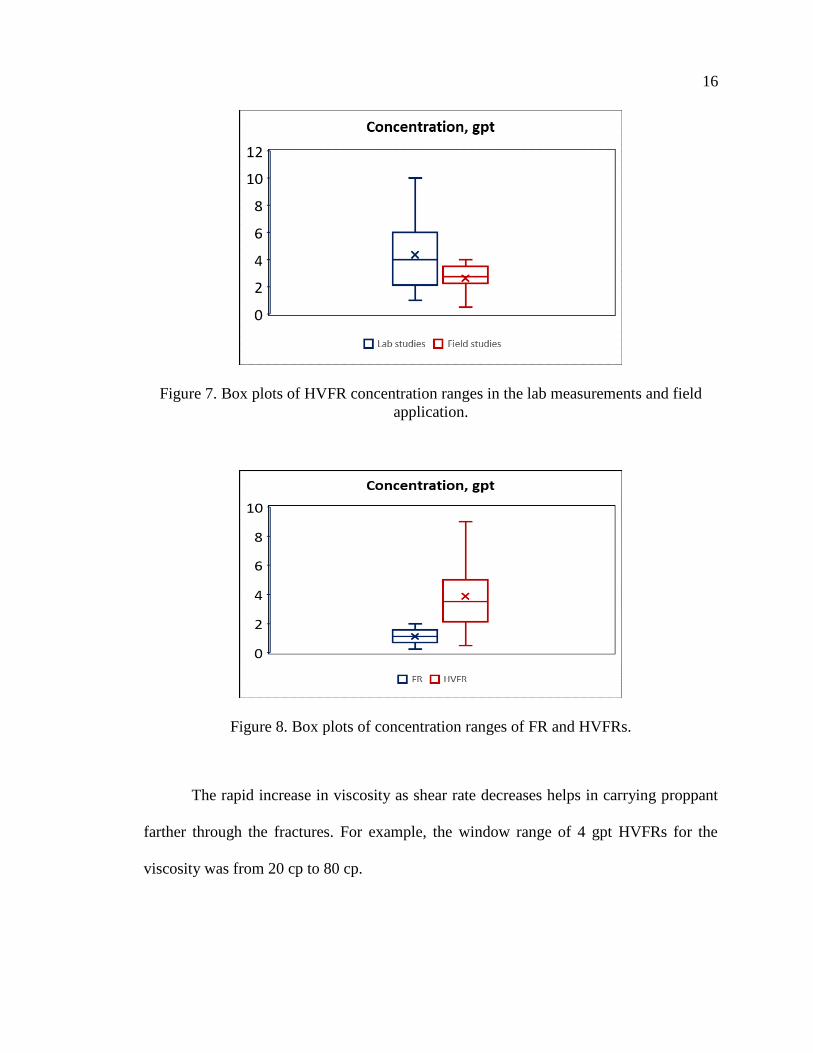
Figure 6 shows the HVFR concentration range used in hydraulic fracture treatment
in different US basins (Van Domelen et al 2017 Hu et al 2018) The collected data show
that HVFR concentration ranged were from 25 gpt to 35 gpt
14
Figure 4 Field case studies distribution of using HVFRs in North America
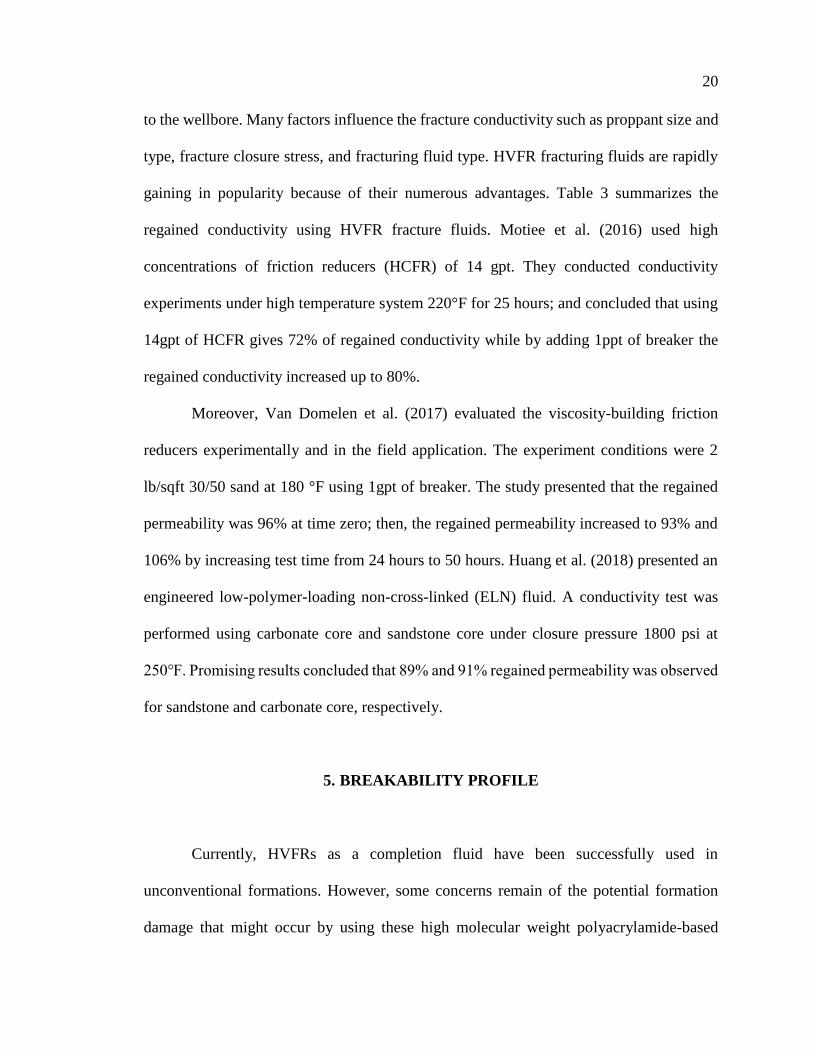
Figure 7 reports the concentration distributions of HVFRs in lab evaluation and
field application The lab test covers a wide HVFR concentration ranges from 1gpt to
10gpt while the field applications have an HVFR concentration range between 05 gpt and
4 gpt
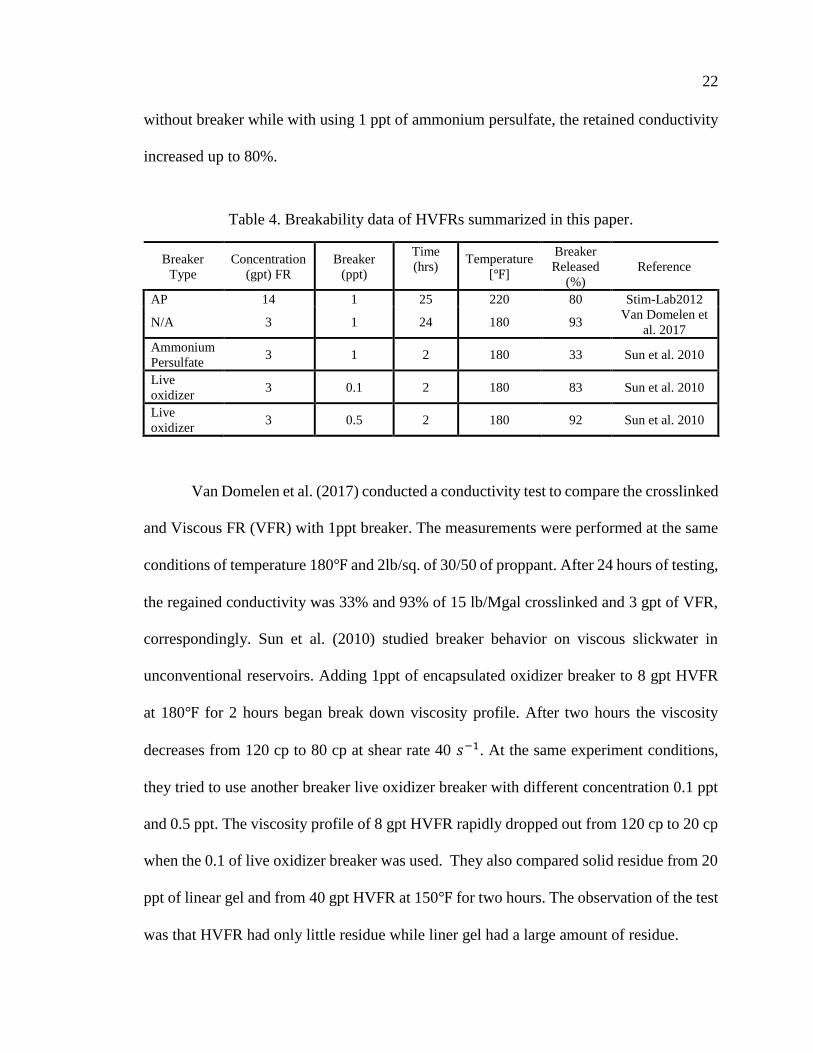
32 FRICTION REDUCER AS ADDITIVES VS AS A HVFR FRACTURE FLUID
Figure 8 presents the low concentrations of friction reducers used only as fluid
additives versus their higher concentration used as a key ingredient in HVFR-based
fracture fluids Friction reducers as an additive cover a small range from 05 gpt to 2 gpt
while as HVFRs covered a large range from 1 gpt to 10 gpt
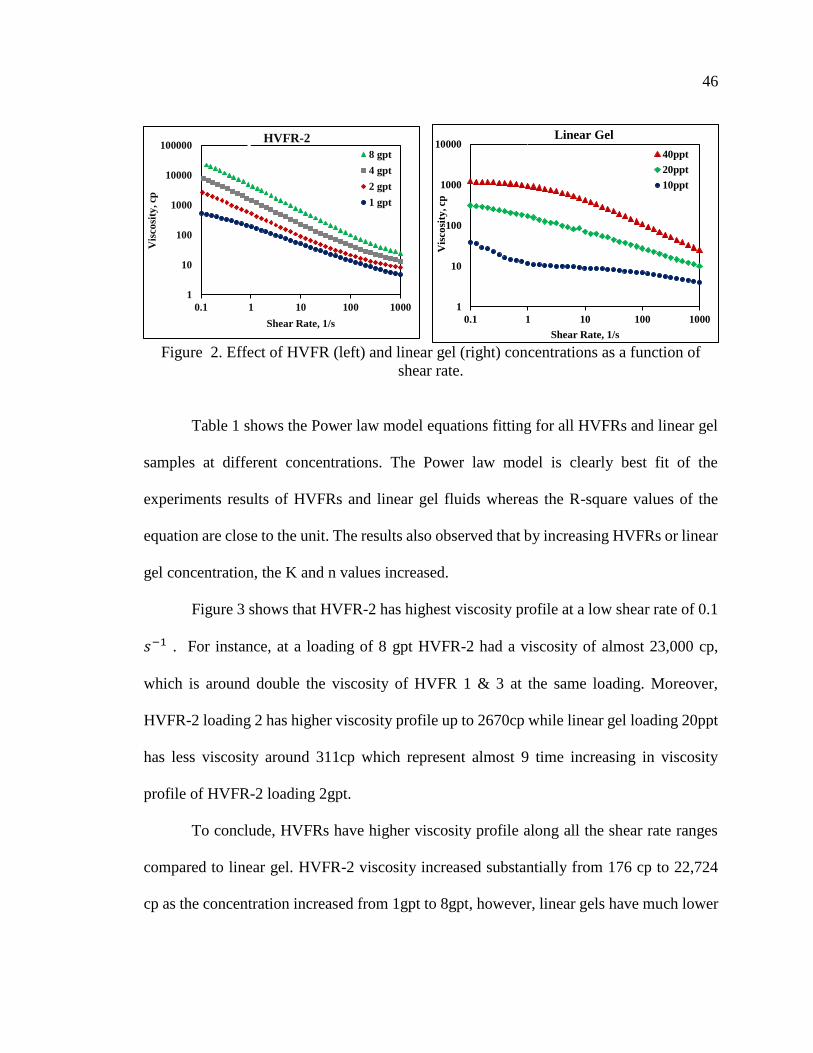
Figure 9 reveals the viscosity ranges of HVFR fluids at high shear rate (511119904minus1)
corresponding to various concentrations of HVFR in the fluids HVFRrsquos at 8 gpt can have
viscosities as high as 54 cp whereas at low concentrations such as 2gpt of HVFR the
typical viscosity ranges were from 7 to 15 cp
15
Figure 5 Box plots of temperature ranges of HVFRs in the lab measurements and field
application
Figure 6 Maximum loading of HVFRs applied in the field
Figure 10 illustrates the viscosity ranges of HVFR fluids at low shear rate (70 s-1)
corresponding to various concentrations of HVFR in the fluids Since the shear rate inside
the fractures is between 100119904minus1 and 10119904minus1 the selected viscosity profile for data analysis
was at 70119904minus1 Ba Geri et al (2019a)
0
05
1
15
2
25
3
35
4
STACKAnadarko
Basin
within the
Meramec
Eagle Ford
Fayette County
TX
Haynesville
HV
FR
Lo
ad
ing
g
pt
Field name
16
Figure 7 Box plots of HVFR concentration ranges in the lab measurements and field
application
Figure 8 Box plots of concentration ranges of FR and HVFRs
The rapid increase in viscosity as shear rate decreases helps in carrying proppant
farther through the fractures For example the window range of 4 gpt HVFRs for the
viscosity was from 20 cp to 80 cp
17
Figure 9 Box plots of viscosity ranges of HVFRs at high shear rate 511 119904minus1
Table 1 summarizes the extracted viscosity data of HVFRs The viscosity profile
of HVFRs depends on many factors including polymer concentration shear rate time
solvent properties and temperature Aften et al (2014) Increasing temperature from 70
to 180 decreases the viscosity from 40 cp to 30 cp Motiee et al (2016) Decreasing
HVFR concentration from 8 gpt to 2 gpt can reduce the viscosity by 75 (from 40 cp to
10 cp at the same shear rate and temperature conditions) Kunshin et al (2018) A thermal
study of high concentration 8 gpt of HVFRs was studied by Ba Geri et al (2019) The study
observed that increase HFVR temperature from 77 to 176 decreased the HVFR
viscosity profile from 33 cp to 13 cp respectively
18
Figure 10 Box plots of viscosity ranges of HVFRs at low shear rate 70 119904minus1
33 SCREENING CRITERIA GUIDELINES FOR HVFRS
Table 2 provides screening guidelines for HVFRs in terms of fluid concentration
and viscosity The range of each property used in the lab measurements and field
application is reported for more successful treatment The concentration of HVFRs is a
significant parameter for the selection process The maximum concentration of HVFRs
was 10 gpt and 4 gpt in the laboratory and field application respectively Several factors
control the concentration selection such as water source high TDS and formation damage
so in the field trials 4 gpt was the maximum In addition the temperature effect was also
investigated in this paper The maximum temperature was 180 and 335 in laboratory
and field application respectively Increasing the temperature lowered the HVFR viscosity
profile due to the thermal degradation of the fluid
19
Table 1 Summary of viscosity data of HVFRs reviewed in this paper
Measurement Conditions
HVFRs Concentration
(gpt)
Temperature
[]
Shear Rate
(119904119890119888minus1)
Viscosity
(cp) Reference
HCFR 10 70 511 40 Motiee et al 2016
HCFR 2 70 511 7 Motiee et al 2016
HCFR 6 70 150 40 Motiee et al 2016
HCFR 6 180 150 30 Motiee et al 2016
HVFR 45 NA 511 165 Hu et al 2018
HVFR 225 NA 511 102 Dahlgren et al 2018
HVFR 4 200 50 17 Dahlgren et al 2018
HVFR 2 200 50 5 Dahlgren et al 2018
HVFR 8 70 511 40 Kunshin et al 2018
HVFR 2 70 511 10 Kunshin et al 2018
HVFR 8 77 511 33 Ba Geri et al 2019b
HVFR 8 176 511 13 Ba Geri et al 2019b
Table 2 High viscosity friction reducers concentration gpt
Minimum Maximum Mean Median Standard Deviation
Laboratory 1 10 436 4 225
Field 05 4 263 275 087
High Viscosity Friction Reducers Temperature
Minimum Maximum Mean Median Standard Deviation
Laboratory 70 180 1267 135 275
Field 140 335 2393 158 487
4 CONDUCTIVITY PROFILE
Achieving high fracture conductivity is a primary goal of hydraulic fracturing
treatment because these conductive channels enable flow of oil and gas from the formation
20
to the wellbore Many factors influence the fracture conductivity such as proppant size and
type fracture closure stress and fracturing fluid type HVFR fracturing fluids are rapidly
gaining in popularity because of their numerous advantages Table 3 summarizes the
regained conductivity using HVFR fracture fluids Motiee et al (2016) used high
concentrations of friction reducers (HCFR) of 14 gpt They conducted conductivity
experiments under high temperature system 220degF for 25 hours and concluded that using
14gpt of HCFR gives 72 of regained conductivity while by adding 1ppt of breaker the
regained conductivity increased up to 80
Moreover Van Domelen et al (2017) evaluated the viscosity-building friction
reducers experimentally and in the field application The experiment conditions were 2
lbsqft 3050 sand at 180 degF using 1gpt of breaker The study presented that the regained
permeability was 96 at time zero then the regained permeability increased to 93 and
106 by increasing test time from 24 hours to 50 hours Huang et al (2018) presented an
engineered low-polymer-loading non-cross-linked (ELN) fluid A conductivity test was
performed using carbonate core and sandstone core under closure pressure 1800 psi at
250 Promising results concluded that 89 and 91 regained permeability was observed
for sandstone and carbonate core respectively
5 BREAKABILITY PROFILE
Currently HVFRs as a completion fluid have been successfully used in
unconventional formations However some concerns remain of the potential formation
damage that might occur by using these high molecular weight polyacrylamide-based
21
fluids Therefore to address these concerns different types of breaker system are required
to eliminate or minimize the possible damage to fracturing treatment (Kern 1962 Brannon
and Ault 1991 Economides and Nolte 2000)
Table 3 Fracture conductivity data of HVFRs reported in this paper
HVFRs
Type
Concentration
(gpt)
Breaker
(gpt)
Closure
Stress
(psi)
Shut-
in
Time
(hrs)
Temperature
[]
Regained
Conductivity
() Reference
HCFR 14 NB 2000
25 220
72 Motiee et al
2016
HCFR 14 1 2000 25 220 80
VFR 3 1 2000
24 180
93 Van Domelen et
al 2017
VFR 3 1 2000 50 180 106
ELN NA NA 1800
NA 250
91 Huang et al
2018
Degradation of polyacrylamide can occur biologically and chemically Various
types of breakers such as oxidative breakers are commonly used to break the polymers and
reduce their viscosity The chemical reaction of the breaker is controlled by several factors
such as breaker dosage temperature and composition of the fluid breaker chemistry
polymer concentration and pH Table 4 summarizes the work that has been performed for
evaluating the breakability profile after using HVFR fracture fluids Stim-Lab (2012)
investigated using high loading (14 gpt) of HVFRs with and without breaker on retained
conductivity compared to linear gel 30 ppt At the same lab conditions temperature 220
closure pressure 2000 psi and test time 25 hours retained conductivity present was 72
22
without breaker while with using 1 ppt of ammonium persulfate the retained conductivity
increased up to 80
Table 4 Breakability data of HVFRs summarized in this paper
Breaker
Type
Concentration
(gpt) FR
Breaker
(ppt)
Time
(hrs) Temperature
[]
Breaker
Released
()
Reference
AP 14 1 25 220 80 Stim-Lab2012
NA 3 1 24 180 93 Van Domelen et
al 2017
Ammonium
Persulfate 3 1 2 180 33 Sun et al 2010
Live
oxidizer 3 01 2 180 83 Sun et al 2010
Live
oxidizer 3 05 2 180 92 Sun et al 2010
Van Domelen et al (2017) conducted a conductivity test to compare the crosslinked
and Viscous FR (VFR) with 1ppt breaker The measurements were performed at the same
conditions of temperature 180 and 2lbsq of 3050 of proppant After 24 hours of testing
the regained conductivity was 33 and 93 of 15 lbMgal crosslinked and 3 gpt of VFR
correspondingly Sun et al (2010) studied breaker behavior on viscous slickwater in
unconventional reservoirs Adding 1ppt of encapsulated oxidizer breaker to 8 gpt HVFR
at 180 for 2 hours began break down viscosity profile After two hours the viscosity
decreases from 120 cp to 80 cp at shear rate 40 119904minus1 At the same experiment conditions
they tried to use another breaker live oxidizer breaker with different concentration 01 ppt
and 05 ppt The viscosity profile of 8 gpt HVFR rapidly dropped out from 120 cp to 20 cp
when the 01 of live oxidizer breaker was used They also compared solid residue from 20
ppt of linear gel and from 40 gpt HVFR at 150 for two hours The observation of the test
was that HVFR had only little residue while liner gel had a large amount of residue
23
6 PRODUCED WATER WITH HVFRS
Slickwater fracture fluid has been proven as one of the best fracture fluids in terms
of high fracture length and low cost However government regulations have increased due
to large amounts of water consumption in hydraulic fracturing techniques to increase the
productivity of shale rocks According to the US Environmental Protection Agency (EPA)
the hydraulic fracturing operations require between 70 and 140 billion gallons of water
annually in the United States alone (API 2017) Therefore using produced water instead
of fresh water is gaining traction to minimize water usage reduce environmental impacts
and increase hydrocarbon recovery from unconventional formations However generally
polymer friction reducers perform more poorly in high salinity waters High salinity
produced waters are more common in the Marcellus and the Bakken basins with high TDS
ranging fro7m 30000 to 50000ppm and over 225000 mgl respectively Almuntashri
(2014) noted that produced water contains solid suspension and bacteria these bacteria
generate enzymes that degrade the polymer viscosity significantly
Sareen et al (2014) developed a friction reducer (Table 5) compatible with high-
salinity produced water used with slickwater in hydraulic fracturing treatments The case
study in Delaware basin reported that the friction reducer was compatible with produced
water containing over 250000 ppm TDS and 90000 ppm total hardness The maximum
concentration of friction reducer was 15 gpt and the bottomhole temperature was 136
The application was implemented in 17-stages with significant 40 reduction on the
amount of proppant increasing the oil production by 50 and 20increase of gas
production compared to conventional friction reducer
24
Table 5 Chemical composition of produced water in Delaware basin (Sareen et al 2014)
Specific gravity 12 pH 602
Temperature 70
Cations ppm Anions ppm
Sodium 73978 Chloride 149750
Calcium 12313 Sulfates 250
Soluble Iron (Fe) 10 Bicarbonates 61
Magnesium 4992
Total Hardness 51781 ppm (CaCO3)
Total Dissolved Solids 241354 ppm
Calcium Carbonate Index 1083360
Calcium Sulfate Index 4440000
Table 6 summarizes the work that has been performed to evaluate using produced
water with HVFRs Sareen et al (2014) presented an experimental study on HFVRs in
fresh water and salt water with HVFR varying from 1 to 6 gpt A variety of HVFR systems
were tested including both anionic and cationic HVFRs with surfactants They examined
their viscosity profile and settling velocity measurements The study concluded that
surfactant and polymer type systems play a key role in the viscosity-shear rate profile
Sanders et al (2016) presented field trials using dry friction reducer (DFR) in the
Fayetteville shale with produced water having approximately 10000 ppm TDS The DFR
provided a better placement of proppant and has more advantages compared to gel-based
systems in terms of environmental effect and logistical costs Johnson et al (2018) reported
successful case studies implemented in Marcellus and Bakken shale using high-brine
viscosity-building friction reducer (HBVB) in high brine produced water The TDS in
Marcellus formation was in the range of 30000 to 50000 ppm Lab measurements were
performed to HBVB at shear rate 50 119904minus1 The viscosity profile of HBVB loading 5 gpt at
50 119904minus1 was 45 cp and decreased to 12 cp in fresh water and produced water
25
correspondingly In Marcellus shale HBVB is used in the field to replace guar-based
systems HBVB has better performance results in lab measurements and field applications
Moreover seven different types of friction reducers were selected to apply in the Bakken
field in North Dakota six of them did not work well because they were not compatible
with the produced water The seventh one was successfully used with loading from 15 gpt
to 36 gpt HBVB Six stages of that well were treated by HBVB product with effective
carrying proppant concentration up to 3 ppa
To conclude utilizing produced water for hydraulic fracturing in the oil and gas
industry is gaining popularity because using produced water leads to operational cost
savings and has environmental benefits However compatibility of the friction reducers
with the various types of produced water requires different test protocols
Table 6 Produced water TDS used with HVFRs
HVFRs
Loading
(gpt)
Temperature
()
Produced
water TDS
(ppm)
Produced
water total
hardness
(ppm)
Findings References
15 136 240000 50000
50 oil production
increase 40 less
proppant
Sareen et al
2014
075 175 10000 NA Better placement of
proppant
Sanders et al
2016
358 NA 50000 NA Significant cost
reduction
Johnson et al
2018
26
7 ECONOMIC ANALYSIS
Several successful field case studies were adopted using HVFRs as an alternative
for conventional hydraulic fracturing fluids They addressed clearly the main concern of
the HVFR systems which is its capability to carry a sufficient amount of proppant with
less formation damage Hu et al (2018) In 2012 Stim-Lab performed an extensive
investigation about regained conductivity using high concentration (14 gpt) of HVFRs
compared to 30 ppt linear gel fluid Superior results from the evaluation test shows that 14
gpt can regain conductivity up to 80 Dahlgren et al (2018) reported economics cost
evolution in the STACK play using three case studies In cases 1 and 2 the fracturing fluid
system was changed from a hybrid system to HVFR with max proppant concentration of 5
ppg Moreover in Case 3 HVFR was used for around 32 stages with successful chemical
cost reduction about 38 Due to the fast hydration process and fewer chemicals used the
chemical cost savings that used on case 1 2 and 3 were 32 33 and 38 respectively
Figure 11 presents the chemical cost reduction of using HVFRs during hydraulic fracturing
applications In the Utica plays the cost reduction reached almost 80 compared with
previous hydraulic fluids
Furthermore using HVFRs provided promising results in production
improvements as shown in Figure 12 The Eagle Ford Haynesville and Utica reported
over 60 improvement in hydrocarbon production while around 30 increasing in oil
production occurred in the STACK play
27
Figure 11 Chemical cost reduction of using HVFRs from different case studies
Dahlgren et al (2018) showed case studies of using HVFRs in the STACK play
Interestingly one of these two compared wells completed identically in fracturing design
Well 1 was treated with hybrid guar-based fluid system consisting of 18 linear gel and
18 crosslinked Well 2 used HVFR starting with 5 gpt and end up the fracture treatment
by 3 gpt of HVFR All the other parameters were the same in both stimulation process in
Well 1 and Well 2 as shown in Table 8 The field results showed over 30 improvement
in production and 32 reduction of chemical cost in Well 2 where HVFR was used
compared to using guar-based fluids in Well 1
Using fewer chemicals during hydraulic fracturing treatment improves well
economics Motiee et al (2016) present a case study about the operational cost reduction
using HVFRrsquos compared to crosslinked fluid systems
0102030405060708090
100
Co
st r
ed
uct
ion
Field or basin name
28
Figure 12 Production improvement of using HVFRs from different case studies
The data results reported that the average reduction ranged from 33 to 48 of the
chemical volume used in fracturing treatment as well as 22 average reduction on fluid
cost as shown in Figure 13
Another logistic of cost reduction is the fracturing fluids material themselves
Earthstone Energy Inc reported several case studies replacing crosslinked or hybrid
system with HVFRs where the average completion cost was reduced by 35 and the
charge in pump pressure decreased by 17 Since the characterization nature of HVFRs
has rapid solubility on water HVFRs hydrate quickly ldquoon-the-flyrdquo Therefore hydration
unit is not required in the field which helps to save cost as well Van Domelen et al (2017)
0102030405060708090
100
Pro
du
ctio
n I
mp
rov
men
t
Field or basin name
29
Table 7 Stimulation summary of case study (Dahlgren et al 2018)
SW
MBL
HVFR
MBL
18
LIN
MBL
18 XL
MBL
TOTAL
FLUID MBL
100
MESH
MM
4070
MM
TOTAL
PROP MM
Well 1 243 0 21 41 3054 47 76 123
Well 2 251 56 0 0 3073 47 76 123
Figure 13 Chemical cost comparison for standard Bakken system (Motiee et al 2016)
8 CONCLUSIONS
This study provides a comprehensive review on using high viscous friction reducers
as a potential alternative for conventional fracture fluid Potential advantages of using
HVFRs over other fracture fluids were discussed Results for laboratory and successful
field studies that used HVFR were also analyzed and presented The following conclusions
can be drawn from this work
30
bull Screening criteria for using HVFRs were presented to understand the optimum
selection of HVFRs HVFR concentration and temperature are the main factors that
influence the viscosity profile of HVFRs The median used of these factors in the
field application was 275 gpt and 158 for the HVFR concentration and
temperature respectively
bull Successful field case studies and lab measurements discussed the use of HVFRs as
an alternative fracturing fluid system to the conventional fracturing fluids (eg
linear gel system)
bull Numerous advantages of using HVFRs are reported including the ability of carrying
proppant less formation damage and reduction in chemical cost and water usage
bull High viscous friction reducers using produced water showed promising results but
more investigation with different produced water composition is still required
bull High viscous friction reducers showed improvement on the hydrocarbon
production in many filed case studies reaching over 70 improvement
REFERENCES
Aften C W (2010 January 1) Study of Friction Reducers For Recycled Stimulation
Fluids In Environmentally Sensitive Regions Society of Petroleum Engineers
httpsdoi102118138984-MS
Aften C W (2014 October 21) Friction Reducers Fresh Rheological Insights Married to
Performance Society of Petroleum Engineers httpsdoi102118171025-MS
Al-Khaldy M D Dutta A Goswami B Al-Rashidi` A Rondon L J Warrakey M
amp Abdel Samie M A (2014 November 10) First-Ever Level 4 Multilateral Well
in North Kuwait Successfully Completed Improves Oil Production Society of
Petroleum Engineers httpsdoi102118171792-MS
31
Al-Muntasheri G A (2014 April 17) A Critical Review of Hydraulic Fracturing Fluids
over the Last Decade Society of Petroleum Engineers httpsdoi102118169552-
MS
API A P (nd) Energy and Opportunity Retrieved April 10 2017 from
httpwwwhydraulicfracturingcomsection=energy-and-opportunity
Ba Geri M Imqam A amp Suhail M (2019a March 19) Investigate Proppant Transport
with Varying Perforation Density and Its Impact on Proppant Dune Development
Inside Hydraulic Fractures Society of Petroleum Engineers httpsdoi102118
195018-MS
Ba Geri M Imqam A Bogdan A Shen L (2019b April 9) Investigate the Rheological
Behavior of High Viscosity Friction Reducer Fracture Fluid and Its impact on
Proppant Static Settling Velocity Society of Petroleum Engineers
httpsdoi102118195227-MS
Brannon H D amp Ault M G (1991 January 1) New Delayed Borate-Crosslinked Fluid
Provides Improved Fracture Conductivity in High-Temperature Applications
Carman P S amp Cawiezel K (2007 January 1) Successful Breaker Optimization for
Polyacrylamide Friction Reducers Used in Slickwater Fracturing Society of
Petroleum Engineers httpsdoi102118106162-MS
Castro-Vera E Chuc E A Gutierrez L amp Sanchez A (2015 October 26)
Implementation of Low-Residue Polysaccharide Fracturing Fluid System Aids
Flowback Recovery at Chicontepec Basin Field Experiences on Sandstone Tight-
Oil Wells Society of Petroleum Engineers httpsdoi102118176722-MS
Chung H C Hu T Ye X amp Maxey J E (2014 October 27) A Friction Reducer Self-
Cleaning to Enhance Conductivity for Hydraulic Fracturing Society of Petroleum
Engineers httpsdoi102118170602-MS
Clark R K Scheuerman R F Rath H amp Van Laar H G (1976 June 1)
PolyacrylamidePotassium-Chloride Mud for Drilling Water-Sensitive Shales
Society of Petroleum Engineers httpsdoi1021185514-PA
Cooke C E (1975 October 1) Effect of Fracturing Fluids on Fracture Conductivity
Society of Petroleum Engineers httpsdoi1021185114-PA
Dahlgren K Green B Williams B Inscore J Domelen M V amp Fenton A (2018
January 23) Case Studies of High Viscosity Friction Reducers HVFR in the
STACK Play Society of Petroleum Engineers httpsdoi102118189893-MS
32
Economides MJ and Nolte KG 2000 Reservoir Stimulation Third Edition John Wiley
amp Sons
Hashmi G Kabir C S amp Hasan A R (2014 October 27) Interpretation of Cleanup
Data in Gas-Well Testing From Derived Rates Society of Petroleum Engineers
httpsdoi102118170603-MS
httpswwwslbcom-mediaFilesstimulationengineered-fracturing-fluidspdf
Hu Y T Fisher D Kurian P amp Calaway R (2018 January 23) Proppant Transport
by a High Viscosity Friction Reducer Society of Petroleum Engineers
httpsdoi102118189841-MS
Huang J Perez O Huang T Safari R amp Fragachan F E (2018 October 16) Using
Engineered Low Viscosity Fluid in Hydraulic Fracturing to Enhance Proppant
Placement Society of Petroleum Engineers httpsdoi102118191395-18IHFT-
MS
Ifejika E De Cumont B amp Kashani N (2017 January 24) Optimum Production
Metrics to Predict Unconventional Wellamp39s Long-term Performance Society
of Petroleum Engineers httpsdoi102118184817-MS
Johnson M Winkler A Aften C Sullivan P Hill W A amp VanGilder C (2018
October 5) Successful Implementation of High Viscosity Friction Reducer in
Marcellus Shale Stimulation Society of Petroleum Engineers
httpsdoi102118191774-18ERM-MS
Ke M Qu Q Stevens R F Bracksieck N E Price C R amp Copeland D L (2006
January 1) Evaluation of Friction Reducers for High-Density Brines and Their
Application in Coiled Tubing at High Temperatures Society of Petroleum
Engineers httpsdoi102118103037-MS
Kern LR 1962 Method and Composition for Formation Fracturing US Patent No 3
058 909
Kunshin A amp Dvoynikov M (2018 October 15) Design and Process Engineering of
Slotted Liner Running in Extended Reach Drilling Wells Society of Petroleum
Engineers httpsdoi102118191520-18RPTC-MS
Li L Saini R amp Mai N (2018 September 24) High-TDS Produced Water-Based Low-
Damaging Fracturing Fluids for Applications at 300degF or Higher Society of
Petroleum Engineers httpsdoi102118191749-MS
33
Li L Sun H Qu Q Le H V Ault M Zhou J hellip Smith D (2014 October 27)
High-Temperature Fracturing Fluids Prepared with Extremely High-TDS and Hard
Produced Water Society of Petroleum Engineers httpsdoi102118170607-MS
Montgomery C (2013 May 20) Fracturing FluidltbrgtComponents International Society
for Rock Mechanics and Rock Engineering
Motiee M Johnson M Ward B Gradl C McKimmy M amp Meeheib J (2016
February 1) High Concentration Polyacrylamide-Based Friction Reducer Used as
a Direct Substitute for Guar-Based Borate Crosslinked Fluid in Fracturing
Operations Society of Petroleum Engineers httpsdoi102118179154-MS
Ozuruigbo C Q amp Fan C (2014 September 30) Influence of Friction Reducer on Scale
Inhibitor Performance and Scaling Tendency in Slickwater Fracturing Society of
Petroleum Engineers httpsdoi102118171661-MS
Rimassa S M Howard P amp Arnold M O (2009 January 1) Are You Buying Too
Much Friction Reducer Because of Your Biocide Society of Petroleum Engineers
httpsdoi102118119569-MS
Reddy B R (2013 April 8) Laboratory Characterization of Gel Filter Cake and
Development of Non-Oxidizing Gel Breakers for Zirconium Crosslinked
Fracturing Fluids Society of Petroleum Engineers httpsdoi102118164116-MS
Rodvelt G Yuyi S amp VanGilder C (2015 October 13) Use of a Salt-Tolerant Friction
Reducer Improves Production in Utica Completions Society of Petroleum
Engineers httpsdoi102118177296-MS
Sanders M Felling K Thomson S Wright S amp Thorpe R (2016 February 1) Dry
Polyacrylamide Friction Reducer Not Just for Slick Water Society of Petroleum
Engineers httpsdoi102118179146-MS
Sareen A Zhou M J Zaghmoot I Cruz C Sun H Qu Q amp Li L (2014 December
10) Successful Slickwater Fracturing in Ultrahigh TDS Produced Water by Novel
Environmentally Preferred Friction Reducer International Petroleum Technology
Conference httpsdoi102523IPTC-17824-MS
Shah S Asadi M Wheeler R Brannon H Kakadjian S Ainley B hellip Archacki D
(2018 February 7) Methodology for Evaluating Drag Reduction Characteristics of
Friction Reducer Society of Petroleum Engineers httpsdoi102118189537-MS
STIM-LAB Proppant Consortium Report July 2012 Section 31 Friction Reducers used
in Slickwater Applications
34
Sun H Wood B Stevens R F Cutler J Qu Q amp Lu M (2011 January 1) A
Nondamaging Friction Reducer for Slickwater Frac Applications Society of
Petroleum Engineers httpsdoi102118139480-MS
Sun H Wood B Stevens R F Cutler J Qu Q amp Lu M (2011 January 1) A
Nondamaging Friction Reducer for Slickwater Frac Applications Society of
Petroleum Engineers httpsdoi102118139480-MS
Sun H Stevens R F Cutler J L Wood B Wheeler R S amp Qu Q (2010 January
1) A Novel Nondamaging Friction Reducer Development and Successful
Slickwater Frac Applications Society of Petroleum Engineers httpsdoi102118136806-MS
Tomson R C Guraieb P Graham S Yan C Ghorbani N Hanna T amp Cooper C
(2017 January 24) Development of a Universal Ranking for Friction Reducer
Performance Society of Petroleum Engineers httpsdoi102118184815-MS
Van Domelen M Cutrer W Collins S amp Ruegamer M (2017 March 27)
Applications of Viscosity-Building Friction Reducers as Fracturing Fluids Society
of Petroleum Engineers httpsdoi102118185084-MS
White C M and Mungal M G 2008 Mechanics and Prediction of Turbulent Drag
Reduction with Polymers Ann Rev Fluid Mech 40235-256
Wu Q Ma Y Sun Y amp Bai B (2013 March 23) The Flow Behavior of Friction
Reducer in Microchannels During Slickwater Fracturing Society of Petroleum
Engineers httpsdoi102118164476-MS
35
35
II INVESTIGATE THE RHEOLOGICAL BEHAVIOR OF HIGH VISCOSITY
FRICTION REDUCER FRACTURE FLUID AND ITS IMPACT ON
PROPPANT STATIC SETTLING VELOCITY
Mohammed Ba Geri1 Abdulmohsin Imqam1 Andrey Bogdan2 and Lingjuan Shen2
1 Deparment of Petroleum Engineering Missouri University of Science and Technology
Rolla MO 65409
2 BJ Services Tomball TX
ABSTRACT
The recent and rapid success of using high viscosity friction reducers (HVFRs) in
hydraulic fracturing treatments is due to several advantages over other fracture fluids (eg
linear gel) which include better proppant carrying capability induce more complex
fracture system network with higher fracture length and overall lower costs due to fewer
chemicals and less equipment on location However some concerns remain like how
HVFRs rheological properties can have impact on proppant transport into fractures The
objective of this study is to provide a comprehensive understanding of the influence the
rheological characterization of HVFRs have on proppant static settling velocity within
hydraulic fracturing process
To address these concerns comprehensive rheological tests including viscosity
profile elasticity profile and thermal stability were conducted for both HVFR and linear
gel In the steady shear-viscosity measurement viscosity behavior versus a wide range of
shear rates was studied Moreover the influence of elasticity was examined by performing
oscillatory-shear tests over the range of frequencies Normal stress was the other elasticity
36
factor examined to evaluate elastic properties Also the Weissenberg number was
calculated to determine the elastic to viscous forces Lastly quantitative and qualitative
measurements were carried out to study proppant settling velocity in the fluids made from
HVFRs and linear gel
The results of rheological measurement reveal that a lower concentration of HVFR-
2 loading at 2gpt has approximately more than 8 times the viscosity of linear gel loading
at 20ppt Elastic measurement exposes that generally HVFRs have a much higher
relaxation time compared to linear gel Interestingly the normal stress N1 of HVFR-2 2gpt
was over 3 times that of linear gel loading 20ppt This could conclude that linear gel
fracture fluids have weak elastic characterization compared to HVFR The results also
concluded that at 80 Co linear gel has a weak thermal stability while HVFR-2 loses its
properties only slightly with increasing temperature HVFR-2 showed better proppant
settling velocity relative to guar-based fluids The reduction on proppant settling velocity
exceed 75 when HVFR-2 loading at 2gpt was used compared to 20ppt of linear gel Even
though much work was performed to understand the proppant settling velocity not much
experimental work has investigated the HVFR behavior on the static proppant settling
velocity measurements This paper will provide a better understanding of the distinct
changes of the mechanical characterization on the HVFRs which could be used as guidance
for fracture engineers to design and select better high viscous friction reducers
37
1 INTRODUCTION
Over the last few recent years high viscosity friction reducers (HVFRs) have been
successfully used in the oil and gas industry across all premier shale plays in North America
including Permian Bakken and Eagle Ford (Van Domenlen et al 2017 Dahlgren et al
2018) Besides reducing friction HVFRs have also been used to suspend and carry
proppants farther into the fracturersquos networks Very recently the popularity of using
HVFRs in frac fluid has increased
A friction reducer is the main component of slick water fracture fluids and
stimulation technology packages The primary function of friction reducers is changing
turbulent flow to laminar flow by reducing friction by 70-80 while pumping fracturing
fluids (Schein 2005) Recently the oil industry started to use high viscosity friction
reducers (HVFRs) as a direct replacement for linear and crosslinked gels due to several
operational and economic reasons (Motiee et al 2016) High viscosity friction reducers
(HVFRs) have been used as fracturing fluids because of the advantages such as reducing
pipe friction during the fracturing process the high potential of placing more proppant
volumes compared to conventional hydraulic fluids system such as hybrid and crosslinked
creating complex fracture networks due to a less viscous system possible higher fracture
conductivity improved production results comparable as using liner gel or crosslinked
designs potentially lower costs due to fewer chemicals and less equipment on location
less environmental footprint and simplified hydraulic fracturing treatments by minimizing
screen out risks (Motiee et al 2016 Van Domenlen et al 2017 Dahlgren et al 2018 Ba
Geri et al 2019)
38
Both academic research and oil industrial implementation have shown promising
results of using high viscosity friction reducers Motiee et al 2016 studied high
concentration friction reducers (HCFR) as a direct substitute for guar-based crosslinked
fluid Different concentration of HCFR (2 4 6 and 8 gpt) were compared with 25 ppt
linear gel to study proppant settling velocity HCFR showed better proppant settling
velocity relative to guar-based fluids The results also concluded that at 180 25 ppt linear
gel has a weak thermal stability while HCFR only slight loses its properties Shen et al
2018 investigated rheological characterization of HVFRs and measured the settling
velocity of multi-particle proppant The results concluded that both the viscosity and
elasticity of HVFRs can affect the proppant carrying capacity during hydraulic fracturing
treatments
Hu et al 2018 addressed some concerns related to proppant transport capability
using HVFRs and linear gel Viscosity and elasticity measurements were examined to
compare HVFRs with linear gel They observed that at low shear rates HVFRs had higher
viscosity Also normal forces for linear gels are much lower than HVFRs with increased
shear rate Dahlgren et al 2018 identified three case studies in which STACK play replaced
traditional fracturing fluid with HVFR Viscosity-shear measurements were performed at
2 3 and 4 gpt HVFRs concentration with and without a breaker The study noticed that
the viscosity profile was negatively affected by breaker
Johnson et al 2018 presented a successful implementation of high brine friction
reducers (HBFRs) in high TDS water exceeding 60000TDS They observed that the
viscosity of HBFRs decreased with increased brines ranges Drylie et al 2018 conducted
viscosity measurements at a high shear rate of 511119904minus1and a low shear rate 001 119904minus1 for 1
39
and 6 gpt of HVFR and 24 ppt of guar The study noticed that at 1gpt of HVFR there was
no change in viscosity profile in contrast at a low shear rate HVFRs have a much higher
viscosity than guar Most pervious work investigated the rheological characterization of
HFVRs in low temperature conditions and did not consider that changes in rheological that
could happen at high pressure environment In addition there was not serious effort to
relate the effect of HVFR rheology on proppant settling velocity
This work presents a comprehensive investigation performed to compare linear gel
fracturing fluids with high viscosity friction reducers This paper investigated several major
factors including viscosity measurement profiles elasticity properties (Normal forces and
relaxation time) thermal stability profile and static settling velocities The question which
is the key factor the shear-viscosity or the elasticity of HVFRS governing the settling
velocity were also investigated by performing qualitative and quantitative of settling
velocity measurements of multi-particles and single particle proppant
2 PROPPANT STATIC SETTLING VELOCITY IN HYDRAULIC
FRACTURING
This study provides insights on the elastic and viscous properties of HVFR and
liner gel fluids Weissenberg number and elasticity to viscosity ratio are calculated to
measure the elastic properties of the fluids and to identify which rheological properties has
significant contribution to the proppant settling velocity (Broadbent and Mena 1974
Acharya et al 1981 Malhotra and Sharma 2012)
40
21 PARTICLE SHEAR RATE (ϔ)
Calculating apparent particle shear rate leads to overestimate or underestimate the
particle shear rate therefore determining the particle shear rate range within the Power
law model (K n) is an essential step to describe the shear thinning effect of the HVFRs
and linear gel fluids Equation 1 can be used to estimate the particle shear rate (Uhlherr et
al 1976 Shah et al 2007)
ϔ = 2 lowast 119881119904119889119901 (1)
where ϔ is the particle shear rate 119881119904 is the terminal settling velocity 119889119901 is the particle
diameter
22 APPARENT SHEAR VISCOSITY (120525119834)
Lali et al 1989 introduced Equation 2 to estimate the apparent shear viscosity
120583119886 = 119870ϔ119899minus1 (2)
where μ_a is the apparent shear viscosity K is the Consistency indexn is the flow
behavior index
23 WEISSENBERG NUMBER (119830119842)
To study viscoelastic fluid properties and fluid deformation degree Weissenberg
number should be measured Weissenberg dimensionless number can be defined as
follows
Wi =Elastic forces
Viscous forces= λ ϔ (3)
where Wi is the Weissenberg number λ is the relaxation time ϔ is the particle shear rate
41
24 ELASTICITY TO VISCOSITY RATIO (120524119838120534)
Viscoelastic fluids consist of two main properties (viscosity and elasticity) To
evaluate which property gives the greatest contribution during proppant transport Equation
4 was used to measure the elasticity to viscosity ratio (120582119890120592) (Shen et al 2018)
120582119890120592 =051205911198731(ϔ)
120578(ϔ) (4)
where λeυ is the elasticity to viscosity ratio 1198731(ϔ) is the first normal stress 120591 is
relaxation time and 120578(ϔ) is the shear viscosity
The numerator consists of the elasticity portion (relaxation time 120591 and first normal
stress 1198731(ϔ)) and the denominator is a function of only the viscosity profile (120578(ϔ)) The
elasticviscous ratio demonstrated by elasticity once their value more than one while if the
elasticviscous ratio less than one that indicates is the viscosity play main role during
proppant transport
25 FORCES INFLUENCED PARTICLES SETTLING VELOCITY
In a Newtonian fluid settling velocity of single particle can be calculated from the
Stokes model which is usually referred as Stokes Equation 7 in the creeping flow regime
(119877119890119901 lt 1) Because the settling velocity is a function of Reynolds number and drag forces
itrsquos important to calculate all parameters related to the settling velocity Khan and
Richardson 1987 Several studies developed theoretical expressions tha can used to
calculate drage coefficient Renaud et al (2004) and of Tripathi et al (1994) The most
common correlation was derived by Stokes which can be used to calculate settling velocity
(Vs) are shown in Equation 5 ndash 7 (Arnipally 2018)
42
119877119890119901 lt 1 (creeping flow regime)
119877119890119901 =119863119901119881119904120588119891
120583119891 (5)
119862119863 =24
119877119890119901 (6)
119881119904 =(120588119904minus120588119891)119892119863119904
2
18120583119891 (7)
Three main forces dominate the vertical motion of solid particles in a fluid gravitational
force FG buoyancy force FB and drag force FD (Arnipally 2018)
119865119892 = 120588119901119907119901119892 (8)
119907119901 = 12058711988911990136 (9)
119865119887 = 120588119907119901119892 (10)
119865119863 = 1198621198631198601205881198911198812
2 (11)
where 120588119901 is the particle density 119907119901 is the volume of the particle 120588119891 is the fluid density 119889119901
is the particle diameter g is the acceleration due to gravity (981 m119904minus2) 119862119863 is the drag
coefficient A is the projected area and V is the settling velocity
3 EXPERIMENT DESCRIPTION
31 MATERIALS
311 Hydraulic Fracturing Fluids Two fracture fluid samples were used in this
study 1) HVFRs with different compositions (HVFR-1 HVFR-2 HVFR-3) 2) linear gel
(GW-3d) All fracture fluid samples were provided by BJ Services Company
43
312 Preparing Fracturing Fluids According to standard industry practice for
using HVFRs four different concentrations 1 2 4 8 gallons per thousand gallons (gpt) of
each sample were mixed with deionized (DI) water Linear gel (GW-3d) fluid was tested
with three different concentrations 10 20 40 pounds per thousand gallons (ppt)
313 Proppant Sizes Proppant US silica sand size of 3060 mesh and glass bead
sizes of 2 4 and 6mm were used to measure terminal settling velocity in HVFRs
314 Rheometer A high accuracy advanced rheometer with a parallel-plate
system was used to measure viscosity-shear profile normal forces and the dynamic
oscillatory-shear measurements at lab and high temperature ranges
32 SETTLING VELOCITY IN UNCONFINED FRACTURE SETUP
Figure 1 shows the setup of an unconfined settling velocity measurement The
experiment was performed in a 1000 ml transparent graduated glass cylinder with a
diameter at least 25 times the proppant diameter to ensure proppant settling velocity was
not influenced by the walls of the glass container In addition alongside the glass container
a foot ruler was placed to measure the fluid level inside the model as shown in the setup
Figure 1 Schematic of fracture setup for unconfined fluids
44
33 RHEOLOGICAL CHARACTERIZATION OF THE HVFRS
331 Viscosity Profile Measurement Two different rheological tests were
performed including steady shear-viscosity and time dependency using an advanced
rheometer with a parallel-plate system (PP50TG using a 030 mm gap) To investigate the
viscous behavior tests were implemented under varying shear rate from 01-1000 119904minus1 with
measurements at 21 pointdecade
332 Elasticity Profile Measurement The dynamic oscillatory-shear
measurements were conducted to measure the elasticity profile characterizations and first
normal stress N1 The oscillatory test was implemented over a range of frequencies from
001-100Hz All rheological properties measurements were conducted at lab and high
temperature ranges
333 Thermal Stability Measurement The influence of temperature during
fracturing operations has not been fully understood in shale oil reservoirs This paper
investigated the effect of thermal stability of rheology characterizations of HVFRs which
tends to alter parameters such as time dependency fluid elasticity viscosity and first
normal stress To better mimic the real fracturing process the experiments were performed
under elevated temperatures by using an advanced rheometer Viscosity-shear profile
measurements for three different temperatures of 77 122 176 have been conducted
for both HVFRs and linear gel fracture fluids
334 Static Settling Velocity Measurement At this point the graduated cylinder
is filled with HVFR and the cell is positioned vertically To measure proppant settling
velocity in unconfined fluids high-resolution video camera is used to record the settling
process In this setup proppant diameter ranged from 0453 mm to 6 mm A single proppant
45
was dropped in the HVFR and allowed to settle A high-resolution video camera has been
used to capture the process of free proppant settling An image analysis tool called
ldquoTrackerrdquo ( httpwwwcabrilloedu~dbrowntracker) was applied to get accurate
measurements of vertical position of the proppant at different time steps (Ba Geri et al
2018) The slope of relationship between proppant vertical positions to steps time step is
called terminal settling velocity For more accurate results settling velocity of each particle
were repeated three times
4 RESULTS AND DISCUSSION
41 VISCOSITY MEASUREMENT RESULTS
In Figure 2 a viscosity measurement profile is presented In order to understand
the HVFRs characterizations three different HVFRs fracture fluids with a wide range of
concentrations (1 2 4 8gpt) along with several linear gel concentrations (10 20 40ppt)
were measured using an advanced rheometer at 25 in a wide range of shear rates from
01 to 1000 119904minus1 All the results exhibit that the HVFRs fluids follow a shear thinning
behavior that as shear rate increases the viscosity decreases At a loading of 8gpt results
for HVFR-2 showed that HVFRs have high viscosity (20000cp) at a lower shear rate of
01 119904minus1 compared to HVFR-1 and HVFR-3 with 9000cp and 10000cp respectively
Linear gel with a loading of 40ppt at the same low shear rate of 01 119904minus1 showed a much
lower viscosity of around 1200 cp
46
Figure 2 Effect of HVFR (left) and linear gel (right) concentrations as a function of
shear rate
Table 1 shows the Power law model equations fitting for all HVFRs and linear gel
samples at different concentrations The Power law model is clearly best fit of the
experiments results of HVFRs and linear gel fluids whereas the R-square values of the
equation are close to the unit The results also observed that by increasing HVFRs or linear
gel concentration the K and n values increased
Figure 3 shows that HVFR-2 has highest viscosity profile at a low shear rate of 01
119904minus1 For instance at a loading of 8 gpt HVFR-2 had a viscosity of almost 23000 cp
which is around double the viscosity of HVFR 1 amp 3 at the same loading Moreover
HVFR-2 loading 2 has higher viscosity profile up to 2670cp while linear gel loading 20ppt
has less viscosity around 311cp which represent almost 9 time increasing in viscosity
profile of HVFR-2 loading 2gpt
To conclude HVFRs have higher viscosity profile along all the shear rate ranges
compared to linear gel HVFR-2 viscosity increased substantially from 176 cp to 22724
cp as the concentration increased from 1gpt to 8gpt however linear gels have much lower
1
10
100
1000
10000
01 1 10 100 1000
Vis
cosi
ty cp
Shear Rate 1s
Linear Gel
40ppt
20ppt
10ppt
1
10
100
1000
10000
100000
01 1 10 100 1000
Vis
cosi
ty cp
Shear Rate 1s
HVFR-2
8 gpt
4 gpt
2 gpt
1 gpt
47
viscosity ranges and their viscosity could increase from 39 cp to 1242 cp as the
concentration increased from 10 ppt to 40 ppt
Table 1 Power law model equations and parameters (n k) for HVFRs and linear gel
HVFR Concentration gpt
Fluid Name 1 2 4 8
HVFR-1 120583 = 18603120574minus056 120583 = 37898120574minus059 120583 = 96933120574minus064 120583 = 263425120574minus069
R-square 09996 09997 09998 09997
HVFR-2 120583 = 19287120574minus070 120583 = 55264120574minus073 120583 = 147163120574minus078 120583 = 447822120574minus082
R-square 09994 09996 09997 09998
HVFR-3 120583 = 6152120574minus043 120583 = 195120574minus0540 120583 = 60708120574minus063 120583 = 181535120574minus069
R-square 09984 09987 09992 09994
Linear Gel Concentration ppt
Fluid name 10 20 40
Linear Gel 120583 = 1144120574minus010 120583 = 17298120574minus038 120583 = 116322120574minus048
R-square 09786 09955 09830
Figure 3 Viscosity as a function of concentration of HVFRs (left) and Linear gel (right)
at low shear rates
0
5000
10000
15000
20000
25000
1 2 3 4 5 6 7 8 9
Vis
cosi
ty
cp
Concentration gpt
Shear Rate 01 (1s)
HVFR-1
HVFR-2
HVFR-3
0
200
400
600
800
1000
1200
1400
0 5 10 15 20 25 30 35 40
Vis
cosi
ty
cp
Concentration ppt
Shear Rate 01 (1s)
Linear Gel
48
42 ELASTICITY MEASUREMENT RESULTS
The time associated with changing the structure of the polymer fluids is the
relaxation time τ and it can be used to quantify the elasticity of the fluid Since the HVFRs
have a high molecular weight understanding the elasticity is very important To evaluate
the viscoelastic characterizations of HVFRs a small amplitude oscillatory shear test was
carried out in the fluid solutionrsquos linear viscoelastic regime using an advanced rheometer
with a parallel-plate system Storage moduli (Grsquo) represents elastic responses and loss
moduli (Grdquo) represents viscous responses Relaxation time is referred to as the inverse of
the cross over point (t = 1ω) where Grsquo is equal to Grdquo The longer relaxation time of the
fluid means has more elastic properties while the shorter relaxation time means the fluid
carrys less elastic properties Figure 4 shows the Grsquo and Grdquo of HVFR as a function angular
frequency All HVFR-2 concentrations were showing a good elastic property with high
relaxation time ranges The relaxation time increased with increasing the concentrations of
HVFR
In contrast Figure 5 shows the storage modulus and loss modulus as a function of
angular frequency for linear gel with very low elastic properties At higher concentration
of linear gel 40ppt the elastic properties are much lower around 01 sec Therefore the
linear gel might depend only on viscous properties to carry and place the proppant during
hydraulic fracturing treatment
Figure 6 showed the relaxation time was increased by increasing the fracturing fluid
concentration for both fluids In HVFR2 concentration of 4 gpt has a relaxation time of
approximately 17 second and it increased to 37 second at 8 gpt The results show that
HVFR-2 has a better elastic property than HVFR-1 and HVFR-3 Also at similar
49
equivalent loading concentrations results indicated that HVFRs have better elastic
properties compare to liner gel Even though concentration of linear gel increased to 40
ppt it still has a very small relaxation time with around 01s
Figure 4 Elastic modulus and storage modulus ` as a function for HVFR-2 at different
concentration
It could be concluded that for all tested fluid samples HVFRs fluid system have
higher elastic properties than linear gel fluid system Despite increasing the concentration
of linear gel to 40 ppt it still is showing very low elastic properties
50
Figure 5 Elastic modulus and storage modulus as a function of angular frequency for
linear gel at different concentrations 20ppt and 40ppt
Figure 6 Relaxation time as a function of concentration of HVFR-1 HVFR-2 and
HVFR-3 (left) and linear gel (right)
421 Normal Stress Measurements Normal stress is another significant elastic
property which can be measured by Rheometer as a function of shear rate Figure 7 shows
the normal stress (N1) as a function of shear rate of HVFR-2 at different loading At low
shear rates (from 01 to 10 119904minus1) the normal stress was very low whereas increasing the
shear rate above 10 119904minus1 showed an increase in normal stress Normal stress was increased
00001
0001
001
01
1
10
Sto
rag
e M
od
ulu
s G
[
Pa
]
Lo
ss M
od
ulu
s G
[Pa
]
Angular Frequancy [rads]
G - 40ppt
G - 40ppt
G -20ppt
G - 20ppt
0
002
004
006
008
01
012
0 10 20 30 40
Rel
ax
ati
on
Tim
e s
Concentration ppt
Linear Gel
0
5
10
15
20
25
30
35
40
1 3 5 7
Rel
ax
ati
on
Tim
e s
Concentration gpt
HVFR-1
HVFR-2
HVFR-3
51
substantially as the HVFR concentration increase For example at 1000119904minus1 the normal
stress was 20 Pa and 285 Pa for 1gpt and 8gpt respectively This result is consistent with
the elastic range trend measured previously by the relaxation time
Figure 7 Effect of HVFR 2 concentration as a function in normal stress profile
In Figure 8 although a high concentration of linear gel (40ppt) has been selected to
examine the first normal stress N1 at high shear rate 1000119904minus1 the N1 was only 50 Pa
This elasticity is however still much less than HVFRs with a concentration of 4 gpt
Figure 8 Effect of HVFR 2 concentration as a function in normal stress profile
0
50
100
150
200
250
300
01 1 10 100 1000
Norm
al
Str
ess
(N1
) P
a
Shear Rate 1s
8gpt
4gpt
2gpt
1gpt
0
10
20
30
40
50
60
01 1 10 100 1000
Norm
al
Str
ess
N1
Shear Rate 1s
40ppt
20 ppt
10ppt
52
43 THERMAL STABILITY MEASUREMENT RESULTS
Figure 9 shows the rheological measurements for both HVFR-2 and linear gel at
temperature ranges of 25 Co 50 Co and 80 Co Results reveal that polyacrylamide-based
HVFs systems have better thermal stability than linear gel at different shear rate ranges
Increased temperature to 50 Co did not show any change in viscosity profile but when
temperature increased to 80 Co little bit changes occurred However linear gel loses
significantly its viscous properties with increasing shear rate when temperature increased
to 80 Co For example at shear rate of 1 s-1 the viscosity of linear gel dropped from 1000
cp to 100 cp as the temperature increased from 25 Co to 80 Co
Figure 9 Thermal stability of viscosity as a function of shear rate of HVFR-2 (left) and
linear gel (right)
Figure 10 shows the elastic effect (first normal stress N1) loses its properties with
increasing temperature for both fracture fluids but more significant for linear gel At high
shear rate of 1000 S-1 normal stress for HVFR decreased from 340 Pa to 230 Pa and 70 Pa
1
10
100
1000
10000
01 1 10 100 1000
Vis
cosi
ty cp
Shear Rate 1s
40 ppt - T=25C
40 ppt - T=50C
40 ppt - T=80C
1
10
100
1000
10000
100000
01 1 10 100 1000
Vis
cosi
ty c
p
(Shear Rate 1sec)
HVFR-2 8gpt - T = 25 CHVFR-2 8gpt - T = 50 CHVFR-2 8gpt - T = 80 C
53
as temperature increased from 25 Co to 50 Co and 80 Co respectively However at same
shear rate normal stress for linear gel dropped significantly from 50 Pa to 10 Pa and 5 Pa
within the same of temperature ranges
Figure 10 Thermal stability of viscosity as a function of shear rate of HVFR-2 (left) and
linear gel (right)
44 SETTLING VELOCITY MEASUREMENT RESULTS
Several factors can control the proppant transport in complex fracture system
including proppant type proppant size fracture geometry and fracture fluid characteristics
including viscosity and elasticity This section is showing how the rheological and elastic
properties of HVFR and linear gel could affect the proppant settling velocity
441 Qualitative Multi-Particle Static Settling Velocity To qualify the settling
velocity of multi-particles two different loadings (2 and 4gpt) of HVFR-2 and a loading
of linear gel (20ppt) were hydrated in DI and mixed well with proppant concentration of 2
ppa The mixture was poured immediately into a 100 ml graduated cylinder A time lapse
0
10
20
30
40
50
60
01 1 10 100 1000
Norm
al
Forc
es
Pa
Shear Rate 1s
40 ppt - T=25C40 ppt - T=50C40 ppt - T=80C
0
50
100
150
200
250
300
350
400
01 1 10 100 1000
Norm
al
Forc
es
P
a
Shear Rate (1sec)
HVFR-2 8gpt - T = 25 C
HVFR-2 8gpt - T = 50 C
HVFR-2 8gpt - T = 80 C
54
camera was set up to capture the settling rate for certain time All multi-particle static
settling time have been measured in the lab conditions
Figure 11 shows at a low load of HVFR-2 (2gpt) most of the proppant took 10
minutes to settle with few proppants were still suspended in the fluid However as it shown
in Figure 12 as the concentration of HVFR increased to 4gpt a longer settling time (60
minute) was observed with more proppant still suspended at fluid Proppant settling time
in linear gel was significantly less than both concentrations of HVFR as it is shown in
Figure 13 In linear gel loading of 20ppt the proppant was settled completely at 15 seconds
with very few proppants still suspended in the fluid The settling rate in linear gel (20ppt)
was almost 40 times higher than HVFR-2 (2gpt) this might occur because HVFR-2 has
higher viscous and elastic properties than the linear gel fluid
Figure 11 Multi-static measurement for proppant settling time using HVFR-2 (2gpt)
55
Figure 12 Multi-static measurement for proppant settling time using HVFR-2 (4gpt)
Figure 13 Multi-static measurement for proppant settling time using linear gel (20 ppt)
442 Quantitative Single Particle Static Settling Velocity
4421 Proppant size effect on static settling velocity Single particle static
velocity measurements were performed in unconfined conditions using a HVFR-2 loading
2gpt and linear gel loading 20ppt at an ambient temperature Three different glass beads
sizes of 2 mm 4 mm and 6 mm were selected to study the effect of proppant sizes on
56
different fracture fluids Figure 11 shows the terminal static settling velocity calculations
for both fluids Result clearly indicated that for all proppant sizes proppant had higher
settling velocities when it placed inside the linear gel compared to HVFR For example
settling velocity of proppant size of 4 mm was 5 cmsec for HVFR and increased
significantly to 20 cmsec for linear gel These results indicate that HVFR could have better
proppant suspension capability than linear gel Results also indicated that increasing
particle sizes increases the proppant settling velocity
Figure 14 Effect of proppant settling velocity in HVFR-2 gpt vs linear gel-20 ppt
fracture fluids
4422 Effect of elasticity and viscosity properties on settling velocity Figure
12 presented steady a shear rate-viscosity measurement profile as a function of shear rate
for HVFR-2 loading of 2 gpt and linear gel loading of 20 ppt The power law model (k n)
is fitted only for the shear rate ranges at which proppant shear rate results obtained from
Figure 11 (ranges from 62 to 98 119904minus1 )
0
5
10
15
20
25
30
35
40
45
0 1 2 3 4 5 6 7 8
Ter
min
al
Set
tlin
g V
elo
city
cm
sec
Particle Diameter mm
LG 20 2mm LG-20 4mm LG-20 6mm
HVFR-2 2mm HVFR-2 4mm HVFR-2 6mm
57
Figure 15 Viscosity as a function of shear rate for HVFR-2 loading 2 gpt (left)
and linear gel loading 20 ppt (right)
To illustrate the particle settling behavior profile the Weissenberg number is
measured since it can be used to evaluate elasticity measurements Table 2 presents the
result of calculating the Weissenberg number as a function of experimental settling velocity
measurement for different elastic property (λ=14 and 003) and approximately similar
viscosity profile shear rate ranges The results obtained from Weissenberg number was
much higher in HVFR compared to linear gel This implies that elastic properties might
have significant effect on settling velocity compared with viscosity properties but this
trend still needs further study because both fracture fluids did not have a very similar
viscosity profile
The Elasticity to Viscosity Ratio (λeυ) equation was also used to help in
determining which properties of the fracture fluids demonstrated the particle settling
velocity Large shear rate ranges were used to cover the possible ranges of proppant
transport shear rate that occurred with in hydraulic fracture
58
Table 2 Weissenberg Number calculation as a function of relaxation time and particle
shear rate
Test
Fluid
Relaxation
time (s)
Diameter of
Particles (mm)
Settling
Velocity
(cmsec)
Weissenberg
Number
Particle
Shear Rate
(1s)
HVFR-2
14 2 063 876 626
14 4 393 2748 1963
14 6 669 3120 2229
LG - 20
003 2 539 16 5393
003 4 1775 27 8877
003 6 2943 29 9810
Table 3 presents the Power law model equations for the relationship between
viscosity and shear rate as well as the exponential model for the first normal stress for both
HVFR-2 and linear gel to calculate elasticviscous ratio Figure 13 shows that for HVFR-
2 loading 2 gpt the equation 120582119890120592 = 069 ϔ14 indicates that elasticity becomes more
dominate when the shear rate is larger than 126119904minus1 For linear gel (20 ppt) elastic effects
are almost negligible since the contribution of elasticity become more important when
shear rates are larger than 501119904minus1 as illustrated by 120582119890120592 = 00008 ϔ117 The results could
also be indicated that elastic properties of HVFR dominate proppant transport within a
wide range of shear rates covering large portion of hydraulic fracture where shear rates
across fracture decreases as proppant transport deep inside fracture However still more
59
work is needed to confirm these results where fracture fluids with similar viscosity ranges
have different elastic properties or vice versa are required for such investigations
Table 3 ElasticViscous ratio 120582119890120592 calculations
The Ratio of Elasticity to Viscosity Calculation
Fluid name
Viscosity equation from
viscosity profile
Elasticity equation from
N1 profile
ElasticViscous
ratio
HVFR-2 gpt 120578(ϔ) = 0552ϔminus073 1198731(ϔ) = 0548ϔ0665 120582119890120592 = 069 ϔ14
R-square 09996 0968
Linear Gel- 20 ppt 120578(ϔ) = 0172ϔminus038 1198731(ϔ) = 0096ϔ0798 120582119890120592 = 00008 ϔ117
R-square 09955 09169
Figure 16 Calculated elasticviscous ratio as a function of shear rate for HVFR-2 2 gpt
and Linear gel ndash 20 ppt
000001
00001
0001
001
01
1
10
100
1000
10000
100000
01 1 10 100 1000
λe
v
Shear Rate 1s
HVFR-2gpt
Linear Gel -20ppt
60
5 COST ANALYSIS
HVFRs are in high demand now in hydraulic fracturing processes instead of
conventional linear gel systems due to economical and operational factors Economically
using HVFRs reduces chemical volume costs from 48 to 33 and the volume can also be
reduced by 30 when switching to the HVFR system (Motiee et al 2016 Domelen et al
2017) Moreover there is potential of using less equipment on location due to HVFRs
having high solubility in water so there is no need for a hydration unit or blending in the
field This paper presents that using a low loading of HVFR provides much better result
compared to the using a common concentration of linear gel (20 ppt)
Table 4 Stimulation summary of case study (Dahlgren et al 2018)
SW
MBL
HVFR
MBL
18
LIN
MBL
18 XL
MBL
TOTAL
FLUID MBL
100
MESH
MM
4070
MM
TOTAL
PROP MM
Well 1 243 0 21 41 3054 47 76 123
Well 2 251 56 0 0 3073 47 76 123
Dahlgren et al 2018 presented field case studies of using HVFRs in the STACK
play Interestingly one of these was a comparison between two wells completed identically
in fracturing design Well 1 was treated with a hybrid guar-based fluid system consisting
of 18 linear gel and 18 crosslinked Well 2 used a HVFR starting with 5 gpt and ending
the fracture treatment with 3 gpt of HVFR All the other parameters were the same in both
61
stimulation processes in well 1 and well 2 as shown in the Table 4 The field results showed
an over 30 improvement in production as well as chemical cost reduction of 32 in well
2 where HVFR was used compared to using guar-based fluids in well 1
6 CONCLUSIONS
This laboratory study investigated rheological and elastic properties of high viscous
friction reducer fracture fluids Proppant settling velocity was also investigated at different
conditions The outcomes of this work give valuable insights into the properties and
performance of high viscous friction reducer fracture fluids compared to linear gel fluids
The following conclusions can be drawn from this work
bull High viscous friction reducer-based fluids with low concentrations of HVFRrsquos have
better viscosity and elastic properties than fluids with typical concentrations of linear
gel
bull High viscous friction reducers have better thermal stability than linear gel Viscosity
and elastic properties of high viscous friction reducers did not be change significantly
compared to linear gel at temperature ranges less than 80 degC
bull High viscous friction reducer showed better elastic properties than linear gel for
different shear rate ranges This implies that high viscous friction reducer-based fluids
have better proppant carrying capability along fractures than linear gel
62
bull Proppant static settling velocity was much higher linear gel fluids compared to high
viscous friction reducer-based fracture fluids The proppant settling velocity is
approximately 40x less when using high viscous friction reducer
REFERENCES
Arnipally S K amp Kuru E (2018 October 1) Settling Velocity of Particles in
Viscoelastic Fluids A Comparison of the Shear-Viscosity and Elasticity Effects
Society of Petroleum Engineers httpsdoi102118187255-PA
Ba Geri M Imqam A amp Dunn-Norman S (2018 October 5) Proppant Transport
Behavior in Inclined Versus Vertical Hydraulic Fractures An Experimental Study
Society of Petroleum Engineers httpsdoi102118191813-18ERM-MS
Ba Geri M Imqam A amp Flori R (2019 April) A Critical Review of Using High
Viscosity Friction Reducers as Fracturing Fluids for Hydraulic Fracturing
Applications Society of Petroleum Engineers httpsdoi102119195191-MS
Broadbent JM Mena B 1974 Slow flow of an elastico-viscous fluid past cylinders and
spheres Chem Eng J 8 11ndash19
Dahlgren K Green B Williams B Inscore J Domelen M V amp Fenton A (2018
January 23) Case Studies of High Viscosity Friction Reducers HVFR in the
STACK Play Society of Petroleum Engineers httpsdoi102118189893-MS
Drylie S Duenckel R Barree R amp Hlidek B (2018 September 24) An Investigation
of Proppant Transport in Friction Reducer Fluid Systems Utilizing a Large Slot
Flow Apparatus Society of Petroleum Engineers httpsdoi102118191720-MS
Hu Y T Chung H amp Maxey J E (2015 February 3) What is More Important for
Proppant Transport Viscosity or Elasticity Society of Petroleum Engineers
httpsdoi102118173339-MS
Hu Y T Fisher D Kurian P amp Calaway R (2018 January 23) Proppant Transport
by a High Viscosity Friction Reducer Society of Petroleum Engineers
httpsdoi102118189841-MS
63
Johnson M Winkler A Aften C Sullivan P Hill W A amp VanGilder C (2018
October 5) Successful Implementation of High Viscosity Friction Reducer in
Marcellus Shale Stimulation Society of Petroleum Engineers
httpsdoi102118191774-18ERM-MS
Khan AR Richardson JF 1987 The resistance to motion of a solid sphere in a fluid
Chem Eng Sci 62 135ndash150
Lali A M Khare A S Joshi J B et al 1989 Behaviour of Solid Particles in Viscous
Non-Newtonian Solutions Settling Velocity Wall Effects and Bed Expansion in
Solid-Liquid Fluidized Beds Powder Tech 57 (1) 39ndash50
httpsdoiorg1010160032-5910(89)80102-0
Loveless D Holtsclaw J Saini R Harris P C amp Fleming J (2011 January 1)
Fracturing Fluid Comprised of Components Sourced Solely from the Food Industry
Provides Superior Proppant Transport Society of Petroleum Engineers
httpsdoi102118147206-MS
Malhotra S amp Sharma MM Settling of Spherical Particles in Unbounded and Confined
Surfactant-Based Shear Thinning Viscoelastic Fluids An Experimental Study
Chemical Engineering Science 84 646-655 (2012)
Montgomery C (2013 May 20) Fracturing FluidltbrgtComponents International Society
for Rock Mechanics and Rock Engineering
Motiee M Johnson M Ward B Gradl C McKimmy M amp Meeheib J (2016
February 1) High Concentration Polyacrylamide-Based Friction Reducer Used as
a Direct Substitute for Guar-Based Borate Crosslinked Fluid in Fracturing
Operations Society of Petroleum Engineers httpsdoi102118179154-MS
Renaud M Mauret E Chhabra RP 2004 Power-law fluid flow over a sphere average
shear rate and drag coefficient Can J Chem Eng 821066ndash1070
Shah SN Fadili YE Chhabra RP 2007 New model for single spherical particle
settling velocity in power law (visco-inelastic) fluids Int J Multiphase Flow 33
51ndash66
Schein G (2005 January 1) The Application and Technology of Slickwater Fracturing
Society of Petroleum Engineers
Shen L Vigderman L Heller D amp Fu D (2018 August 9) Can Friction Reducers
Transport Sand During Fracturing Treatment Unconventional Resources
Technology Conference httpsdoi1015530URTEC-2018-2873723
64
Van Domelen M Cutrer W Collins S amp Ruegamer M (2017 March 27)
Applications of Viscosity-Building Friction Reducers as Fracturing Fluids Society
of Petroleum Engineers httpsdoi102118185084-MS
Tripathi A Chhabra RP Sundararajan T 1994 Power-law fluid over spheroidal
particles Ind Eng Chem Res 33 403ndash410
Uhlherr PHT Le TN Tiu C 1976 Characterization of inelastic power-law fluids
using falling sphere data Can J Chem Eng 54 497ndash502
65
III STATIC PROPPANT SETTLING VELOCITY CHARACTERISTICS IN
HIGH-VISCOSITY FRICTION REDUCERS FLUIDS FOR UNCONFINED
AND CONFINED FRACTURES
Mohammed Ba Geri1 Ralph Flori1 Abdulmohsin Imqam1 Andrey Bogdan2 and
Lingjuan Shen2
1 Deparment of Petroleum Engineering Missouri University of Science and Technology
Rolla MO 65409
2 BJ Services Tomball TX
ABSTRACT
Measuring proppant settling velocity in high viscosity friction reducers (HVFRs)
plays a critical key for evaluating proppant transport in hydraulic fracture treatment
Settling of particles is governed by several factors such as fluid rheology (viscosity and
elasticity) proppant size retardation confining walls effect and fracture orientation The
objective of this experimental study was to determine how these factors would influence
particle settling velocity in hydraulic fracturing applications
The experiments were conducted in unconfined and confined fluid conditions
Fracture cell was designed in certain ways to capture the impact of fracture orientation by
45deg 60deg and 90deg on settling velocity
Results showed HVFR provided better proppant transport capability than regular
FRs used in slickwater Proppant settling velocity using HVFR was decreased by 80
Results obtained from confined fluid experiments showed that proppant settling velocity
decreased due to the confining walls exert retardation impact The wall retardation was also
66
reduced as the fracture width increased Changing fracture orientation from vertical
position (90 degree) to 45 degree led to high reduction in proppant settling velocity
1 INTRODUCTION
The free settling velocity of solid particles in different fluid media is generally
encountered in a wide variety of industrial processes Understanding particles behavior and
particles settling plays a vital role in optimizing design and operation in various industrial
applications including proppant transport in hydraulic fracturing gas flow through pipe
lines and cutting transport during drilling operations as discussed by Arnipally and Kuru
2018 Increasing the efficiency of proppant transport distribution in hydraulic fracture
treatment is required and relies on the knowledge of settling velocity of the particles
Settling of particles is governed by several factors such as fluid rheology (elasticity and
viscosity) proppant size retardation confining walls effect and fracture orientation Since
quantifying the relationship between drag coefficient and Reynoldsrsquo number of particles is
the most significant to know it is required to get the values of the particles settling velocity
Settling velocity at higher Reynolds numbers has been studied extensively and expressed
for the calculation of drag force (Clift et al 1978 Khan and Richardson 1987 Zapryanov
and Tabakova 1999 Michaelides 2002 2003)
Recently the oil industry started to use HVFRs as a direct replacement for linear
and crosslinked gels due to several operational and economic reasons (Motiee et al 2016
Ba Geri et al 2019) such as reducing pipe friction during the fracturing process placing
more proppant creating more complex fracture networks due to a less viscous system
67
possible higher fracture conductivity and potentially lower costs due to fewer chemicals
and less equipment on location (Motiee et al 2016 Van Domenlen et al 2017 Dahlgren
et al 2018 Ba Geri et al 2019b)
Predicting particles settling velocity and proppant transport in different types of
hydraulic fracturing fluids was attained by (Clark and Zhu 1996 Gadde et al 2004)
studied how settling velocity can be affected by changing proppant size fracture width
velocity of fluid and rheology properties of fluids The study concluded that Stokersquos law
is not accurate for predicting proppant settling rate Motiee et al (2016) studied high
concentration friction reducers (HCFR) as a direct substitute for guar-based fluid Different
concentrations of HCFR (2 4 6 and 8 gpt) were compared with 25 ppt linear gel to study
proppant settling velocity HCFR showed better proppant settling velocity relative to guar-
based fluids Tong et al (2017) conducted experimental and simulation studies about
proppant transport in fracture intersections using slickwater They concluded that
increasing shear rate causes reduction on equilibrium bed height and increased proppant
dune length
Shen et al (2018) investigated rheological characterization of HVFRs and
measured the settling velocity of multi-particle proppant They concluded that both the
viscosity and elasticity of HVFRs can affect the proppant carrying capacity during
hydraulic fracturing treatments Hu et al (2018) addressed some concerns related to
proppant transport capability using HVFRs and linear gel They observed that normal
forces for linear gels are much lower than HVFRs with increased shear rate Dahlgren et
al (2018) identified three case studies in which the operator in STACK play replaced
traditional fracturing fluid with HVFR The study noticed that the viscosity profile was
68
negatively affected by breaker Johnson et al (2018) presented a successful implementation
of high brine friction reducers (HBFRs) in high TDS water exceeding 60000TDS They
observed that the viscosity of HBFRs decreased with increased brine concentration ranges
Drylie et al (2018) conducted viscosity measurements at a high shear rate of 511 119904minus1 and
a low shear rate 001 119904minus1 for 1 gpt and 6 gpt of HVFR and 24 ppt of guar The study noticed
that 1gpt of HVFR did not change the viscosity profile significantly in contrast at a low
shear rate HVFRs had much higher viscosity than guar Ba Geri et al (2018) investigated
experimentally the effect of fracture inclination on proppant transport The study concluded
that inclination of fractures can significantly impact on proppant transport due to the
friction or contact force which comes from the fracture wall Although this work studied
the proppant transport using HVFR there was not much work comparing this settling
velocity of HVFRs with traditional slickwater fluids
Additionally even though a lot of work has been performed to understand the
proppant settling velocity in HVFR the effect of confined and unconfined fractures on
static proppant settling velocity measurements has not been thoroughly investigated This
work will conduct laboratory work intensively to fill the knowledge gap This study
investigated five factors that could affect proppant settling velocity performance viscosity
profile elasticity (Normal forces and relaxation time) proppant size wall effect and
fracture orientation
69
2 PROPPANT STATIC SETTLING VELOCITY
This study provides insights on the wall effect factor on measuring proppant static
settling velocity It also evaluates the elastic and viscous properties of HVFRs fluid through
calculating the elasticity to viscosity ratio
21 WALL EFFECT (119917119960)
Proppant settling velocity plays vital factor during proppant transport in complex fracturing
system due to the very narrow widths of natural fractures Therefore the ratio between the proppant
diameters and the fracture width is pointed out in this study For Newtonian fluids (Faxen 1922)
addressed the wall effect on settling velocity on creeping flow regime The study concluded that
wall factor depends on the ratio between particle diameters to cell width A retardation effect of
walls on particle settling velocity reduced the settling velocity This retardation effect can be
quantified as wall factor (119865119908) The wall factor defines as the ratio between the particles settling
velocity in confined walls to settling velocity in unconfined fluids as shown in the Eq 1 (Malhotra
and Sharma 2013)
119865119908 =119878119890119905119905119897119894119899119892 119907119890119897119900119888119894119905119910 119894119899 119888119900119899119891119894119899119894119899119892 119908119886119897119897119904
119878119890119905119905119897119894119899119892 119907119890119897119888119900119894119905119910 119894119899 119906119899119888119900119899119891119894119899119894119899119892 119891119897119906119894119889 (1)
If 119865119908 gt1 settling velocity is affected by confining walls
if 119865119908 le1 wall effect is negligible
22 PARTICLE SHEAR RATE (ϔ)
Calculating apparent particle shear rate leads to avoid overestimation or
underestimation of the right value of particle shear rate therefore determine the particle
70
shear rate range within the Power law model (K n) is essential step to describe the shear
thinning effect of the HVFRs fluids Ba Geri et al (2019b) Eq 2 can be used to estimate
the particle shear rate
ϔ = 2 lowast 119881119904119889119901 (2)
where ϔ is the particle shear rate 119881119904 is the terminal settling velocity 119889119901 is the particle
diameter
23 ELASTICITY TO VISCOSITY RATIO (120640119942120650)
Viscoelastic fluids consist of two main properties (viscosity and elasticity) To
evaluate which property gives the greatest contribution during proppant transport Equation
4 was used to measure the elasticity to viscosity ratio (120582119890120592) (Shen et al 2018)
120582119890120592 =051205911198731(ϔ)
120578(ϔ) (3)
where λeυ is the elasticity to viscosity ratio 1198731(ϔ) is the first normal stress 120591 is
relaxation time and 120578(ϔ) is the shear viscosity
The numerator consists of the elasticity portion (relaxation time 120591 and first normal
stress 1198731(ϔ)) and the denominator is a function of only the viscosity profile (120578(ϔ)) The
elasticviscous ratio demonstrated by elasticity once their value more than one while if the
elasticviscous ratio less than one that indicates is the viscosity play main role during
proppant transport
71
24 FORCES INFLUENCED PARTICLES SETTLING VELOCITY
The most common correlation was derived by Stokes which can be used to calculate
settling velocity Vs if the Reynolds number and drag coefficient 119862119863are known which are
shown in Eq 6 ndash 8 (Arnipally and Kuru 2018)
119877119890119901 lt 1 (creeping flow regime)
119877119890119901 =119863119901119881119904120588119891
120583119891 (4)
119862119863 =24
119877119890119901 (5)
119881119904 =(120588119904minus120588119891)119892119863119904
2
18120583119891 (6)
Three main forces dominate the vertical motion of solid particles in a fluid
gravitational force FG buoyancy force FB and drag force FD (Arnipally 2018)
119865119892 = 120588119901119907119901119892 (7)
119907119901 = 12058711988911990136 (8)
119865119887 = 120588119907119901119892 (9)
119865119863 = 1198621198631198601205881198911198812
2 (10)
where 120588119901 is the particle density 119907119901 is the volume of the particle 120588119891 is the fluid density
119889119901 is the particle diameter g is the acceleration due to gravity (981 m119904minus2) 119862119863 is the drag
coefficient A is the projected area and V is the settling velocity
72
3 EXPERIMENT DESCRIPTION
31 MATERIALS
311 Hydraulic Fracturing Fluids The fracturing fluid tested was regular FR
(without adding any chemical additives) and HVFR-3
312 Preparing Fracturing Fluids According to standard industry practice of
using HVFR-3 four different concentrations (1 2 4 8 gpt) of HVFRs were prepared by
mixing with deionized (DI) water Shen et al (2018)
313 Proppant Sizes Sand proppant size 2040 3050 and 4070 mesh obtained
from US Silica and spherical glass beads sizes (2mm 4mm and 6mm) were used to
measure proppant terminal settling velocity
314 Rheometer A high accuracy advanced MCR 302 Anton-Paar rheometer
with a parallel-plate system was used to measure viscosity-shear profile normal forces
and the dynamic oscillatory-shear measurements at lab temperature conditions
32 EXPERIMENT SETUP
321 Unconfined Fracture Wall Experiments Figure 1 shows the setup of an
unconfined settling velocity measurement The experiment was performed in a 1000 ml
transparent glass graduated cylinder with a diameter at least 25 times of the proppant
diameter to ensure that proppant settling velocity was not influenced by the walls of the
glass container Malhotra and Sharma (2013) In addition a foot ruler was placed alongside
the glass container to measure the fluid level inside the model
73
322 Confined Fracture Wall Experiments Figure 2 shows the schematic of the
experimental fracture cells setup The fracture cell model dimensions are 50 cm height and
7 cm length and kept the same for all the experiments Fracture cells were constructed of
two Plexiglas plates in parallel The spacing between the two parallel Plexiglasses of the
cell is made by gasket rubber to mimic the fracture width Two different fracture widths
were studied 3 mm and 9 mm At this point the cell was filled by either regular FR or
HVFR fluid and positioned vertically High-resolution video camera up to 2000 fps used
to record the proppant settling process Captured videos were tracked and analyzed using
a video analysis software The fracture slot apparatus was illuminated with 4000 Lumens
2X2 ft ndash LED Vapor tight fixture to add extra light Proppant sizes of 2040 3050 and
4070 mesh were used to conduct experiments
Figure 1 Schematic of fracture setup for unconfined fluids
74
Numerous of natural fractures might be inclined from the main fracture by different
angles during fracturing Understanding proppant settling behavior in inclined fracture is
essential for proppant transport in fracture treatment Three different angles 45⁰ 60⁰ and
90⁰ have been investigated to mimic inclined fracture The configuration of this experiment
is to model the particle-wall friction occurred due to the interaction between particles and
inclined walls effect Confined fracture wall setup was positioned as illustrated in Figure 3
to observe the fracture inclination effect Spherical proppants were used with diameter
ranges of 2 mm 4 mm and 6 mm The motion of proppant rolling down in the inclined
cells acting under four forces gravitational force FG buoyancy force FB drag force FD
and Fr friction force
Figure 2 Schematic of fracture setup for confined fluids
75
Figure 3 Schematic of the experimental fracture cell for measuring inclination angle
effect
33 EXPERIMENT PROCEDURES
331 Viscosity Rheological Characterization of the HVFRs
3311 Viscosity profile measurement Steady shear-viscosity rheological test
was performed using an advanced rheometer with a parallel-plate system (PP50TG using
a 030 mm gap) To investigate the viscous behavior the test was implemented by varying
shear rate from 01-1000 119956minus120783 with measurements at 21 pointdecade
3312 Elasticity profile measurement The dynamic oscillatory-shear were
conducted to measure the elasticity profiles including first normal stress N1 relaxation
time and elastic modulus Grsquo The oscillatory test was implemented over a range of
frequencies from 001-100 Hz All rheological property measurements were conducted at
25
3313 Static settling velocity measurement Once the fracturing fluid samples
were prepared at the desired concentration these samples were placed in unconfined and
confined fluids to measure the proppant settling velocity To achieve more accurate results
76
air bubbles were removed from the test fluid by leaving the fluid to rest overnight as
bubbles affect both rheology and settling velocity measurements Next the proppant was
dropped into the fluid column and the camera started capturing the proppant movement
An image analysis tool called ldquoTrackerrdquo
(httpwwwcabrilloedu~dbrowntracker) was applied to get accurate measurements of
vertical position of the proppant at different time steps The slope relationship between
proppant vertical positions to time steps is called terminal settling velocity For more
accurate results settling velocity of each particle was repeated several times Ba Geri et al
2018
332 Static Settling Velocity Calculations Based on Power Law Parameters
(K n)Static settling velocity of spherical particles in viscoelastic power law fluids can be
calculated using the developed model of Shah et al (2007) Two constants (A B) were
employed as a function of power law parameters n k The procedure to calculate the
settling velocity of a spherical particle in viscoelastic Power law fluid is as follows
Step-1
119860 = 69148 1198992 minus 24838119899 + 22642 (11)
119861 = minus05067 1198992 + 1323119899 minus 01744 (12)
Step-2
(1198621198632minus1198991198771198902)
1
2 = (13082minus119899119889119901
119899+2120588119891119899(120588119875minus120588119891)
2minus119899
22(119899minus1)1198702 )
1
2
(13)
Step-3
77
119877119890 = [(119862119863
2minus1198991198771198902)12
119860]
1
119861
(14)
Step-4
119881infin119868119873119864119871 = [2119899minus1119870119877119890
119889119901119899120588119891
]
1
2minus119899 (15)
119881119890119897119900119888119894119905119910 119877119886119905119894119900 = 119881infin119864119871
119881infin119868119873119864119871 (16)
119881infin119864119871 Experimental settling velocity of a particle in unconfining fluid
119881infin119868119873119864119871 Calculated on the basis of apparent viscosity data based on the power-law parameters (k
n)
4 RESULTS AND DISCUSSION
41 VISCOSITY MEASUREMENT RESULTS
Figure 4 shows viscosity measurement profile as a function of loading
concentration All the results exhibit that the HVFRs fluids follow a shear thinning
behavior that as shear rate increases the viscosity decreases At a loading of 8gpt results
for HVFR showed that HVFRs had high viscosity (7766 cp) at a lower shear rate of 01
sminus1 which is around 46 times of the viscosity when the concentration decreased to 1gpt
Table 1 shows the viscosity profile of four different concentrations (1 2 4 8 gpt)
of HVFR-3 All the measurements result of HVFRs exhibited that HVFR-3 fluid follows
shear thinning behavior
78
Figure 4 Effect of HVFR-3 concentration as a function in viscosity shear profile
Table 1 Power law model equations and parameters (n k) for HVFR-3
HVFR Concentration gpt (gallons per thousands of gallons)
Fluid
Name 1 2 4 8
HVFR-3 120583 = 6152120574minus043 120583 = 206120574minus0570 120583 = 60708120574minus063 120583 = 181535120574minus069
R-square 09984 09987 09992 09994
42 ELASTICITY MEASUREMENT RESULTS
The Relaxation time τ can be used to quantify the elasticity of the polymer fluids
Since the HVFRs have high molecular weight the understanding of the elasticity is very
important To evaluate viscoelastic characterizations of HVFR-3 small amplitude
oscillatory shear was carried out in fluid solutionrsquos linear viscoelastic regime using an
advanced rheometer with a parallel-plate system Storage modulus (Grsquo) which represents
elastic response and loss modulus (Grdquo) represents viscous response were both measured
1
10
100
1000
10000
01 1 10 100 1000
Vis
cosi
ty
cp
Shear Rate 1s
8 gpt
4 gpt
2 gpt
1 gpt
79
at wide range of angular frequencies from 001-100 Hz Relaxation time referred as the
inverse of the cross over point (t = 1ω) where the Grsquo equal to Grdquo Figure 5 shows Grsquo and
Grdquo measurements as a function of angular frequency The results showed that low loading
at 1 gpt and 2 gpt had very low relaxation time As the concentration of HVFR increased
the relaxation time became more significant For example at loading of 4 gpt the relaxation
time was 4s and increased to 8 s when loading increased to 8 gpt Normal stress is another
significant elastic property of HVFRs which can be measured as a function of shear rate
Figure 5 Elastic modulus Grsquo and storage modulus G`` as a function of HVFR-3
concentrations
The normal stress is zero in Newtonian fluids due to the isotropic of the fluid
However in polymeric fluids such as friction reducers which can develop anisotropy in the
80
orientation between flow-gradient direction (tyy) and the flow (txx) due to their
microstructures N1 usually is not zero
1198731 = 120591119909119909 minus 120591119910119910 (17)
1198731 = 120591119910119910 minus 120591119911119911 (18)
Figure 6 presents elastic property (normal force N1) as a function of shear rate At
low shear rate the normal stress was very low and started to increase as the shear rate and
loading of HFVRs increased At low shear rates (from 01 to 10 s-1) the normal stress was
very low whereas increasing the shear rate above 10 s-1 showed an increase in normal stress
Normal stress was increased substantially as the HVFR concentration increase For
example at 1000 s-1 the normal stress was approximately 20 Pa and 130 Pa for 2 gpt and
8gpt respectively This result is consistent with the elastic range trend measured previously
by the relaxation time
Figure 6 Effect of HVFR 3 concentration as a function in Normal stress profile
0
20
40
60
80
100
120
140
01 1 10 100 1000
Norm
al
Str
ess
(N1
) P
a
Shear Rate 1s
8 gpt
4 gpt
2 gpt
81
43 SETTLING VELOCITY MEASUREMENT RESULTS
Several factors can control the proppant transport in complex fracture system
including proppant type proppant size fracture geometry and fracture fluids
characteristics eg viscosity and elasticity (Loveless et al 2011 Montgomery 2013) In
this section single particle static velocity measurements were performed in confining and
uncoffining using HVFR-3 loading 2gpt in ambient temperature setup The importance of
measuring proppant static settling velocity is to mimic the conditions of fracture treatment
after stop pumping which represents low shear rate
44 PROPPANT SETTLING VELOCITY PERFORMANCE IN UNCONFINED
FRACTURE WALL
Three different glass beads of diameter sizes 2 mm 4 mm 6 mm were selected to
study the effect of settling velocity in HVFR and slickwater Figure 7 shows terminal
settling velocity as a function of particle diameter and fluid types At same particle size of
2 mm the settling velocity in HVFR was 35 cmsec while in slickwater settling velocity
increased by factor 56 to reach 197 cmsec All the tested particle sizes showed HVFR
has better settling performance compared to slickwater This reduction in settling velocity
using HVFR-3 could help to transport the proppant farther into the fractures
45 PROPPANT SETTLING VELOCITY PERFORMANCE IN CONFINED
FRACTURE WALL
The fracture orientations were examined because in inclination fractures fraction
force plays main factor to reduce the proppant settling velocity (Kou et al 2018 and Ba
82
Geri et al 2018) HVFR-3 with loading 2gpt and slickwater were both used in this
investigation
Figure 7 Effect of proppant settling velocity in HVFR-3 gpt vs slickwater fracture
fluids
Three different fracture orientations (fracture angle 90⁰ fracture angle 60⁰ and
facture angle 45⁰) and three different proppant glass beads sizes (2 mm 4 mm 6 mm) were
used Figure 8 shows settling velocity as a function of proppant sizes and fracture fluid
types at different fracture orientations The results showed that settling velocity
measurements decreased by increasing fracture inclination from 90⁰ to 45⁰ At same
particle size 6 mm of using HVFR the settling velocity in vertical fracture was 26 cmsec
while settling velocity was 96 cmsec in 45⁰ inclined fracture All the results for different
particle sizes and different fracture fluids were showing the same effect of fracture
0
5
10
15
20
25
30
35
40
45
0 1 2 3 4 5 6 7 8
Ter
min
al
Set
tlin
g V
elo
city
cm
sec
Particle Diameter mm
HVFR-3 2mm HVFR-3 4mm HVFR-3 6mm
Slickwater -2mm Slickwater-4mm Slickwater-6mm
83
inclination Results also confirmed our previous observation where HVFR had better
settling velocity performance than slickwater
Figure 9 shows further analysis to understand the effect of HVFR on proppant
settling velocity in comparing with slickwater at different fracture orientations Proppant
size of 2 mm results were used to make this comparison At same condition of fracture
orientation with 45 degree the reduction on settling velocity was over 90 by changing
fracture fluids from slickwater to HVFR-3 The reduction on settling velocity not only in
inclined fractures but also in vertical fracture (angle 90 degree) which reached around 80
once changing fracturing fluids from slickwater to HVFR-3 This substantial reduction in
settling velocity the HVFR could be better alternative for conventional slick water
Figure 8 Settling velocity of HVFR vs Slickwater in vertical fractures by 90 angle vs
inclined fractures angles 60 and 45 degree in confined fractures of 9 mm fracture width
84
Figure 9 Settling velocity reduction in slickwater versus HVFR-3 loading 2 in different
fracture orientation
46 WALL EFFECT ON STATIC SETTLING VELOCITY
Referring to the settling velocity results illustrated in Figures 7 and 8 for un-
confined fluid and confined fluids the wall effect for HVFR was obtained Settling for
these particles were occurred in the creeping flow regime Figure 10 shows 119865119908 as a function
of r (ratio between particle diameter and wall spacing) for the two different fracture widths
of 9 mm and 3 mm It can be seen that wall factors decrease with increase in value of r
This occurred because wall retardation effects increase as particle diameter becomes
comparable to wall spacing In addition to the wall retardation to reduce the proppant
settling velocity fluid elasticity plays main effect to decrease settling velocity of proppant
85
Figure 10 Wall factors as a function of particle diameter to wall spacing in the HVFR-3
loading 2 gpt
47 EFFECT OF VISCOSITY AND ELASTICITY OF HFVR ON PROPPANT
SETTLING VELOCITY
Figure 11 shows steady shear rate-viscosity measurements profile as a function of
shear rate for HVFR-3 HVFRs follow shear thinning model behavior The power law
model (k n) was fitted in the measured data of experimentally in range of particle shear
rate from 33 to 86 119904minus1 The particle shear rate range was selected based on shear particle
calculation using Eq 2 and it summarized in Table 2 for each proppant particle sizes
Figure 12 shows the velocity ratio calculation using HVFR-3 loading 2 gpt as a
function of proppant diameter Equation 16 was used to calculate the velocity ratio
between the measured settling velocity in the lab divided by the calculated velocity based
on power law model parameters (n k) Results showed that velocity ratio for the proppant
86
sizes were less than 1 This could imply that viscosity properties of HVFR3 with loading
of 2 gpt had greater effect on proppant settling velocity than elasticity did
Figure 11 Viscosity as a function of shear rate for HVFR-3 loading 2gpt
Table 2 Particles shear rate calculations for HVFR
Particle
size
Particl
e Size
(cm)
Particle
Shear
Rate
(1sec)
K
(Pasn) n
4070 mesh 0033 33
0206 057
3050 mesh 0473 87
2040 mesh 0635 187
2 mm 020 37
4 mm 040 85
6 mm 060 867
87
Figure 12 Velocity ratio as a function of proppant diameter in HVFR-3 loading 2 gpt
48 EFFECT OF ELASTICITY TO VISCOSITY RATIO (120640119942120650)
Equation 3 used to determine which properties of the fracture fluids demonstrated
the particle settling velocity at wide ranges of shear rates The estimation of shear rate
range is varying during hydraulic fracturing treatments where typically fracturing
treatment conducting within range 300 119904minus1 to 900 119904minus1 Friction loss caused reduction on
shear rate to become in the range of 10 119904minus1 to 100 119904minus1 and continue decreasing until the
shear rate goes to zero at fracture tip Table 3 presents the power law model equations of
the relationship between viscosity and shear rate as well as exponential model for first
normal stress for both HVFR-3 to calculate elasticviscous ratio
Figure 13 shows that for HVFR-3 loading 2 gpt 120582119890120592 = 0004 lowast ϔ055 indicates
that elasticity effect almost negligible since the contribution of elasticity become more
0
02
04
06
08
1
12
14
0 01 02 03 04 05 06 07
V E
L
Vs
INE
L
Proppant Diameter mm
4070 3050 2040
Reduction in velocity due to elasticity
Reduction in velocity due to viscosity
88
important when shear rate larger than 1000119904minus1 The results could imply that viscous
properties of HVFR-3 loading 2 gpt dominate proppant transport The results could imply
that viscous properties of HVFR-3 loading 2 gpt dominate proppant transport within a wide
range of shear rate from injection point until delivering proppant to fracture tip whereas
plays somehow effect at high shear rate gt 1000 119904minus1
5 COST ANALYSIS
This laboratory study investigated several factors that affect the Proppant settling
in high viscous friction reducer fracture fluids Proppant settling velocity was investigated
as function of fluid rheology (viscosity and elasticity) proppant size retardation confining
walls and fracture orientation
Figure 13 Calculated elasticviscous ratio as a function of shear rate for HVFR-3
loading 2 gpt
0001
001
01
1
01 1 10 100 1000
λev
Shear Rate 1s
HVFR-3 2gpt
89
Table 3 ElasticViscous ratio 120582119890120592 calculations
The outcomes of this work have provided interesting perceptions into the
understanding of high viscous friction reducer fracture fluids compared to slickwater
fracture fluids The following conclusions can be drawn from this work
bull High viscosity friction reducers provided better proppant transport capability than
using slickwater fracturing fluids Proppant settling velocity could be reduced by above
80 when slickwater was replaced by HVFR
bull Viscosity properties dominated proppant settling velocity while elasticity effect was
almost negligible for HVFR at low loading concentration of 2 gpt
bull Wall retardation effect increase as particle diameter becomes comparable to wall
spacing and it can also depend on HVFR elasticity
bull Changing fracture orientation from vertical position (90 degree) to incline by 45 degree
caused high reduction in proppant settling velocity This reduction could be caused by
wall friction forces when proppant settle into the bottom of the fracture
The Ratio of Elasticity to Viscosity Calculation
Fluid name Viscosity equation
from viscosity profile Elasticity equation
from N1 profile ElasticViscous
ratio
HVFR-3-2gpt 120578(ϔ) = 0195ϔminus054 1198731(ϔ) = 0018ϔ0005 120582119890120592 = 00039 ϔ055
R-square 09988 08674
90
REFERENCES
Arnipally S K and E Kuru 2018 Settling Velocity of Particles in Viscoelastic Fluids
A Comparison of the Shear-Viscosity and Elasticity Effects In Proceedings of the
SPE Annual Technical Conference and Exhibition 9-11 October San Antonio
Texas USA httpsdoi102118187255-PA
Ba Geri M A Imqam and S Dunn-Norman 2018 Proppant Transport Behavior in
Inclined Versus Vertical Hydraulic Fractures An Experimental Study In
Proceedings of the SPEAAPG Eastern Regional Meeting 7-11 October
Pittsburgh Pennsylvania USA httpsdoi102118191813-18ERM-MS
Ba Geri M A Imqam A Bogdan AL Shen 2019b Investigate the rheological behavior
of high viscosity friction reducer fracture fluid and its impact on proppant static
settling velocity In Proceedings of the SPE Oklahoma City Oil amp Gas Symposium
Oklahoma 7 ndash 11 April 2019 httpsdoi102118195227-MS
Ba Geri M A Imqam and R Flori 2019a A critical review of using high viscosity
friction reducers as fracturing fluids for hydraulic fracturing applications In
Proceedings of the SPE Oklahoma City Oil amp Gas Symposium Oklahoma 7 ndash 11
April 2019 httpsdoi102118195191-MS
Clark P E and Q Zhu 1996 Convective Transport of Propping Agents During Hydraulic
Fracturing In Proceedings of the SPE Eastern Regional Meeting 23-25 October
Columbus Ohio httpsdoi10211837358-MS
Dahlgren K B Green B Williams J Inscore V Domelen V and A Fenton 2018
Case Studies of High Viscosity Friction Reducers HVFR in the STACK Play In
Proceedings of the SPE Hydraulic Fracturing Technology Conference and
Exhibition 23-25 January The Woodlands Texas USA
httpsdoi102118189893-MS
Drylie S R Duenckel R Barree and B Hlidek 2018 An Investigation of Proppant
Transport in Friction Reducer Fluid Systems Utilizing a Large Slot Flow
Apparatus In Proceedings of the SPE Annual Technical Conference and
Exhibition 24-26 September Dallas Texas USA httpsdoi102118191720-MS
Faxen H 1922 Der Widerstand gegen die Bewegung einer starren Kugel in einerzumlahen
Fl uml ussigkeit die zwischen zwei parallelen ebenen Wumlanden eingeschlossenist
Ann Phys 68 89ndash119
91
Gadde P B Y Liu J Norman R Bonnecaze and M M Sharma 2004 Modeling
Proppant Settling in Water-Fracs In Proceedings of the SPE Annual Technical
Conference and Exhibition 26-29 September Houston Texas
httpsdoi10211889875-MS
Hu Y T D Fisher P Kurian and R Calaway 2018 Proppant Transport by a High
Viscosity Friction Reducer In Proceedings of the SPE Hydraulic Fracturing
Technology Conference and Exhibition 23-25 January The Woodlands Texas
USA httpsdoi102118189841-MS
Johnson M A Winkler C Aften P Sullivan W A Hill and C VanGilder 2018
Successful Implementation of High Viscosity Friction Reducer in Marcellus Shale
Stimulation In Proceedings of the SPEAAPG Eastern Regional Meeting 7-11
October Pittsburgh Pennsylvania USA httpsdoi102118191774-18ERM-MS
Khan AR JF Richardson 1987 ldquoThe resistance to motion of a solid sphere in a fluid
Chemrdquo Eng Sci 62 135ndash150
Kou R G J Moridis and T A Blasingame 2018 Analysis and Modeling of Proppant
Transport in Inclined Hydraulic Fractures In Proceedings of the SPE Hydraulic
Fracturing Technology Conference and Exhibition 23-25 January The
Woodlands Texas USA httpsdoi102118189856-MS
Lali A M A S Khare Joshi J B et al 1989 Behaviour of Solid Particles in Viscous
Non-Newtonian Solutions Settling Velocity Wall Effects and Bed Expansion in
Solid-Liquid Fluidized Beds Powder Tech 57 (1) 39ndash50
httpsdoiorg1010160032-5910(89)80102-0
Loveless D JHoltsclaw R Saini P C Harris and J Fleming 2011 Fracturing Fluid
Comprised of Components Sourced Solely from the Food Industry Provides
Superior Proppant Transport In Proceedings of the SPE Annual Technical
Conference and Exhibition 30 October-2 November Denver Colorado USA
httpsdoi102118147206-MS
Malhotra S and M M Sharma 2013 Settling of Spherical Particles in Unbounded and
Confined Surfactant-based Shear Thinning Viscoelastic fluids An Experimental
Study Chemical Engineering Science vol 84 092013
Michaelides EE 2002 Analytical expressions for the motion of particles In DeKee D
Chhabra RP (Eds) Transport Processes in Bubbles Drops and Particles 2nd ed
Taylor amp Francis New York (Chapter 2)
Michaelides EE 2003 ldquoHydrodynamic force and heatmass transfer from particles
bubbles and drops ndash the Freeman Scholar Lecturerdquo J Fluid Eng (AMSE) 125
209ndash238
92
Montgomery C 2013 Fracturing FluidltbrgtComponents International Society for Rock
Mechanics and Rock Engineering
Motiee M Johnson M Ward B Gradl C McKimmy M and J Meeheib 2016 High
Concentration Polyacrylamide-Based Friction Reducer Used as a Direct Substitute
for Guar-Based Borate Crosslinked Fluid in Fracturing Operations In Proceedings
of the SPE Hydraulic Fracturing Technology Conference 9-11 February The
Woodlands Texas USA httpsdoi102118179154-MS
Shah SN Fadili YE Chhabra RP 2007 New model for single spherical particle
settling velocity in power law (visco-inelastic) fluids Int J Multiphase Flow 33
51ndash66
Shen L L Vigderman D Heller and D Fu 2018 Can Friction Reducers Transport
Sand During Fracturing Treatment In Proceedings of the SPEAAPGSEG
Unconventional Resources Technology Conference 23-25 July Houston Texas
USA httpsdoi1015530URTEC-2018-2873723
Tong S R Singh amp K K Mohanty 2017 Proppant Transport in Fractures with Foam-
Based Fracturing Fluids In Proceedings of the SPE Annual Technical Conference
and Exhibition 9-11 October San Antonio Texas USA
httpsdoi102118187376-MS
Van Domelen M W Cutrer S Collins and MRuegamer 2017 Applications of
Viscosity-Building Friction Reducers as Fracturing Fluids In Proceedings of the
SPE Oklahoma City Oil and Gas Symposium 27ndash31 March Oklahoma City
Oklahoma USA httpsdoi102118185084-MS
Zapryanov Z and STabakova 1999 Dynamics of Bubbles Drops and Rigid Particles
Kluwer Academic Publishers Dordrecht The Netherlands
93
IV INVESTIGATE PROPPANT TRANSPORT WITH VARYING
PERFORATION DENSITY AND ITS IMPACT ON PROPPANT DUNE
DEVELOPMENT INSIDE HYDRAULIC FRACTURES
Mohammed Ba Geri1 Abdulmohsin Imqam1 and Mohammed Suhail2
1 Deparment of Petroleum Engineering Missouri University of Science and Technology
Rolla MO 65409
2 King Saud University Riyadh Saudi Arabia
ABSTRACT
Proppant transport adequately during hydraulic fracturing treatment assumes same
perforation contribution through multi-perforation system Proppant transport performance
into the different ordination fracture system using multi-entry perforation technique is still
not fully understood This experimental study was aimed to deeply investigate five factors
that affect proppant transport performance number of perforations perforation opening
size shear rate fracture orientation and proppant size distribution The impact of these
factors on proppant transport performance from different perspective was studied Fracture
slot model was designed and built to observe easily the effects of perforation density and
fracture orientation
The results of this experimental work show that limited-entry perforation technique
has significant impact on proppant transport within fractures where single top perforation
had better proppant placement than multi-perforation system Fracture area was
approximately propped with 66 and 48 using top perforation and multi-perforation
system respectively Slurry with high shear rate has a negative effect on the proppant
94
equilibrium dune level (EDL) and fracture propped area (FPA) Fracturing treatment using
high shear rate causes high pressure drop in the fracture that leads to decreasing EDL by
17 and fracture propped area by 23 comparing to using low shear rate Using large
proppant size (2040) leads to form high EDL and FPA compared to 100 mesh size
Proppant transport dominated by four mechanisms and the vertexes near wellbore plays
main mechanism to carry proppant farther inside the fracture
1 INTRODUCTION
Pressurized low viscosity fracture fluids (eg slickwater) have been used in
hydraulic fracturing treatments for a long time because low viscous fluids have the ability
to create desirable fracture geometries and long fracture lengths in ultra-tight permeability
reservoirs Many experimental studies have been conducted in vertical fracture slots to
highlight the factors that affect the proppant transport process (Kern et al 1959 Medlin et
al 1985 Patankar et al 2002 Wang et al 2003 Woodworth and Miskimins 2007) Multi-
stage fracturing techniques are essential to providing effective pathways for hydrocarbon
fluids to flow from unconventional reservoirs to the wellbore Each stage is comprised of
many clusters and each cluster consists of several reservoir entry points called
perforations Analysis of well logging data in horizontal wells in unconventional reservoirs
indicated that there was no contribution from 20 to 40 of perforation clusters on well
production Miller et al (2011) Crump and Conway (1988) Economides and Nolte
(2000) They observed that not all perforation is produced in shale basins for instance 21
95
32 and 39 in the Eagle Ford shale the Woodford shale and the Haynesville shale
respectively
Therefore meeting performance expectations requires enhancing the effective
completion quality and reducing completion cost by selecting optimum designs for
completion parameters like clusters and number of perforations Although the previous
work concluded that the production rate in multi-system perforation is less than limited-
perforation systems the reasons behind this are is still not understood This study will
highlight the effect of perforation density and perforation number on proppant transport
performance in terms of proppant equilibrium dune level and fracture propped area
Predicting particle settling velocity and proppant transport in different types of
hydraulic fracturing fluids including Newtonian and non-Newtonian fluids was attained
by (Clark and Zhu 1996) Gadde et al (2004) studied how settling velocity can be affected
by changing proppant size fracture width velocity of fluid and rheologicaly properties of
fluids The study concluded that using Stokersquos law is not an accurate way of predicting
proppant settling rate Liu and Sharma (2005) used different rheological characterizations
of fracturing fluids to study the effect of particle diameter on fracture width and settling
velocity They concluded that for large particle diameters the horizontal velocity of
proppant is less than the fluid velocity due to a large wall effect Alotaibi et al (2015)
extensively investigated the development of dune level and proppant transport mechanisms
at different stages of fracturing treatment using slickwater They observed that proppant
was sorted from smallest to largest until reaching EDL Mohanty et al (2016) conducted
experimental and simulation studies about proppant transport in fracture intersections using
slickwater
96
They concluded that increasing shear rate causes reduction in equilibrium bed
height while proppant dune length increases by increasing the shear rate Kadhim et al
(2017) conducted experimental study using slot fracture model to investigate the
heterogeneous fracture width wall roughness and leak-off on proppant settling
mechanisms They found that fracture wall roughness plays significant role on proppant
transport where noticed that settling velocity decreased and leads to decreased equilibrium
dune level They also observed that fracture width has more influence on settling velocity
than horizontal proppant velocity Desipt of the amount of previous work the effect of
perforation density on EDL and FPA has not been investigated thoroughly This paper will
provide a full understanding of proppant transport from different angles including pressure
loss across fractures injection shear rate and number of perforations that contributed to
proppant transport treatment
In addition due to the understanding that a created fracture orients perpendicular
to the minimum horizontal principal stress most existing studies assumed that proppant
transport occurred in a vertical geometry model Wright et al (1995) presented field studies
illustrating that over the production time of the Chevron Lost Hills the inclination changed
from 82⁰ to 45⁰ degrees between fracture treatments Dinh et al (2009) studied field
examples showing that fracture orientation is vertical near the wellbore but deviated
inclination as the moved away from the wellbore Kou et al (2018) developed a simulation
model to evaluate proppant transport in inclined fractures
Their results observed that proppant performance is better placement in inclined
fractures Ba Geri et al (2018) experimentally investigated the effect of fracture inclination
on proppant transport The study concluded that inclination of fractures can have a
97
significant impact on proppant transport due to the friction or contact force that comes
from the fracture wall This friction affects the settling velocity of the proppant and the
proppant distribution efficiency inside the fracture Increasing the fracture inclination angle
increases the fracture propped area This current study is extended work to our previous
publication Ba Geri et al (2018) in terms of studying perforation density and opening size
perforation impact on EDL and FPA
Based on the authorrsquos knowledge most of the previous lab work did not seriously
consider the impact of perforation density and fracture orientation on proppant transport
Thus this work will conduct intensive laboratory work to fill that knowledge gap This
study has deeply investigated five factors that affect proppant transport performance
number of perforations perforation opening size slurry shear rate fracture orientation and
proppant size distribution The impacts of these factors on proppant transport performance
from different perspectives was investigated based on the following 1) Behavior of
proppant transport in fracture half-length (Xf) at first fracture pore volume (FPV) 2) Dune
bed level development and fracture propped area at first FPV and EDL 3) Pressure drops
along fracture slot during proppant transport inside fracture This study also identifies and
define the mechanisms of proppant transport inside fractures
2 EXPERIMENT DESCRIPTION
21 EXPERIMENT MATERIALS
The experiments were conducted using white sand proppant supplied by US Silica
company and slickwater (without any chemicals additives) Three different sand sizes
98
(2040 4070 and 100 mesh) were used to investigate proppant size distribution effect US
silica proppant properties are shown in Table 1 All the experiments were conducted using
a proppant concentration of 05 lbgal
Table 1 APIISO properties of the tested US silica white sand proppants
Proppant
Type Roundness Sphericity
Particle
Density
(gcc)
Mean Particle Diameter
(mesh)
White
sand 07 08 265 100 4070 2040
22 FRACTURE MODEL SETUP
Figure 1 shows the proppant transport model apparatus that was built to mimic
proppant slurry transport in hydraulic fracturing treatments A lab fracture model is 61 cm
in length and 61 cm in height with fracture width of 0635 cm The orientation of the model
can be adjusted from vertical to inclined positions Four injection points (representing four
perforations of 0635 cm diameter) were made perpendicular to the fracture slot Along the
height of fracture slot four perforations were installed at the inlet and outlet of the fracture
slot During the proppant slurry injection all the four inlet perforations were used and only
one perforation at the outlet (the bottome one) was opened The other components of the
apparatus are the mixer mixing tank cameras pressure sensors flowmeters and safety
valve The fracture slot apparatus was illuminated with 4000 Lumens 61 cm x 61 cm ndash
LED vapor tight fixture to add extra light to capture clearly the proppant transport inside
fracture
99
Figure 1 Schematic Schematic of the experimental proppant transport evaluation system
23 EXPERIMENT PROCEDURE
To mimic a low viscosity slickwater stimulation treatment in a reservoir water
initially filled the fracture slot as shown in Figure 1 Three different US Silica White sand
sizes (2040 4070 and 100 mesh) were used to study the facture propped area due to
proppant size distribution in transport treatment Eleven experiments were designed and
conducted to investigate proppant transport behavior using different perforation density
and oriented fractures The number of experiments that conducted with their descriptions
are summarized in Table 2
100
Table 2 List of experiments and parameters
List of Experiments and Parameters
Cas
e
Perforatio
n Opening
Size ()
Proppan
t (mesh)
Shear
Rate
(s-1)
Proppan
t
Loading
(ppg)
Number of
Perforation
Fracture
Orientation
s
1 100 100 60 05 Top single Vertical
2 100 100 60 05 Bottom Single Vertical
3 100 100 60 05 Multi-Perforation Vertical
4 100 100 35 05 Top single Vertical
5 100 100 35 05 Bottom Single Vertical
6 100 100 35 05 Multi-Perforation Vertical
7 60 100 60 05 Multi-Perforation Vertical
8 40 100 60 05 Multi-Perforation Vertical
9 100 100 60 05 Multi-Perforation Inclined
10 100 4070 60 05 Multi-Perforation Vertical
11 100 2040 60 05 Multi-Perforation Vertical
To perform these experiments the expermintal procedure used is as follows
1 The fracture slot was filled with only fracture fluid In our case slickwater to mimic
the pad stage on the hydraulic fracturing treatment
2 The mixer was turned on and proppant was added The proppant concentration was
05 ppg in order to make the slurry
3 The slurry was pumped into the fracture slot at different shear rate (60119904minus1 35119904minus1
and 8119904minus1) The injection process was continued until no change could be observed
in the dimensions of the proppant dune bed inside the fracture
4 High-resolution cameras were used to capture and record the proppant transport
during the experiments
5 The captured videos were tracked and analyzed using a video analysis MATLAB
code
101
6 All the above procedures were repeated for all the experiment cases mentioned in
Table 2
24 EXPERIMENT ANALYSIS APPROACHES
The experiment results were analyzed using the following calculation parameters
241 Equilibrium Dune Level (EDL) Equilibrium dune level (EDL) is the ratio
of sand dune height to fracture model height multiplied by 100 It is measured by using
the program Plot Digitizer where the fracture slot height is divided to the highest point of
proppant bed inside the fracture The ratio between proppant dune to fracture height can be
obtained by applying the following equation (Alotaibi and Miskimins 2018)
Equilibrium Dune Level (EDL) = 119864119902119906119894119897119894119887119903119894119906119898 119889119906119899119890 ℎ119890119894119892ℎ119905
119865119903119886119888119905119906119903119890 119904119897119900119905 ℎ119890119894119892ℎ119905times 100 (1)
242 Proppant Dune Level Development (PDLD) Proppant dune level
development (PDLD) is defined as the ratio between proppant dune levels before reaching
EDL to the EDL Kadhim et al (2017)
Proppant Dune Level Development (PDLD) = 119863119906119899119890 119871119890119907119890119897 (119863119871)
119864119902119906119894119897119894119887119903119894119906119898 119889119906119899119890 ℎ119890119894119892ℎ119905 (119864119863119871)times 100 (2)
243 Equilibrium Dune Length (EDX) Proppant dune length (EDX) is defined
as the ratio between the average dune lengths to the fracture model length multiplied by
100 as shown by the following equation
Fracture propped area (FPA) =119886119903119890119886 119900119891 119901119903119900119901119901119886119899119905 119889119894119904119905119903119894119887119906119905119890119889 119894119899 119905ℎ119890 119891119903119886119888119905119906119903119890
119879119900119905119886119897 119891119903119886119888119905119906119903119890 119886119903119890119886 (3)
244 Pressure Losses Calculations Since the pressure loss across the fractures
is a function of flow rate of the fluid pressure losses effect calculations were investigated
to study the effect of pressure loss across fracture on fracture propped area Typically the
102
following equation (Clark and Zhu 1996) is used to calculate the pressure drop across the
fracture slot
∆119875 = 12119897120583119876119904
ℎ1199083 (4)
where ∆P is the pressure losses across the slot in psi Qs is the slurry flowrate in cm3s μ
is the slurry viscosity in poise h l w are the slot dimensions high and length in cm
respectively
3 RESULTS AND ANALYSIS
31 NUMBER OF PERFORATION EFFECT
To study the perforation impact on proppant transport a 100 perforation opening
size high shear rate 60 (1s) fracture orientation (vertical fracture) proppant size 100 mesh
were used Figure 2 illustrates that changing the number of perforations at first FPV had
similar results in terms of height of proppant and distance the proppant travels inside the
fracture For instance at the first FPV all change the perforation position from the top
perforation system to bottom perforation system had the same delivered amount of
proppant where the fluid carried proppant farther than 56 cm of the fracture length (Xf)
As well as using multi-perforation system at first FPV had the same Xf of proppant as the
single point system At the beginning of injection treatment the fracture propped area looks
similar Later of this treatment the fracture propped area changes because the contribution
of perforations were changed
Figure 3 presents the EDL of different perforation numbers A multi-perforation
system setup used consists of four perforations single-perforation system (top perforation
103
and bottom perforation) The results show that EDL varied tediously in all cases For
example the EDL of the top perforation (single point) was around 71 whereas the EDL
of the multi-perforation system was about 67 Therefore the changes in EDL are very
small between the two different perforation systems
Figure 2 Effect of number of perforations at first FPV
Interestingly Figures 4 and 5 display how different numbers of perforations can
influence the fracture propped area Contribution of proppant transport during top
perforation (single point) leads to have better results compared to a multi-perforation
system Approximately 66 and 48 of fractures were propped using top perforation and
multi-perforation respectively Based on this findings limited-perforation system would
have probably better propped fracture area compared to multi-perforation system
0
5
10
15
20
25
30
0 10 20 30 40 50 60
Fra
ctu
re h
eig
ht
cm
Distance from fracture inlet cm
Top Perf (single inlet) Bottom Perf (single inlet) Multi-Perf System
104
Figure 3 Effect of number of perforations on EDL
Figure 4 Effect of number of perforations on fracture propped area
Figure 5 Real picture of experiment results shown number of perforation effect on
proppant transport Top-perf (left) Bottom-perf (middle) and Multi-perf (right)
0
10
20
30
40
50
60
70
80
90
100
Top - Perf (single Perf) Bottom-Perf (single
Perf)
Multi-Perf
Eq
uil
ibri
um
du
ne
lev
el
(ED
L)
Number of Perforation
0
20
40
60
80
100
Top - Perf (single Perf) Bottom-Perf (single Perf) Multi-PerfFra
ctu
re p
rop
ped
are
a
Number of perforation
Slu
rry
ou
tlet
Top-Perf (Single Perf) Bottom-Perf (Single
Perf) Multi-Perf
Slu
rry
in
let
inje
cti
on
105
32 PERFORATION OPENING SIZE EFFECT
To study the perforation opening size impact on proppant transport 100 60
40 perforation opening size high shear rate 60 (1s) fracture orientation (vertical
fracture) proppant size 100 mesh and multi-perforation system were used Figure 6 shows
that at the first FPV proppant is transported farther by decreasing the perforation opening
size from 100 to 40 because fluid velocity increases with decreasing perforation
diameter To illustrate this at the first FPV the Xf of proppant inside the fracture was 56
cm 52 cm and 48 cm from the fracture inlet of 40 60 and 100 perforation opening
size respectively
Gruesbeck and Collins (1982) noticed that changing the perforation diameter from
38 to frac12 inch did not affect proppant transport performance However our study results do
not completely agree with their conclusion In 60 perforation opening size case the EDL
reached to over 80 EDL which represented almost 17 of the EDL higher than both
perforation opening size cases 100 and 40EDL as shown in Figure 7
Figure 6 Effect of perforation opening size at first FPV
0
5
10
15
20
25
30
0 10 20 30 40 50 60
Fra
ctu
re h
eig
ht
cm
Distance from fracture inlet cmMulti 100 opening Perf Multi 60 opening Perf
106
Figure 7 Effect of perforation opening size on EDL
Figures 8 and 9 show a similar trend for fracture propped area where decreasing
perforation opening size to 60 leads to a 21 increase in fracture propped area compared
to the100 opening When the opening size was decrease to 40 only a 3 impact on
fracture propped area was observed compared to 100 fully opened perforations
Figure 8 Real picture of experiment results shown perforation opening size effect on
proppant transport perf opening 100 (left) perf opening 60 (middle) and perf
opening 40 (right)
0
10
20
30
40
50
60
70
80
90
100
Opening 100 Opening 60 Opening 40
Eq
uil
ibri
um
du
ne
lev
el (
ED
L)
Perforation opening size
Slu
rry
in
let
inje
ctio
n
Slu
rry
ou
tlet
prod
uct
ion
Perf Opening 60 Perf Opening 40 Perf Opening 100
107
33 SHEAR RATE EFFECT
To study the shear rate impact on proppant transport 100 perforation opening
size multi-perforation system fracture orientation (vertical fracture) and proppant size
100 mesh were all kept constant for this investigation Figure 9 based on results attained
from the first FPV proppant reached farther into fracture tip at high shear rate of 60 119904minus1
with a hight height around 2 cm of the total fracture height in the sand bed At a low shear
rate of 35 119904minus1 poppant did not transport deep and proppant height was larger with
approximately 4 cm proppant height Overall it could be said that at the beginning of
fracture treatment higher shear rates can form a smaller proppant bed and a longer
distribution close to the fracture tip while at low shear rates there is less proppant
distribution and larger sand beds
Figure 9 Effect of fracture shear rate at first FPV
Figure 10 amp11 show EDL inside the fracture at high (60119904minus1) and low shear rate
(35119904minus1) At low shear rate proppant bank formed near wellbore whereas However due to
0
5
10
15
20
25
30
0 10 20 30 40 50 60
Fra
ctu
re h
eig
ht
cm
Distance from fracture inlet cm
Multi system - 60 S-1 Multi system - 35 S-1 Multi system - 8 S-1
108
vertexes around wellbore proppant bank moved farther because swirls play major
mechanism during proppant transportat so proppant bank near well wellbore is less In
contrast decreasing shear rate leads to high proppant dune level and much proppant
accumulate near wellbore Erosional effects play a major role at high shear rates which
majorty affecte EDL This consistency in results with ALotibi at al (2015) confirming that
better proppant performance can be obtained by applying a lower shear rate
Figure 12 shows the EDL as a function of shear rate At low shear rates increasing
the settling velocity increases EDL by 78 while the increasing shear rate to 60119904minus1 caused
increased erosional forces and decreases EDL by 65 Generally these results implied that
equilibrium dune level is inversely proportional with shear rate
Figure 10 Real picture of experiment results shown shear rate effect on proppant
transport high shear rate (left) and low shear rate (right)
Slu
rry
ou
tlet
pro
du
ctio
n
Shear Rate 60119956minus120783
Slu
rry
in
let
inje
ctio
n
Slu
rry
ou
tlet
pro
du
ctio
n
Shear Rate 35119956minus120783
Slu
rry
in
let
inje
ctio
n
109
Figure 11 Effect of high (60119904minus1) and low (35119904minus1shear rates on EDL
Additionally Figure 13 showed that varying shear rate from 60 119904minus1 to 35 119904minus1
causes a 23 reduction in fracture propped area Decreasing fracture propped area can
negatively affect fracture conductivity and reduce productivity of the well These results
agree with previous work done by Melhotra (2016) and Li et al (2016) whose results
found that increasing injection rate leads to a decrease in the dune height level
Figure 12 Effect of shear rate on EDL
0
5
10
15
20
25
30
0 10 20 30 40 50 60
Fra
ctu
re h
eig
ht
cm
Distance from fracture inlet cm
High shear
rate
0
20
40
60
80
100
Eq
uil
ibri
um
du
ne
level
(ED
L)
Shear rate (1s)
35 60
110
Figure 13 Effect of shear rate on on fracture propped area
34 FRACTURE ORIENTATION EFFECT
To study the fracture orientation impact on proppant transport 100 perforation
opening size multi-perforation system high shear rate of 60 (1s) and proppant size 100
mesh were all kept constant variables Figure 14 shows proppant transport behavior at the
first FPV of the fracturing treatment Results show that proppant amount had delivered
deeper to fracture tip in inclined fracture compared to vertical fracture At the fracture tip
proppant dune height in inclined fracture was three times (3 cm) the proppant dune height
(1 cm) in vertical fracture The placement of proppant transport during vertical fractures
remaining stable on proppant bed The reason behind this is that in vertical fractures three
forces (gravity buoyancy drag) control particle settling whereas in inclined fractures in
addition to the original three forces frictional forces dominate the particles movements and
reduce proppant settling velocity
0
20
40
60
80
100
Frc
act
ure
pro
pp
ed a
rea
Shear rate (1s)
35 60
111
Figure 14 Effect of fracture orientation (vertical vs inclined) at first FPV
Figure 15 shows the fracture orientation effect on equilibrium dune level In
inclined fractures EDL is larger than in vertical fractures because reduction in settling
velocity is a function of friction forces Ba Geri et al (2018) As a result 13 of EDL
enhancement occurred in inclined fractures compared to vertical fractures
Figure 15 Effect of fracture orientation (vertical vs inclined) on EDL
0
5
10
15
20
25
30
0 10 20 30 40 50 60
Fra
ctu
re h
eig
ht
cm
Distance from fracture inlet cm
Vertical Fracture
Inclined Fracture
0
10
20
30
40
50
60
70
80
90
100
Inclined Vertical
Eq
uil
ibri
um
du
ne
lev
el (
ED
L)
Fracture Orientation
112
Figures 16 and 17 show the fracture orientation effects on fracture propped area
The fracture propped area was around 52 and 48 in the inclined fracture and vertical
fracture respectively This result indicated that fracture propped area has the same trend
as EDL which is around 8 improvement on fracture propped area noticed in inclined
fracture compared to vertical fracture This result might imply that inclinded fracture could
have better fracture conductivity compared to vertical fracture These observations
matched our previous experimental results Ba Geri et al (2018) and simulation work
results Kou et al (2018) where both confirmed that proppant transport efficiency ismuch
better in inclined fractures than in vertical fractures
Figure 16 Effect of fracture orientation (vertical vs inclined) on fracture propped area
0
20
40
60
80
100
Inclined Vertical
Frc
act
ure
pro
pp
ed a
rea
Fracture orientation
113
Figure 17 Real picture of experiment results shown perforation opening size effect on
proppant transport inclined fracture (left) and vertical fracture (right)
35 PROPPANT SIZE DISTRIBUTION EFFECT
To study the proppant size impact on proppant transport 100 perforation opening
size multi-perforation system high shear rate 60 (1s) and fracture orientation (vertical
fracture) were all kept constant during experiment Figure 18 shows proppant height in the
fracture as a function of proppant traveled distance from fracture inlet at 1st FPV Due to
the size effect it is clearly observed that using large proppant size 2040 settled near the
wellbore whereas small proppant sizes (100 mesh and 4070 mesh) settled uniformly across
the whole fracture section The results observed form using proppant size 2040 mesh
showed that proppant height near wellbore was 6 cm while the proppant height decrease
farther from wellbore inlet to about 2 cm in fracture center and fracture tip In contrast
using small size of proppant like 100 mesh formed same level of proppant height along the
fracture slot without any significant change near wellbore
Slu
rry
in
let
inje
ctio
n
Inclined Fracture
Slu
rry
ou
tlet
prod
uct
ion
Vertical Fracture
114
Figure 18 Effect of proppant size at first FPV
Figure 19 shows that there is a linear relationship between equilibrium dune level
and proppant size distribution The EDL is increased rapidly from 67 to 90 when size
of proppant increased from 100 mesh to 2040 mesh at higher shear rate 60119904minus1
respectively The results agree with Tong et al (2016) including that equilibrium dune level
increased with increasing proppant size at higher shear rates
Figure 19 Effect of proppant size on EDL
0
5
10
15
20
25
30
0 10 20 30 40 50 60
Fra
ctu
re h
eig
ht
cm
Distance from fracture inlet cm
100 mesh
4070 mesh
2040 mesh
0
20
40
60
80
100
100 4070 2040Eq
uil
ibri
um
du
ne
lev
el (
ED
L)
Proppant size mesh
115
Figure 20 Effect of proppant size on on fracture propped area
Figures 20 and 21 present the effect of proppant size on fracture propped area The
graph shows that increasing proppant size cause a reduction in proppant settling velocity
and proppant bank formed around wellbore as shown when 2040 proppant size used On
contrast using a small size of proppant such as 100 mesh leads to less proppant FPA
Interestingly 4070 proppant size provided the best results where FPA almost close of
2040 FPA
Figure 21 Real picture of experiment results shown proppant size effect on proppant
transport 100 mesh (left) 4070 mesh (middle) and 2040 mesh (right)
0
10
20
30
40
50
60
70
80
90
100
100 4070 2040
Fra
ctu
re p
rop
ped
are
a
Proppant size mesh
Slu
rry
ou
tlet
prod
uct
ion
Slu
rry
in
let
inje
ctio
n
100 Mesh 4070 Mesh 2040 Mesh
116
4 DISCUSSION
41 EFFECT OF PRESSURE LOSS ALONG THE FRACTURE SLOT ON
PROPPANT TRANSPORT PERFORMANCE
Figures 22 a and b show pressure difference across fracture calculated from
equation 5 and propped fracture area as a function of slurry shear rate Results show a linear
relationship between pressure loss across fracture and propped fracture area with shear rate
Fracture treatments using high shear rate bcause high pressure drops in the fracture which
decreasing fracture propped area by 23 compared to using low shear rates
Figure 22 a and b pressure loss along fracture slot on shear rate (left) and shear rate
effecton Fracture propped area (right)
Applying equation (5) to calculate pressure drop across fracture slot is shown in
Table 3 Linear relationship between pressure losses and EDL and Xf at 1st fracture pore
volume (FPV) was noticed At the beginning of injection treatment high shear rate 60119904minus1
delivered the proppant fracture to fracture tip 54 cm with EDL 158 cm In contrast we
noticed that by decreasing the shear rate to 35119904minus1 the EDL was 41 cm while the proppant
to 50cm of fracture length As result of increasing shear rate changing on EDL and
0
20
40
60
80
100
Frc
act
ure
pro
pp
ed a
rea
Shear rate (1s)
35 60
0
5
10
15
20
Shear Rate (1s)
ΔP
acr
oss
fra
ctu
re s
lot
psi
60 35 8
117
proppant Xf occurred because the pressure loss across the fracture increased from 98 psi
to 162 psi
Table 3 Shows pressure losses effect at 1st FPV on EDL and Xf
At 1st FPV
Shear
rate (119904minus1)
ΔP across
slot (psi)
EDL
(cm)
Xf
(cm)
High 60 162 158 54
low 35 98 41 50
42 MECHANISMS OF PROPPANT TRANSPORT
The mechanisms of developing proppant transport within the fracture slot are
summarized in Table 5 Proppant dune level development (PDLD) was used to determine
the dominate mechanism of each stage of these foure stages by applying Eqaution
421 Stage 1 Hindered and Free Settling This stage occurs when EDL started
forming height and continues until the of PDLD is 15 and the buildup angle is between
0deg to 93deg Due to increasing of sand dune height at the beginning of this stage proppant
particles do not roll inside the fracture Thus large size 2040 mesh of proppants were
moving as clusters or groups and spread along the fracture referring as ldquohindered settlingrdquo
While changing proppant size to the fine particles 100 mesh settled freely farther in
fracture
422 Stage 2 Saltation In this stage PDLD reaches 15 to 42 while the buildup
angle ranges from 93deg to 193deg Saltation is the only mechanism observed in this stage due
to lift force of the proppant The physical dynamics of the is lifting force plays a major role
in moving the particles by causing the proppant to jump and leave the sand bed surface
118
Because of the speed difference between the flow above and below the particles the
pressure difference acts as a liftting force Therefore the particle jumps and leaves as a
result of the force caused by the pressure difference exceeding the force of gravity Around
18 of PDLD is developed in this stage leading to reduction in the cross-section flow
area
423 Stage 3 Suspension Rolling and Swirl at Inlet This stage occurrs when
PDLD is between 42 to 71 and the buildup angle is from 193deg to 26deg Three different
mechanisms dominate proppant performance and transport within the fracture suspension
rolling and swirl at the inlet Erosional forces increased causing rolling of the proppant on
the sand bed due to the particle drag force being higher than the gravitational force The
major development above 30 of EDL happened in this stage leading to the presence of
swirl and vortices at the inlet due to high flow turbulence Therefore proppant transport
efficiency is dominated mainly by these vortices
424 Stage 4 Saltation Rolling and Swirl at Inlet This stage occurrs when
PDLD is between 71 and 100 and the buildup angle is between 26deg to 42deg The
combination of three mechanisms controls the proppant transport performance saltation
rolling and swirl at the inlet The vortices which assist in forming the proppant pile shape
The vortex diameter can sometimes be 15 the fracture half-length
The dynamic oscillatory-shear measurements were conducted to measure the
elasticity profile characterizations and first normal stress N1 The oscillatory test was
implemented over a range of frequencies from 001-100Hz All rheological properties
measurements were conducted at lab and high temperature ranges
119
Table 4 Four proppant transport mechanisms to reach the PDLD
425 Thermal Stability Measurement The influence of temperature during
fracturing operations has not been fully understood in shale oil reservoirs This paper
investigated the effect of thermal stability of rheology characterizations of HVFRs which
tends to alter parameters such as time dependency fluid elasticity viscosity and first
normal stress To better mimic the real fracturing process the experiments were performed
under elevated temperatures by using an advanced rheometer Viscosity-shear profile
measurements for three different temperatures of 77 122 176 have been conducted
for both HVFRs and linear gel fracture fluids
426 Static Settling Velocity Measurement At this point the graduated cylinder
is filled with HVFR and the cell is positioned vertically To measure proppant settling
120
velocity in unconfined fluids high-resolution video camera is used to record the settling
process In this setup proppant diameter ranged from 0453 mm to 6 mm A single proppant
was dropped in the HVFR and allowed to settle A high-resolution video camera has been
used to capture the process of free proppant settling An image analysis tool called
ldquoTrackerrdquo ( httpwwwcabrilloedu~dbrowntracker) was applied to get accurate
measurements of vertical position of the proppant at different time steps (Ba Geri et al
2018) The slope of relationship between proppant vertical positions to steps time step is
called terminal settling velocity For more accurate results settling velocity of each particle
were repeated three times
5 CONCLUSIONS
This laboratory study investigated several factors that affect proppant transport
efficacy It has provided new and interesting perceptions into the understanding of proppant
placement and distribution across the fracture The following conclusions can be drawn
from this work
bull Limited-entry technique has a large impact on proppant transport within fractures A
single top perforation had a 27 improvement in the fracture propped area compared
to a multi-perforation system
bull High shear rates have negative effects on the EDL and fracture propped area Increasing
the shear rate caused a decrease in both the EDL by 17 and on fracture propped area
by 23
121
bull Decreasing the perforation opening size can help proppant to travel closer to the
fracture tip at the beginning of the treatment A 60 perforation opening size provided
better results in terms of the EDL and fracture propped area
bull Pressure loss in the fracture slot leads to a decrease in the EDL and fracture propped
area Pressure losses were found to get significantly affected by changing shear rate
from 60119904minus1 to 35119904minus1
bull Four proppant transport mechanisms were noticed that could potential dominate
proppant transport behavior during fracturing treatments Vortices play a major role
when the dune height increases and accumulated near wellbore
REFERENCES
Alotaibi M A amp Miskimins J L (2018 May 1) Slickwater Proppant Transport in
Hydraulic Fractures New Experimental Findings and Scalable Correlation Society
of Petroleum Engineers httpsdoi102118174828-PA
Ba Geri M Imqam A amp Dunn-Norman S (2018 October 5) Proppant Transport
Behavior in Inclined Versus Vertical Hydraulic Fractures An Experimental Study
Society of Petroleum Engineers httpsdoi102118191813-18ERM-MS
Daneshy A A (1973 April 1) A Study of Inclined Hydraulic Fractures Society of
Petroleum Engineers httpsdoi1021184062-PA
Dinh A V amp Tiab D (2010 December 1) Transient-Pressure Analysis of a Well with
an Inclined Hydraulic Fracture Using Type Curve Matching Society of Petroleum
Engineers httpsdoi102118120540-PA
Gruesbeck C amp Collins R E (1982 December 1) Particle Transport through
Perforations Society of Petroleum Engineers httpsdoi1021187006-PA
Kadhim D Imqam A amp Dunn-Norman S (2017 July 24) Ceramic Proppant Transport
and Placement in Heterogeneous Fracture Systems Unconventional Resources
Technology Conference httpsdoi1015530URTEC-2017-2697613
122
Kern L R Perkins T K amp Wyant R E (1959 July 1) The Mechanics of Sand
Movement in Fracturing Society of Petroleum Engineers
httpsdoi1021181108-G
Kou R Moridis G J amp Blasingame T A (2018 January 23) Analysis and Modeling
of Proppant Transport in Inclined Hydraulic Fractures Society of Petroleum
Engineers httpsdoi102118189856-MS
Liu He Zhang Guangming Zhang Jin et al (2010 May) Friction calculation and surface
pressure presiction in oil well hydraulic fracturing Chinese Journal of Rock
Mechanics and Engineering Vol 29 Supp 1
McMechan D E amp Shah S N (1991 August 1) Static Proppant-Settling Characteristics
of Non-Newtonian Fracturing Fluids in a Large-Scale Test Model Society of
Petroleum Engineers httpsdoi10211819735-PA
Medlin W L Sexton J H amp Zumwalt G L (1985 January 1) Sand Transport
Experiments in Thin Fluids Society of Petroleum Engineers
httpsdoi10211814469-MS
Miller C K Waters G A amp Rylander E I (2011 January 1) Evaluation of Production
Log Data from Horizontal Wells Drilled in Organic Shales Society of Petroleum
Engineers httpsdoi102118144326-MS
Patankar NA Joseph DD Wang J Barree RD Conway M and Asadi M 2002
Power Law Correlations for Sediment Transport in Pressure Driven Channel Flow
International Journal of Multiphase Flow Vol 28 Pg 1269 ndash 1292
Sahai R Miskimins J L amp Olson K E (2014 February 4) Laboratory Results of
Proppant Transport in Complex Fracture Systems Society of Petroleum Engineers
httpsdoi102118168579-MS
Tong S amp Mohanty K K (2016) Proppant transport study in fractures with
intersections Fuel 181 463-477
Wang J Joseph DD Patankar NA Conway M and Barree RD 2003 Bi-Power
Law Correlations for Sediment Transport in Pressure Driven Channel Flows
International Journal of Multiphase Flow Vol 29 Pg 475 - 494
Warpinski N R (2010 November 1) Stress Amplification and Arch Dimensions in
Proppant Beds Deposited by Waterfracs Society of Petroleum Engineers
httpsdoi102118119350-PA
123
Willingham J D Tan H C amp Norman L R (1993 January 1) Perforation Friction
Pressure of Fracturing Fluid Slurries Society of Petroleum Engineers
httpsdoi10211825891-MS
Woodworth T R amp Miskimins J L (2007 January 1) Extrapolation of Laboratory
Proppant Placement Behavior to the Field in Slickwater Fracturing Applications
Society of Petroleum Engineers httpsdoi102118106089-MS
Wright C A amp Conant R A (1995 January 1) Hydraulic Fracture Reorientation in
Primary and Secondary Recovery from Low-Permeability Reservoirs Society of
Petroleum Engineers httpsdoi10211830484-MS
124
V VISCOELASTIC CHARACTERIZATION EFFECT OF HIGH-VISCOSITY
FRICTION REDUCERS AND PROPPANT TRANSPORT PERFORMANCE
IN HIGH-TDS ENVIRONMENT
Mohammed Ba Geri1 Abdulaziz Ellafi2 Ralph Flori1 Jerry Noles3 and Sangjoon Kim3
1 Deparment of Petroleum Engineering Missouri University of Science and Technology
Rolla MO 65409
2 Department of Petroleum Engineering University of North Dakota Grand Forks ND
58202
3 CoilChem LLC Washington Oklahoma
ABSTRACT
The viscoelastic property of high-viscosity friction reducers (HVFRs) was
developed as an alternative fracturing fluid system because of advantages such as the
ability to transport particles higher fracture conductivity and the potential of a lower cost
due to fewer chemicals and equipment required on location However concerns remain
about using HVFRs to transport proppant in DI water and harsh brine solutions (eg 2wt
KCl and 10 lbs brine) The primary objective of this study is to investigate the viscoelastic
property in order to understand the true proppant transporting capacity of fracturing fluids
in a high-TDS environment
To address the evaluation performance of HVFRs numerous papers associated
with the viscoelastic property of hydraulic fracturing fluids were investigated and
summarized This paper also provides a full comparison study of viscosity and elastic
modulus between HVFRs and among fracturing fluids such as xanthan polyacrylamide-
based emulsion polymer and guar Moreover viscosity profiles and elastic modulus were
125
conducted at different temperatures Better proppant transportation effect though higher
viscosity through Stokersquos law and the effect on proppant transportation from the elastic
modulus comparison were also investigated Finally the results of the HVFR Conductivity
test and the successful field test were explained
The results of the experimental work show that the viscoelastic property of HVFRs
provides behavior that is able to transport proppant The viscosity profile decreased slightly
as the temperature increased from 75 to 150 when the DI water was used While using
10 lbs brine the viscosity was reduced by 33 The longer polymer chains of HVFR
indicated a better elastic modulus in DI water The elastic modulus also indicated that the
highest values were found at frequency 45 Hz from each amplitude and lower values were
found as the amplitude was increased Although high molecular weight HVFRs were
utilized on the conductivity test the results observed that the regained permeability was up
to 110 Finally the promising results from the case study showed that HVFRs could be
economically and efficiently used for the purpose of proppant transportation and pressure
reduction in high TDS fluids
1 INTRODUCTION
The ultimate aim of hydraulic fracturing treatments in horizontal wells is to increase
the flow and conductivity of unconventional oilgas reservoirs by creating a long fracture
from 100 to 1000 ft and a conductive fracture width in the order of a tenth of an inch The
success of the process strongly relies on selecting appropriate slurry fluids and proppants
since these factors govern the proppant transport to place and fill the conductive pathways
126
connecting with the proppant particles Furthermore the effective behavior of the proppant
distribution is essential to understand increasing the well productivity and economics
especially in the case of tight formations (Ba Geri et al 2018 Shrivastava and Sharma
2018) Therefore fracture fluids and proppants characterization are crucial parameters that
require detailed study in order to achieve a predictable and reliable performance as well as
avoiding the early proppant settling near the wellbore (Acharya 1988 Shah 1993)
Common fracturing fluids that have been used in industry are Newtonian fluids
such as slickwater and non-Newtonian viscous fluids with varying degrees of elasticity
including complex polymer solutions crosslinked foams emulsions and surfactant gels
Early in the shale boom high viscosity fluid conventional crosslinked gel was used as the
Frac fluid system in the formation such as the Bakken Formation to add viscosity and
create fracture width However the post-treatment production test indicates that the fluid
does not achieve the desired hydraulic fracturing design objectives because of its low
capability to carry proppant in the fractures Also field results reported high damage causes
with the high-cost operation as well as environmental concerns (Ba Geri et al 2019a)
Although 95 of fracture treatment jobs switched the pumping fluids to hybrid and
slickwater since their low cost and reaching proppant loading improved long term
production in most US shale plays the water-based fracturing stimulation requires an
enormous consumption of clean water to perform the treatments and tends to increase
environmental issues because of the large amount of flow back water which contains
chemicals and toxic components that impact underground water resources (Li and Zhang
2019) As a result slickwater fracturing fluid becomes undesirable and high viscosity
friction reducers (HVFRs) in fracturing fluids have recently been adopted for use in shale
127
plays since they are low cost and provide an effective proppant transport mechanism
(Harris et al 2009 Hu et al 2015 Gomaa et al 2015 Srinivasan et al 2018 Ellafi A et
al 2019 Ba Geri et al 2018 Ba Geri et al 2019 bampc)
In 1988 Acharya studied the settling rates of proppants and the rheological
parameters of two types of cross-linked gels (titanate and borate cross-linked) using
theoretical transport equations and experimental works This paper concluded that the
proppantrsquos characteristics and rheological parameters for fracturing fluids are crucial
considerations for modeling the proppant transport in hydraulic fracturing design
Moreover Shah (1993) investigated the rheological characterization of the various
concentrations of slurry fluid (hydroxypropyl guar (HPG)) in the range of 3040 and 60
Ibm HPGl000 gal to obtain the flow behavior as a result of differential pressure vs flow
rate into the experimental vertical-fracture-flow model This work used proppant sizes of
2040-mesh sand with three concentration values that varied from 0 to 12 Ibmgal at three
temperature conditions (80 110 and 140degF) The data that was gathered presented
correlations of apparent viscosity as a function of fluid concentration fracture shear rate
experiment temperature and proppant concentration Also the correlation can be used to
model 2D or 3D fracture-design simulators in order to estimate fracture geometry and
extension
In 2000 Samuel et al studied the application of viscoelastic surfactant in tight
formations to minimize fracture height growth and increase effective fracture length The
paper presented case studies for low permeability gas wells in Rock Springs Wyoming
and El Reno Oklahoma Field results based on the pressure transient analysis and tracer
indicated that the viscoelastic surfactant fracturing fluid was more beneficial as fracture
128
fluid treatments in both unconventional and conventional formations compared to
traditional and new generations of cross-linked gels
Furthermore Asadi et al (2002) discussed the method for obtaining fracturing
fluids with zero shear viscosity and how this factor is important to evaluate model and
predict the proppant transport in hydraulic fractures Viscoelastic parameters of the
fracturing fluids were measured as a function of oscillatory frequency to determine zero
shear viscosity by involving Maxwellrsquos model at various relaxation times The authors
reported examples and a detailed explanation on the methodology of the fluid viscosity
elasticity and relaxation time measurements to obtain the zero-shear fluid viscosity In
2005 Harris et al conducted an experimental work on fracturing fluids such as metal and
borate crosslinked fluids linear gel fluids and surfactant gel fluids to show how these
fluid types are different in terms of proppant transport by considering the size and
concentration of proppants using a modified Fann Model 50-type viscometer The
experiment outcomes divided fracturing fluids into three major fluid classes with different
capabilities to transport proppant by considering fracture transport velocity a permanent
network structure and a transient network structure
After that Harris et al (2008) compared three measurement techniques steady
shear measurements dynamic oscillatory shear measurements and slurry viscosity The
approaches were applied to the same fracturing fluids in a previous study for verification
of transport prediction Moreover Walters et al (2009) introduced a new clean
biopolymer-based fracturing fluid that has high conductivity stable viscosity low pipe
friction excellent proppant transport and the capability to be used with produced water
They discussed field trials of 14 frac stages over four wells Based on their evaluation this
129
fracturing treatment fluid can provide excellent proppant transport with high fracture
conductivity in tight formations In 2015 Gomaa et al studied the minimum rheological
properties required for effective transport behavior of the proppants by using combinations
of rotational and oscillatory measurements They observed that fracturing additives may or
may not enhance the carrying of the proppants based on the internal fluid structure
Furthermore Hu et al (2015) examined the settling behavior of the carboxymethyl
hydroxypropyl guar (CMHPG) crosslinked with borate by correlating with the rheological
properties of the fluids The authors concluded that the main mechanisms during proppant
transport to enhance particle suspension or transportation are shear thickening and elastic
lifting The research outcome provided guidance to develop the chemistry of fracturing
treatment fluids Huang et al (2018) conducted experimental research to study the effect
of injection parameters on the proppant transport behavior by using different polymer
concentrations in rough vertical hydraulic fractures The results showed that effective
vertical proppant flow occurred when a high polymer slurry concentration was used
In 2018 Aften studied five HVFRs to investigate the viscosities and apply eight
factors for example temperature hydration approach polymer concentration brine
composition additive interaction and pumping and tubular transport using response
surface methodology This study established a reliable approach for gauging performance
and examining the field operations of HVFR systems in a high-TDS environment Finally
Ba Geri M et al (2019 a b c amp d) conducted several studies on HVFR fluids to
investigate the rheological behavior and its effect on the static proppant settling velocity
The research outcomes showed interesting insights into the understanding of high viscous
friction reducer fracture fluids compared to linear gel and slickwater fracture fluids To
130
evaluate the performance of HVFRs on proppant transport a comprehensive literature
review was developed including laboratory work simulation investigation and field case
studies that were summarized and analyzed to understand the viscoelasticity properties of
HVFRs
This research aims to investigate the viscoelastic property that can help to
understand the true proppant transport capacity of fracturing fluids To evaluate HVFRs
performance a full comparison study between HVFRs and three different fracturing fluids
such as xanthan polyacrylamide-based emulsion polymer and guar was provided These
fracturing fluids were examined on different water quality DI water 2 wt KCl and 10
lbs brine (saturated NaCl Solution (TDS 347000 ppm)) In addition viscosity profiles
and elastic modulus were conducted at different temperatures also proppant settling rates
were tested Finally successful field implementations using the new HVFR system were
fully explained
11 PRODUCED WATER IN USA BASINS
Using produced water instead of fresh water is gaining traction to minimize
freshwater usage reduce environmental impacts and increase hydrocarbon recovery from
unconventional formations However generally polymer friction reducers perform more
poorly in high salinity waters High salinity produced waters are more common in the
Marcellus the Permian and the Bakken basins with TDS (total dissolved solids) levels
measured at 43000 ppm 350000 ppm and over 225000 ppm respectively (Be Geri M
et al 2019a Whitfield S 2017)
131
A high salinity environment and hardness are the main barriors to using produced
water as a fracturing fluid-based system due to their negative effect on the fracture fluid
elastic profile as well as the hydration process required to build up enough viscosity to
carry or transport proppant The lifetime and the magnitude of the viscoelastic property of
fracturing fluids depends on several factors such as the source of water (eg levels of TDS
and hardness) polymer dosage fluid pH and test temperature (Li L et al 2014) Thus
switching based-fracturing fluids from fresh water to a high-TDS water system was not an
easy task for the operators and service oil companies
This research used a new high viscosity friction reducer (HVFR) as an alternative
fracturing fluid for downhole conditions with temperature ranges between 150 to 250
The HVFR system proved compatible with high-TDS environments that exceed 340000
ppm Four different fracturing fluids (HVFR xanthan polyacrylamide emulsion polymer
and guar) were tested The HVFR displayed have better viscoelastic performance than the
other tested fluids for transporting the proppant
2 EXPERIMENT DESCRIPTION
21 EXPERIMENT MATERIALS
211 Fracturing Fluids Four different samples of friction reducers were
prepared HVFR xanthan polyacrylamide-based emulsion polymer and guar HVFR
xanthan and guar were slurries containing 3 lbs per gal The polyacrylamide emulsion
polymer was used by itself In this test each product sample was added in DI water 2 wt
KCl and 10 lbs brine (saturated NaCl Solution (TDS 347000 ppm)) following the ratio
132
of 2 gal per 10 bbl The HVFR is anionic polymer and the molecular weight is 18 to 26
million (gmole) Table 1 shows the molecular weight of the tested friction reducers
212 Frac Sand and Dosage To measure the settling rate Ottawa Frac Sand
2040 (particle density 2212 lbsgal) employed was The dosage of frac sand in each
HVFR fracturing fluid was 05 lbs per gallon
Table 1 The molecular weight of friction reducers
Friction Reducers Molecular Weight (gmole)
HVFR 18000000-26000000
Xanthan 1000000-7000000
Emulsion 6000000-11000000
Guar 50000 ndash 8000000
22 MEASUREMENTS OF RHEOLOGICAL PROPERTY
Based on the hydraulic fracturing industry practice the shear rates while pumping
the fluid slurry into the fractures are within the range 10 119904minus1 to 170 119904minus1as well as 511 119904minus1
to determine fluid apparent viscosity In lab studies the common shear rate was either 40
119904minus1 or 100 119904minus1 (Hu et al 2015 Gomaa et al 2015 Ba Geri M et al 2019d)
221 Friction Reducers Preparation for Rheological Property Four friction
reducers were prepared HVFR xanthan polyacrylamide emulsion polymer and guar
HVFR xanthan and guar were dry powder and were mingled with modified base oil to be
compared with the viscosity profile of emulsion polymer The HVFR xanthan and guar
slurries contained 3 lbs of dry solid per gal The polyacrylamide emulsion polymer was
133
used by itself in this test Each product sample was added in DI water 2 wt KCl and 10
lbs brine (saturated NaCl solution (TDS 347000 ppm)) as the ratio of 2 gal per 10 bbl
222 Fracturing Fluid Viscosity Measurement This study investigated the
viscosity of fracturing fluids at share rates 40 119904minus1 100 119904minus1 and 170 119904minus1 Before measuring
the viscosity of each fracturing fluid the fluid was vigorously stirred in the beaker for 30
min The viscosity reading was set to two temperatures ambient 75 and 150
223 Elasticity Characterization (Elastic Modulus Grsquo) Several methods can
be used to measure the elastic properties of viscoelastic fluid such as the viscoelastic
characterization of the fracturing fluids N1 relaxation time the dynamic oscillatory
frequency test and the amplitude sweep test This study investigated the viscoelasticity
behavior of the tested fluid by testing dynamic oscillatory frequency through M5600
(Grace Instrument)
224 Friction Reducers Preparation for Elasticity Property HVFR xanthan
polyacrylamide emulsion polymer and guar were prepared to compare the elastic modulus
of each fracturing fluid Dry HVFR xanthan and guar were suspended in modified base
oil The slurry contained 3 lbs of active ingredient per gal In addition polyacrylamide
emulsion polymer was tested by itself The dosage rate of each slurry was 2 gal per 10 bbl
of DI water and 10 lbs brine solution The hydraulic fracturing fluid was stirred for 30
min prior to measuring the elastic modulus
225 Elastic Modulus Measurement The elastic modulus was measured by
oscillatory motion M5600 (Grace Instrument) was used for this test and set up with
frequencies in increments from 05 to 45 Hz by 05 Hz and amplitudes at 50 200 and
400 The elastic modulus value was calculated by averaging four times measurement
134
23 THE SETTLING RATE MEASUREMENT OF FRAC SAND IN HVFR
FRACTURING FLUID
231 HVFR Fracturing Fluid Preparation Four HVFR fracturing fluids were
prepared to research the frac sand settlement rate in a viscous solution The HVFR dosage
was 05 075 10 and 125 gal per 1000 gal of fresh water The HVFR fracturing fluid
was stirred for 30 min and then was poured into a 1000 ml round glass cylinder
232 Test Method on Frac Sand Settlement Rate Following the ratio of 05 lbs
of frac sand per 1000 gal of fracturing fluid frac sand was placed in a 1000 ml cylinder
The cylinder stopper was completely sealed to prevent fluid loss The cylinder was
vigorously shaken to disperse frac sand evenly in the cylinder for 20 sec As soon as the
cylinder was placed on the table the time was started and then stopped once all of the frac
sand had settled to the bottom of the cylinder The measurement was repeated three times
on each fracturing fluid and the values were averaged
3 RESULTS AND ANALYSIS
31 THE VISCOSITY PROFILES OF VARIOUS FRICTION REDUCERS IN DI
WATER 2 WT KCL AND 10 LBS BRINE (SATURATED NACL
SOLUTION (TDS 347000 PPM))
Of all fluid sources HVFR represented the highest viscosity as shown in Figures
1 2 and 3 while xanthan polyacrylamide emulsion and guar showed mixed results
depending on water conditions The viscosity variation in different water conditions might
be affected by molecular weight and chemical structure Table 1 shows the different
molecular weights of HVFR xanthan emulsion polymer and guar HVFR has a relatively
high molecular weights while xanthan emulsion polymer and guar have low molecular
135
weight At about 50 higher the molecular weight of HVFR helped it become heat resistant
and viscous in all types of fluids Thus the HVFR fracturing fluid system can suspend and
transport proppant deeper into the fractures Proppant suspension and transportation can be
explained by Stokersquos law which is covered by a later section in this paper proppant settling
rate result
From Figure 1 using DI water at a low shear rate of 40 sminus1 and increasing the
temperature from 75 to 150 caused the viscosity profile of HVFR to slightly decrease
from 14868 cp to 14147 cp respectively The same trend was noticed at a high shear rate
of 170 sminus1 In contrast Figure 3 shows that changing the water quality from DI water to
10 lbs Brine (Saturated NaCl Solution) at the low shear rate 40 119904minus1 caused the viscosity
of HVFR to drop sharply by 33 from 2724 cp to 1826 cp while increasing the
temperature from 75 to 150
The effect of fracture fluid on the viscosity profile can be illustrated by Figure 3
At room temperature 75 and high-TDS water both HVFR and guar indicated quite close
viscosity readings and both polyacrylamide emulsion and xanthan fluids exhibited similar
viscosity profiles however synthetic polymers HVFR and polyamide emulsion polymer
represented better viscosity reading This means that the synthetic chemical structure is
more heat resistant than guar and xanthan structures created by nature The results revealed
similar thermal properties of HVFR and emulsion polymer from the viscosity readings in
the 2wt KCl solution as well HVFR and emulsion showed less viscosity reduction than
guar and xanthan comparing the viscosity values at 75 and 150
136
Figure 1 The viscosity profile of various friction reducers in DI water
Figure 2 The viscosity profile of various friction reducers in 2wt KCl solution
Figure 3 The viscosity profile of various friction reducers in 10 lbs brine
0
40
80
120
160
200
Vis
co
sit
y (
cp
s)
at
75 O
F
Shear Rate (1s)
Dosage 2 gal per 10 bbl
Fluid DI water
HVFR
Xanthan
Polyacrylamide Emulsion
Guar
40 100 1700
40
80
120
160
200
HVFR
Xanthan
Polyacrylamide Emulsion
Guar
Dosage 2 gal per 10 bbl
Fluid DI water
Vis
co
sit
y (
cp
s)
at
15
0 O
F
Shear Rate (1s)
40 100 170
0
5
10
15
20
25
30
35
40
Vis
co
sit
y (
cp
s)
at
75
OF
Shear Rate (1s)
40 100 170
Dosage 2 gal per 10 bbl
Fluid 10 lbs brine solution HVFR
Xanthan
Polyacrylamide Emulsion
Guar
0
5
10
15
20
25
30
Dosage 2 gal per 10 bbl
Fluid 10 lbs brine solution HVFR
Xanthan
Polyacrylamide Emulsion
Guar
40 100 170
Shear Rate (1s)
Vis
co
sit
y (
cp
s)
at
150 O
F
137
32 THE N AND K VALUES OF VARIOUS FRICTION REDUCERS IN DI
WATER 2 WT KCL AND 10 LBS BRINE (SATURATED NACL
SOLUTION (TDS 347000 PPM))
Table 2 represents the values of n and K which are called flow behavior index
and flow consistency index respectively Flow behavior index determines rheological
properties Newtonian or non-Newtonian while flow consistency index measures the yield
stress of fluid As published in other papers all of the friction reducers in this test have
indicated a non-Newtonian fluid shear thinning as n value is less than 1 In Di water
HVFR showed the most shear thinning characteristics through the lowest n while guar
was less affected by the shear rate than others In 2 wt KCl and 10 lbs brine solutions
the n values of HVFR and k guar are relatively higher comparing to xanthan and emulsion
polymer It means the viscosity of HVFR and guar is less affected by the shear rate
increments Although considering the true viscosity value the higher n value may be
interpreted as better suspension effect on proppant transportation because the viscosity
reduction percentage from low shear rate to high shear rate should be smaller than other
cases with lower n value The viscosity reading at various shear rates and the n value
should be helpful to evaluate the capability of fracturing fluid to transport proppant
33 THE ELASTIC MODULUS COMPARISON OF VARIOUS FRICTION
REDUCERS IN DI WATER AND 10 LBS BRINE SOLUTION (TDS 347000
PPM)
Figure 4 shows the effect of frequency and amplitude on the elastic modulus The
elastic modulus was increased as the frequency was increased while the amplitude
increment lowered the elastic modulus
138
Table 2 The n and K values with viscosities reading of friction reducers in various
fluids
Fluids Friction
Reducers
Temp
(degF) n K
Visc
40(1s) cP
Visc
100(1s) cP
Visc
170(1s) cP
DI
Water
HVFR 76 022 471 14868 7252 4786
150 015 579 14147 6493 4136
Xanthan 802 033 178 8693 4726 332
151 037 131 7242 4067 2912
Emulsion
Polymer
81 037 077 4336 2443 1753
151 031 081 3587 1903 1319
Guar 80 060 016 2053 1426 1155
151 054 011 1148 752 589
2
wt KCl
HVFR 744 055 031 3299 219 1728
151 047 029 2276 1401 1058
Xanthan 76 010 061 122 536 333
152 006 058 983 417 254
Emulsion
Polymer
74 036 038 2041 1135 807
151 024 052 1835 918 615
Guar 746 052 025 2373 1526 1181
151 041 024 151 879 643
10
lbs
Brine
Solution
HVFR 82 051 030 2724 1741 1344
151 049 022 1826 114 868
Xanthan 79 019 044 1232 585 38
1516 012 048 1018 453 284
Emulsion
Polymer
83 014 062 1439 654 414
151 009 078 1448 626 385
Guar 79 061 021 2742 1925 1568
151 056 012 1326 889 705
This means that the physical activity of polymer is chains directly related with the
elastic modulus The short wavelength by frequency increment made polymer chains more
active in the solution and caused the increment of the elastic modulus The longer polymer
chains (higher molecular weight) of HVFR indicated a better elastic modulus in DI water
than the other tested fracturing fluids Figure 5 represents the elastic modulus of friction
reducers in 10 lbs brine at 75 150 and 250 First of all it was difficult to properly
139
interpret the elastic modulus characteristics of friction reducers at 150 and 250 because
the abundant cations in 10 lbs brine solution interrupted the hydration of the friction
reducers and furthermore the high temperature made the polymer chains loose Both
factors lowered elastic modulus values The very low the elastic modulus values at 150 and
250 in the 10 lbs brine solution might be caused by reading errors of the M5600
instrument Thus the results would observe only the elastic modulus in the 10 lbs brine at
75 guar elastic modulus seemed comparable with HVFR because the diol groups of
guars let the polymer chains crosslinked with cations (sodium) in 10 lbs bine solution The
increment of crosslinking density helped the elastic modulus improve
34 PROPPANT SETTLING RATE RESULT
The settling rate was calculated with the fluid height 3366 cm in a 1000 ml
cylinder and equalize frac sand settlement time (sec) Figure 6 represents the settling rate
of frac sand with various HVFR dosages The settling rate was reduced with HVFR dosage
increment This result can be explained using Stokersquos Law shown in equation (1) The
settling velocity and fluid viscosity are in inverse proportion to each other proving that the
relatively higher viscosity of HVFR represents better proppant transportation capability
when compared to other friction reducers such as xanthan and emulsion polymer The
results show that increasing the dosage of HVFR from 05 gpt to 125 gpt exhibited a slower
settling rate of the proppant by three times from 12 cms to 04 cms respectively
Stokersquos Law for Settling Solids
140
119881 =119892((
1205881120588
)minus1)1198892
18 υ (1)
Table 3 The effect of dosage of HVFRs on proppant settling rate
Figure 4 Frac sand settling rate comparison with various HVFR dosage
V Settling Velocity of the Solid
g acceleration of gravity
ρ1 Mass Density of the Solid
ρ Mass Density of the Fluid
d Diameter of the Solid (Assuming Spherical)
υ Kinematic Viscosity of the Fluid
Dosage per 1000 gal
(Polymer Concentration) Settling Rate (cms)
050 gal 117
075 gal 079
100 gal 060
125 gal 044
141
Figure 5 The elastic modulus measurement of HVFR xanthan emulsion polymer and
guar at 75 150 and 250 in DI water (left) 10 lbs brine solution (right)
35 HVFR ELASTIC MODULUS CHARACTERISTICS BY AMPLITUDE
FREQUENCY FLUID TYPE AND TEMPERATURE
As shown in Figures 7 8 and 9 the elastic modulus of HVFR could be determined
by amplitude frequency fluid type and temperature In this study the HVFR dosage was
2 gal per 10 bbl The elastic modulus of HVFR fracturing fluid was presented with various
frequencies and amplitudes in Figure 7 The frequencies and amplitudes affect the polymer
chains motion responding to the elastic modulus of fracturing fluid As shown in Figure
0
05
1
15
FR1405
Xanthan Gum
Emulsion Polymer
Guar Gum
At 250 OF
Ela
sti
c M
od
ulu
s (
G)
(d
yn
cm
2)
HVFR
0
02
04
06
08
1
FR1405
Xanthan Gum
Emulsion Polymer
Guar Gum
At 150 OF
Ela
sti
c M
od
ulu
s (
G)
(d
yn
cm
2)
HVFR
0
1
2
3
4
FR1405
Xanthan Gum
Emulsion Polymer
Guar Gum
At 75 OF
Ela
sti
c M
od
ulu
s (
G)
(d
yn
cm
2)
HVFR
Amplitude
50
Amplitude
200
Amplitude 400
Frequency 05-
0
5
10
15
20
25
30
35
40
Ela
sti
c M
od
ulu
s (
G)
(d
yn
cm
2)
At 250 OF
Xanthan
Emulsion Polymer
Guar
HVFR
0
10
20
30
40
50
60
Xanthan
Emulsion Polymer
Guar
Ela
sti
c M
od
ulu
s (
G)
(d
yn
cm
2)
At 150 OF HVFR
0
10
20
30
40
50
60
Ela
stic
Mo
du
lus
(G)
(dyn
cm
2 )
At 75 OF
Xanthan
Emulsion Polymer
Guar
HVFR
Amplitude 50
Frequency 05-
Amplitude 200
Amplitude 400
142
7 the elastic modulus indicated the highest values at the frequency 45 Hz from each
amplitude and lower values were indicated as the amplitude was increased The higher
wavelength raised the elastic modulus as the shear stress was increased while the higher
amplitude reduced the value of elastic modulus as stretching out the polymer chains length
ways and losing elastic property in result
This study will be useful for designing fracturing fluids with optimal proppant
transportation conditions The higher elastic modulus helps proppants suspended in fluid
by polymer chains activity Figure 8 shows the HVFR elastic modulus characteristics by
water condition Plenty of cations in the 10 lbs brine solution (TDS 347000 ppm)
hindered the chainsrsquo stretching of high molecular weight polymer and resulted in a low
elastic modulus The temperature also affected the elastic modulus of HVFR fracturing
fluid as presented in Figure 9 The elastic modulus readings at 250 were significantly
reduced as the polymer chains become slack
Figure 6 The elastic modulus characteristic of HVFR by amplitude and frequency at
room ambient
0
10
20
30
40
50
60
Elas
tic M
odul
us (G
)(dy
ncm
2 )
HVFR
Fluid DI water
Amplitude 50
Frequency 05-45 Hz
Amplitude 200
Frequency 05-45 Hz
Amplitude 400
Frequency 05-45 Hz
143
36 HVFR ELASTIC MODULUS PROFILES IN DI WATER amp 10 LBS BRINE
(TDS 347000 PPM)
Figure 8 presents elastic modulus Grsquo as a function of frequency (Hz) at 400
amplitude for 2 gal per 10 bbl of HVFR at two different water qualities DI water (left)
and high-TDS water with 10 lbs brine (right) Case I using DI water with HVFR provides
a strong elastic profile and linear relationship by increasing the test frequency the elastic
modulus Grsquo increase In contrast with case II at high-TDS (340000 ppm) the elastic
modulus increased until the frequency reached 2 Hz After that the elastic modulus
decreased sharply and came close to the zero dincm2
Generally speaking water salinity plays a key role in changing the fluid elasticity
negatively To illustrate at 2 Hz the elastic modulus was 1515 dyncm2 and 183 dyncm2
in both DI water and 10 lbs brine respectively The cations efficiency reduces in high-
TDS water due to the presence of high cations like magnesium and calcium causing
polymer precipitation These polyvalent ions in high-TDS environments can cause
electrostatic crosslink of the polymer which in tum causes precipitation Aften W (2010)
Figure 7The elastic modulus characteristic of HVFR by fluids (DI Water vs 10 lbs
brine)
5
10
15
20
25
30
0 05 1 15 2 25 3 35 4 45 5
HVFR
Ela
sti
c M
od
ulu
s (
G)(d
yn
cm
2)
Frequency (Hz)
Fluid DI WaterAmplitude 400
0
05
1
15
2
25
3
0 05 1 15 2 25 3 35 4 45 5
HVFR
Ela
sti
c M
od
ulu
s (
G)
(dy
nc
m2)
Frequency (Hz)
HVFRFluid 10 lbs BrineAmplitude 400
144
37 HVFR ELASTIC MODULUS PROFILES BY TEMPERATURE
Figure 9 shows elastic modulus Grsquo as a function of frequency (Hz) at 400
amplitude for 2 gal per 10 bbl dosage at different temperatures 75 150 and 250 At
room temperatures 75 and 150 the viscoelastic property was similar and the HVFR
showed that temperatures under 150 did not affect the polymer chains physically while
exhibited a lower value of Grsquo at high temperature around 250 It also observed that the
elastic modulus increased with frequency increments from 05 to 45 Hz
Figure 8 The elastic modulus characteristic of HVFR by temperature
38 FIELD CASE STUDY
A well-C is operated in Wolfcamp Shale TD (Total Depth) was about 22000 ft
and TVD (Total Vertical Depth) was approximately 8900 ft as shown in Figure 10 The
operation pressure range was from 7000 and 11000 psi The fluid type was slickwater
and the proppant size was 4070 white The fluid flow rate was between about 60 and 100
145
bpm In this frac job HVFR as well as other chemicals such as acid and gel breaker were
employed The initial pressure was about 11000 psi The dosage of HVFR from 125 gpt
to 05 gpt was treated for proppant transportation According to these results that HVFR
could be economically and efficiently used for proppant transportation and pressure
reduction at dosage rates as low as 05 gpt
Figure 9 Hydraulic fracture treatment plot from Well-C using HVFRs
4 DISCUSSION THE POTENTIAL OF FORMATION DAMAGE
Achieving high fracture conductivity is a primary goal of hydraulic fracturing
treatment because these conductive channels enable the flow of oil and gas from the
formation to the wellbore Many factors influence the fracture conductivity such as
proppant size and type fracture closure stress and fracturing fluid type HVFR fracturing
fluids are rapidly gaining popularity because of their numerous advantages such as better
146
proppant carrying capability In addition using HVFRs fracturing fluids lowers overall
costs due to fewer chemicals (Be Geri M et al 2019a)
Currently HVFRs have been successfully used as a completion fluid in
unconventional formations However some concerns remain of the potential formation
damage that might occur by using these high molecular weight polyacrylamide-based
fluids Therefore to address these concerns experimental investigation prior to this
research (SPE-197081) was performed to evaluate the potential of formation damage that
might occur due to using HVFRs To evaluate using HVFR fracture fluids a conductivity
test of an anionic polymer HVFR with a high molecular weight (18 to 26 million (gmole)
was conducted under closure pressure 2000 psi and at the reservoir temperature 165
Figure 11 showed the conductivity and permeability of fracturing fluids There are
three types of fracturing fluids baseline (no HVFR addition) 05 gpt and 25 gpt The
pressure and temperature under this test were 2000 psi and 165 respectively At 2000
psi fluid conductivities and proppant permeabilities of baseline and 05 gpt were quite
close In fact 05 gpt fracturing fluid showed better compatibility and permeability than
the baseline even though the HVFR used in this test has a very high molecular weight
positive results concluded that 110 and 94 regained permeability was observed at
dosages of 05 gpt and 25 gpt
147
5 CONCLUSIONS
This paper presented the overall understanding of HVFR xanthan emulsion
polymer and guar on viscosity and elastic modulus in DI water and harsh brine solutions
Based on the active ingredient weight and volume of friction reducers HVFR has good
characteristics for proppant transportation and pressure reduction from viscosity and elastic
modulus results The relatively higher molecular weight and thermal stability of the
synthetic polymer chemical structure supported the desired properties in frac operation
Figure 10 Conductivity and permeability on baseline 05 gpt and 25 gpt at 2000 psi
and 24 hr
In medium brine and high brine solutions through 2wt and 10 lbs brine HVFR
the n (flow behavior index) value of HVFR and Guar was higher than emulsion polymer
and xanthan The lower viscosity reduction from low shear rate to high shear rate may
improve proppant transport deeper into the fracture From Stokersquos law and the viscosity
1600
1800
2000
2200
2400
2600
2800
90
95
100
105
110
115
120
Co
nd
ucti
vit
y (
md
-ft)
Perm
eab
ility (D
arc
y)
Experimental Condition 2 KCl soln at 2000 psi amp 165 OF
and at 24 hr
Permeability
Conductivity
Baseline (0 gpt) 05 gpt 25 gpt
HVFR Dosage
148
profiles of friction reducers the investigation could prove HVFR has a good proppant
transportation capability
The elastic modulus is also related to the proppant transport characteristic It is a
physical stress affecting fluid properties and proppant transportation by the activity of
polymer chains Higher elastic modulus values represent the capability to transport
proppants farther As a result this research observed that HVFR has an excellent elastic
modulus when compared to other friction reducers
Based on the results of viscosity profiles and elastic modulus the research focused
on HVFR properties on the effects of amplitude frequency fluid type and temperature
The elastic modulus of HVFR has good heat resistance up to 150 as shown in the
viscosity profile In addition to the viscosity profile and elastic modulus the permeability
and conductivity of HVFR supports the induction of HVFR in frac operations As shown
in one of field cases in this paper the use of HVFR has been rapidly grown and the future
of utilizing HVFRs looks promising
REFERENCES
Acharya A R (1988 November 1) Viscoelasticity of Crosslinked Fracturing Fluids and
Proppant Transport Society of Petroleum Engineers httpsdoi10211815937-
PA
Aften C (2018 October 5) Analysis of Various High Viscosity Friction Reducers and
Brine Ranges Effectiveness on Proppant Transport Society of Petroleum
Engineers httpsdoi102118191792-18ERM-MS
Aften C W (2010 January 1) Study of Friction Reducers For Recycled Stimulation
Fluids In Environmentally Sensitive Regions Society of Petroleum Engineers
httpsdoi102118138984-MS
149
Aggour T M amp Economides M J (1999 February 1) Impact of Fluid Selection on
High-Permeability Fracturing Society of Petroleum Engineers
httpsdoi10211854536-PA
Asadi M Conway M W amp Barree R D (2002 January 1) Zero Shear Viscosity
Determination of Fracturing Fluids An Essential Parameter in Proppant Transport
Characterizations Society of Petroleum Engineers httpsdoi10211873755-MS
Ba Geri M Imqam A amp Dunn-Norman S (2018 October 5) Proppant Transport
Behavior in Inclined Versus Vertical Hydraulic Fractures An Experimental Study
Society of Petroleum Engineers httpsdoi102118191813-18ERM-MS
Ba Geri M Imqam A amp Suhail M (2019 March 15 a) Investigate Proppant Transport
with Varying Perforation Density and its Impact on Proppant Dune Development
Inside Hydraulic Fractures Society of Petroleum Engineers
httpsdoi102118195018-MS
Ba Geri M Imqam A amp Flori R (2019 April 8 b) A Critical Review of Using High
Viscosity Friction Reducers as Fracturing Fluids for Hydraulic Fracturing
Applications Society of Petroleum Engineers httpsdoi102118195191-MS
Ba Geri M Imqam A Bogdan A amp Shen L (2019 c April 8) Investigate the
Rheological Behavior of High Viscosity Friction Reducer Fracture Fluid and Its
Impact on Proppant Static Settling Velocity Society of Petroleum Engineers
httpsdoi102118195227-MS
Ellafi A M Ba Geri B Bubach and H Jabbari (2019 June 23) Formation Evaluation
and Hydraulic Fracture Modeling of Unconventional Reservoirs Sabrsquoatayn Basin
Case Study American Rock Mechanics Association
Geri M B Flori R amp Sherif H (2019 July 25) Comprehensive Study of Elasticity and
Shear-Viscosity Effects on Proppant Transport Using HFVRs on High-TDS
Produced Water Unconventional Resources Technology Conference
doi1015530urtec-2019-99
Gomaa A M Gupta D V S amp Carman P (2015 April 13) Viscoelastic Behavior and
Proppant Transport Properties of a New High-Temperature Viscoelastic Surfactant-
Based Fracturing Fluid Society of Petroleum Engineers
httpsdoi102118173745-MS
Harris P C Morgan R G amp Heath S J (2005 January 1) Measurement of Proppant
Transport of Frac Fluids Society of Petroleum Engineers
httpsdoi10211895287-MS
150
Harris P C Walters H G amp Bryant J (2009 November 1) Prediction of Proppant
Transport From Rheological Data Society of Petroleum Engineers
httpsdoi102118115298-PA
Hu Y T Chung H amp Maxey J E (2015 February 3) What is More Important for
Proppant Transport Viscosity or Elasticity Society of Petroleum Engineers
httpsdoi102118173339-MS
Li L Sun H Qu Q Le H V Ault M Zhou J hellip Smith D (2014 October 27)
High-Temperature Fracturing Fluids Prepared with Extremely High-TDS and Hard
Produced Water Society of Petroleum Engineers httpsdoi102118170607-MS
Li S amp Zhang D (2019 April 1) How Effective Is Carbon Dioxide as an Alternative
Fracturing Fluid Society of Petroleum Engineers httpsdoi102118194198-PA
Samuel M Polson D Graham D Kordziel W Waite T Waters G hellip Downey R
(2000 January 1) Viscoelastic Surfactant Fracturing Fluids Applications in Low
Permeability Reservoirs Society of Petroleum Engineers
httpsdoi10211860322-MS
Shah S N (1993 May 1) Rheological Characterization of Hydraulic Fracturing Slurries
Society of Petroleum Engineers httpsdoi10211822839-PA
Shrivastava K amp Sharma M M (2018 January 23) Proppant Transport in Complex
Fracture Networks Society of Petroleum Engineers httpsdoi102118189895-
MS
Srinivasan K Ajisafe F Alimahomed F Panjaitan M Makarychev-Mikhailov S amp
Mackay B (2018 August 28) Is There Anything Called Too Much Proppant
Society of Petroleum Engineers httpsdoi102118191800-MS
Walters H G Stegent N A amp Harris P C (2009 January 1) New Frac Fluid Provides
Excellent Proppant Transport and High Conductivity Society of Petroleum
Engineers httpsdoi102118119380-MS
Whitfield S (2017 June 1) Permian Bakken Operators Face Produced Water Challenges
Society of Petroleum Engineers httpsdoi1021180617-0048-JPT
151
VI A COMPREHENSIVE REVIEW OF FORMATION DAMAGE CAUSED BY
HIGH-VISCOSITY FRICTION REDUCERS WOLFCAMP CASE STUDY
Mohammed Ba Geri1 Abdulaziz Ellafi2 Ralph Flori1 Jerry Noles3 and Sangjoon Kim3
1 Deparment of Petroleum Engineering Missouri University of Science and Technology
Rolla MO 65409
2 Department of Petroleum Engineering University of North Dakota Grand Forks ND
58202
3 CoilChem LLC Washington Oklahoma
ABSTRACT
The success of using the hydraulic fracture treatment can be evaluated by
measuring fracture conductivity and regained permeability However selecting the most
suitable fracture fluid system plays an essential role in minimizing or eliminating formation
damage To address potential formation damage that may during fracturing treatment this
research presents a comprehensive review of a good number of published papers that are
carefully reviewed and summarized Theses works include experimental research case
studies and simulation work on recent improvements on using HVFR to carry proppant
and capture the optimum design in fracturing operations This paper also provides
formation damage mechanisms such as chemical mechanical biological and thermal
mechanisms Moreover the research explains the fracture damage categories including the
damage inside the fracture and damage inside the reservoir The advantages of using
HVFRs are also fully explained Experimental rheological characterization was studied to
investigate the viscoelastic property of HVFRs on proppant transport In addition
152
successful implication of utilizing HVFRs in the Wolfcamp formation in the Permian
Basin was discussed
The research findings were analyzed to reach conclusions on how HVFRs can be
an alternative fracture fluid system within many unconventional reservoirs Compared to
the traditional hydraulic fracture fluid system the research shows the many potential
advantages that HVFR fluids offer including superior proppant transport capability almost
100 retained conductivity around 30 cost reduction and logistics such as minimizing
chemical usage by 50 and the ability to stonre operation equipment on location reduce
water consumption by 30 and achieve environmental benefits Finally this
comprehensive review addresses up-to-date of using HVFRs challenges and emphasizes
necessities for using high viscosity friction reducers as alternative fracture fluids
1 INTRODUCTION
Selecting optimal fracturing fluids plays a key role in successful hydraulic
fracturing treatment The primary goal of the hydraulic fracturing process is to achieve high
fracture conductivity because these conductive channels enable the flow of oil and gas
from the formation to the wellbore The fracture damages can negatively impact the
effectiveness of the stimulation process Several numerical studies confirmed that
hydraulic damage could decrease the well productivity by up to 50 Han (2014)
Conventional fracturing fluids such as guar-based fluids build a filter cake on the surface
of the shale matrix Therefore the potential of formation damage after using viscous
fracturing fluids increases because the formed filter cake blocks the pore-throat of low
153
permeability rocks (Wang et al 2010) In addition utalising viscous fracturing fluids has
the potential of decreasing the fracture conductivity due to a higher residual polymer Many
factors influence the fracture conductivity such as proppant size and type fracture closure
stress and fracturing fluid type (Ba Geri et al 2019d)
Many investigations have been conducted concerning fracture damage evaluation
Bennion et al (1999) summarized some issues and solutions associated with low
permeability gas reservoirs during the stimulation and production process The research
concluded that improper fluid selection is one of the major mechanisms that cause
formation damage Reinickeetal et al (2010) conducted an experimental study to
investigate the mechanical damage that occurred at the hydraulic fracture face In some
cases reservoir fluids are not compatible with fracturing fluids due to its chemical
complicity (Aggour and Economides 1999) Farah et al (2016) performed numerical
techniques in order to evaluate the formation damage caused by fracturing-fluid during the
fracturing treatment and its influence on the hydrocarbon production and unconventional
gas formation Cooke C (1975) studied the impact of several types of fracturing fluids on
fracture conductivity and described a theoretical method to evaluate fluid residue on
fracture conductivity Davles and Kulper (1988) studied several factors that affect
proppant-pack and fracture conductivity such as closure stress multiphase flow proppant
size proppant type and fracturing fluids Norman et al (1989) evaluated commonly used
hydraulic fracturing fluids using a simplified technique and reached the conclusion that the
quickest fluids to clean up are flowing foams uncrosslinked gels and crosslinked fluids
Voneiff et al (1996) performed a simulation study to investigate the impact of
unbroken fracturing fluids on the productivity performance of gas wells The conclusions
154
of their research were unbroken fracture fluids initial gas production decreased by 80
fracture clean-up can by delayed by weeks or months and 30 reduction in gas reserves
Pope et al (1996) discussed the effects of viscous fingering of using guar-based fracturing
fluids on fracture conductivity and concluded that for predicting the retained permeability
known polymer concentration polymer molecular weight and temperature are required
Behr et al (2006) developed a numerical model-initialization in order to evaluate the
fracture damage that occurs after closure in tight gas reservoirs Wang et al (2008) ran a
simulation study in order to understand how polymers in the fractures can affect the
cleanup process
Recently HVFRs as a completion fluid have been successfully used in
unconventional formations (Motiee et al 2016 Van Domelen 2017 and Ba Geri et al
2019b) However some concerns remain because of the potential formation damage that
might occur by using these high molecular weight polyacrylamide-based fluids as
completion fluids Motiee et al (2016) used high concentrations of friction reducers
(HCFR) of 14 gpt They conducted conductivity experiments under a high-temperature
system at 220degF for 25 hours and concluded that using 14gpt of HCFR gives 72 of
regained conductivity while adding 1ppt of breaker increased the regained conductivity up
to 80 Van Domelen (2017) reported a comparison study between 15 lbMgal of
crosslinked and 3 gpt of viscosity-building friction reducers (VFR) under the same
conductivity measurement condition and reached the observation that the final regained
conductivity was 106 and 36 of 3gpt of VFR and 15 lbMgal of crosslinked
respectively Galindo (2019) studied the effect of increasing HVFRs viscosity on formation
155
damage The results showed that HVFRs might cause formation damage if used without a
breaker because of polymer residuals
Ba Geri et al 2019a presented a critical review of using HVFRs in lab studies and
field operations The investigation provided a full understanding of using HVFRs as an
alternative fracture fluid The study notes that limited work has been done to evaluate the
potential of formation damage that could occur when using HVFRs during fracturing
treatment This paper provides a comprehensive study of the effects of utilizing HVFRs on
fracture conductivity and regained permeability Three cases were implemented to study
the effect of formation damage caused by using HVFRs fracturing fluids The Baseline
(without HVFR) in 2 KCl solution was investigated in Case I (base case) while the effect
of increasing the HVFRs dosage by 05 gpt and 25 gpt was investigated in Case II and
Case III In both cases the sieve size distribution was performed before and after the test
Successful field implementation of using HVFRs was also discussed
2 FORMATION DAMAGE MECHANISMS
Formation damage can be described as ldquothe impairment of the invisible by the
inevitable and uncontrollable resulting in an indeterminate reduction of the
unquantifiablerdquo (Bennion 1999) Creating a highly conductive path in ultra-low
permeability unconventional reservoirs is an essential step to allow the hydrocarbons to
flow from the reservoirs to the wellbore To maintain the fracture conductivity high-
viscosity fracture fluids (eg guar gum or crosslinked) are required to carry a high
concentration of proppant (Yuan et al 2015) These viscous fluids should be degraded
156
after the fracture treatment for an easy clean-up process The Well productivity
performance is reduced due to formation damage and usually an expensive treatment is
required to remove fracture damage Formation damage can be classified into four main
mechanisms Figure 1 chemical mechanical biological and thermal These mechanisms
inhibit the flow of fluid formation from reservoirs into the fracture network and
consequently impair hydrocarbon production rates and well productivity (Civan 2000
Nasr-El-Din 2003 and Wang et al 2008)
Figure 1 Classification of the common formation damage mechanisms (Civan 2000)
In general fracture damage can be classified into two categories as shown in the
Table 1
Table 1 Fracture damage categories (Wang et al 2010)
Damage inside the
fracture Damage inside the reservoir
Other factors affect clean
up
Fracture plugging with
chemicals and polymers
Fracture-face damage
Proppant crushing
Proppant embedment
Fluid leakoff
Clay swelling
Relative permeability change
Capillary effects
Gel residue breaker
Fracture-fluid viscosity
Viscous fingering
Formation temperature
Fracture conductivity
Reservoir heterogeneity
Fracture geometry
Formation Damage
ThermalBiologicalMechanicalChemical
157
It is important to minimize or eliminate formation damage as this plays a key role
in increasingwell productivity In unconventional reservoirs well performance is a strong
function of fracture conductivity and permeability of the region near the wellbore
Therefore many researchers focus their studies to develop techniques to minimize or
prevent formation damage This paper will provide a better understanding of the distinct
changes of the mechanical characterization on the HVFRs that could be used as guidance
for fracture engineers to design and select more effective high viscous friction reducers
By doing so the promising results of using HVFRs can minimize formation damage and
maximize well productivity and the ultimate operator goal will be achieved
3 WHY HIGH VISCOSITY FRICTION REDUCERS
The primary function of friction reducers is changing turbulent flow to laminar
flow which can reduce frictional loss that occurs while pumping fracturing fluids by up to
80 Recently high-viscosity friction reducers (HVFRs) have gained popularity as drilling
and hydraulic fracturing fluids because the HVFRs exhibit numerous advantages such as
the following (Ba Geri et al 2019a ampb)
bull Reduced pipe friction during fracturing treatments
bull High regain conductivities compared to linear and crosslinked gels
bull Lower operational cost
o Uses less water compared to conventional slickwater treatments
o Consumes 33-48 less chemicals than conventional treatments
158
o Requires less equipment on location
o Requires fewer number of tank trucks in the field
bull More fracture complexity using a less viscous fluid system
bull Better hydrocarbon production results compare to or greater than other fluids
bull Improved flexibility to design treatments that balance technical economic and
operational goals
bull Reduced freshwater proppant and equipment requirements compared with
conventional fluid systems
bull Minimized environmental footprint with selection of engineered additives
bull Simplified operations by reduced screen out risks
4 EXPERIMENTAL DESCRIPTION
41 EXPERIMENTAL MATERIALS
411 Experimental Materials Three different samples baseline (wo HVFR)
05 gpt (05 gal of HVFR per 1000 gal) and 25 gpt (25 gal of HVFR per 1000 gal) were
selected to prepare typical hydraulic fracturing fluids The HVFR is anionic polymer and
the molecular weight is 18 to 23 million The conductivity and permeability test were
conducted in 2 KCl solution at 165 and at a closure stress of 2000 psi to prepare the
fracturing fluid at lab temperature
412 Proppant The proppant size that was selected for this study was between
mesh size 30 and 50 Tables 2 3 and 4 represent the sieve analysis of proppant used for
159
the test with the baseline 05 gpt and 25 gpt The sieve size distribution was performed
before and after the test
Table 2 Proppant sieve analysis for baseline
Mesh Size Length (mm) Baseline
Pre Sieve () Post Sieve ()
30 0600 02 00
35 0500 275 266
40 0425 496 472
45 0355 199 232
50 0300 28 30
Total 1000 1000
Median Particle Diameter (MPD mm) 0463 0458
Table 3 Proppant sieve analysis for 05 gpt
Mesh Size Length (mm) Baseline
Pre Sieve () Post Sieve ()
30 0600 02 02
35 0500 275 265
40 0425 496 478
45 0355 199 225
50 0300 28 29
Total 1000 999
Median Particle Diameter (MPD mm) 0463 0459
Table 4 Proppant sieve analysis for 25 gpt
Mesh Size Length (mm) Baseline
Pre Sieve () Post Sieve ()
30 0600 02 18
35 0500 275 287
40 0425 496 487
45 0355 199 183
50 0300 28 26
Total 1000 1001
Median Particle Diameter (MPD mm) 0463 0458
160
5 MEASUREMENTS OF RHEOLOGICAL PROPERTY
51 SHEAR VISCOSITY CHARACTERIZATION (K N)
Based on the standard practice in the hydraulic fracturing industry the most typical
shear rates that were measured while pumping the fluid slurry into the fractures are within
the range 10 119904minus1 to 170 119904minus1as well as 511 119904minus1 to determine fluid apparent viscosity In lab
studies the common shear rate was either 40 119904minus1 or 100 119904minus1 (Hu et al 2015 Gomaa et al
2015 Ba Geri et al 2019campf) This study investigated three different fracture fluid shear
rates 40 119904minus1 100 119904minus1 and 170 119904minus1
52 SHEAR ELASTICITY CHARACTERIZATION (ELASTIC MODULUS Grsquo)
Several methods can be used to measure the elastic properties of viscoelastic fluid
such as the viscoelastic characterization of the fracturing fluids N1 relaxation time
dynamic oscillatory frequency test and the amplitude sweep test This study investigated
the viscoelasticity behavior of the tested fluid by testing the dynamic oscillatory frequency
through M5600 (Grace Instrument)
53 FRACTURE CONDUCTIVITY EXPERIMENT PROCEDURE
Conductivity cells were loaded with proppants with 20 lbft2 loading between Ohio
Sandstone Cores 1000 psi closure stress was initially applied for 12-24 hours and then
the pressure was increased to 2000 psi for 50 hr The conductivity and permeability of the
samples were measured at 0 24 and 50 hr Equations (1) and (2) represent conductivity
and permeability respectively
161
Conductivity 119896119882119891 =2678μQ
120549119875 (1)
Permeability 119896 =3214μQ
120549119875119882119891 (2)
where
k Proppant Pack Permeability (Darcy)
k119882119891 Proppant Pack Conductivity (Millidarcy-feet)
μ Viscosity of Liquid (cp)
Q Flow Rate (1198881198983min)
P Differential Pressure (psi)
119882119891 Proppant Pack Width (in)
6 RESULTS AND ANALYSIS
61 RHEOLOGICAL CHARACTERIZATION OF THE HVFRS
611 Viscosity Profile Measurement Figure 2 shows the HVFR viscosity profile
in fresh water The range of pH and TDS in this water was 7-8 and 300-450 ppm
respectively Divalent cations such as Ca2+ and Mg2+ were under 10 ppm The HVFR
solution was vigorously stirred for 30 minutes and then each solutionrsquos viscosity was
measured at shear rates 40 100 and 170 119904minus1 through the M5600 rheometer (Grace
Instrument) at room ambient As shown in Figure 2 the viscosity has been proportionally
increased with the HVFR dosage and represents the shear thinning property For instance
at a loading of 3 gpt the results for HVFR showed that HVFR has high viscosity (31 cp)
at a lower shear rate of 040 119904minus1 compared to the viscosity of high shear rate of 0170 119904minus1
162
showed a much lower viscosity of around 14 cp The second observation was that at the
same shear rate (eg 40 119904minus1) increasing the HVFR dosage from 1 gpt to 3 gpt leads to an
increase in the viscosity profile from around 8 cp to 31 cp respectively
Figure 2 HVFR viscosity profile with various dosage in fresh water
612 Elasticity Profile Measurment The viscoelastic properties of HVFR were
measured through the M5600 (Grace Instrument) The dosage ratio was 05 10 20 and
30 gal of HVFR per 1000 in fresh water Prior to the viscoelastic test each sample was
stirred to be completely dispersed in fluids for 30 minutes In this experiment the
frequency was set at 05 to 30 Hz with 05 Hz increments and the amplitude was 200
The viscoelastic properties were measured at room ambient Figure 3 represents the elastic
modulus (Grsquo) of HVFR in fresh water The elastic modulus of the HVFR solution was
increased with the increase of the HVFR dosage
0
10
20
30
40
50
B
C
D
Vis
co
sit
y (
cp
s)
Shear Rate (1s)
40 100 170
1 gpt
2 gpt
3 gpt
HVFR DosageFluid Fresh Water
163
To illustrate at a low dosage of HVFR (less than 1 gpt) the elastic modulus is
almost zero while increasing the dosage up to 3 gpt provides a strong elasticity profile
above 5 dyncm2 In addition the elastic modulus of HVFR was increased with the test
frequency For example Grsquo increased from 1 dyncm2 to almost 6 dyncm2 by increasing
the frequency from 05 Hz to 3 Hz respectively
0
1
2
3
4
5
6
7
B
C
D
E
Ela
sti
c M
od
ulu
s (
G)
(d
yn
cm
2) 05 gal per 1000 gal
10 gal per 1000 gal20 gal per 1000 gal30 gal per 1000 gal
HVFR Dosage in Fresh WaterAmplitude 200
05 10 15 20 25 30
Frequency (Hz)
Figure 3 HVFR elastic property with various dosage in fresh water
62 CONDUCTIVITY AND PERMEABILITY MEASUREMENT ON BASELINE
05 GPT AND 25 GPT
Figure 4 represents the conductivity and permeability of the baseline 05 gpt and
25 gpt depending on pressure and time The measurement of the sample baseline means
the reading of fluid conductivity and proppant permeability without HVFR As adding 05
gal and 25 gal of HVFR per 1000 gal of 2 KCl solution the effect of HVFR was
investigated As shown in figure 1 (A-1000 psi at 24 hr) the 05 gpt and 25 gpt samples
164
regained conductivity and permeability at about 95 and 93 respectively compared
with baseline samples At 2000 psi in Figure 4 (B) the fluid conductivity and proppant
permeability of 05 gpt showed quite close with the characteristic of baseline As time goes
in Figures 4 (C) and (D) shows that at 2000 psi 05 gpt of HVFR contributed to improve
the conductivity and permeability
Figure 4 Conductivity and permeability on baseline 05 gpt and 25 gpt by pressure and
time
Table 4 represents the regain percentage of conductivity and permeability on
samples 05gpt and 25 gpt The conductivity and permeability of 05 gpt at 2000 psi for
24 amp 50 hr were great 103 and 108 on regaining permeability were more than what
expected In addition the conductivity and permeability of 25 gpt look fine The overall
165
regained percentage of 25 gpt was 83 to 93 in this conditional environment The polymer
chains in 25 gpt might interfere with conductivity and permeability
Table 5 The regain percentage of 05 gpt and 25 gpt
Stress
psi
Time (hr)
stress
Conductivity (md-ft)
Permeability (Darcy)
Regain
(Permeability)
Baseline 05 gpt 25 gpt 05 gpt 25 gpt
1000 24 3568177 3401168 3317164 95 93
2000 0 2177109 2183108 182190 99 83
2000 24 2153107 2228110 189094 103 88
3000 50 2122106 2304114 194496 108 91
63 CASE STUDY WOLFCAMP FORMATION REEVES COUNTY TX
631 Geological Background A well-H was located in the Wolfcamp formation
in West Texas The well depth was about 10000 feet along the basin axis and the lateral
section was approximately 8300 feet The net pay thickness of Woflcamp is about 1000
feet to over 4000 feet and the average porosity is 7 The maximum pressure was 9800
psi and the backside pressure was 2000 psi In this job slick was employed as the base
treatment fluid
632 Fracture Design and Execution Figure 5 shows a plot of the individual-
stage fracturing treatment In the early stages of the treatment the pressure reached close
to 9600 psi which could be an indication of creating more fractured area while during the
remainder of the process the pressure was within the range of 7200 psi and 8600 psi The
proppant concentration was increased gradually from 05 ppg to 15 ppg with increasing
the dosage of HVFRs from 050 gpt to 1 gpt The fracture treatment was placed as the
fracture design expectation In the field trial the low dosage of HVFRs (eg 1 gpt)
166
provided promising production results as well as reduction on the cost related to using
HVFR
Figure 5 Hydraulic fracture treatment plot from Well-H using HVFRs
Figure 6 represents real time data from Wolfcamp Well-H Desirable pressure
responded at the prop dosage 025 ppg which entered the formation with 03 gpt During
operation the dosage range of HVFR was increased from 03 gpt to 1 gpt The upper
pressure reached 9400 psi however most of the operation was conducted between 7200
psi and 8600 psi The prop amount was approximately 19000 lbs per stage and 100 of
0310 0337 0404 0431 0458
Time (Hr Min)
05 ppg
10 ppg
15 ppg
1 gpt
050 gpt
720 bpm
1080 bpm
4 lbsmin
6 lbsmin
8 lbsmin
4800 psi
7200 psi
9600 psi
- Sand Dosage (ppg (lbs per gallon)) - HVFR Conc (ppt (lbs per thousand gallons)
- Discharge Rate (bpm (barrel per min) - Blender HVFR Rate (lbsmin)
- Wellside (psi)
167
the prop was placed in the formation Compared to the cost of linear gel using HVFR
provided about 25-30 cost reduction
Figure 6 HVFR dosage real time data
7 CONCLUSIONS
This paper provides a comprehensive review of formation damage caused by using
fracture fluids The formation damage mechanisms (eg chemical mechanical biological
thermal) and fracture damage categories were explained After that experimental work
investigated the viscoelastic properties of HVFRs and the potential of formation damage
caused by using a new fracture fluid system (HVFRs) was determined Finally a field case
study was discussed including the advantages of utilizing HVFRs as an alternative fracture
fluid system to the conventional fracture fluids such as linear gel HVFRs were used
0
05
1
15
2
25
8000
8500
9000
9500
700 720 740 760 780 800 820 840
PolyMax-1000 (ppt)4070 White (ppg)Pressure (psi)
Time (min)
HVFR (ppt)
075 ndash 25 ppt
025 ndash 10 ppg
168
Successfuly in the Wolfcamp formation causing production improvement and 25-30 cost
reduction
The viscoelastic property of high molecular weight (18 to 23 million) of HVFRs
shows promising results on fracture conductivity and regained permeability Through the
conductivity and permeability test it was found that 05 gpt of HVFR did not affect the
conductivity and permeability during the frac operation Even the dosage of 05 gpt helped
to improve fluid conductivity and proppant permeability with up to 108 of regain at
2000 psi and 165 for 50 hr which is a remarkable finding The high dosage of 25 gpt
in the frac operation may initially hinder the conductivity and permeability due to polymer
chains However the conductivity and permeability have gradually improved to 91 of
regain as time goes on
REFERENCES
Aggour T M amp Economides M J (1999 February 1) Impact of Fluid Selection on
High-Permeability Fracturing Society of Petroleum Engineers
httpsdoi10211854536-PA
Ba Geri M Imqam A amp Dunn-Norman S (2018 October 5) Proppant Transport
Behavior in Inclined Versus Vertical Hydraulic Fractures An Experimental Study
Society of Petroleum Engineers doi102118191813-18ERM-MS
Ba Geri M Imqam A amp Suhail M (2019 March 15) Investigate Proppant Transport
with Varying Perforation Density and its Impact on Proppant Dune Development
Inside Hydraulic Fractures Society of Petroleum Engineers doi102118195018-
MS
Ba Geri M Imqam A amp Flori R (2019a April 8) A Critical Review of Using High
Viscosity Friction Reducers as Fracturing Fluids for Hydraulic Fracturing
Applications Society of Petroleum Engineers httpsdoi102118195191-MS
169
Ba Geri M Imqam A Bogdan A amp Shen L (2019b April 8) Investigate the
Rheological Behavior of High Viscosity Friction Reducer Fracture Fluid and Its
Impact on Proppant Static Settling Velocity Society of Petroleum Engineers
httpsdoi102118195227-MS
Ba Geri M R Flori A Imqam L Shen amp A Bogdan (2019c June) Static Proppant
Settling Velocity Characteristics in High Viscosity Friction Reducers Fluids for
Unconfined and Confined Fractures American Rock Mechanics Association
Ba Geri M Ellafi A Flori R Noles J amp Kim S (2019f October) Viscoelastic
Characterization Effect of High-Viscosity Friction Reducers and Proppant
Transport Performance in High-TDS Environment Society of Petroleum
Engineers httpsdoi102018196014-MS
Behr A Mtchedlishvili G Friedel T amp Haefner F K A (2006 May 1) Consideration
of Damaged Zone in a Tight Gas Reservoir Model with a Hydraulically Fractured
Well Society of Petroleum Engineers httpsdoi10211882298-PA
Bennion D B Thomas F B amp Bietz R F (1996 January 1) Low Permeability Gas
Reservoirs Problems Opportunities and Solutions for Drilling Completion
Stimulation and Production Society of Petroleum Engineers
httpsdoi10211835577-MS
Civan Faruk Reservoir Formation Damage Fundamentals Modeling Assessment and
Mitigation 2000
Cooke C E (1975 October 1) Effect of Fracturing Fluids on Fracture Conductivity
Society of Petroleum Engineers httpsdoi1021185114-PA
Davies D R amp Kuiper T O H (1988 May 1) Fracture Conductivity in Hydraulic
Fracture Stimulation Society of Petroleum Engineers httpsdoi10211817655-
PA
Farah N Ding D-Y amp Wu Y-S (2017 August) Simulation of the Impact of
Fracturing-Fluid-Induced Formation Damage in Shale Gas Reservoirs Society of
Petroleum Engineers httpsdoi102118173264-PA
Galindo T (2019 January 29) Can Proppant Transport be Negatively Affected by Too
Much Viscosity Society of Petroleum Engineers httpsdoi102118194317-MS
Geri M B Flori R amp Sherif H (2019 July 25) Comprehensive Study of Elasticity and
Shear-Viscosity Effects on Proppant Transport Using HFVRs on High-TDS
Produced Water Unconventional Resources Technology Conference
doi1015530urtec-2019-99
170
Geri M B Ellafi A Ofori B Flori R amp Sherif H (2019 July 31) Successful
Implementation of High Viscosity Friction Reducers from Laboratory to Field
Scale Middle Bakken Case Study Unconventional Resources Technology
Conference doi1015530urtec-2019-447
Gomaa A M Gupta D V S V amp Carman P S (2015 February 3) Proppant
Transport Viscosity Is Not All Itrsquos Cracked Up to Be Society of Petroleum
Engineers httpsdoi102118173323-MS
Han Jiahang (2014) Hydraulic Fracture Damage Analysis in Tight Gas Reservoirs PhD
Dissertation
Hu Y T Chung H amp Maxey J E (2015 February 3) What is More Important for
Proppant Transport Viscosity or Elasticity Society of Petroleum Engineers
httpsdoi102118173339-MS
Motiee M Johnson M Ward B Gradl C McKimmy M amp Meeheib J (2016
February 1) High Concentration Polyacrylamide-Based Friction Reducer Used as
a Direct Substitute for Guar-Based Borate Crosslinked Fluid in Fracturing
Operations Society of Petroleum Engineers httpsdoi102118179154-MS
Nasr-El-Din H A (2003 January 1) New Mechanisms of Formation Damage Lab
Studies and Case Histories Society of Petroleum Engineers
httpsdoi10211882253-MS
Norman L R Hollenbeak K H amp Harris P C (1989 January 1) Fracture Conductivity
Impairment Removal Society of Petroleum Engineers httpsdoi10211819732-
MS
Pope D S Leung LW Gulbis J amp Constien V G (1996 November 1) Effects of
Viscous Fingering on Fracture Conductivity Society of Petroleum Engineers
httpsdoi10211828511-PA
Van Domelen M Cutrer W Collins S amp Ruegamer M (2017 March 27)
Applications of Viscosity-Building Friction Reducers as Fracturing Fluids Society
of Petroleum Engineers httpsdoi102118185084-MS
Voneiff G W Robinson B M amp Holditch S A (1996 November 1) The Effects of
Unbroken Fracture Fluid on Gas Well Performance Society of Petroleum
Engineers httpsdoi10211826664-PA
Wang Y Holditch S A amp McVay D A (2008 January 1) Simulation of Gel Damage
on Fracture-Fluid Cleanup and Long-Term Recovery in Tight-Gas Reservoirs
Society of Petroleum Engineers httpsdoi102118117444-MS
171
Wang J Y Holditch S amp McVay D (2010 September 1) Modeling Fracture-Fluid
Cleanup in Tight-Gas Wells Society of Petroleum Engineers
httpsdoi102118119624-PA
Yuan B Su Y Moghanloo RG Rui Z Wang W Shang Y 2015 A new analytical
multi-linear solution for gas flow toward fractured horizontal wells with different
fracture intensity J Nat Gas Sci Eng 23 227e238
172
SECTION
3 CONCLUSIONS
This project evaluates the rheological characterization of HVFRs and investigates
the compatibility of HVFRs with the Permian and Bakken produced water Correlateing
the friction reductions measurment on high-TDS produced water was also studied in
produced water and fresh water as well The obtained results from this experimental
investigation provides new insights into the pressure reduction and proppant transport
theories that leads to the developing conclusions as follows
bull HVFR indicated high viscosity values and heat resistant property among friction
reducer samples
bull Based on viscosity values and well temperature by depth HVFR has great proppant
suspension and transportation capacity
bull HVFR showed a great elastic property helping proppant transportation
bull The high viscosity reading and elastic property of HVFR turned into a good fit in
frac operation
bull Also HVFR has other properties such as high molecular weight thermal stability
high regained conductivity and permeability in frac operation comparing other
friction reducers
bull The Future of utilizing HVFR looks promising from a field test
173
REFERENCES
Acharya AR 1988 Viscoelasticity of Crosslinked Fracturing Fluids and Proppant
Transport SPE Production Engineering 3 483-488 SPE-15937-PA
httpdxdoiorg10211815937-PA
Adrian RJ 2005 Twenty Years of Particle Image Velocimetry Experiments in Fluids 39
(2) 159-169 httpdxdoiorg101007s00348-005-0991-7
Ba Geri M Flori R Ellafi A Noles J Essman J Kim S amp Alkamil E H K (2019
November 11) Correlated Friction Reduction and Viscoelastic Characterization of
Utilizing the Permian Produced Water with HVFRs during Hydraulic Fracturing
Society of Petroleum Engineers doi102118197748-MS
Ellafi A Jabbari H Ba Geri M amp Alkamil E (2019 November 11) Can HVFRs
Increase the Oil Recovery in Hydraulic Fractures Applications Society of
Petroleum Engineers doi102118197744-MS
174
VITA
Mohammed Salem Ba Geri was born in Hadramout Yemen He received his
bachelorrsquos degree in Petroleum Engineering from Hadramout University of Science and
Technology Yemen in 2007 He was awarded a fully funded scholarship from Hadramout
Establishment for Human Development (HEHD) to obtain his masterrsquos degree in Saudi
Arabia 2010
Mohammed worked for one year at University of Salford Manchester from 2013 to
2014 Then he worked at Ministry of Oil amp Minerals in Yemen as a reservoir engineer from
2014 to 2016 He was awarded a fully funded scholarship from Hadramout Establishment
for Human Development (HEHD) to obtain his PhD degree in USA in 2017 He recived a
PhD in Petroleum Engineering from Missouri University of Science and Technology
Rolla MO in December 2019
Ba Geri was a member of Society of Petroleum Engineers (SPE) He served as a
volunteer with the SPE since 2010 The field of his research evaluate high viscosity
friction reducers on proppant transport and formation damage His area of interest
stimulationshydraulic fracturing well completions unconventional reservoirs and
production engineering He had several research papers in proppant transport high
viscosity friction reducerrsquos evaluation unconventional shale reservoirs and tight gas
- Investigating the performance of high viscosity friction reducers used for proppant transport during hydraulic fracturing
-
- Recommended Citation
-
- II
-

INVESTIGATING THE PERFORMANCE OF HIGH VISCOSITY FRICTION
REDUCERS USED FOR PROPPANT TRANSPORT DURING HYDRAULIC
FRACTURING
by
MOHAMMED SALEM BA GERI
A DISSERTATION
Presented to the Faculty of the Graduate School of the
MISSOURI UNIVERSITY OF SCIENCE AND TECHNOLOGY
In Partial Fulfillment of the Requirements for the Degree
DOCTOR OF PHILOSOPHY
in
PETROLEUM ENGINEERING
2019
Approved by
Ralph Flori Advisor
Mingzhen Wei
David Rogers
Kelly Liu
Vamegh Rasouli
copy 2019
Mohammed Salem Ba Geri
All Rights Reserved
iii
PUBLICATION DISSERTATION OPTION
This dissertation consists of the following six articles formatted in the style used
by the Missouri University of Science and Technology
Paper I Pages 5-34 have been published in SPE OnePetro
Paper II Pages 35-64 have been published in SPE OnePetro
Paper III Pages 65-92 have been published in SPE OnePetro
Paper IV Pages 93-123 have been published in SPE OnePetro
Paper V Pages 124-150 have been published in SPE OnePetro
Paper VI Pages 151-171 have been published in SPE OnePetro
iv
ABSTRACT
Over the last few recent years high viscosity friction reducers (HVFRs) have been
successfully used in the oil and gas industry across all premier shale plays in North America
including Permian Bakken and Eagle Ford However selecting the most suitable fracture
fluid system plays an essential role in proppant transport and minimizing or eliminating
formation damage
This study investigates the influence of the use of produced water on the rheological
behavior of HVFRs compared to a traditional linear guar gel Experimental rheological
characterization was studied to investigate the viscoelastic property of HVFRs on proppant
transport In addition the successful implication of utilizing HVFRs in the Wolfcamp
formation in the Permian Basin was discussed This study also provides a full comparative
study of viscosity and elastic modulus between HVFRs and among fracturing fluids such
as xanthan polyacrylamide-based emulsion polymer and guar
The research findings were analyzed to reach conclusions on how HVFRs can be
an alternative fracture fluid system within many unconventional reservoirs Compared to
the traditional hydraulic fracture fluid system the research shows the many potential
advantages that HVFR fluids offer including superior proppant transport capability almost
100 retained conductivity around 30 cost reduction and logistics such as minimizing
chemical usage by 50 and the ability to stoner operation equipment on location Finally
this comprehensive investigation addresses up-to-date of using HVFRs challenges and
emphasizes necessities for using HVFRs in high TDS fluids
v
ACKNOWLEDGMENTS
First and foremost I would like to thank Allah for giving me the strength and
opportunity to undertake this accomplished satisfactorily
I would like to express my sincere gratitude to my advisor Dr Ralph Flori for his
guidance patience encouragement and support during my PhD study I would also like
to thank Dr David Rogers Dr Mingzhen Wei Dr Kelly Liu DrSteven Hilgedick and Dr
Vamegh Rasouli for their great effort assistant and serving on my PhD committee
Equally I would like to express my appreciation to the police department at
Missouri SampT for their unlimited support and creative environment Million thanks go to
Chief Doug Roberts Assistant Chief Oscar Kemp Sergeant Bryan Fox and all the
Sergeants officers guards and CSOs team
Many thanks to my sponsor Al sheikh Engrsquor Abdullah Ahmed Bugshan Chief
Executive Officer of Hadramout Establishment for Human Development for sponsoring
my PhD I would also like to acknowledge the BJ Services US Silica and CoilChem LLC
that provided all the necessary materials for this research My further appreciation goes to
Jerry Noles Sangjoon Kim and CoilChem team for there unaltimate assistant during this
acadimec journey
The deepest gratefulness goes to all my friends for encouraging and propelling me
to endeavor to achieve my goals
Last but not least my cordial gratitude my precious and my love goes to my
parents my grandmother my beloved sisters brothers nephews nieces brotherrsquos in-law
sistersrsquo in-law and my sweet heart my wife thanks all for your continued support
vi
TABLE OF CONTENTS
Page
PUBLICATION DISSERTATION OPTION iii
ABSTRACT iv
ACKNOWLEDGMENTS v
LIST OF ILLUSTRATIONS xv
LIST OF TABLES xx
NOMENCLATURE xxii
SECTION
1 INTRODUCTION 1
2 RESEARCH OBJECTIVES 3
PAPER
I A CRITICAL REVIEW OF HIGH-VISCOSITY FRICTION REDUCERS
APPLICATIONS AS AN ALTERNATIVE HUDRAULIC FRACTURING
FLUIDS SYSTEM 5
ABSTRACT 5
1 INTRODUCTION 6
2 DESCRIPTION OF FRICTION REDUCERS AND HIGH-VISCOUS
FRICTION REDUCERS 9
3 LABORATORY AND FIELD STUDIES USING HVFR 13
31 DATA ANALYSIS OF USING HVFRS AT FIELD AND LAB
CONDITIONS 13
32 FRICTION REDUCER AS ADDITIVES VS AS A HVFR FRACTURE
FLUID 14
33 SCREENING CRITERIA GUIDELINES FOR HVFRS 18
vii
4 CONDUCTIVITY PROFILE 19
5 BREAKABILITY PROFILE 20
6 PRODUCED WATER WITH HVFRS 23
7 ECONOMIC ANALYSIS 26
8 CONCLUSIONS 29
REFERENCES 30
II INVESTIGATE THE RHEOLOGICAL BEHAVIOR OF HIGH
VISCOSITY FRICTION REDUCER FRACTURE FLUID AND ITS IMPACT
ON PROPPANT STATIC SETTLING VELOCITY 35
ABSTRACT 35
1 INTRODUCTION 37
2 PROPPANT STATIC SETTLING VELOCITY IN HYDRAULIC
FRACTURING 39
21 PARTICLE SHEAR RATE (ϔ) 40
22 APPARENT SHEAR VISCOSITY (μa) 40
23 WEISSENBERG NUMBER (Wi) 40
24 ELASTICITY TO VISCOSITY RATIO (λeυ) 41
25 FORCES INFLUENCED PARTICLES SETTLING VELOCITY 41
3 EXPERIMENT DESCRIPTION 42
31 MATERIALS 42
311 Hydraulic Fracturing Fluids 42
312 Preparing Fracturing Fluids 43
313 Proppant Sizes 43
314 Rheometer 43
32 SETTLING VELOCITY IN UNCONFINED FRACTURE SETUP 43
viii
33 RHEOLOGICAL CHARACTERIZATION OF THE HVFRS 44
331 Viscosity Profile Measurement 44
332 Elasticity Profile Measurement 44
333 Thermal Stability Measurement 44
334 Static Settling Velocity Measurement 44
4 RESULTS AND DISCUSSION 45
41 VISCOSITY MEASUREMENT RESULTS 45
42 ELASTICITY MEASUREMENT RESULTS 48
421 Normal Stress Measurements 50
43 THERMAL STABILITY MEASUREMENT RESULTS 52
44 SETTLING VELOCITY MEASUREMENT RESULTS 53
441 Qualitative Multi-Particle Static Settling Velocity 53
442 Quantitative Single Particle Static Settling Velocity 55
4421 Proppant size effect on static settling velocity55
4422 Effect of elasticity and viscosity properties on settling
velocity 56
5 COST ANALYSIS 60
6 CONCLUSIONS 61
REFERENCES 62
III STATIC PROPPANT SETTLING VELOCITY CHARACTERISTICS IN
HIGH-VISCOSITY FRICTION REDUCERS FLUIDS FOR UNCONFINED
AND CONFINED FRACTURES 65
ABSTRACT 65
1 INTRODUCTION 66
2 PROPPANT STATIC SETTLING VELOCITY 69
ix
21 WALL EFFECT (Fw) 69
22 PARTICLE SHEAR RATE (ϔ) 69
23 ELASTICITY TO VISCOSITY RATIO (λeυ) 70
24 FORCES INFLUENCED PARTICLES SETTLING VELOCITY 71
3 EXPERIMENT DESCRIPTION 72
31 MATERIALS 72
311 Hydraulic Fracturing Fluids 72
312 Preparing Fracturing Fluids 72
313 Proppant Sizes 72
314 Rheometer 72
32 EXPERIMENT SETUP 72
321 Unconfined Fracture Wall Experiments 72
322 Confined Fracture Wall Experiments 73
33 EXPERIMENT PROCEDURES 75
331 Viscosity Rheological Characterization of the HVFRs 75
3311 Viscosity profile measuremant 75
3312 Elasticity profile measurement 75
3313 Static settling velocity measurement 75
332 Static Settling Velocity Calculations Based on Power Law
Parameters (K n) 76
4 RESULTS AND DISCUSSION 77
41 VISCOSITY MEASUREMENT RESULTS 77
42 ELASTICITY MEASUREMENT RESULTS 78
43 SETTLING VELOCITY MEASUREMENT RESULTS 81
x
44 PROPPANT SETTLING VELOCITY PERFORMANCE IN
UNCONFINED FRACTURE WALL 81
45 PROPPANT SETTLING VELOCITY PERFORMANCE IN CONFINED
FRACTURE WALL 81
46 WALL EFFECT ON STATIC SETTLING VELOCITY 84
47 EFFECT OF VISCOSITY AND ELASTICITY OF HFVR ON PROPPANT
SETTLING VELOCITY 85
48 EFFECT OF ELASTICITY TO VISCOSITY RATIO (ΛEΥ) 87
5 COST ANALYSIS 88
REFERENCES 90
IV INVESTIGATE PROPPANT TRANSPORT WITH VARYING
PERFORATION DENSITY AND ITS IMPACT ON PROPPANT
DUNE DEVELOPMENT INSIDE HYDRAULIC FRACTURES 93
ABSTRACT 93
1 INTRODUCTION 94
2 EXPERIMENT DESCRIPTION 97
21 EXPERIMENT MATERIALS 97
22 FRACTURE MODEL SETUP 98
23 EXPERIMENT PROCEDURE 99
24 EXPERIMENT ANALYSIS APPROACHES 101
241 Equilibrium Dune Level (EDL) 101
242 Proppant Dune Level Development (PDLD) 101
243 Equilibrium Dune Length (EDX) 101
244 Pressure Losses Calculations 101
3 RESULTS AND ANALYSIS 102
31 NUMBER OF PERFORATION EFFECT 102
xi
32 PERFORATION OPENING SIZE EFFECT 105
33 SHEAR RATE EFFECT 107
34 FRACTURE ORIENTATION EFFECT 110
35 PROPPANT SIZE DISTRIBUTION EFFECT 113
4 DISCUSSION 116
41 EFFECT OF PRESSURE LOSS ALONG THE FRACTURE SLOT
ON PROPPANT TRANSPORT PERFORMANCE 116
42 MECHANISMS OF PROPPANT TRANSPORT 117
421 Stage 1 Hindered and Free Settling 117
422 Stage 2 Saltation 117
423 Stage 3 Suspension Rolling and Swirl at Inlet 118
424 Stage 4 Saltation Rolling and Swirl at Inlet 118
425 Thermal Stability Measurement 119
426 Static Settling Velocity Measurement 119
5 CONCLUSIONS 120
REFERENCES 121
V VISCOELASTIC CHARACTERIZATION EFFECT OF HIGH-
VISCOSITY FRICTION REDUCERS AND PROPPANT
TRANSPORT PERFORMANCE IN HIGH-TDS ENVIRONMENT 124
ABSTRACT 124
1 INTRODUCTION 125
11 PRODUCED WATER IN USA BASINS 130
2 EXPERIMENT DESCRIPTION 131
21 EXPERIMENT MATERIALS 131
211 Fracturing Fluids 131
xii
212 Frac Sand and Dosage 132
22 MEASUREMENTS OF RHEOLOGICAL PROPERTY 132
221 Friction Reducers Preparation for Rheological Property 132
222 Fracturing Fluid Viscosity Measurement 133
223 Elasticity Characterization (Elastic Modulus Grsquo) 133
224 Friction Reducers Preparation for Elasticity Property 133
225 Elastic Modulus Measurement 133
23 THE SETTLING RATE MEASUREMENT OF FRAC SAND IN HVFR
FRACTURING FLUID 134
231 HVFR Fracturing Fluid Preparation 134
232 Test Method on Frac Sand Settlement Rate 134
3 RESULTS AND ANALYSIS 134
31 THE VISCOSITY PROFILES OF VARIOUS FRICTION REDUCERS
IN DI WATER 2 WT KCL AND 10 LBS BRINE (SATURATED
NACL SOLUTION (TDS 347000 PPM)) 134
32 THE N AND K VALUES OF VARIOUS FRICTION REDUCERS
IN DI WATER 2 WT KCL AND 10 LBS BRINE (SATURATED
NACL SOLUTION (TDS 347000 PPM)) 137
33 THE ELASTIC MODULUS COMPARISON OF VARIOUS
FRICTION REDUCERS IN DI WATER AND 10 LBS BRINE
SOLUTION (TDS347000PPM) 137
34 PROPPANT SETTLING RATE RESULT 139
35 HVFR ELASTIC MODULUS CHARACTERISTICS BY
AMPLITUDE FREQUENCY FLUID TYPE AND TEMPERATURE 141
36 HVFR ELASTIC MODULUS PROFILES IN DI WATER amp 10 LBS
BRINE (TDS 347000 PPM) 143
37 HVFR ELASTIC MODULUS PROFILES BY TEMPERATURE 144
38 FIELD CASE STUDY 144
xiii
4 DISCUSSION THE POTENTIAL OF FORMATION DAMAGE 145
5 CONCLUSIONS 147
REFERENCES 148
VI A COMPREHENSIVE REVIEW OF FORMATION DAMAGE CAUSED
BY HIGH-VISCOSITY FRICTION REDUCERS WOLFCAMP CASE
STUDY 151
ABSTRACT 151
1 INTRODUCTION 152
2 FORMATION DAMAGE MECHANISMS 155
3 WHY HIGH VISCOSITY FRICTION REDUCERS 157
4 EXPERIMENTAL DESCRIPTION 158
41 EXPERIMENTAL MATERIALS 158
411 Experimental Materials 158
412 Proppant 158
5 MEASUREMENTS OF RHEOLOGICAL PROPERTY 160
51 SHEAR VISCOSITY CHARACTERIZATION (K N) 160
52 SHEAR ELASTICITY CHARACTERIZATION (ELASTIC
MODULUS Grsquo) 160
53 FRACTURE CONDUCTIVITY EXPERIMENT PROCEDURE 160
6 RESULTS AND ANALYSIS 161
61 RHEOLOGICAL CHARACTERIZATION OF THE HVFRS 161
611 Viscosity Profile Measurement 161
612 Elasticity Profile Measurment 162
xiv
62 CONDUCTIVITY AND PERMEABILITY MEASUREMENT
ON BASELINE 05 GPT AND 25 GPT 163
63 CASE STUDY WOLFCAMP FORMATION REEVES COUNTY TX 165
631 Geological Background 165
632 Fracture Design and Execution 165
7 CONCLUSIONS 167
REFERENCES 168
SECTION
3 CONCLUSIONS 172
REFERENCES 173
VITA 174
xv
LIST OF ILLUSTRATIONS
PAPER I Page
Figure 1 Visualization of proppant transport using friction reducer and high-viscosity
friction reducers 8
Figure 2 Friction reducers types 9
Figure 3 Chemical structure of various Friction Reduction (FR) agents and a
comparison of friction pressure for water containing only 2 KCl vs
water containing 2 KCl and 2 gallons per 1000 gallons (FR) and 10
Guar pumped down 4 frac12rdquo 115 4rdquo ID casing 11
Figure 4 Field case studies distribution of using HVFRs in North America 14
Figure 5 Box plots of temperature ranges of HVFRs in the lab measurements
and field application 15
Figure 6 Maximum loading of HVFRs applied in the field 15
Figure 7 Box plots of HVFR concentration ranges in the lab measurements and
field application 16
Figure 8 Box plots of concentration ranges of FR and HVFRs 16
Figure 9 Box plots of viscosity ranges of HVFRs at high shear rate 511 S-1 17
Figure 10 Box plots of viscosity ranges of HVFRs at low shear rate 70 S-1 18
Figure 11 Chemical cost reduction of using HVFRs from different case studies 27
Figure 12 Production improvement of using HVFRs from different case studies 28
Figure 13 Chemical cost comparison for standard Bakken system 29
PAPER II
Figure 1 Schematic of fracture setup for unconfined fluids 43
Figure 2 Effect of HVFR (left) and linear gel (right) concentrations as a function of
shear rate 46
Figure 3 Viscosity as a function of concentration of HVFRs (left) and linear gel
(right) at low shear rates 47
xvi
Figure 4 Elastic modulus and storage modulus as a function for HVFR-2 at
different concentration 49
Figure 5 Elastic modulus and storage modulus as a function of angular frequency
for linear gel at different concentrations 20ppt and 40ppt 50
Figure 6 Relaxation time as a function of concentration of HVFR-1 HVFR-2 and
HVFR-3 (left) and linear gel (right) 50
Figure 7 Effect of HVFR 2 concentration as a function in normal stress profile 51
Figure 8 Effect of HVFR 2 concentration as a function in normal stress profile 51
Figure 9 Thermal stability of viscosity as a function of shear rate of HVFR-2 (left)
and linear gel (right) 52
Figure 10 Thermal stability of viscosity as a function of shear rate of HVFR-2
(left) and linear gel (right) 53
Figure 11 Multi-static measurement for proppant settling time using HVFR-2 (2gpt)hellip54
Figure 12 Multi-static measurement for proppant settling time using HVFR-2 (4gpt)hellip55
Figure 13 Multi-static measurement for proppant settling time using liner gel (20 ppt)55
Figure 14 Effect of proppant settling velocity in HVFR-2 gpt vs linear gel-20 ppt
fracture fluids 56
Figure 15 Viscosity as a function of shear rate for HVFR-2 loading 2 gpt (left) and linear
gel loading 20 ppt (right) 57
Figure 16 Calculated elasticviscous ratio as a function of shear rate for HVFR-2
2 gpt and linear gel ndash 20 ppt 59
PAPER III
Figure 1 Schematic of fracture setup for unconfined fluids 73
Figure 2 Schematic of fracture setup for confined fluids 74
Figure 3 Schematic of the experimental fracture cell for measuring inclination
angle effect 75
Figure 4 Effect of HVFR-3 concentration as a function in viscosity shear profile 78
Figure 5 Elastic modulus Grsquo and storage modulus G`` as a function of HVFR-3
concentrations 79
xvii
Figure 6 Effect of HVFR 3 concentration as a function in Normal stress profile 80
Figure 7 Effect of proppant settling velocity in HVFR-3 gpt vs slickwater fracture
fluids 82
Figure 8 Settling velocity of HVFR vs slickwater in vertical fractures by 90 angle
vs inclined fractures angles 60 and 45 degree in confined fractures of
9 mm fracture width 83
Figure 9 Settling velocity reduction in slickwater versus HVFR-3 loading 2 in
different fracture orientation 84
Figure 10 Wall factors as a function of particle diameter to wall spacing in the
HVFR-3 loading 2 gpt 85
Figure 11 Viscosity as a function of shear rate for HVFR-3 loading 2gpt 86
Figure 12 Velocity ratio as a function of proppant diameter in HVFR-3 loading
2 gpt 87
Figure 13 Calculated elasticviscous ratio as a function of shear rate for HVFR-3
loading 2 gpt 88
PAPER IV
Figure 1 Schematic schematic of the experimental proppant transport evaluation
system 99
Figure 2 Effect of number of perforations at first FPV 103
Figure 3 Effect of number of perforations on EDL 104
Figure 4 Effect of number of perforations on fracture propped area 104
Figure 5 Real picture of experiment results shown number of perforation effect on
proppant transport top-perf (left) bottom-perf (middle) and
multi-perf (right) 104
Figure 6 Effect of perforation opening size at first FPV 105
Figure 7 Effect of perforation opening size on EDL 106
Figure 8 Real picture of experiment results shown perforation opening size effect
on proppant transport perf opening 100 (left) perf opening 60
(middle) and perf opening 40 (right) 106
Figure 9 Effect of fracture shear rate at first FPV 107
xviii
Figure 10 Real picture of experiment results shown shear rate effect on proppant
transport high shear rate (left) and low shear rate (right) 108
Figure 11 Effect of high (60s minus 1) and low (35s minus 1shear rates on EDL 109
Figure 12 Effect of shear rate on EDL 109
Figure 13 Effect of shear rate on on fracture propped area 110
Figure 14 Effect of fracture orientation (vertical vs inclined) at first FPV 111
Figure 15 Effect of fracture orientation (vertical vs inclined) on EDL 111
Figure 16 Effect of fracture orientation (vertical vs inclined) on fracture propped
area 112
Figure 17 Real picture of experiment results shown perforation opening size effect
on proppant transport inclined fracture (left) and vertical fracture (right) 113
Figure 18 Effect of proppant size at first FPV 114
Figure 19 Effect of proppant size on EDL 114
Figure 20 Effect of proppant size on on fracture propped area 115
Figure 21 Real picture of experiment results shown proppant size effect on proppant
transport 100 mesh (left) 4070 mesh (middle) and 2040 mesh (right) 115
Figure 22 a and b pressure loss along fracture slot on shear rate (left) and shear rate
effect on Fracture propped area (right) 116
PAPER V
Figure 1 The viscosity profile of various friction reducers in DI water 136
Figure 2 The viscosity profile of various friction reducers in 2wt KCl solution 136
Figure 3 The viscosity profile of various friction reducers in 10 lbs brine 136
Figure 4 Frac sand settling rate comparison with various HVFR dosage 140
Figure 5 The elastic modulus measurement of HVFR xanthan emulsion polymer
and guar at 75 150 and 250 in DI water (left) 10 lbs brine solution
(right) 141
xix
Figure 6 The elastic modulus characteristic of HVFR by amplitude and frequency
at room ambient 142
Figure 7The elastic modulus characteristic of HVFR by fluids (DI water vs
10 lbs brine) 143
Figure 8 The elastic modulus characteristic of HVFR by temperature 144
Figure 9 Hydraulic fracture treatment plot from Well-C using HVFRs 145
Figure 10 Conductivity and permeability on baseline 05 gpt and 25 gpt at
2000 psi and 24 hr 147
PAPER VI
Figure 1 Classification of the common formation damage mechanisms 156
Figure 2 HVFR viscosity profile with various dosage in fresh water 162
Figure 3 HVFR elastic property with various dosage in fresh water 163
Figure 4 Conductivity and permeability on baseline 05 gpt and 25 gpt by
pressure and time 164
Figure 5 Hydraulic fracture treatment plot from Well-H using HVFRs 166
Figure 6 HVFR dosage real time data 167
xx
LIST OF TABLES
PAPER I Page
Table 1 Summary of viscosity data of HVFRs reviewed in this paper 19
Table 2 High viscosity friction reducers concentration gpt 19
Table 3 Fracture conductivity data of HVFRs reported in this paper 21
Table 4 Breakability data of HVFRs summarized in this paper 22
Table 5 Chemical composition of produced water in Delaware basin 24
Table 6 Produced water TDS used with HVFRs 25
Table 7 Stimulation summary of case study 29
PAPER II
Table 1 Power law model equations and parameters (n k) for HVFRs and linear gel 47
Table 2 Weissenberg number calculation as a function of relaxation time and
particle shear rate 58
Table 3 ElasticViscous ratio 120582119890120592 calculations 59
Table 4 Stimulation summary of case study 60
PAPER III
Table 1 Power law model equations and parameters (n k) for HVFR-3 78
Table 2 Particles shear rate calculations for HVFR 86
Table 3 ElasticViscous ratio 120582119890120592 calculations 89
PAPER IV
Table 1 APIISO properties of the tested US silica white sand proppants 98
Table 2 List of experiments and parameters 100
Table 3 shows pressure losses effect at 1st FPV on EDL and Xf 117
xxi
Table 4 Four proppant transport mechanisms to reach the PDLD 119
PAPER V
Table 1 The molecular weight of friction reducers 132
Table 2 The n and K values with viscosities reading of friction reducers in
various fluids 138
Table 3 The effect of dosage of HVFRs on proppant settling rate 140
PAPER VI
Table 1 Fracture damage categories 156
Table 2 Proppant sieve analysis for baseline 159
Table 3 Proppant sieve analysis for 05 gpt 159
Table 4 Proppant sieve analysis for 25 gpt 159
Table 5 The regain percentage of 05 gpt and 25 gpt 165
xxii
NOMENCLATURE
Symbol Description
ϔ particle shear rate
η(ϔ) Shear viscosity
N1(ϔ) First normal stress
μa Apparent shear viscosity
Wi Weissenberg number
λ Relaxation time
λeυ Elasticity to viscosity ratio
ρp Particle density
ρf Fluid density
CD Drag coefficient
1
35
1 INTRODUCTION
Hydraulic fracturing is the most efficient and effective technique enabling greater
economic access for oil and gas production in unconventional shale gas plays Increasing
production and reserves from low-permeability hydrocarbon bearing rocks prerequisite
stimulation treatment is required to make the fracturing process successfully and
economically feasible Transport of proppant into fractures that either hydraulically created
or naturally existed should be fully understood Proppant transport is influenced by a
complex combination of parameters including particle size density fracture dimensions
base fluid rheological properties Different types of fluids are used to enable the transport
of proppant into the fractures An important characteristic of fracturing fluid is to be
compatible with reservoir fluids should be cost effective environmentally friendly and
cause less damage to formation and fracture conductivity
Most of the fluids encountered in the industrial applications tend to have both the
shear thinning and the viscoelastic properties A shear-thinning characteristic indicates that
the fluid viscosity decreases with the increasing shear rate A viscoelastic fluid
demonstrates both viscous and elastic behavior under deformation in hydraulic fracturing
for effective proppant transport and to avoid their premature settling hydraulic fracturing
fluids are advised to have viscoelasticity (Acharya 1988 Adrian 2005) Therefore
knowledge of the particle settling behavior and the particle settling velocity in viscoelastic
shear thinning fluids is indispensable to optimize the properties of these industrial fluids
Essentially fluid selection and proppant placement play the main key in the hydraulic
fracturing process (Ba Geri et al 2019 Ellafi et al 2019)
2
Several types of farcing fluids have been applied including the use of slickwater
linear gel crosslinked in the USA basins The success of a fluid selection process depends
primarily on the length of the fracture and proppant distribution and placement in fracks
Thus understanding fluid composition ability to create fractures the capability to carry
and transport proppant deep into the fracture easy to flow back with minimal damage effect
through production from shale formation is the key a crucial successful fracking treatment
Even though slickwater (water fracturing with few chemical additives) used to be
one of the most common fracturing fluids several concerns are still associated with its use
including usage of freshwater high-cost operation and environmental issues Therefore
current practice in hydraulic fracturing is to use alternative fluid systems that are cost
effective and have a less environmental impact such as fluids which utilize high viscosity
friction reducers (HVFRs) which typically are high molecular weight polyacrylamides
Moreover the recent and rapid success of using HVFRs in hydraulic fracturing treatments
is due to several advantages over other fracture fluids (eg linear gel) which include better
proppant carrying capability induce more complex fracture system network with higher
fracture length and overall lower costs due to fewer chemicals and less equipment on
location
3
2 RESEARCH OBJECTIVES
The ultimate goal of this project is to expand the horizon of understanding proppant
transport using different fracture fluids in particular HVFRs in complex fracture system
Our new fracture model will be capable of achieving that goal The new fracture model can
be used to evaluate the impact of fracture geometry half-length injection pump rate
proppant type size amp shape proppant concentration fluids viscosity fluids elasticity leak-
off number of perforations natural fracture angles particle settling velocity fracture wall
roughness width heterogeneity and proppant distribution in the complex fracture network
on the transport of the proppant through fractures using different fracture fluids The
specific objectives of this research therefore include
bull To provide a better understanding of the advanced technologies of using high
viscosity friction reducer including the capability of carrying proppant in hydraulic
fracturing treatments The goal also is to statistically analyze the main associated
factors with HVFR such as concentration temperature viscosity and breakability
bull This project investigated several major factors affect proppant settling velocity
including viscosity measurement profiles elasticity properties (Normal forces and
relaxation time) and thermal stability profile
bull In addition this work conducted laboratory work intensively to fill the knowledge
gap This study investigated three factors that could affect proppant settling velocity
performance proppant size wall effect and fracture orientation
4
bull This study was deeply investigated five factors that affect proppant transport
performance number of perforations perforation opening size slurry shear rate
fracture orientation and proppant size distribution
bull This work will provide a comprehensive study of the effects of elasticity and shear
viscosity on proppant settling velocity using HVFRs and linear gel in fresh water
and produced water
bull A proper fracture lab slot will be upscaling to evaluate proppant transport
performance using HVFRs to the field implementations
5
PAPER
I A CRITICAL REVIEW OF HIGH-VISCOSITY FRICTION REDUCERS
APPLICATIONS AS AN ALTERNATIVE HUDRAULIC FRACTRUING
FLUIDS SYSTEM
Mohammed Ba Geri Abdulmohsin Imqam and Ralph Flori
Deparment of Petroleum Engineering Missouri University of Science and Technology
Rolla MO 65409
ABSTRACT
The primary purpose of using traditional friction reducers in stimulation treatments
is to overcome the tubular drag while pumping at high flow rates Hydraulic fracturing is
the main technology used to produce hydrocarbon from extremely low permeability rock
Even though slickwater (water fracturing with few chemical additives) used to be one of
the most common fracturing fluids several concerns are still associated with its use
including usage of freshwater high-cost operation and environmental issues Therefore
current practice in hydraulic fracturing is to use alternative fluid systems that are cost
effective and have less environmental impact such as fluids that utilize high-viscosity
friction reducers (HVFRs) which typically are polyacrylamides with high molecular
weight
This paper carefully reviews and summarizes over 40 published papers including
experimental work field case studies and simulation work This work summarizes the
most recent improvements of using HVFRs including the capability of carrying proppant
6
reducing water and chemical requirements compatibility with produced water and
environmental benefits in hydraulic fracturing treatments A further goal is to gain insight
into the effective design of HVFR-based fluid systems
The findings of this study are analyzed from over 26 field case studies of many
unconventional reservoirs In comparing HVFRs to the traditional hydraulic fracture fluids
system the paper summaries many potential advantages offered by HVFR fluids including
superior proppant transport capability almost 100 retained conductivity cost reduction
50 reduction in chemical use by less operating equipment on location 30 less water
consumption and fewer environmental concerns The study also reported that the common
HVFR concentration used was 4 gpt HVFRs were used in the field at temperature ranges
from 120 to 340 Finally this work addresses up-to-date challenges and emphasizes
necessities for using HVFRs as alternative fracture fluids
1 INTRODUCTION
Hydraulic fracturing has been successfully implemented since its inception in 1947
To achieve commercial production from ultra-low permeability formation development in
fracturing fluids is the key factor for stimulation operations Although a variety of
fracturing fluids have been used to increase the productivity of unconventional reservoirs
low viscous (slickwater) and high viscous (crosslinkers linear gel) fluids still have some
problems in terms of lower capability to carry proppant creating formation damage high-
cost operation and environmental concerns
7
In recent years the oil industry has adopted the use of high-viscosity friction
reducers (HVFRrsquos) in fracturing fluids due to several operational and economic reasons
(Hu et al 2018 Van Domelen et al 2017 Motiee et al 2016) Friction reducers are mostly
long-chain polyacrylamide-based (PAM) polymers Usually friction reducers are added to
water-based fracturing fluids to hydrate ldquoon the flyrdquo as water in oil emulsions (Wu et al
2013 Tomson et al 2017) Most water-soluble polymeric friction reducers have high
molecular weight (normally over 10 M) polymers Sun et al (2011) The primary function
of friction reducers is to change turbulent flow to laminar flow by reducing frictional loss
by 70-80 while pumping fracturing fluids (Tomson et al 2017 Sun et al 2011 White
and Mungal 2008)
Both academic research and industrial implementation have demonstrated the
success of friction reducers within and outside the oil industry Aften et al (2014) Because
of the ability of friction reducers to flocculate solids in liquid phase PAM polymers have
been used extensively in water treatment In the oil and gas industry PAM has primarily
been used in a variety of applications including enhanced oil recovery (EOR) acid gelling
agents clay control during drilling and hydraulic fracturing These applications require
flexibility and simplicity of PAMs stability under harsh conditions such as high reservoir
temperatures and high salinity waters (Ryles et al 1986 StimLab 2012 Clark et al 1976)
Research continues developing improved hydraulic fracturing fluids to lessen the
problems associated with current fracturing fluids like guar-based gels and slickwater
Slickwater fracturing fluids have low concentrations of friction reducers falling between
05 and 2 gallons per thousand gallon (gpt) (Rodvelt et al 2015 Ifejika et al 2017) HVFR
fluids can replace slickwater by minimizing proppant pack damage and can carry the same
8
amount of proppant as linear gel or better with less formation damage (Ba Geri et al
2019b Kunshin et al 2018) Figure 1 shows that HVFRs can have better proppant transport
capability along fractures compared to slickwater with friction reducer additives
Figure 1 Visualization of proppant transport using friction reducer and high-viscosity
friction reducers (slbcombroadband)
The objectives of this critical review study are to provide better understanding of
the advanced technologies of using high-viscosity friction reducers including capability of
carrying proppant reducing water and chemical requirements compatibility with produced
water and environmental benefits in hydraulic fracturing treatments The goal also is to
statistically analyze the main associated factors with HVFRs such as concentration
temperature viscosity and breakability
9
2 DESCRIPTION OF FRICTION REDUCERS AND HIGH-VISCOUS
FRICTION REDUCERS
Friction reducers are typically long-chain polyacrylamides (PAM) in dry powder
and liquid forms that can be added in the concentration range from 05 to 2 gpt to water to
make slickwater PAMs for unconventional reservoirs can be classified into three main
categories (see Figure 2) anionic nonionic and cationic Hashmi et al (2014) They may
also be classified as hydrophobic and amphoteric Tomson et al (2017) An anionic nature
for most friction reducers is obtained from 30 mole acrylic acid co-polymers The
maximum reduction of friction reducers can be obtained by dissolving the polymer into
aqueous solution to become fully inverted before injected as fracturing fluid Friction
reducers have high dissolvability level in water a high viscosity and sufficient energy loss
reduction
Figure 2 Friction reducers types
The most common friction reducer is anionic due to its lower cost and better drag
reduction Chung et al (2014) Water salinity and quality are the two main factors that
determine the effectiveness of friction reducers Drag reduction of friction reducers rely on
their backbone flexibility and radius of gyration (molecular size) Drag reduction decreases
by increasing the molecular weight or size In freshwater the friction reducers have large
10
radius of gyration which increases in the friction reducers performance The same amount
of friction reducers in produced water has small gyration radius so increased FR
concentration is needed to attain the same drag reduction level in high TDS water (Chung
et al 2014 Rimassa et al 2009 Shah et al 2018) Lastly less friction reduction can be
provided by uncharged (non-ionic) friction reducers than charged ones (Ozuruigbo et al
2014 Chung et al 2014)
Using polymers in oil field applications has evolved and expanded from acid
gelling agents drilling operations and EOR applications to fracturing fluid systems that
are carefully designed to have optimum characteristics To achieve these characteristics
different chemical structure forms have been developed to fit the designed purpose of each
case In addition the chemistry of the water that is used in hydraulic fracturing
treatmentsmdashand particularly its salinitymdashare two main factors considered during friction
reducer selection As presented in Figure 3 the most prevalent friction reducers used in the
oil and gas industry are polyacrylamide- (PAM-) based polymers acrylamido-methyl-
propane sulfonate polymer (AMPS) polyacrylic acid (PAAc) and hydrolyzed
polyacrylamide (PHPA) Montgomery (2013) Their structural forms are as shown in
Figure 3
There are also many forms of the friction reducer that can be delivered to the field
application The most popular forms are the liquid inverse emulsion and dried In addition
to these polymers other types of friction reducers are viscoelastic surfactants dispersion
polymers fibers metal complexed surfactants and various microscopic structures Aften
et al (2014)
11
The inclusion of a friction reducer is one of the main components of slickwater
fracture fluids and other stimulation fluids The primary function of friction reducers is
changing turbulent flow to laminar flow which can reduce frictional loss during pumping
fracturing fluids up to 80 Recently high-viscosity friction reducers (HVFRs) have
gaining popularity as drilling and hydraulic fracturing fluids because the HVFRs exhibit
numerous advantages such as the following
Figure 3 Chemical structure of various friction reduction (FR) agents and
a comparison of friction pressure for water containing only 2 KCl vs water containing
2 KCl and 2 gallons per 1000 gallons (FR) and 10 Guar pumped down 4 frac12rdquo 115 4rdquo
ID casing (Montgomery 2013)
bull Reduced pipe friction during fracturing treatments
bull High regain conductivities compared to linear and crosslinked gels
bull Lower operational cost
o Uses less water compared to conventional slickwater treatments
o Consumes 33-48 less chemicals
o Requires less equipment on location
o Requires less number of tanks trucks in the field
bull More fracture complexity using a less viscous fluid system
bull Better hydrocarbon production results compare to or greater than other fluids
12
bull Improved flexibility to design treatments that balance technical economic and
operational goals
bull Reduced freshwater proppant and equipment requirements compared with
conventional fluid systems
bull Minimized environmental footprint with selection of engineered additives
bull Simplified operations by reduced screen out risks
In order to make a successful hydraulic fracturing treatment the fracking fluid
selection process is a significant step in these ultra-low permeability reservoirs The
ultimate purpose of the fracturing fluid is to induce a complex network fracture system and
to have the capability of carrying proper amount of proppant deeply into the fractures
Essentially fluid selection and proppant placement are key to the hydraulic fracturing
process The ultimate success of the fluid selection process depends primarily on the length
of the fracture achieved and proppant distribution and placement in fracks Thus
understanding fluid properties and performance such as its composition ability to create
fractures ability to carry and transport proppant deep into the fracture and ease to flowback
with minimal damage through production from shale formations is the key to a crucial
successful fracking fluid and treatment Ideally the HVFRs should have the following
physical characterization to achieve the ultimate performance as fracturing fluids (Sareen
et al 2014 Ke et al 2006 Carman et al 2007 Aften et al 2010)
1 The polymer should have good dispersion or solubility in various aqueous
phases
2 Compatible with other fracturing fluids additives eg clay stabilizer
3 Should be less shear sensitive
13
4 Quick to hydrate in fluid ldquoon-the-flyrdquo
5 Compatible with high TDS and hardness
6 Easy to break and clean up
7 Good thermal stability and
8 Low environmental impact
3 LABORATORY AND FIELD STUDIES USING HVFR
This work analyzes data collected from more than 26 field case studies that
implemented High-viscosity friction reducers in unconventional reservoirs For example
in the Permian basin four different case studies were applied using HVFR successfully
which represent 16 of case study distribution of using HVFRs in North America The
main findings of each case are highlighted in Figure 4
31 DATA ANALYSIS OF USING HVFRS AT FIELD AND LAB CONDITIONS
Figure 5 shows the temperature ranges for lab and field conditions HVFRrsquos were
tested at minimum temperatures of 70 in the lab and 140 at field conditions The
reported data also showed that HVFRrsquos were tested at maximum temperature of 180 in
the lab and 335 in field studies
Figure 6 shows the HVFR concentration range used in hydraulic fracture treatment
in different US basins (Van Domelen et al 2017 Hu et al 2018) The collected data show
that HVFR concentration ranged were from 25 gpt to 35 gpt
14
Figure 4 Field case studies distribution of using HVFRs in North America
Figure 7 reports the concentration distributions of HVFRs in lab evaluation and
field application The lab test covers a wide HVFR concentration ranges from 1gpt to
10gpt while the field applications have an HVFR concentration range between 05 gpt and
4 gpt
32 FRICTION REDUCER AS ADDITIVES VS AS A HVFR FRACTURE FLUID
Figure 8 presents the low concentrations of friction reducers used only as fluid
additives versus their higher concentration used as a key ingredient in HVFR-based
fracture fluids Friction reducers as an additive cover a small range from 05 gpt to 2 gpt
while as HVFRs covered a large range from 1 gpt to 10 gpt
Figure 9 reveals the viscosity ranges of HVFR fluids at high shear rate (511119904minus1)
corresponding to various concentrations of HVFR in the fluids HVFRrsquos at 8 gpt can have
viscosities as high as 54 cp whereas at low concentrations such as 2gpt of HVFR the
typical viscosity ranges were from 7 to 15 cp
15
Figure 5 Box plots of temperature ranges of HVFRs in the lab measurements and field
application
Figure 6 Maximum loading of HVFRs applied in the field
Figure 10 illustrates the viscosity ranges of HVFR fluids at low shear rate (70 s-1)
corresponding to various concentrations of HVFR in the fluids Since the shear rate inside
the fractures is between 100119904minus1 and 10119904minus1 the selected viscosity profile for data analysis
was at 70119904minus1 Ba Geri et al (2019a)
0
05
1
15
2
25
3
35
4
STACKAnadarko
Basin
within the
Meramec
Eagle Ford
Fayette County
TX
Haynesville
HV
FR
Lo
ad
ing
g
pt
Field name
16
Figure 7 Box plots of HVFR concentration ranges in the lab measurements and field
application
Figure 8 Box plots of concentration ranges of FR and HVFRs
The rapid increase in viscosity as shear rate decreases helps in carrying proppant
farther through the fractures For example the window range of 4 gpt HVFRs for the
viscosity was from 20 cp to 80 cp
17
Figure 9 Box plots of viscosity ranges of HVFRs at high shear rate 511 119904minus1
Table 1 summarizes the extracted viscosity data of HVFRs The viscosity profile
of HVFRs depends on many factors including polymer concentration shear rate time
solvent properties and temperature Aften et al (2014) Increasing temperature from 70
to 180 decreases the viscosity from 40 cp to 30 cp Motiee et al (2016) Decreasing
HVFR concentration from 8 gpt to 2 gpt can reduce the viscosity by 75 (from 40 cp to
10 cp at the same shear rate and temperature conditions) Kunshin et al (2018) A thermal
study of high concentration 8 gpt of HVFRs was studied by Ba Geri et al (2019) The study
observed that increase HFVR temperature from 77 to 176 decreased the HVFR
viscosity profile from 33 cp to 13 cp respectively
18
Figure 10 Box plots of viscosity ranges of HVFRs at low shear rate 70 119904minus1
33 SCREENING CRITERIA GUIDELINES FOR HVFRS
Table 2 provides screening guidelines for HVFRs in terms of fluid concentration
and viscosity The range of each property used in the lab measurements and field
application is reported for more successful treatment The concentration of HVFRs is a
significant parameter for the selection process The maximum concentration of HVFRs
was 10 gpt and 4 gpt in the laboratory and field application respectively Several factors
control the concentration selection such as water source high TDS and formation damage
so in the field trials 4 gpt was the maximum In addition the temperature effect was also
investigated in this paper The maximum temperature was 180 and 335 in laboratory
and field application respectively Increasing the temperature lowered the HVFR viscosity
profile due to the thermal degradation of the fluid
19
Table 1 Summary of viscosity data of HVFRs reviewed in this paper
Measurement Conditions
HVFRs Concentration
(gpt)
Temperature
[]
Shear Rate
(119904119890119888minus1)
Viscosity
(cp) Reference
HCFR 10 70 511 40 Motiee et al 2016
HCFR 2 70 511 7 Motiee et al 2016
HCFR 6 70 150 40 Motiee et al 2016
HCFR 6 180 150 30 Motiee et al 2016
HVFR 45 NA 511 165 Hu et al 2018
HVFR 225 NA 511 102 Dahlgren et al 2018
HVFR 4 200 50 17 Dahlgren et al 2018
HVFR 2 200 50 5 Dahlgren et al 2018
HVFR 8 70 511 40 Kunshin et al 2018
HVFR 2 70 511 10 Kunshin et al 2018
HVFR 8 77 511 33 Ba Geri et al 2019b
HVFR 8 176 511 13 Ba Geri et al 2019b
Table 2 High viscosity friction reducers concentration gpt
Minimum Maximum Mean Median Standard Deviation
Laboratory 1 10 436 4 225
Field 05 4 263 275 087
High Viscosity Friction Reducers Temperature
Minimum Maximum Mean Median Standard Deviation
Laboratory 70 180 1267 135 275
Field 140 335 2393 158 487
4 CONDUCTIVITY PROFILE
Achieving high fracture conductivity is a primary goal of hydraulic fracturing
treatment because these conductive channels enable flow of oil and gas from the formation
20
to the wellbore Many factors influence the fracture conductivity such as proppant size and
type fracture closure stress and fracturing fluid type HVFR fracturing fluids are rapidly
gaining in popularity because of their numerous advantages Table 3 summarizes the
regained conductivity using HVFR fracture fluids Motiee et al (2016) used high
concentrations of friction reducers (HCFR) of 14 gpt They conducted conductivity
experiments under high temperature system 220degF for 25 hours and concluded that using
14gpt of HCFR gives 72 of regained conductivity while by adding 1ppt of breaker the
regained conductivity increased up to 80
Moreover Van Domelen et al (2017) evaluated the viscosity-building friction
reducers experimentally and in the field application The experiment conditions were 2
lbsqft 3050 sand at 180 degF using 1gpt of breaker The study presented that the regained
permeability was 96 at time zero then the regained permeability increased to 93 and
106 by increasing test time from 24 hours to 50 hours Huang et al (2018) presented an
engineered low-polymer-loading non-cross-linked (ELN) fluid A conductivity test was
performed using carbonate core and sandstone core under closure pressure 1800 psi at
250 Promising results concluded that 89 and 91 regained permeability was observed
for sandstone and carbonate core respectively
5 BREAKABILITY PROFILE
Currently HVFRs as a completion fluid have been successfully used in
unconventional formations However some concerns remain of the potential formation
damage that might occur by using these high molecular weight polyacrylamide-based
21
fluids Therefore to address these concerns different types of breaker system are required
to eliminate or minimize the possible damage to fracturing treatment (Kern 1962 Brannon
and Ault 1991 Economides and Nolte 2000)
Table 3 Fracture conductivity data of HVFRs reported in this paper
HVFRs
Type
Concentration
(gpt)
Breaker
(gpt)
Closure
Stress
(psi)
Shut-
in
Time
(hrs)
Temperature
[]
Regained
Conductivity
() Reference
HCFR 14 NB 2000
25 220
72 Motiee et al
2016
HCFR 14 1 2000 25 220 80
VFR 3 1 2000
24 180
93 Van Domelen et
al 2017
VFR 3 1 2000 50 180 106
ELN NA NA 1800
NA 250
91 Huang et al
2018
Degradation of polyacrylamide can occur biologically and chemically Various
types of breakers such as oxidative breakers are commonly used to break the polymers and
reduce their viscosity The chemical reaction of the breaker is controlled by several factors
such as breaker dosage temperature and composition of the fluid breaker chemistry
polymer concentration and pH Table 4 summarizes the work that has been performed for
evaluating the breakability profile after using HVFR fracture fluids Stim-Lab (2012)
investigated using high loading (14 gpt) of HVFRs with and without breaker on retained
conductivity compared to linear gel 30 ppt At the same lab conditions temperature 220
closure pressure 2000 psi and test time 25 hours retained conductivity present was 72
22
without breaker while with using 1 ppt of ammonium persulfate the retained conductivity
increased up to 80
Table 4 Breakability data of HVFRs summarized in this paper
Breaker
Type
Concentration
(gpt) FR
Breaker
(ppt)
Time
(hrs) Temperature
[]
Breaker
Released
()
Reference
AP 14 1 25 220 80 Stim-Lab2012
NA 3 1 24 180 93 Van Domelen et
al 2017
Ammonium
Persulfate 3 1 2 180 33 Sun et al 2010
Live
oxidizer 3 01 2 180 83 Sun et al 2010
Live
oxidizer 3 05 2 180 92 Sun et al 2010
Van Domelen et al (2017) conducted a conductivity test to compare the crosslinked
and Viscous FR (VFR) with 1ppt breaker The measurements were performed at the same
conditions of temperature 180 and 2lbsq of 3050 of proppant After 24 hours of testing
the regained conductivity was 33 and 93 of 15 lbMgal crosslinked and 3 gpt of VFR
correspondingly Sun et al (2010) studied breaker behavior on viscous slickwater in
unconventional reservoirs Adding 1ppt of encapsulated oxidizer breaker to 8 gpt HVFR
at 180 for 2 hours began break down viscosity profile After two hours the viscosity
decreases from 120 cp to 80 cp at shear rate 40 119904minus1 At the same experiment conditions
they tried to use another breaker live oxidizer breaker with different concentration 01 ppt
and 05 ppt The viscosity profile of 8 gpt HVFR rapidly dropped out from 120 cp to 20 cp
when the 01 of live oxidizer breaker was used They also compared solid residue from 20
ppt of linear gel and from 40 gpt HVFR at 150 for two hours The observation of the test
was that HVFR had only little residue while liner gel had a large amount of residue
23
6 PRODUCED WATER WITH HVFRS
Slickwater fracture fluid has been proven as one of the best fracture fluids in terms
of high fracture length and low cost However government regulations have increased due
to large amounts of water consumption in hydraulic fracturing techniques to increase the
productivity of shale rocks According to the US Environmental Protection Agency (EPA)
the hydraulic fracturing operations require between 70 and 140 billion gallons of water
annually in the United States alone (API 2017) Therefore using produced water instead
of fresh water is gaining traction to minimize water usage reduce environmental impacts
and increase hydrocarbon recovery from unconventional formations However generally
polymer friction reducers perform more poorly in high salinity waters High salinity
produced waters are more common in the Marcellus and the Bakken basins with high TDS
ranging fro7m 30000 to 50000ppm and over 225000 mgl respectively Almuntashri
(2014) noted that produced water contains solid suspension and bacteria these bacteria
generate enzymes that degrade the polymer viscosity significantly
Sareen et al (2014) developed a friction reducer (Table 5) compatible with high-
salinity produced water used with slickwater in hydraulic fracturing treatments The case
study in Delaware basin reported that the friction reducer was compatible with produced
water containing over 250000 ppm TDS and 90000 ppm total hardness The maximum
concentration of friction reducer was 15 gpt and the bottomhole temperature was 136
The application was implemented in 17-stages with significant 40 reduction on the
amount of proppant increasing the oil production by 50 and 20increase of gas
production compared to conventional friction reducer
24
Table 5 Chemical composition of produced water in Delaware basin (Sareen et al 2014)
Specific gravity 12 pH 602
Temperature 70
Cations ppm Anions ppm
Sodium 73978 Chloride 149750
Calcium 12313 Sulfates 250
Soluble Iron (Fe) 10 Bicarbonates 61
Magnesium 4992
Total Hardness 51781 ppm (CaCO3)
Total Dissolved Solids 241354 ppm
Calcium Carbonate Index 1083360
Calcium Sulfate Index 4440000
Table 6 summarizes the work that has been performed to evaluate using produced
water with HVFRs Sareen et al (2014) presented an experimental study on HFVRs in
fresh water and salt water with HVFR varying from 1 to 6 gpt A variety of HVFR systems
were tested including both anionic and cationic HVFRs with surfactants They examined
their viscosity profile and settling velocity measurements The study concluded that
surfactant and polymer type systems play a key role in the viscosity-shear rate profile
Sanders et al (2016) presented field trials using dry friction reducer (DFR) in the
Fayetteville shale with produced water having approximately 10000 ppm TDS The DFR
provided a better placement of proppant and has more advantages compared to gel-based
systems in terms of environmental effect and logistical costs Johnson et al (2018) reported
successful case studies implemented in Marcellus and Bakken shale using high-brine
viscosity-building friction reducer (HBVB) in high brine produced water The TDS in
Marcellus formation was in the range of 30000 to 50000 ppm Lab measurements were
performed to HBVB at shear rate 50 119904minus1 The viscosity profile of HBVB loading 5 gpt at
50 119904minus1 was 45 cp and decreased to 12 cp in fresh water and produced water
25
correspondingly In Marcellus shale HBVB is used in the field to replace guar-based
systems HBVB has better performance results in lab measurements and field applications
Moreover seven different types of friction reducers were selected to apply in the Bakken
field in North Dakota six of them did not work well because they were not compatible
with the produced water The seventh one was successfully used with loading from 15 gpt
to 36 gpt HBVB Six stages of that well were treated by HBVB product with effective
carrying proppant concentration up to 3 ppa
To conclude utilizing produced water for hydraulic fracturing in the oil and gas
industry is gaining popularity because using produced water leads to operational cost
savings and has environmental benefits However compatibility of the friction reducers
with the various types of produced water requires different test protocols
Table 6 Produced water TDS used with HVFRs
HVFRs
Loading
(gpt)
Temperature
()
Produced
water TDS
(ppm)
Produced
water total
hardness
(ppm)
Findings References
15 136 240000 50000
50 oil production
increase 40 less
proppant
Sareen et al
2014
075 175 10000 NA Better placement of
proppant
Sanders et al
2016
358 NA 50000 NA Significant cost
reduction
Johnson et al
2018
26
7 ECONOMIC ANALYSIS
Several successful field case studies were adopted using HVFRs as an alternative
for conventional hydraulic fracturing fluids They addressed clearly the main concern of
the HVFR systems which is its capability to carry a sufficient amount of proppant with
less formation damage Hu et al (2018) In 2012 Stim-Lab performed an extensive
investigation about regained conductivity using high concentration (14 gpt) of HVFRs
compared to 30 ppt linear gel fluid Superior results from the evaluation test shows that 14
gpt can regain conductivity up to 80 Dahlgren et al (2018) reported economics cost
evolution in the STACK play using three case studies In cases 1 and 2 the fracturing fluid
system was changed from a hybrid system to HVFR with max proppant concentration of 5
ppg Moreover in Case 3 HVFR was used for around 32 stages with successful chemical
cost reduction about 38 Due to the fast hydration process and fewer chemicals used the
chemical cost savings that used on case 1 2 and 3 were 32 33 and 38 respectively
Figure 11 presents the chemical cost reduction of using HVFRs during hydraulic fracturing
applications In the Utica plays the cost reduction reached almost 80 compared with
previous hydraulic fluids
Furthermore using HVFRs provided promising results in production
improvements as shown in Figure 12 The Eagle Ford Haynesville and Utica reported
over 60 improvement in hydrocarbon production while around 30 increasing in oil
production occurred in the STACK play
27
Figure 11 Chemical cost reduction of using HVFRs from different case studies
Dahlgren et al (2018) showed case studies of using HVFRs in the STACK play
Interestingly one of these two compared wells completed identically in fracturing design
Well 1 was treated with hybrid guar-based fluid system consisting of 18 linear gel and
18 crosslinked Well 2 used HVFR starting with 5 gpt and end up the fracture treatment
by 3 gpt of HVFR All the other parameters were the same in both stimulation process in
Well 1 and Well 2 as shown in Table 8 The field results showed over 30 improvement
in production and 32 reduction of chemical cost in Well 2 where HVFR was used
compared to using guar-based fluids in Well 1
Using fewer chemicals during hydraulic fracturing treatment improves well
economics Motiee et al (2016) present a case study about the operational cost reduction
using HVFRrsquos compared to crosslinked fluid systems
0102030405060708090
100
Co
st r
ed
uct
ion
Field or basin name
28
Figure 12 Production improvement of using HVFRs from different case studies
The data results reported that the average reduction ranged from 33 to 48 of the
chemical volume used in fracturing treatment as well as 22 average reduction on fluid
cost as shown in Figure 13
Another logistic of cost reduction is the fracturing fluids material themselves
Earthstone Energy Inc reported several case studies replacing crosslinked or hybrid
system with HVFRs where the average completion cost was reduced by 35 and the
charge in pump pressure decreased by 17 Since the characterization nature of HVFRs
has rapid solubility on water HVFRs hydrate quickly ldquoon-the-flyrdquo Therefore hydration
unit is not required in the field which helps to save cost as well Van Domelen et al (2017)
0102030405060708090
100
Pro
du
ctio
n I
mp
rov
men
t
Field or basin name
29
Table 7 Stimulation summary of case study (Dahlgren et al 2018)
SW
MBL
HVFR
MBL
18
LIN
MBL
18 XL
MBL
TOTAL
FLUID MBL
100
MESH
MM
4070
MM
TOTAL
PROP MM
Well 1 243 0 21 41 3054 47 76 123
Well 2 251 56 0 0 3073 47 76 123
Figure 13 Chemical cost comparison for standard Bakken system (Motiee et al 2016)
8 CONCLUSIONS
This study provides a comprehensive review on using high viscous friction reducers
as a potential alternative for conventional fracture fluid Potential advantages of using
HVFRs over other fracture fluids were discussed Results for laboratory and successful
field studies that used HVFR were also analyzed and presented The following conclusions
can be drawn from this work
30
bull Screening criteria for using HVFRs were presented to understand the optimum
selection of HVFRs HVFR concentration and temperature are the main factors that
influence the viscosity profile of HVFRs The median used of these factors in the
field application was 275 gpt and 158 for the HVFR concentration and
temperature respectively
bull Successful field case studies and lab measurements discussed the use of HVFRs as
an alternative fracturing fluid system to the conventional fracturing fluids (eg
linear gel system)
bull Numerous advantages of using HVFRs are reported including the ability of carrying
proppant less formation damage and reduction in chemical cost and water usage
bull High viscous friction reducers using produced water showed promising results but
more investigation with different produced water composition is still required
bull High viscous friction reducers showed improvement on the hydrocarbon
production in many filed case studies reaching over 70 improvement
REFERENCES
Aften C W (2010 January 1) Study of Friction Reducers For Recycled Stimulation
Fluids In Environmentally Sensitive Regions Society of Petroleum Engineers
httpsdoi102118138984-MS
Aften C W (2014 October 21) Friction Reducers Fresh Rheological Insights Married to
Performance Society of Petroleum Engineers httpsdoi102118171025-MS
Al-Khaldy M D Dutta A Goswami B Al-Rashidi` A Rondon L J Warrakey M
amp Abdel Samie M A (2014 November 10) First-Ever Level 4 Multilateral Well
in North Kuwait Successfully Completed Improves Oil Production Society of
Petroleum Engineers httpsdoi102118171792-MS
31
Al-Muntasheri G A (2014 April 17) A Critical Review of Hydraulic Fracturing Fluids
over the Last Decade Society of Petroleum Engineers httpsdoi102118169552-
MS
API A P (nd) Energy and Opportunity Retrieved April 10 2017 from
httpwwwhydraulicfracturingcomsection=energy-and-opportunity
Ba Geri M Imqam A amp Suhail M (2019a March 19) Investigate Proppant Transport
with Varying Perforation Density and Its Impact on Proppant Dune Development
Inside Hydraulic Fractures Society of Petroleum Engineers httpsdoi102118
195018-MS
Ba Geri M Imqam A Bogdan A Shen L (2019b April 9) Investigate the Rheological
Behavior of High Viscosity Friction Reducer Fracture Fluid and Its impact on
Proppant Static Settling Velocity Society of Petroleum Engineers
httpsdoi102118195227-MS
Brannon H D amp Ault M G (1991 January 1) New Delayed Borate-Crosslinked Fluid
Provides Improved Fracture Conductivity in High-Temperature Applications
Carman P S amp Cawiezel K (2007 January 1) Successful Breaker Optimization for
Polyacrylamide Friction Reducers Used in Slickwater Fracturing Society of
Petroleum Engineers httpsdoi102118106162-MS
Castro-Vera E Chuc E A Gutierrez L amp Sanchez A (2015 October 26)
Implementation of Low-Residue Polysaccharide Fracturing Fluid System Aids
Flowback Recovery at Chicontepec Basin Field Experiences on Sandstone Tight-
Oil Wells Society of Petroleum Engineers httpsdoi102118176722-MS
Chung H C Hu T Ye X amp Maxey J E (2014 October 27) A Friction Reducer Self-
Cleaning to Enhance Conductivity for Hydraulic Fracturing Society of Petroleum
Engineers httpsdoi102118170602-MS
Clark R K Scheuerman R F Rath H amp Van Laar H G (1976 June 1)
PolyacrylamidePotassium-Chloride Mud for Drilling Water-Sensitive Shales
Society of Petroleum Engineers httpsdoi1021185514-PA
Cooke C E (1975 October 1) Effect of Fracturing Fluids on Fracture Conductivity
Society of Petroleum Engineers httpsdoi1021185114-PA
Dahlgren K Green B Williams B Inscore J Domelen M V amp Fenton A (2018
January 23) Case Studies of High Viscosity Friction Reducers HVFR in the
STACK Play Society of Petroleum Engineers httpsdoi102118189893-MS
32
Economides MJ and Nolte KG 2000 Reservoir Stimulation Third Edition John Wiley
amp Sons
Hashmi G Kabir C S amp Hasan A R (2014 October 27) Interpretation of Cleanup
Data in Gas-Well Testing From Derived Rates Society of Petroleum Engineers
httpsdoi102118170603-MS
httpswwwslbcom-mediaFilesstimulationengineered-fracturing-fluidspdf
Hu Y T Fisher D Kurian P amp Calaway R (2018 January 23) Proppant Transport
by a High Viscosity Friction Reducer Society of Petroleum Engineers
httpsdoi102118189841-MS
Huang J Perez O Huang T Safari R amp Fragachan F E (2018 October 16) Using
Engineered Low Viscosity Fluid in Hydraulic Fracturing to Enhance Proppant
Placement Society of Petroleum Engineers httpsdoi102118191395-18IHFT-
MS
Ifejika E De Cumont B amp Kashani N (2017 January 24) Optimum Production
Metrics to Predict Unconventional Wellamp39s Long-term Performance Society
of Petroleum Engineers httpsdoi102118184817-MS
Johnson M Winkler A Aften C Sullivan P Hill W A amp VanGilder C (2018
October 5) Successful Implementation of High Viscosity Friction Reducer in
Marcellus Shale Stimulation Society of Petroleum Engineers
httpsdoi102118191774-18ERM-MS
Ke M Qu Q Stevens R F Bracksieck N E Price C R amp Copeland D L (2006
January 1) Evaluation of Friction Reducers for High-Density Brines and Their
Application in Coiled Tubing at High Temperatures Society of Petroleum
Engineers httpsdoi102118103037-MS
Kern LR 1962 Method and Composition for Formation Fracturing US Patent No 3
058 909
Kunshin A amp Dvoynikov M (2018 October 15) Design and Process Engineering of
Slotted Liner Running in Extended Reach Drilling Wells Society of Petroleum
Engineers httpsdoi102118191520-18RPTC-MS
Li L Saini R amp Mai N (2018 September 24) High-TDS Produced Water-Based Low-
Damaging Fracturing Fluids for Applications at 300degF or Higher Society of
Petroleum Engineers httpsdoi102118191749-MS
33
Li L Sun H Qu Q Le H V Ault M Zhou J hellip Smith D (2014 October 27)
High-Temperature Fracturing Fluids Prepared with Extremely High-TDS and Hard
Produced Water Society of Petroleum Engineers httpsdoi102118170607-MS
Montgomery C (2013 May 20) Fracturing FluidltbrgtComponents International Society
for Rock Mechanics and Rock Engineering
Motiee M Johnson M Ward B Gradl C McKimmy M amp Meeheib J (2016
February 1) High Concentration Polyacrylamide-Based Friction Reducer Used as
a Direct Substitute for Guar-Based Borate Crosslinked Fluid in Fracturing
Operations Society of Petroleum Engineers httpsdoi102118179154-MS
Ozuruigbo C Q amp Fan C (2014 September 30) Influence of Friction Reducer on Scale
Inhibitor Performance and Scaling Tendency in Slickwater Fracturing Society of
Petroleum Engineers httpsdoi102118171661-MS
Rimassa S M Howard P amp Arnold M O (2009 January 1) Are You Buying Too
Much Friction Reducer Because of Your Biocide Society of Petroleum Engineers
httpsdoi102118119569-MS
Reddy B R (2013 April 8) Laboratory Characterization of Gel Filter Cake and
Development of Non-Oxidizing Gel Breakers for Zirconium Crosslinked
Fracturing Fluids Society of Petroleum Engineers httpsdoi102118164116-MS
Rodvelt G Yuyi S amp VanGilder C (2015 October 13) Use of a Salt-Tolerant Friction
Reducer Improves Production in Utica Completions Society of Petroleum
Engineers httpsdoi102118177296-MS
Sanders M Felling K Thomson S Wright S amp Thorpe R (2016 February 1) Dry
Polyacrylamide Friction Reducer Not Just for Slick Water Society of Petroleum
Engineers httpsdoi102118179146-MS
Sareen A Zhou M J Zaghmoot I Cruz C Sun H Qu Q amp Li L (2014 December
10) Successful Slickwater Fracturing in Ultrahigh TDS Produced Water by Novel
Environmentally Preferred Friction Reducer International Petroleum Technology
Conference httpsdoi102523IPTC-17824-MS
Shah S Asadi M Wheeler R Brannon H Kakadjian S Ainley B hellip Archacki D
(2018 February 7) Methodology for Evaluating Drag Reduction Characteristics of
Friction Reducer Society of Petroleum Engineers httpsdoi102118189537-MS
STIM-LAB Proppant Consortium Report July 2012 Section 31 Friction Reducers used
in Slickwater Applications
34
Sun H Wood B Stevens R F Cutler J Qu Q amp Lu M (2011 January 1) A
Nondamaging Friction Reducer for Slickwater Frac Applications Society of
Petroleum Engineers httpsdoi102118139480-MS
Sun H Wood B Stevens R F Cutler J Qu Q amp Lu M (2011 January 1) A
Nondamaging Friction Reducer for Slickwater Frac Applications Society of
Petroleum Engineers httpsdoi102118139480-MS
Sun H Stevens R F Cutler J L Wood B Wheeler R S amp Qu Q (2010 January
1) A Novel Nondamaging Friction Reducer Development and Successful
Slickwater Frac Applications Society of Petroleum Engineers httpsdoi102118136806-MS
Tomson R C Guraieb P Graham S Yan C Ghorbani N Hanna T amp Cooper C
(2017 January 24) Development of a Universal Ranking for Friction Reducer
Performance Society of Petroleum Engineers httpsdoi102118184815-MS
Van Domelen M Cutrer W Collins S amp Ruegamer M (2017 March 27)
Applications of Viscosity-Building Friction Reducers as Fracturing Fluids Society
of Petroleum Engineers httpsdoi102118185084-MS
White C M and Mungal M G 2008 Mechanics and Prediction of Turbulent Drag
Reduction with Polymers Ann Rev Fluid Mech 40235-256
Wu Q Ma Y Sun Y amp Bai B (2013 March 23) The Flow Behavior of Friction
Reducer in Microchannels During Slickwater Fracturing Society of Petroleum
Engineers httpsdoi102118164476-MS
35
35
II INVESTIGATE THE RHEOLOGICAL BEHAVIOR OF HIGH VISCOSITY
FRICTION REDUCER FRACTURE FLUID AND ITS IMPACT ON
PROPPANT STATIC SETTLING VELOCITY
Mohammed Ba Geri1 Abdulmohsin Imqam1 Andrey Bogdan2 and Lingjuan Shen2
1 Deparment of Petroleum Engineering Missouri University of Science and Technology
Rolla MO 65409
2 BJ Services Tomball TX
ABSTRACT
The recent and rapid success of using high viscosity friction reducers (HVFRs) in
hydraulic fracturing treatments is due to several advantages over other fracture fluids (eg
linear gel) which include better proppant carrying capability induce more complex
fracture system network with higher fracture length and overall lower costs due to fewer
chemicals and less equipment on location However some concerns remain like how
HVFRs rheological properties can have impact on proppant transport into fractures The
objective of this study is to provide a comprehensive understanding of the influence the
rheological characterization of HVFRs have on proppant static settling velocity within
hydraulic fracturing process
To address these concerns comprehensive rheological tests including viscosity
profile elasticity profile and thermal stability were conducted for both HVFR and linear
gel In the steady shear-viscosity measurement viscosity behavior versus a wide range of
shear rates was studied Moreover the influence of elasticity was examined by performing
oscillatory-shear tests over the range of frequencies Normal stress was the other elasticity
36
factor examined to evaluate elastic properties Also the Weissenberg number was
calculated to determine the elastic to viscous forces Lastly quantitative and qualitative
measurements were carried out to study proppant settling velocity in the fluids made from
HVFRs and linear gel
The results of rheological measurement reveal that a lower concentration of HVFR-
2 loading at 2gpt has approximately more than 8 times the viscosity of linear gel loading
at 20ppt Elastic measurement exposes that generally HVFRs have a much higher
relaxation time compared to linear gel Interestingly the normal stress N1 of HVFR-2 2gpt
was over 3 times that of linear gel loading 20ppt This could conclude that linear gel
fracture fluids have weak elastic characterization compared to HVFR The results also
concluded that at 80 Co linear gel has a weak thermal stability while HVFR-2 loses its
properties only slightly with increasing temperature HVFR-2 showed better proppant
settling velocity relative to guar-based fluids The reduction on proppant settling velocity
exceed 75 when HVFR-2 loading at 2gpt was used compared to 20ppt of linear gel Even
though much work was performed to understand the proppant settling velocity not much
experimental work has investigated the HVFR behavior on the static proppant settling
velocity measurements This paper will provide a better understanding of the distinct
changes of the mechanical characterization on the HVFRs which could be used as guidance
for fracture engineers to design and select better high viscous friction reducers
37
1 INTRODUCTION
Over the last few recent years high viscosity friction reducers (HVFRs) have been
successfully used in the oil and gas industry across all premier shale plays in North America
including Permian Bakken and Eagle Ford (Van Domenlen et al 2017 Dahlgren et al
2018) Besides reducing friction HVFRs have also been used to suspend and carry
proppants farther into the fracturersquos networks Very recently the popularity of using
HVFRs in frac fluid has increased
A friction reducer is the main component of slick water fracture fluids and
stimulation technology packages The primary function of friction reducers is changing
turbulent flow to laminar flow by reducing friction by 70-80 while pumping fracturing
fluids (Schein 2005) Recently the oil industry started to use high viscosity friction
reducers (HVFRs) as a direct replacement for linear and crosslinked gels due to several
operational and economic reasons (Motiee et al 2016) High viscosity friction reducers
(HVFRs) have been used as fracturing fluids because of the advantages such as reducing
pipe friction during the fracturing process the high potential of placing more proppant
volumes compared to conventional hydraulic fluids system such as hybrid and crosslinked
creating complex fracture networks due to a less viscous system possible higher fracture
conductivity improved production results comparable as using liner gel or crosslinked
designs potentially lower costs due to fewer chemicals and less equipment on location
less environmental footprint and simplified hydraulic fracturing treatments by minimizing
screen out risks (Motiee et al 2016 Van Domenlen et al 2017 Dahlgren et al 2018 Ba
Geri et al 2019)
38
Both academic research and oil industrial implementation have shown promising
results of using high viscosity friction reducers Motiee et al 2016 studied high
concentration friction reducers (HCFR) as a direct substitute for guar-based crosslinked
fluid Different concentration of HCFR (2 4 6 and 8 gpt) were compared with 25 ppt
linear gel to study proppant settling velocity HCFR showed better proppant settling
velocity relative to guar-based fluids The results also concluded that at 180 25 ppt linear
gel has a weak thermal stability while HCFR only slight loses its properties Shen et al
2018 investigated rheological characterization of HVFRs and measured the settling
velocity of multi-particle proppant The results concluded that both the viscosity and
elasticity of HVFRs can affect the proppant carrying capacity during hydraulic fracturing
treatments
Hu et al 2018 addressed some concerns related to proppant transport capability
using HVFRs and linear gel Viscosity and elasticity measurements were examined to
compare HVFRs with linear gel They observed that at low shear rates HVFRs had higher
viscosity Also normal forces for linear gels are much lower than HVFRs with increased
shear rate Dahlgren et al 2018 identified three case studies in which STACK play replaced
traditional fracturing fluid with HVFR Viscosity-shear measurements were performed at
2 3 and 4 gpt HVFRs concentration with and without a breaker The study noticed that
the viscosity profile was negatively affected by breaker
Johnson et al 2018 presented a successful implementation of high brine friction
reducers (HBFRs) in high TDS water exceeding 60000TDS They observed that the
viscosity of HBFRs decreased with increased brines ranges Drylie et al 2018 conducted
viscosity measurements at a high shear rate of 511119904minus1and a low shear rate 001 119904minus1 for 1
39
and 6 gpt of HVFR and 24 ppt of guar The study noticed that at 1gpt of HVFR there was
no change in viscosity profile in contrast at a low shear rate HVFRs have a much higher
viscosity than guar Most pervious work investigated the rheological characterization of
HFVRs in low temperature conditions and did not consider that changes in rheological that
could happen at high pressure environment In addition there was not serious effort to
relate the effect of HVFR rheology on proppant settling velocity
This work presents a comprehensive investigation performed to compare linear gel
fracturing fluids with high viscosity friction reducers This paper investigated several major
factors including viscosity measurement profiles elasticity properties (Normal forces and
relaxation time) thermal stability profile and static settling velocities The question which
is the key factor the shear-viscosity or the elasticity of HVFRS governing the settling
velocity were also investigated by performing qualitative and quantitative of settling
velocity measurements of multi-particles and single particle proppant
2 PROPPANT STATIC SETTLING VELOCITY IN HYDRAULIC
FRACTURING
This study provides insights on the elastic and viscous properties of HVFR and
liner gel fluids Weissenberg number and elasticity to viscosity ratio are calculated to
measure the elastic properties of the fluids and to identify which rheological properties has
significant contribution to the proppant settling velocity (Broadbent and Mena 1974
Acharya et al 1981 Malhotra and Sharma 2012)
40
21 PARTICLE SHEAR RATE (ϔ)
Calculating apparent particle shear rate leads to overestimate or underestimate the
particle shear rate therefore determining the particle shear rate range within the Power
law model (K n) is an essential step to describe the shear thinning effect of the HVFRs
and linear gel fluids Equation 1 can be used to estimate the particle shear rate (Uhlherr et
al 1976 Shah et al 2007)
ϔ = 2 lowast 119881119904119889119901 (1)
where ϔ is the particle shear rate 119881119904 is the terminal settling velocity 119889119901 is the particle
diameter
22 APPARENT SHEAR VISCOSITY (120525119834)
Lali et al 1989 introduced Equation 2 to estimate the apparent shear viscosity
120583119886 = 119870ϔ119899minus1 (2)
where μ_a is the apparent shear viscosity K is the Consistency indexn is the flow
behavior index
23 WEISSENBERG NUMBER (119830119842)
To study viscoelastic fluid properties and fluid deformation degree Weissenberg
number should be measured Weissenberg dimensionless number can be defined as
follows
Wi =Elastic forces
Viscous forces= λ ϔ (3)
where Wi is the Weissenberg number λ is the relaxation time ϔ is the particle shear rate
41
24 ELASTICITY TO VISCOSITY RATIO (120524119838120534)
Viscoelastic fluids consist of two main properties (viscosity and elasticity) To
evaluate which property gives the greatest contribution during proppant transport Equation
4 was used to measure the elasticity to viscosity ratio (120582119890120592) (Shen et al 2018)
120582119890120592 =051205911198731(ϔ)
120578(ϔ) (4)
where λeυ is the elasticity to viscosity ratio 1198731(ϔ) is the first normal stress 120591 is
relaxation time and 120578(ϔ) is the shear viscosity
The numerator consists of the elasticity portion (relaxation time 120591 and first normal
stress 1198731(ϔ)) and the denominator is a function of only the viscosity profile (120578(ϔ)) The
elasticviscous ratio demonstrated by elasticity once their value more than one while if the
elasticviscous ratio less than one that indicates is the viscosity play main role during
proppant transport
25 FORCES INFLUENCED PARTICLES SETTLING VELOCITY
In a Newtonian fluid settling velocity of single particle can be calculated from the
Stokes model which is usually referred as Stokes Equation 7 in the creeping flow regime
(119877119890119901 lt 1) Because the settling velocity is a function of Reynolds number and drag forces
itrsquos important to calculate all parameters related to the settling velocity Khan and
Richardson 1987 Several studies developed theoretical expressions tha can used to
calculate drage coefficient Renaud et al (2004) and of Tripathi et al (1994) The most
common correlation was derived by Stokes which can be used to calculate settling velocity
(Vs) are shown in Equation 5 ndash 7 (Arnipally 2018)
42
119877119890119901 lt 1 (creeping flow regime)
119877119890119901 =119863119901119881119904120588119891
120583119891 (5)
119862119863 =24
119877119890119901 (6)
119881119904 =(120588119904minus120588119891)119892119863119904
2
18120583119891 (7)
Three main forces dominate the vertical motion of solid particles in a fluid gravitational
force FG buoyancy force FB and drag force FD (Arnipally 2018)
119865119892 = 120588119901119907119901119892 (8)
119907119901 = 12058711988911990136 (9)
119865119887 = 120588119907119901119892 (10)
119865119863 = 1198621198631198601205881198911198812
2 (11)
where 120588119901 is the particle density 119907119901 is the volume of the particle 120588119891 is the fluid density 119889119901
is the particle diameter g is the acceleration due to gravity (981 m119904minus2) 119862119863 is the drag
coefficient A is the projected area and V is the settling velocity
3 EXPERIMENT DESCRIPTION
31 MATERIALS
311 Hydraulic Fracturing Fluids Two fracture fluid samples were used in this
study 1) HVFRs with different compositions (HVFR-1 HVFR-2 HVFR-3) 2) linear gel
(GW-3d) All fracture fluid samples were provided by BJ Services Company
43
312 Preparing Fracturing Fluids According to standard industry practice for
using HVFRs four different concentrations 1 2 4 8 gallons per thousand gallons (gpt) of
each sample were mixed with deionized (DI) water Linear gel (GW-3d) fluid was tested
with three different concentrations 10 20 40 pounds per thousand gallons (ppt)
313 Proppant Sizes Proppant US silica sand size of 3060 mesh and glass bead
sizes of 2 4 and 6mm were used to measure terminal settling velocity in HVFRs
314 Rheometer A high accuracy advanced rheometer with a parallel-plate
system was used to measure viscosity-shear profile normal forces and the dynamic
oscillatory-shear measurements at lab and high temperature ranges
32 SETTLING VELOCITY IN UNCONFINED FRACTURE SETUP
Figure 1 shows the setup of an unconfined settling velocity measurement The
experiment was performed in a 1000 ml transparent graduated glass cylinder with a
diameter at least 25 times the proppant diameter to ensure proppant settling velocity was
not influenced by the walls of the glass container In addition alongside the glass container
a foot ruler was placed to measure the fluid level inside the model as shown in the setup
Figure 1 Schematic of fracture setup for unconfined fluids
44
33 RHEOLOGICAL CHARACTERIZATION OF THE HVFRS
331 Viscosity Profile Measurement Two different rheological tests were
performed including steady shear-viscosity and time dependency using an advanced
rheometer with a parallel-plate system (PP50TG using a 030 mm gap) To investigate the
viscous behavior tests were implemented under varying shear rate from 01-1000 119904minus1 with
measurements at 21 pointdecade
332 Elasticity Profile Measurement The dynamic oscillatory-shear
measurements were conducted to measure the elasticity profile characterizations and first
normal stress N1 The oscillatory test was implemented over a range of frequencies from
001-100Hz All rheological properties measurements were conducted at lab and high
temperature ranges
333 Thermal Stability Measurement The influence of temperature during
fracturing operations has not been fully understood in shale oil reservoirs This paper
investigated the effect of thermal stability of rheology characterizations of HVFRs which
tends to alter parameters such as time dependency fluid elasticity viscosity and first
normal stress To better mimic the real fracturing process the experiments were performed
under elevated temperatures by using an advanced rheometer Viscosity-shear profile
measurements for three different temperatures of 77 122 176 have been conducted
for both HVFRs and linear gel fracture fluids
334 Static Settling Velocity Measurement At this point the graduated cylinder
is filled with HVFR and the cell is positioned vertically To measure proppant settling
velocity in unconfined fluids high-resolution video camera is used to record the settling
process In this setup proppant diameter ranged from 0453 mm to 6 mm A single proppant
45
was dropped in the HVFR and allowed to settle A high-resolution video camera has been
used to capture the process of free proppant settling An image analysis tool called
ldquoTrackerrdquo ( httpwwwcabrilloedu~dbrowntracker) was applied to get accurate
measurements of vertical position of the proppant at different time steps (Ba Geri et al
2018) The slope of relationship between proppant vertical positions to steps time step is
called terminal settling velocity For more accurate results settling velocity of each particle
were repeated three times
4 RESULTS AND DISCUSSION
41 VISCOSITY MEASUREMENT RESULTS
In Figure 2 a viscosity measurement profile is presented In order to understand
the HVFRs characterizations three different HVFRs fracture fluids with a wide range of
concentrations (1 2 4 8gpt) along with several linear gel concentrations (10 20 40ppt)
were measured using an advanced rheometer at 25 in a wide range of shear rates from
01 to 1000 119904minus1 All the results exhibit that the HVFRs fluids follow a shear thinning
behavior that as shear rate increases the viscosity decreases At a loading of 8gpt results
for HVFR-2 showed that HVFRs have high viscosity (20000cp) at a lower shear rate of
01 119904minus1 compared to HVFR-1 and HVFR-3 with 9000cp and 10000cp respectively
Linear gel with a loading of 40ppt at the same low shear rate of 01 119904minus1 showed a much
lower viscosity of around 1200 cp
46
Figure 2 Effect of HVFR (left) and linear gel (right) concentrations as a function of
shear rate
Table 1 shows the Power law model equations fitting for all HVFRs and linear gel
samples at different concentrations The Power law model is clearly best fit of the
experiments results of HVFRs and linear gel fluids whereas the R-square values of the
equation are close to the unit The results also observed that by increasing HVFRs or linear
gel concentration the K and n values increased
Figure 3 shows that HVFR-2 has highest viscosity profile at a low shear rate of 01
119904minus1 For instance at a loading of 8 gpt HVFR-2 had a viscosity of almost 23000 cp
which is around double the viscosity of HVFR 1 amp 3 at the same loading Moreover
HVFR-2 loading 2 has higher viscosity profile up to 2670cp while linear gel loading 20ppt
has less viscosity around 311cp which represent almost 9 time increasing in viscosity
profile of HVFR-2 loading 2gpt
To conclude HVFRs have higher viscosity profile along all the shear rate ranges
compared to linear gel HVFR-2 viscosity increased substantially from 176 cp to 22724
cp as the concentration increased from 1gpt to 8gpt however linear gels have much lower
1
10
100
1000
10000
01 1 10 100 1000
Vis
cosi
ty cp
Shear Rate 1s
Linear Gel
40ppt
20ppt
10ppt
1
10
100
1000
10000
100000
01 1 10 100 1000
Vis
cosi
ty cp
Shear Rate 1s
HVFR-2
8 gpt
4 gpt
2 gpt
1 gpt
47
viscosity ranges and their viscosity could increase from 39 cp to 1242 cp as the
concentration increased from 10 ppt to 40 ppt
Table 1 Power law model equations and parameters (n k) for HVFRs and linear gel
HVFR Concentration gpt
Fluid Name 1 2 4 8
HVFR-1 120583 = 18603120574minus056 120583 = 37898120574minus059 120583 = 96933120574minus064 120583 = 263425120574minus069
R-square 09996 09997 09998 09997
HVFR-2 120583 = 19287120574minus070 120583 = 55264120574minus073 120583 = 147163120574minus078 120583 = 447822120574minus082
R-square 09994 09996 09997 09998
HVFR-3 120583 = 6152120574minus043 120583 = 195120574minus0540 120583 = 60708120574minus063 120583 = 181535120574minus069
R-square 09984 09987 09992 09994
Linear Gel Concentration ppt
Fluid name 10 20 40
Linear Gel 120583 = 1144120574minus010 120583 = 17298120574minus038 120583 = 116322120574minus048
R-square 09786 09955 09830
Figure 3 Viscosity as a function of concentration of HVFRs (left) and Linear gel (right)
at low shear rates
0
5000
10000
15000
20000
25000
1 2 3 4 5 6 7 8 9
Vis
cosi
ty
cp
Concentration gpt
Shear Rate 01 (1s)
HVFR-1
HVFR-2
HVFR-3
0
200
400
600
800
1000
1200
1400
0 5 10 15 20 25 30 35 40
Vis
cosi
ty
cp
Concentration ppt
Shear Rate 01 (1s)
Linear Gel
48
42 ELASTICITY MEASUREMENT RESULTS
The time associated with changing the structure of the polymer fluids is the
relaxation time τ and it can be used to quantify the elasticity of the fluid Since the HVFRs
have a high molecular weight understanding the elasticity is very important To evaluate
the viscoelastic characterizations of HVFRs a small amplitude oscillatory shear test was
carried out in the fluid solutionrsquos linear viscoelastic regime using an advanced rheometer
with a parallel-plate system Storage moduli (Grsquo) represents elastic responses and loss
moduli (Grdquo) represents viscous responses Relaxation time is referred to as the inverse of
the cross over point (t = 1ω) where Grsquo is equal to Grdquo The longer relaxation time of the
fluid means has more elastic properties while the shorter relaxation time means the fluid
carrys less elastic properties Figure 4 shows the Grsquo and Grdquo of HVFR as a function angular
frequency All HVFR-2 concentrations were showing a good elastic property with high
relaxation time ranges The relaxation time increased with increasing the concentrations of
HVFR
In contrast Figure 5 shows the storage modulus and loss modulus as a function of
angular frequency for linear gel with very low elastic properties At higher concentration
of linear gel 40ppt the elastic properties are much lower around 01 sec Therefore the
linear gel might depend only on viscous properties to carry and place the proppant during
hydraulic fracturing treatment
Figure 6 showed the relaxation time was increased by increasing the fracturing fluid
concentration for both fluids In HVFR2 concentration of 4 gpt has a relaxation time of
approximately 17 second and it increased to 37 second at 8 gpt The results show that
HVFR-2 has a better elastic property than HVFR-1 and HVFR-3 Also at similar
49
equivalent loading concentrations results indicated that HVFRs have better elastic
properties compare to liner gel Even though concentration of linear gel increased to 40
ppt it still has a very small relaxation time with around 01s
Figure 4 Elastic modulus and storage modulus ` as a function for HVFR-2 at different
concentration
It could be concluded that for all tested fluid samples HVFRs fluid system have
higher elastic properties than linear gel fluid system Despite increasing the concentration
of linear gel to 40 ppt it still is showing very low elastic properties
50
Figure 5 Elastic modulus and storage modulus as a function of angular frequency for
linear gel at different concentrations 20ppt and 40ppt
Figure 6 Relaxation time as a function of concentration of HVFR-1 HVFR-2 and
HVFR-3 (left) and linear gel (right)
421 Normal Stress Measurements Normal stress is another significant elastic
property which can be measured by Rheometer as a function of shear rate Figure 7 shows
the normal stress (N1) as a function of shear rate of HVFR-2 at different loading At low
shear rates (from 01 to 10 119904minus1) the normal stress was very low whereas increasing the
shear rate above 10 119904minus1 showed an increase in normal stress Normal stress was increased
00001
0001
001
01
1
10
Sto
rag
e M
od
ulu
s G
[
Pa
]
Lo
ss M
od
ulu
s G
[Pa
]
Angular Frequancy [rads]
G - 40ppt
G - 40ppt
G -20ppt
G - 20ppt
0
002
004
006
008
01
012
0 10 20 30 40
Rel
ax
ati
on
Tim
e s
Concentration ppt
Linear Gel
0
5
10
15
20
25
30
35
40
1 3 5 7
Rel
ax
ati
on
Tim
e s
Concentration gpt
HVFR-1
HVFR-2
HVFR-3
51
substantially as the HVFR concentration increase For example at 1000119904minus1 the normal
stress was 20 Pa and 285 Pa for 1gpt and 8gpt respectively This result is consistent with
the elastic range trend measured previously by the relaxation time
Figure 7 Effect of HVFR 2 concentration as a function in normal stress profile
In Figure 8 although a high concentration of linear gel (40ppt) has been selected to
examine the first normal stress N1 at high shear rate 1000119904minus1 the N1 was only 50 Pa
This elasticity is however still much less than HVFRs with a concentration of 4 gpt
Figure 8 Effect of HVFR 2 concentration as a function in normal stress profile
0
50
100
150
200
250
300
01 1 10 100 1000
Norm
al
Str
ess
(N1
) P
a
Shear Rate 1s
8gpt
4gpt
2gpt
1gpt
0
10
20
30
40
50
60
01 1 10 100 1000
Norm
al
Str
ess
N1
Shear Rate 1s
40ppt
20 ppt
10ppt
52
43 THERMAL STABILITY MEASUREMENT RESULTS
Figure 9 shows the rheological measurements for both HVFR-2 and linear gel at
temperature ranges of 25 Co 50 Co and 80 Co Results reveal that polyacrylamide-based
HVFs systems have better thermal stability than linear gel at different shear rate ranges
Increased temperature to 50 Co did not show any change in viscosity profile but when
temperature increased to 80 Co little bit changes occurred However linear gel loses
significantly its viscous properties with increasing shear rate when temperature increased
to 80 Co For example at shear rate of 1 s-1 the viscosity of linear gel dropped from 1000
cp to 100 cp as the temperature increased from 25 Co to 80 Co
Figure 9 Thermal stability of viscosity as a function of shear rate of HVFR-2 (left) and
linear gel (right)
Figure 10 shows the elastic effect (first normal stress N1) loses its properties with
increasing temperature for both fracture fluids but more significant for linear gel At high
shear rate of 1000 S-1 normal stress for HVFR decreased from 340 Pa to 230 Pa and 70 Pa
1
10
100
1000
10000
01 1 10 100 1000
Vis
cosi
ty cp
Shear Rate 1s
40 ppt - T=25C
40 ppt - T=50C
40 ppt - T=80C
1
10
100
1000
10000
100000
01 1 10 100 1000
Vis
cosi
ty c
p
(Shear Rate 1sec)
HVFR-2 8gpt - T = 25 CHVFR-2 8gpt - T = 50 CHVFR-2 8gpt - T = 80 C
53
as temperature increased from 25 Co to 50 Co and 80 Co respectively However at same
shear rate normal stress for linear gel dropped significantly from 50 Pa to 10 Pa and 5 Pa
within the same of temperature ranges
Figure 10 Thermal stability of viscosity as a function of shear rate of HVFR-2 (left) and
linear gel (right)
44 SETTLING VELOCITY MEASUREMENT RESULTS
Several factors can control the proppant transport in complex fracture system
including proppant type proppant size fracture geometry and fracture fluid characteristics
including viscosity and elasticity This section is showing how the rheological and elastic
properties of HVFR and linear gel could affect the proppant settling velocity
441 Qualitative Multi-Particle Static Settling Velocity To qualify the settling
velocity of multi-particles two different loadings (2 and 4gpt) of HVFR-2 and a loading
of linear gel (20ppt) were hydrated in DI and mixed well with proppant concentration of 2
ppa The mixture was poured immediately into a 100 ml graduated cylinder A time lapse
0
10
20
30
40
50
60
01 1 10 100 1000
Norm
al
Forc
es
Pa
Shear Rate 1s
40 ppt - T=25C40 ppt - T=50C40 ppt - T=80C
0
50
100
150
200
250
300
350
400
01 1 10 100 1000
Norm
al
Forc
es
P
a
Shear Rate (1sec)
HVFR-2 8gpt - T = 25 C
HVFR-2 8gpt - T = 50 C
HVFR-2 8gpt - T = 80 C
54
camera was set up to capture the settling rate for certain time All multi-particle static
settling time have been measured in the lab conditions
Figure 11 shows at a low load of HVFR-2 (2gpt) most of the proppant took 10
minutes to settle with few proppants were still suspended in the fluid However as it shown
in Figure 12 as the concentration of HVFR increased to 4gpt a longer settling time (60
minute) was observed with more proppant still suspended at fluid Proppant settling time
in linear gel was significantly less than both concentrations of HVFR as it is shown in
Figure 13 In linear gel loading of 20ppt the proppant was settled completely at 15 seconds
with very few proppants still suspended in the fluid The settling rate in linear gel (20ppt)
was almost 40 times higher than HVFR-2 (2gpt) this might occur because HVFR-2 has
higher viscous and elastic properties than the linear gel fluid
Figure 11 Multi-static measurement for proppant settling time using HVFR-2 (2gpt)
55
Figure 12 Multi-static measurement for proppant settling time using HVFR-2 (4gpt)
Figure 13 Multi-static measurement for proppant settling time using linear gel (20 ppt)
442 Quantitative Single Particle Static Settling Velocity
4421 Proppant size effect on static settling velocity Single particle static
velocity measurements were performed in unconfined conditions using a HVFR-2 loading
2gpt and linear gel loading 20ppt at an ambient temperature Three different glass beads
sizes of 2 mm 4 mm and 6 mm were selected to study the effect of proppant sizes on
56
different fracture fluids Figure 11 shows the terminal static settling velocity calculations
for both fluids Result clearly indicated that for all proppant sizes proppant had higher
settling velocities when it placed inside the linear gel compared to HVFR For example
settling velocity of proppant size of 4 mm was 5 cmsec for HVFR and increased
significantly to 20 cmsec for linear gel These results indicate that HVFR could have better
proppant suspension capability than linear gel Results also indicated that increasing
particle sizes increases the proppant settling velocity
Figure 14 Effect of proppant settling velocity in HVFR-2 gpt vs linear gel-20 ppt
fracture fluids
4422 Effect of elasticity and viscosity properties on settling velocity Figure
12 presented steady a shear rate-viscosity measurement profile as a function of shear rate
for HVFR-2 loading of 2 gpt and linear gel loading of 20 ppt The power law model (k n)
is fitted only for the shear rate ranges at which proppant shear rate results obtained from
Figure 11 (ranges from 62 to 98 119904minus1 )
0
5
10
15
20
25
30
35
40
45
0 1 2 3 4 5 6 7 8
Ter
min
al
Set
tlin
g V
elo
city
cm
sec
Particle Diameter mm
LG 20 2mm LG-20 4mm LG-20 6mm
HVFR-2 2mm HVFR-2 4mm HVFR-2 6mm
57
Figure 15 Viscosity as a function of shear rate for HVFR-2 loading 2 gpt (left)
and linear gel loading 20 ppt (right)
To illustrate the particle settling behavior profile the Weissenberg number is
measured since it can be used to evaluate elasticity measurements Table 2 presents the
result of calculating the Weissenberg number as a function of experimental settling velocity
measurement for different elastic property (λ=14 and 003) and approximately similar
viscosity profile shear rate ranges The results obtained from Weissenberg number was
much higher in HVFR compared to linear gel This implies that elastic properties might
have significant effect on settling velocity compared with viscosity properties but this
trend still needs further study because both fracture fluids did not have a very similar
viscosity profile
The Elasticity to Viscosity Ratio (λeυ) equation was also used to help in
determining which properties of the fracture fluids demonstrated the particle settling
velocity Large shear rate ranges were used to cover the possible ranges of proppant
transport shear rate that occurred with in hydraulic fracture
58
Table 2 Weissenberg Number calculation as a function of relaxation time and particle
shear rate
Test
Fluid
Relaxation
time (s)
Diameter of
Particles (mm)
Settling
Velocity
(cmsec)
Weissenberg
Number
Particle
Shear Rate
(1s)
HVFR-2
14 2 063 876 626
14 4 393 2748 1963
14 6 669 3120 2229
LG - 20
003 2 539 16 5393
003 4 1775 27 8877
003 6 2943 29 9810
Table 3 presents the Power law model equations for the relationship between
viscosity and shear rate as well as the exponential model for the first normal stress for both
HVFR-2 and linear gel to calculate elasticviscous ratio Figure 13 shows that for HVFR-
2 loading 2 gpt the equation 120582119890120592 = 069 ϔ14 indicates that elasticity becomes more
dominate when the shear rate is larger than 126119904minus1 For linear gel (20 ppt) elastic effects
are almost negligible since the contribution of elasticity become more important when
shear rates are larger than 501119904minus1 as illustrated by 120582119890120592 = 00008 ϔ117 The results could
also be indicated that elastic properties of HVFR dominate proppant transport within a
wide range of shear rates covering large portion of hydraulic fracture where shear rates
across fracture decreases as proppant transport deep inside fracture However still more
59
work is needed to confirm these results where fracture fluids with similar viscosity ranges
have different elastic properties or vice versa are required for such investigations
Table 3 ElasticViscous ratio 120582119890120592 calculations
The Ratio of Elasticity to Viscosity Calculation
Fluid name
Viscosity equation from
viscosity profile
Elasticity equation from
N1 profile
ElasticViscous
ratio
HVFR-2 gpt 120578(ϔ) = 0552ϔminus073 1198731(ϔ) = 0548ϔ0665 120582119890120592 = 069 ϔ14
R-square 09996 0968
Linear Gel- 20 ppt 120578(ϔ) = 0172ϔminus038 1198731(ϔ) = 0096ϔ0798 120582119890120592 = 00008 ϔ117
R-square 09955 09169
Figure 16 Calculated elasticviscous ratio as a function of shear rate for HVFR-2 2 gpt
and Linear gel ndash 20 ppt
000001
00001
0001
001
01
1
10
100
1000
10000
100000
01 1 10 100 1000
λe
v
Shear Rate 1s
HVFR-2gpt
Linear Gel -20ppt
60
5 COST ANALYSIS
HVFRs are in high demand now in hydraulic fracturing processes instead of
conventional linear gel systems due to economical and operational factors Economically
using HVFRs reduces chemical volume costs from 48 to 33 and the volume can also be
reduced by 30 when switching to the HVFR system (Motiee et al 2016 Domelen et al
2017) Moreover there is potential of using less equipment on location due to HVFRs
having high solubility in water so there is no need for a hydration unit or blending in the
field This paper presents that using a low loading of HVFR provides much better result
compared to the using a common concentration of linear gel (20 ppt)
Table 4 Stimulation summary of case study (Dahlgren et al 2018)
SW
MBL
HVFR
MBL
18
LIN
MBL
18 XL
MBL
TOTAL
FLUID MBL
100
MESH
MM
4070
MM
TOTAL
PROP MM
Well 1 243 0 21 41 3054 47 76 123
Well 2 251 56 0 0 3073 47 76 123
Dahlgren et al 2018 presented field case studies of using HVFRs in the STACK
play Interestingly one of these was a comparison between two wells completed identically
in fracturing design Well 1 was treated with a hybrid guar-based fluid system consisting
of 18 linear gel and 18 crosslinked Well 2 used a HVFR starting with 5 gpt and ending
the fracture treatment with 3 gpt of HVFR All the other parameters were the same in both
61
stimulation processes in well 1 and well 2 as shown in the Table 4 The field results showed
an over 30 improvement in production as well as chemical cost reduction of 32 in well
2 where HVFR was used compared to using guar-based fluids in well 1
6 CONCLUSIONS
This laboratory study investigated rheological and elastic properties of high viscous
friction reducer fracture fluids Proppant settling velocity was also investigated at different
conditions The outcomes of this work give valuable insights into the properties and
performance of high viscous friction reducer fracture fluids compared to linear gel fluids
The following conclusions can be drawn from this work
bull High viscous friction reducer-based fluids with low concentrations of HVFRrsquos have
better viscosity and elastic properties than fluids with typical concentrations of linear
gel
bull High viscous friction reducers have better thermal stability than linear gel Viscosity
and elastic properties of high viscous friction reducers did not be change significantly
compared to linear gel at temperature ranges less than 80 degC
bull High viscous friction reducer showed better elastic properties than linear gel for
different shear rate ranges This implies that high viscous friction reducer-based fluids
have better proppant carrying capability along fractures than linear gel
62
bull Proppant static settling velocity was much higher linear gel fluids compared to high
viscous friction reducer-based fracture fluids The proppant settling velocity is
approximately 40x less when using high viscous friction reducer
REFERENCES
Arnipally S K amp Kuru E (2018 October 1) Settling Velocity of Particles in
Viscoelastic Fluids A Comparison of the Shear-Viscosity and Elasticity Effects
Society of Petroleum Engineers httpsdoi102118187255-PA
Ba Geri M Imqam A amp Dunn-Norman S (2018 October 5) Proppant Transport
Behavior in Inclined Versus Vertical Hydraulic Fractures An Experimental Study
Society of Petroleum Engineers httpsdoi102118191813-18ERM-MS
Ba Geri M Imqam A amp Flori R (2019 April) A Critical Review of Using High
Viscosity Friction Reducers as Fracturing Fluids for Hydraulic Fracturing
Applications Society of Petroleum Engineers httpsdoi102119195191-MS
Broadbent JM Mena B 1974 Slow flow of an elastico-viscous fluid past cylinders and
spheres Chem Eng J 8 11ndash19
Dahlgren K Green B Williams B Inscore J Domelen M V amp Fenton A (2018
January 23) Case Studies of High Viscosity Friction Reducers HVFR in the
STACK Play Society of Petroleum Engineers httpsdoi102118189893-MS
Drylie S Duenckel R Barree R amp Hlidek B (2018 September 24) An Investigation
of Proppant Transport in Friction Reducer Fluid Systems Utilizing a Large Slot
Flow Apparatus Society of Petroleum Engineers httpsdoi102118191720-MS
Hu Y T Chung H amp Maxey J E (2015 February 3) What is More Important for
Proppant Transport Viscosity or Elasticity Society of Petroleum Engineers
httpsdoi102118173339-MS
Hu Y T Fisher D Kurian P amp Calaway R (2018 January 23) Proppant Transport
by a High Viscosity Friction Reducer Society of Petroleum Engineers
httpsdoi102118189841-MS
63
Johnson M Winkler A Aften C Sullivan P Hill W A amp VanGilder C (2018
October 5) Successful Implementation of High Viscosity Friction Reducer in
Marcellus Shale Stimulation Society of Petroleum Engineers
httpsdoi102118191774-18ERM-MS
Khan AR Richardson JF 1987 The resistance to motion of a solid sphere in a fluid
Chem Eng Sci 62 135ndash150
Lali A M Khare A S Joshi J B et al 1989 Behaviour of Solid Particles in Viscous
Non-Newtonian Solutions Settling Velocity Wall Effects and Bed Expansion in
Solid-Liquid Fluidized Beds Powder Tech 57 (1) 39ndash50
httpsdoiorg1010160032-5910(89)80102-0
Loveless D Holtsclaw J Saini R Harris P C amp Fleming J (2011 January 1)
Fracturing Fluid Comprised of Components Sourced Solely from the Food Industry
Provides Superior Proppant Transport Society of Petroleum Engineers
httpsdoi102118147206-MS
Malhotra S amp Sharma MM Settling of Spherical Particles in Unbounded and Confined
Surfactant-Based Shear Thinning Viscoelastic Fluids An Experimental Study
Chemical Engineering Science 84 646-655 (2012)
Montgomery C (2013 May 20) Fracturing FluidltbrgtComponents International Society
for Rock Mechanics and Rock Engineering
Motiee M Johnson M Ward B Gradl C McKimmy M amp Meeheib J (2016
February 1) High Concentration Polyacrylamide-Based Friction Reducer Used as
a Direct Substitute for Guar-Based Borate Crosslinked Fluid in Fracturing
Operations Society of Petroleum Engineers httpsdoi102118179154-MS
Renaud M Mauret E Chhabra RP 2004 Power-law fluid flow over a sphere average
shear rate and drag coefficient Can J Chem Eng 821066ndash1070
Shah SN Fadili YE Chhabra RP 2007 New model for single spherical particle
settling velocity in power law (visco-inelastic) fluids Int J Multiphase Flow 33
51ndash66
Schein G (2005 January 1) The Application and Technology of Slickwater Fracturing
Society of Petroleum Engineers
Shen L Vigderman L Heller D amp Fu D (2018 August 9) Can Friction Reducers
Transport Sand During Fracturing Treatment Unconventional Resources
Technology Conference httpsdoi1015530URTEC-2018-2873723
64
Van Domelen M Cutrer W Collins S amp Ruegamer M (2017 March 27)
Applications of Viscosity-Building Friction Reducers as Fracturing Fluids Society
of Petroleum Engineers httpsdoi102118185084-MS
Tripathi A Chhabra RP Sundararajan T 1994 Power-law fluid over spheroidal
particles Ind Eng Chem Res 33 403ndash410
Uhlherr PHT Le TN Tiu C 1976 Characterization of inelastic power-law fluids
using falling sphere data Can J Chem Eng 54 497ndash502
65
III STATIC PROPPANT SETTLING VELOCITY CHARACTERISTICS IN
HIGH-VISCOSITY FRICTION REDUCERS FLUIDS FOR UNCONFINED
AND CONFINED FRACTURES
Mohammed Ba Geri1 Ralph Flori1 Abdulmohsin Imqam1 Andrey Bogdan2 and
Lingjuan Shen2
1 Deparment of Petroleum Engineering Missouri University of Science and Technology
Rolla MO 65409
2 BJ Services Tomball TX
ABSTRACT
Measuring proppant settling velocity in high viscosity friction reducers (HVFRs)
plays a critical key for evaluating proppant transport in hydraulic fracture treatment
Settling of particles is governed by several factors such as fluid rheology (viscosity and
elasticity) proppant size retardation confining walls effect and fracture orientation The
objective of this experimental study was to determine how these factors would influence
particle settling velocity in hydraulic fracturing applications
The experiments were conducted in unconfined and confined fluid conditions
Fracture cell was designed in certain ways to capture the impact of fracture orientation by
45deg 60deg and 90deg on settling velocity
Results showed HVFR provided better proppant transport capability than regular
FRs used in slickwater Proppant settling velocity using HVFR was decreased by 80
Results obtained from confined fluid experiments showed that proppant settling velocity
decreased due to the confining walls exert retardation impact The wall retardation was also
66
reduced as the fracture width increased Changing fracture orientation from vertical
position (90 degree) to 45 degree led to high reduction in proppant settling velocity
1 INTRODUCTION
The free settling velocity of solid particles in different fluid media is generally
encountered in a wide variety of industrial processes Understanding particles behavior and
particles settling plays a vital role in optimizing design and operation in various industrial
applications including proppant transport in hydraulic fracturing gas flow through pipe
lines and cutting transport during drilling operations as discussed by Arnipally and Kuru
2018 Increasing the efficiency of proppant transport distribution in hydraulic fracture
treatment is required and relies on the knowledge of settling velocity of the particles
Settling of particles is governed by several factors such as fluid rheology (elasticity and
viscosity) proppant size retardation confining walls effect and fracture orientation Since
quantifying the relationship between drag coefficient and Reynoldsrsquo number of particles is
the most significant to know it is required to get the values of the particles settling velocity
Settling velocity at higher Reynolds numbers has been studied extensively and expressed
for the calculation of drag force (Clift et al 1978 Khan and Richardson 1987 Zapryanov
and Tabakova 1999 Michaelides 2002 2003)
Recently the oil industry started to use HVFRs as a direct replacement for linear
and crosslinked gels due to several operational and economic reasons (Motiee et al 2016
Ba Geri et al 2019) such as reducing pipe friction during the fracturing process placing
more proppant creating more complex fracture networks due to a less viscous system
67
possible higher fracture conductivity and potentially lower costs due to fewer chemicals
and less equipment on location (Motiee et al 2016 Van Domenlen et al 2017 Dahlgren
et al 2018 Ba Geri et al 2019b)
Predicting particles settling velocity and proppant transport in different types of
hydraulic fracturing fluids was attained by (Clark and Zhu 1996 Gadde et al 2004)
studied how settling velocity can be affected by changing proppant size fracture width
velocity of fluid and rheology properties of fluids The study concluded that Stokersquos law
is not accurate for predicting proppant settling rate Motiee et al (2016) studied high
concentration friction reducers (HCFR) as a direct substitute for guar-based fluid Different
concentrations of HCFR (2 4 6 and 8 gpt) were compared with 25 ppt linear gel to study
proppant settling velocity HCFR showed better proppant settling velocity relative to guar-
based fluids Tong et al (2017) conducted experimental and simulation studies about
proppant transport in fracture intersections using slickwater They concluded that
increasing shear rate causes reduction on equilibrium bed height and increased proppant
dune length
Shen et al (2018) investigated rheological characterization of HVFRs and
measured the settling velocity of multi-particle proppant They concluded that both the
viscosity and elasticity of HVFRs can affect the proppant carrying capacity during
hydraulic fracturing treatments Hu et al (2018) addressed some concerns related to
proppant transport capability using HVFRs and linear gel They observed that normal
forces for linear gels are much lower than HVFRs with increased shear rate Dahlgren et
al (2018) identified three case studies in which the operator in STACK play replaced
traditional fracturing fluid with HVFR The study noticed that the viscosity profile was
68
negatively affected by breaker Johnson et al (2018) presented a successful implementation
of high brine friction reducers (HBFRs) in high TDS water exceeding 60000TDS They
observed that the viscosity of HBFRs decreased with increased brine concentration ranges
Drylie et al (2018) conducted viscosity measurements at a high shear rate of 511 119904minus1 and
a low shear rate 001 119904minus1 for 1 gpt and 6 gpt of HVFR and 24 ppt of guar The study noticed
that 1gpt of HVFR did not change the viscosity profile significantly in contrast at a low
shear rate HVFRs had much higher viscosity than guar Ba Geri et al (2018) investigated
experimentally the effect of fracture inclination on proppant transport The study concluded
that inclination of fractures can significantly impact on proppant transport due to the
friction or contact force which comes from the fracture wall Although this work studied
the proppant transport using HVFR there was not much work comparing this settling
velocity of HVFRs with traditional slickwater fluids
Additionally even though a lot of work has been performed to understand the
proppant settling velocity in HVFR the effect of confined and unconfined fractures on
static proppant settling velocity measurements has not been thoroughly investigated This
work will conduct laboratory work intensively to fill the knowledge gap This study
investigated five factors that could affect proppant settling velocity performance viscosity
profile elasticity (Normal forces and relaxation time) proppant size wall effect and
fracture orientation
69
2 PROPPANT STATIC SETTLING VELOCITY
This study provides insights on the wall effect factor on measuring proppant static
settling velocity It also evaluates the elastic and viscous properties of HVFRs fluid through
calculating the elasticity to viscosity ratio
21 WALL EFFECT (119917119960)
Proppant settling velocity plays vital factor during proppant transport in complex fracturing
system due to the very narrow widths of natural fractures Therefore the ratio between the proppant
diameters and the fracture width is pointed out in this study For Newtonian fluids (Faxen 1922)
addressed the wall effect on settling velocity on creeping flow regime The study concluded that
wall factor depends on the ratio between particle diameters to cell width A retardation effect of
walls on particle settling velocity reduced the settling velocity This retardation effect can be
quantified as wall factor (119865119908) The wall factor defines as the ratio between the particles settling
velocity in confined walls to settling velocity in unconfined fluids as shown in the Eq 1 (Malhotra
and Sharma 2013)
119865119908 =119878119890119905119905119897119894119899119892 119907119890119897119900119888119894119905119910 119894119899 119888119900119899119891119894119899119894119899119892 119908119886119897119897119904
119878119890119905119905119897119894119899119892 119907119890119897119888119900119894119905119910 119894119899 119906119899119888119900119899119891119894119899119894119899119892 119891119897119906119894119889 (1)
If 119865119908 gt1 settling velocity is affected by confining walls
if 119865119908 le1 wall effect is negligible
22 PARTICLE SHEAR RATE (ϔ)
Calculating apparent particle shear rate leads to avoid overestimation or
underestimation of the right value of particle shear rate therefore determine the particle
70
shear rate range within the Power law model (K n) is essential step to describe the shear
thinning effect of the HVFRs fluids Ba Geri et al (2019b) Eq 2 can be used to estimate
the particle shear rate
ϔ = 2 lowast 119881119904119889119901 (2)
where ϔ is the particle shear rate 119881119904 is the terminal settling velocity 119889119901 is the particle
diameter
23 ELASTICITY TO VISCOSITY RATIO (120640119942120650)
Viscoelastic fluids consist of two main properties (viscosity and elasticity) To
evaluate which property gives the greatest contribution during proppant transport Equation
4 was used to measure the elasticity to viscosity ratio (120582119890120592) (Shen et al 2018)
120582119890120592 =051205911198731(ϔ)
120578(ϔ) (3)
where λeυ is the elasticity to viscosity ratio 1198731(ϔ) is the first normal stress 120591 is
relaxation time and 120578(ϔ) is the shear viscosity
The numerator consists of the elasticity portion (relaxation time 120591 and first normal
stress 1198731(ϔ)) and the denominator is a function of only the viscosity profile (120578(ϔ)) The
elasticviscous ratio demonstrated by elasticity once their value more than one while if the
elasticviscous ratio less than one that indicates is the viscosity play main role during
proppant transport
71
24 FORCES INFLUENCED PARTICLES SETTLING VELOCITY
The most common correlation was derived by Stokes which can be used to calculate
settling velocity Vs if the Reynolds number and drag coefficient 119862119863are known which are
shown in Eq 6 ndash 8 (Arnipally and Kuru 2018)
119877119890119901 lt 1 (creeping flow regime)
119877119890119901 =119863119901119881119904120588119891
120583119891 (4)
119862119863 =24
119877119890119901 (5)
119881119904 =(120588119904minus120588119891)119892119863119904
2
18120583119891 (6)
Three main forces dominate the vertical motion of solid particles in a fluid
gravitational force FG buoyancy force FB and drag force FD (Arnipally 2018)
119865119892 = 120588119901119907119901119892 (7)
119907119901 = 12058711988911990136 (8)
119865119887 = 120588119907119901119892 (9)
119865119863 = 1198621198631198601205881198911198812
2 (10)
where 120588119901 is the particle density 119907119901 is the volume of the particle 120588119891 is the fluid density
119889119901 is the particle diameter g is the acceleration due to gravity (981 m119904minus2) 119862119863 is the drag
coefficient A is the projected area and V is the settling velocity
72
3 EXPERIMENT DESCRIPTION
31 MATERIALS
311 Hydraulic Fracturing Fluids The fracturing fluid tested was regular FR
(without adding any chemical additives) and HVFR-3
312 Preparing Fracturing Fluids According to standard industry practice of
using HVFR-3 four different concentrations (1 2 4 8 gpt) of HVFRs were prepared by
mixing with deionized (DI) water Shen et al (2018)
313 Proppant Sizes Sand proppant size 2040 3050 and 4070 mesh obtained
from US Silica and spherical glass beads sizes (2mm 4mm and 6mm) were used to
measure proppant terminal settling velocity
314 Rheometer A high accuracy advanced MCR 302 Anton-Paar rheometer
with a parallel-plate system was used to measure viscosity-shear profile normal forces
and the dynamic oscillatory-shear measurements at lab temperature conditions
32 EXPERIMENT SETUP
321 Unconfined Fracture Wall Experiments Figure 1 shows the setup of an
unconfined settling velocity measurement The experiment was performed in a 1000 ml
transparent glass graduated cylinder with a diameter at least 25 times of the proppant
diameter to ensure that proppant settling velocity was not influenced by the walls of the
glass container Malhotra and Sharma (2013) In addition a foot ruler was placed alongside
the glass container to measure the fluid level inside the model
73
322 Confined Fracture Wall Experiments Figure 2 shows the schematic of the
experimental fracture cells setup The fracture cell model dimensions are 50 cm height and
7 cm length and kept the same for all the experiments Fracture cells were constructed of
two Plexiglas plates in parallel The spacing between the two parallel Plexiglasses of the
cell is made by gasket rubber to mimic the fracture width Two different fracture widths
were studied 3 mm and 9 mm At this point the cell was filled by either regular FR or
HVFR fluid and positioned vertically High-resolution video camera up to 2000 fps used
to record the proppant settling process Captured videos were tracked and analyzed using
a video analysis software The fracture slot apparatus was illuminated with 4000 Lumens
2X2 ft ndash LED Vapor tight fixture to add extra light Proppant sizes of 2040 3050 and
4070 mesh were used to conduct experiments
Figure 1 Schematic of fracture setup for unconfined fluids
74
Numerous of natural fractures might be inclined from the main fracture by different
angles during fracturing Understanding proppant settling behavior in inclined fracture is
essential for proppant transport in fracture treatment Three different angles 45⁰ 60⁰ and
90⁰ have been investigated to mimic inclined fracture The configuration of this experiment
is to model the particle-wall friction occurred due to the interaction between particles and
inclined walls effect Confined fracture wall setup was positioned as illustrated in Figure 3
to observe the fracture inclination effect Spherical proppants were used with diameter
ranges of 2 mm 4 mm and 6 mm The motion of proppant rolling down in the inclined
cells acting under four forces gravitational force FG buoyancy force FB drag force FD
and Fr friction force
Figure 2 Schematic of fracture setup for confined fluids
75
Figure 3 Schematic of the experimental fracture cell for measuring inclination angle
effect
33 EXPERIMENT PROCEDURES
331 Viscosity Rheological Characterization of the HVFRs
3311 Viscosity profile measurement Steady shear-viscosity rheological test
was performed using an advanced rheometer with a parallel-plate system (PP50TG using
a 030 mm gap) To investigate the viscous behavior the test was implemented by varying
shear rate from 01-1000 119956minus120783 with measurements at 21 pointdecade
3312 Elasticity profile measurement The dynamic oscillatory-shear were
conducted to measure the elasticity profiles including first normal stress N1 relaxation
time and elastic modulus Grsquo The oscillatory test was implemented over a range of
frequencies from 001-100 Hz All rheological property measurements were conducted at
25
3313 Static settling velocity measurement Once the fracturing fluid samples
were prepared at the desired concentration these samples were placed in unconfined and
confined fluids to measure the proppant settling velocity To achieve more accurate results
76
air bubbles were removed from the test fluid by leaving the fluid to rest overnight as
bubbles affect both rheology and settling velocity measurements Next the proppant was
dropped into the fluid column and the camera started capturing the proppant movement
An image analysis tool called ldquoTrackerrdquo
(httpwwwcabrilloedu~dbrowntracker) was applied to get accurate measurements of
vertical position of the proppant at different time steps The slope relationship between
proppant vertical positions to time steps is called terminal settling velocity For more
accurate results settling velocity of each particle was repeated several times Ba Geri et al
2018
332 Static Settling Velocity Calculations Based on Power Law Parameters
(K n)Static settling velocity of spherical particles in viscoelastic power law fluids can be
calculated using the developed model of Shah et al (2007) Two constants (A B) were
employed as a function of power law parameters n k The procedure to calculate the
settling velocity of a spherical particle in viscoelastic Power law fluid is as follows
Step-1
119860 = 69148 1198992 minus 24838119899 + 22642 (11)
119861 = minus05067 1198992 + 1323119899 minus 01744 (12)
Step-2
(1198621198632minus1198991198771198902)
1
2 = (13082minus119899119889119901
119899+2120588119891119899(120588119875minus120588119891)
2minus119899
22(119899minus1)1198702 )
1
2
(13)
Step-3
77
119877119890 = [(119862119863
2minus1198991198771198902)12
119860]
1
119861
(14)
Step-4
119881infin119868119873119864119871 = [2119899minus1119870119877119890
119889119901119899120588119891
]
1
2minus119899 (15)
119881119890119897119900119888119894119905119910 119877119886119905119894119900 = 119881infin119864119871
119881infin119868119873119864119871 (16)
119881infin119864119871 Experimental settling velocity of a particle in unconfining fluid
119881infin119868119873119864119871 Calculated on the basis of apparent viscosity data based on the power-law parameters (k
n)
4 RESULTS AND DISCUSSION
41 VISCOSITY MEASUREMENT RESULTS
Figure 4 shows viscosity measurement profile as a function of loading
concentration All the results exhibit that the HVFRs fluids follow a shear thinning
behavior that as shear rate increases the viscosity decreases At a loading of 8gpt results
for HVFR showed that HVFRs had high viscosity (7766 cp) at a lower shear rate of 01
sminus1 which is around 46 times of the viscosity when the concentration decreased to 1gpt
Table 1 shows the viscosity profile of four different concentrations (1 2 4 8 gpt)
of HVFR-3 All the measurements result of HVFRs exhibited that HVFR-3 fluid follows
shear thinning behavior
78
Figure 4 Effect of HVFR-3 concentration as a function in viscosity shear profile
Table 1 Power law model equations and parameters (n k) for HVFR-3
HVFR Concentration gpt (gallons per thousands of gallons)
Fluid
Name 1 2 4 8
HVFR-3 120583 = 6152120574minus043 120583 = 206120574minus0570 120583 = 60708120574minus063 120583 = 181535120574minus069
R-square 09984 09987 09992 09994
42 ELASTICITY MEASUREMENT RESULTS
The Relaxation time τ can be used to quantify the elasticity of the polymer fluids
Since the HVFRs have high molecular weight the understanding of the elasticity is very
important To evaluate viscoelastic characterizations of HVFR-3 small amplitude
oscillatory shear was carried out in fluid solutionrsquos linear viscoelastic regime using an
advanced rheometer with a parallel-plate system Storage modulus (Grsquo) which represents
elastic response and loss modulus (Grdquo) represents viscous response were both measured
1
10
100
1000
10000
01 1 10 100 1000
Vis
cosi
ty
cp
Shear Rate 1s
8 gpt
4 gpt
2 gpt
1 gpt
79
at wide range of angular frequencies from 001-100 Hz Relaxation time referred as the
inverse of the cross over point (t = 1ω) where the Grsquo equal to Grdquo Figure 5 shows Grsquo and
Grdquo measurements as a function of angular frequency The results showed that low loading
at 1 gpt and 2 gpt had very low relaxation time As the concentration of HVFR increased
the relaxation time became more significant For example at loading of 4 gpt the relaxation
time was 4s and increased to 8 s when loading increased to 8 gpt Normal stress is another
significant elastic property of HVFRs which can be measured as a function of shear rate
Figure 5 Elastic modulus Grsquo and storage modulus G`` as a function of HVFR-3
concentrations
The normal stress is zero in Newtonian fluids due to the isotropic of the fluid
However in polymeric fluids such as friction reducers which can develop anisotropy in the
80
orientation between flow-gradient direction (tyy) and the flow (txx) due to their
microstructures N1 usually is not zero
1198731 = 120591119909119909 minus 120591119910119910 (17)
1198731 = 120591119910119910 minus 120591119911119911 (18)
Figure 6 presents elastic property (normal force N1) as a function of shear rate At
low shear rate the normal stress was very low and started to increase as the shear rate and
loading of HFVRs increased At low shear rates (from 01 to 10 s-1) the normal stress was
very low whereas increasing the shear rate above 10 s-1 showed an increase in normal stress
Normal stress was increased substantially as the HVFR concentration increase For
example at 1000 s-1 the normal stress was approximately 20 Pa and 130 Pa for 2 gpt and
8gpt respectively This result is consistent with the elastic range trend measured previously
by the relaxation time
Figure 6 Effect of HVFR 3 concentration as a function in Normal stress profile
0
20
40
60
80
100
120
140
01 1 10 100 1000
Norm
al
Str
ess
(N1
) P
a
Shear Rate 1s
8 gpt
4 gpt
2 gpt
81
43 SETTLING VELOCITY MEASUREMENT RESULTS
Several factors can control the proppant transport in complex fracture system
including proppant type proppant size fracture geometry and fracture fluids
characteristics eg viscosity and elasticity (Loveless et al 2011 Montgomery 2013) In
this section single particle static velocity measurements were performed in confining and
uncoffining using HVFR-3 loading 2gpt in ambient temperature setup The importance of
measuring proppant static settling velocity is to mimic the conditions of fracture treatment
after stop pumping which represents low shear rate
44 PROPPANT SETTLING VELOCITY PERFORMANCE IN UNCONFINED
FRACTURE WALL
Three different glass beads of diameter sizes 2 mm 4 mm 6 mm were selected to
study the effect of settling velocity in HVFR and slickwater Figure 7 shows terminal
settling velocity as a function of particle diameter and fluid types At same particle size of
2 mm the settling velocity in HVFR was 35 cmsec while in slickwater settling velocity
increased by factor 56 to reach 197 cmsec All the tested particle sizes showed HVFR
has better settling performance compared to slickwater This reduction in settling velocity
using HVFR-3 could help to transport the proppant farther into the fractures
45 PROPPANT SETTLING VELOCITY PERFORMANCE IN CONFINED
FRACTURE WALL
The fracture orientations were examined because in inclination fractures fraction
force plays main factor to reduce the proppant settling velocity (Kou et al 2018 and Ba
82
Geri et al 2018) HVFR-3 with loading 2gpt and slickwater were both used in this
investigation
Figure 7 Effect of proppant settling velocity in HVFR-3 gpt vs slickwater fracture
fluids
Three different fracture orientations (fracture angle 90⁰ fracture angle 60⁰ and
facture angle 45⁰) and three different proppant glass beads sizes (2 mm 4 mm 6 mm) were
used Figure 8 shows settling velocity as a function of proppant sizes and fracture fluid
types at different fracture orientations The results showed that settling velocity
measurements decreased by increasing fracture inclination from 90⁰ to 45⁰ At same
particle size 6 mm of using HVFR the settling velocity in vertical fracture was 26 cmsec
while settling velocity was 96 cmsec in 45⁰ inclined fracture All the results for different
particle sizes and different fracture fluids were showing the same effect of fracture
0
5
10
15
20
25
30
35
40
45
0 1 2 3 4 5 6 7 8
Ter
min
al
Set
tlin
g V
elo
city
cm
sec
Particle Diameter mm
HVFR-3 2mm HVFR-3 4mm HVFR-3 6mm
Slickwater -2mm Slickwater-4mm Slickwater-6mm
83
inclination Results also confirmed our previous observation where HVFR had better
settling velocity performance than slickwater
Figure 9 shows further analysis to understand the effect of HVFR on proppant
settling velocity in comparing with slickwater at different fracture orientations Proppant
size of 2 mm results were used to make this comparison At same condition of fracture
orientation with 45 degree the reduction on settling velocity was over 90 by changing
fracture fluids from slickwater to HVFR-3 The reduction on settling velocity not only in
inclined fractures but also in vertical fracture (angle 90 degree) which reached around 80
once changing fracturing fluids from slickwater to HVFR-3 This substantial reduction in
settling velocity the HVFR could be better alternative for conventional slick water
Figure 8 Settling velocity of HVFR vs Slickwater in vertical fractures by 90 angle vs
inclined fractures angles 60 and 45 degree in confined fractures of 9 mm fracture width
84
Figure 9 Settling velocity reduction in slickwater versus HVFR-3 loading 2 in different
fracture orientation
46 WALL EFFECT ON STATIC SETTLING VELOCITY
Referring to the settling velocity results illustrated in Figures 7 and 8 for un-
confined fluid and confined fluids the wall effect for HVFR was obtained Settling for
these particles were occurred in the creeping flow regime Figure 10 shows 119865119908 as a function
of r (ratio between particle diameter and wall spacing) for the two different fracture widths
of 9 mm and 3 mm It can be seen that wall factors decrease with increase in value of r
This occurred because wall retardation effects increase as particle diameter becomes
comparable to wall spacing In addition to the wall retardation to reduce the proppant
settling velocity fluid elasticity plays main effect to decrease settling velocity of proppant
85
Figure 10 Wall factors as a function of particle diameter to wall spacing in the HVFR-3
loading 2 gpt
47 EFFECT OF VISCOSITY AND ELASTICITY OF HFVR ON PROPPANT
SETTLING VELOCITY
Figure 11 shows steady shear rate-viscosity measurements profile as a function of
shear rate for HVFR-3 HVFRs follow shear thinning model behavior The power law
model (k n) was fitted in the measured data of experimentally in range of particle shear
rate from 33 to 86 119904minus1 The particle shear rate range was selected based on shear particle
calculation using Eq 2 and it summarized in Table 2 for each proppant particle sizes
Figure 12 shows the velocity ratio calculation using HVFR-3 loading 2 gpt as a
function of proppant diameter Equation 16 was used to calculate the velocity ratio
between the measured settling velocity in the lab divided by the calculated velocity based
on power law model parameters (n k) Results showed that velocity ratio for the proppant
86
sizes were less than 1 This could imply that viscosity properties of HVFR3 with loading
of 2 gpt had greater effect on proppant settling velocity than elasticity did
Figure 11 Viscosity as a function of shear rate for HVFR-3 loading 2gpt
Table 2 Particles shear rate calculations for HVFR
Particle
size
Particl
e Size
(cm)
Particle
Shear
Rate
(1sec)
K
(Pasn) n
4070 mesh 0033 33
0206 057
3050 mesh 0473 87
2040 mesh 0635 187
2 mm 020 37
4 mm 040 85
6 mm 060 867
87
Figure 12 Velocity ratio as a function of proppant diameter in HVFR-3 loading 2 gpt
48 EFFECT OF ELASTICITY TO VISCOSITY RATIO (120640119942120650)
Equation 3 used to determine which properties of the fracture fluids demonstrated
the particle settling velocity at wide ranges of shear rates The estimation of shear rate
range is varying during hydraulic fracturing treatments where typically fracturing
treatment conducting within range 300 119904minus1 to 900 119904minus1 Friction loss caused reduction on
shear rate to become in the range of 10 119904minus1 to 100 119904minus1 and continue decreasing until the
shear rate goes to zero at fracture tip Table 3 presents the power law model equations of
the relationship between viscosity and shear rate as well as exponential model for first
normal stress for both HVFR-3 to calculate elasticviscous ratio
Figure 13 shows that for HVFR-3 loading 2 gpt 120582119890120592 = 0004 lowast ϔ055 indicates
that elasticity effect almost negligible since the contribution of elasticity become more
0
02
04
06
08
1
12
14
0 01 02 03 04 05 06 07
V E
L
Vs
INE
L
Proppant Diameter mm
4070 3050 2040
Reduction in velocity due to elasticity
Reduction in velocity due to viscosity
88
important when shear rate larger than 1000119904minus1 The results could imply that viscous
properties of HVFR-3 loading 2 gpt dominate proppant transport The results could imply
that viscous properties of HVFR-3 loading 2 gpt dominate proppant transport within a wide
range of shear rate from injection point until delivering proppant to fracture tip whereas
plays somehow effect at high shear rate gt 1000 119904minus1
5 COST ANALYSIS
This laboratory study investigated several factors that affect the Proppant settling
in high viscous friction reducer fracture fluids Proppant settling velocity was investigated
as function of fluid rheology (viscosity and elasticity) proppant size retardation confining
walls and fracture orientation
Figure 13 Calculated elasticviscous ratio as a function of shear rate for HVFR-3
loading 2 gpt
0001
001
01
1
01 1 10 100 1000
λev
Shear Rate 1s
HVFR-3 2gpt
89
Table 3 ElasticViscous ratio 120582119890120592 calculations
The outcomes of this work have provided interesting perceptions into the
understanding of high viscous friction reducer fracture fluids compared to slickwater
fracture fluids The following conclusions can be drawn from this work
bull High viscosity friction reducers provided better proppant transport capability than
using slickwater fracturing fluids Proppant settling velocity could be reduced by above
80 when slickwater was replaced by HVFR
bull Viscosity properties dominated proppant settling velocity while elasticity effect was
almost negligible for HVFR at low loading concentration of 2 gpt
bull Wall retardation effect increase as particle diameter becomes comparable to wall
spacing and it can also depend on HVFR elasticity
bull Changing fracture orientation from vertical position (90 degree) to incline by 45 degree
caused high reduction in proppant settling velocity This reduction could be caused by
wall friction forces when proppant settle into the bottom of the fracture
The Ratio of Elasticity to Viscosity Calculation
Fluid name Viscosity equation
from viscosity profile Elasticity equation
from N1 profile ElasticViscous
ratio
HVFR-3-2gpt 120578(ϔ) = 0195ϔminus054 1198731(ϔ) = 0018ϔ0005 120582119890120592 = 00039 ϔ055
R-square 09988 08674
90
REFERENCES
Arnipally S K and E Kuru 2018 Settling Velocity of Particles in Viscoelastic Fluids
A Comparison of the Shear-Viscosity and Elasticity Effects In Proceedings of the
SPE Annual Technical Conference and Exhibition 9-11 October San Antonio
Texas USA httpsdoi102118187255-PA
Ba Geri M A Imqam and S Dunn-Norman 2018 Proppant Transport Behavior in
Inclined Versus Vertical Hydraulic Fractures An Experimental Study In
Proceedings of the SPEAAPG Eastern Regional Meeting 7-11 October
Pittsburgh Pennsylvania USA httpsdoi102118191813-18ERM-MS
Ba Geri M A Imqam A Bogdan AL Shen 2019b Investigate the rheological behavior
of high viscosity friction reducer fracture fluid and its impact on proppant static
settling velocity In Proceedings of the SPE Oklahoma City Oil amp Gas Symposium
Oklahoma 7 ndash 11 April 2019 httpsdoi102118195227-MS
Ba Geri M A Imqam and R Flori 2019a A critical review of using high viscosity
friction reducers as fracturing fluids for hydraulic fracturing applications In
Proceedings of the SPE Oklahoma City Oil amp Gas Symposium Oklahoma 7 ndash 11
April 2019 httpsdoi102118195191-MS
Clark P E and Q Zhu 1996 Convective Transport of Propping Agents During Hydraulic
Fracturing In Proceedings of the SPE Eastern Regional Meeting 23-25 October
Columbus Ohio httpsdoi10211837358-MS
Dahlgren K B Green B Williams J Inscore V Domelen V and A Fenton 2018
Case Studies of High Viscosity Friction Reducers HVFR in the STACK Play In
Proceedings of the SPE Hydraulic Fracturing Technology Conference and
Exhibition 23-25 January The Woodlands Texas USA
httpsdoi102118189893-MS
Drylie S R Duenckel R Barree and B Hlidek 2018 An Investigation of Proppant
Transport in Friction Reducer Fluid Systems Utilizing a Large Slot Flow
Apparatus In Proceedings of the SPE Annual Technical Conference and
Exhibition 24-26 September Dallas Texas USA httpsdoi102118191720-MS
Faxen H 1922 Der Widerstand gegen die Bewegung einer starren Kugel in einerzumlahen
Fl uml ussigkeit die zwischen zwei parallelen ebenen Wumlanden eingeschlossenist
Ann Phys 68 89ndash119
91
Gadde P B Y Liu J Norman R Bonnecaze and M M Sharma 2004 Modeling
Proppant Settling in Water-Fracs In Proceedings of the SPE Annual Technical
Conference and Exhibition 26-29 September Houston Texas
httpsdoi10211889875-MS
Hu Y T D Fisher P Kurian and R Calaway 2018 Proppant Transport by a High
Viscosity Friction Reducer In Proceedings of the SPE Hydraulic Fracturing
Technology Conference and Exhibition 23-25 January The Woodlands Texas
USA httpsdoi102118189841-MS
Johnson M A Winkler C Aften P Sullivan W A Hill and C VanGilder 2018
Successful Implementation of High Viscosity Friction Reducer in Marcellus Shale
Stimulation In Proceedings of the SPEAAPG Eastern Regional Meeting 7-11
October Pittsburgh Pennsylvania USA httpsdoi102118191774-18ERM-MS
Khan AR JF Richardson 1987 ldquoThe resistance to motion of a solid sphere in a fluid
Chemrdquo Eng Sci 62 135ndash150
Kou R G J Moridis and T A Blasingame 2018 Analysis and Modeling of Proppant
Transport in Inclined Hydraulic Fractures In Proceedings of the SPE Hydraulic
Fracturing Technology Conference and Exhibition 23-25 January The
Woodlands Texas USA httpsdoi102118189856-MS
Lali A M A S Khare Joshi J B et al 1989 Behaviour of Solid Particles in Viscous
Non-Newtonian Solutions Settling Velocity Wall Effects and Bed Expansion in
Solid-Liquid Fluidized Beds Powder Tech 57 (1) 39ndash50
httpsdoiorg1010160032-5910(89)80102-0
Loveless D JHoltsclaw R Saini P C Harris and J Fleming 2011 Fracturing Fluid
Comprised of Components Sourced Solely from the Food Industry Provides
Superior Proppant Transport In Proceedings of the SPE Annual Technical
Conference and Exhibition 30 October-2 November Denver Colorado USA
httpsdoi102118147206-MS
Malhotra S and M M Sharma 2013 Settling of Spherical Particles in Unbounded and
Confined Surfactant-based Shear Thinning Viscoelastic fluids An Experimental
Study Chemical Engineering Science vol 84 092013
Michaelides EE 2002 Analytical expressions for the motion of particles In DeKee D
Chhabra RP (Eds) Transport Processes in Bubbles Drops and Particles 2nd ed
Taylor amp Francis New York (Chapter 2)
Michaelides EE 2003 ldquoHydrodynamic force and heatmass transfer from particles
bubbles and drops ndash the Freeman Scholar Lecturerdquo J Fluid Eng (AMSE) 125
209ndash238
92
Montgomery C 2013 Fracturing FluidltbrgtComponents International Society for Rock
Mechanics and Rock Engineering
Motiee M Johnson M Ward B Gradl C McKimmy M and J Meeheib 2016 High
Concentration Polyacrylamide-Based Friction Reducer Used as a Direct Substitute
for Guar-Based Borate Crosslinked Fluid in Fracturing Operations In Proceedings
of the SPE Hydraulic Fracturing Technology Conference 9-11 February The
Woodlands Texas USA httpsdoi102118179154-MS
Shah SN Fadili YE Chhabra RP 2007 New model for single spherical particle
settling velocity in power law (visco-inelastic) fluids Int J Multiphase Flow 33
51ndash66
Shen L L Vigderman D Heller and D Fu 2018 Can Friction Reducers Transport
Sand During Fracturing Treatment In Proceedings of the SPEAAPGSEG
Unconventional Resources Technology Conference 23-25 July Houston Texas
USA httpsdoi1015530URTEC-2018-2873723
Tong S R Singh amp K K Mohanty 2017 Proppant Transport in Fractures with Foam-
Based Fracturing Fluids In Proceedings of the SPE Annual Technical Conference
and Exhibition 9-11 October San Antonio Texas USA
httpsdoi102118187376-MS
Van Domelen M W Cutrer S Collins and MRuegamer 2017 Applications of
Viscosity-Building Friction Reducers as Fracturing Fluids In Proceedings of the
SPE Oklahoma City Oil and Gas Symposium 27ndash31 March Oklahoma City
Oklahoma USA httpsdoi102118185084-MS
Zapryanov Z and STabakova 1999 Dynamics of Bubbles Drops and Rigid Particles
Kluwer Academic Publishers Dordrecht The Netherlands
93
IV INVESTIGATE PROPPANT TRANSPORT WITH VARYING
PERFORATION DENSITY AND ITS IMPACT ON PROPPANT DUNE
DEVELOPMENT INSIDE HYDRAULIC FRACTURES
Mohammed Ba Geri1 Abdulmohsin Imqam1 and Mohammed Suhail2
1 Deparment of Petroleum Engineering Missouri University of Science and Technology
Rolla MO 65409
2 King Saud University Riyadh Saudi Arabia
ABSTRACT
Proppant transport adequately during hydraulic fracturing treatment assumes same
perforation contribution through multi-perforation system Proppant transport performance
into the different ordination fracture system using multi-entry perforation technique is still
not fully understood This experimental study was aimed to deeply investigate five factors
that affect proppant transport performance number of perforations perforation opening
size shear rate fracture orientation and proppant size distribution The impact of these
factors on proppant transport performance from different perspective was studied Fracture
slot model was designed and built to observe easily the effects of perforation density and
fracture orientation
The results of this experimental work show that limited-entry perforation technique
has significant impact on proppant transport within fractures where single top perforation
had better proppant placement than multi-perforation system Fracture area was
approximately propped with 66 and 48 using top perforation and multi-perforation
system respectively Slurry with high shear rate has a negative effect on the proppant
94
equilibrium dune level (EDL) and fracture propped area (FPA) Fracturing treatment using
high shear rate causes high pressure drop in the fracture that leads to decreasing EDL by
17 and fracture propped area by 23 comparing to using low shear rate Using large
proppant size (2040) leads to form high EDL and FPA compared to 100 mesh size
Proppant transport dominated by four mechanisms and the vertexes near wellbore plays
main mechanism to carry proppant farther inside the fracture
1 INTRODUCTION
Pressurized low viscosity fracture fluids (eg slickwater) have been used in
hydraulic fracturing treatments for a long time because low viscous fluids have the ability
to create desirable fracture geometries and long fracture lengths in ultra-tight permeability
reservoirs Many experimental studies have been conducted in vertical fracture slots to
highlight the factors that affect the proppant transport process (Kern et al 1959 Medlin et
al 1985 Patankar et al 2002 Wang et al 2003 Woodworth and Miskimins 2007) Multi-
stage fracturing techniques are essential to providing effective pathways for hydrocarbon
fluids to flow from unconventional reservoirs to the wellbore Each stage is comprised of
many clusters and each cluster consists of several reservoir entry points called
perforations Analysis of well logging data in horizontal wells in unconventional reservoirs
indicated that there was no contribution from 20 to 40 of perforation clusters on well
production Miller et al (2011) Crump and Conway (1988) Economides and Nolte
(2000) They observed that not all perforation is produced in shale basins for instance 21
95
32 and 39 in the Eagle Ford shale the Woodford shale and the Haynesville shale
respectively
Therefore meeting performance expectations requires enhancing the effective
completion quality and reducing completion cost by selecting optimum designs for
completion parameters like clusters and number of perforations Although the previous
work concluded that the production rate in multi-system perforation is less than limited-
perforation systems the reasons behind this are is still not understood This study will
highlight the effect of perforation density and perforation number on proppant transport
performance in terms of proppant equilibrium dune level and fracture propped area
Predicting particle settling velocity and proppant transport in different types of
hydraulic fracturing fluids including Newtonian and non-Newtonian fluids was attained
by (Clark and Zhu 1996) Gadde et al (2004) studied how settling velocity can be affected
by changing proppant size fracture width velocity of fluid and rheologicaly properties of
fluids The study concluded that using Stokersquos law is not an accurate way of predicting
proppant settling rate Liu and Sharma (2005) used different rheological characterizations
of fracturing fluids to study the effect of particle diameter on fracture width and settling
velocity They concluded that for large particle diameters the horizontal velocity of
proppant is less than the fluid velocity due to a large wall effect Alotaibi et al (2015)
extensively investigated the development of dune level and proppant transport mechanisms
at different stages of fracturing treatment using slickwater They observed that proppant
was sorted from smallest to largest until reaching EDL Mohanty et al (2016) conducted
experimental and simulation studies about proppant transport in fracture intersections using
slickwater
96
They concluded that increasing shear rate causes reduction in equilibrium bed
height while proppant dune length increases by increasing the shear rate Kadhim et al
(2017) conducted experimental study using slot fracture model to investigate the
heterogeneous fracture width wall roughness and leak-off on proppant settling
mechanisms They found that fracture wall roughness plays significant role on proppant
transport where noticed that settling velocity decreased and leads to decreased equilibrium
dune level They also observed that fracture width has more influence on settling velocity
than horizontal proppant velocity Desipt of the amount of previous work the effect of
perforation density on EDL and FPA has not been investigated thoroughly This paper will
provide a full understanding of proppant transport from different angles including pressure
loss across fractures injection shear rate and number of perforations that contributed to
proppant transport treatment
In addition due to the understanding that a created fracture orients perpendicular
to the minimum horizontal principal stress most existing studies assumed that proppant
transport occurred in a vertical geometry model Wright et al (1995) presented field studies
illustrating that over the production time of the Chevron Lost Hills the inclination changed
from 82⁰ to 45⁰ degrees between fracture treatments Dinh et al (2009) studied field
examples showing that fracture orientation is vertical near the wellbore but deviated
inclination as the moved away from the wellbore Kou et al (2018) developed a simulation
model to evaluate proppant transport in inclined fractures
Their results observed that proppant performance is better placement in inclined
fractures Ba Geri et al (2018) experimentally investigated the effect of fracture inclination
on proppant transport The study concluded that inclination of fractures can have a
97
significant impact on proppant transport due to the friction or contact force that comes
from the fracture wall This friction affects the settling velocity of the proppant and the
proppant distribution efficiency inside the fracture Increasing the fracture inclination angle
increases the fracture propped area This current study is extended work to our previous
publication Ba Geri et al (2018) in terms of studying perforation density and opening size
perforation impact on EDL and FPA
Based on the authorrsquos knowledge most of the previous lab work did not seriously
consider the impact of perforation density and fracture orientation on proppant transport
Thus this work will conduct intensive laboratory work to fill that knowledge gap This
study has deeply investigated five factors that affect proppant transport performance
number of perforations perforation opening size slurry shear rate fracture orientation and
proppant size distribution The impacts of these factors on proppant transport performance
from different perspectives was investigated based on the following 1) Behavior of
proppant transport in fracture half-length (Xf) at first fracture pore volume (FPV) 2) Dune
bed level development and fracture propped area at first FPV and EDL 3) Pressure drops
along fracture slot during proppant transport inside fracture This study also identifies and
define the mechanisms of proppant transport inside fractures
2 EXPERIMENT DESCRIPTION
21 EXPERIMENT MATERIALS
The experiments were conducted using white sand proppant supplied by US Silica
company and slickwater (without any chemicals additives) Three different sand sizes
98
(2040 4070 and 100 mesh) were used to investigate proppant size distribution effect US
silica proppant properties are shown in Table 1 All the experiments were conducted using
a proppant concentration of 05 lbgal
Table 1 APIISO properties of the tested US silica white sand proppants
Proppant
Type Roundness Sphericity
Particle
Density
(gcc)
Mean Particle Diameter
(mesh)
White
sand 07 08 265 100 4070 2040
22 FRACTURE MODEL SETUP
Figure 1 shows the proppant transport model apparatus that was built to mimic
proppant slurry transport in hydraulic fracturing treatments A lab fracture model is 61 cm
in length and 61 cm in height with fracture width of 0635 cm The orientation of the model
can be adjusted from vertical to inclined positions Four injection points (representing four
perforations of 0635 cm diameter) were made perpendicular to the fracture slot Along the
height of fracture slot four perforations were installed at the inlet and outlet of the fracture
slot During the proppant slurry injection all the four inlet perforations were used and only
one perforation at the outlet (the bottome one) was opened The other components of the
apparatus are the mixer mixing tank cameras pressure sensors flowmeters and safety
valve The fracture slot apparatus was illuminated with 4000 Lumens 61 cm x 61 cm ndash
LED vapor tight fixture to add extra light to capture clearly the proppant transport inside
fracture
99
Figure 1 Schematic Schematic of the experimental proppant transport evaluation system
23 EXPERIMENT PROCEDURE
To mimic a low viscosity slickwater stimulation treatment in a reservoir water
initially filled the fracture slot as shown in Figure 1 Three different US Silica White sand
sizes (2040 4070 and 100 mesh) were used to study the facture propped area due to
proppant size distribution in transport treatment Eleven experiments were designed and
conducted to investigate proppant transport behavior using different perforation density
and oriented fractures The number of experiments that conducted with their descriptions
are summarized in Table 2
100
Table 2 List of experiments and parameters
List of Experiments and Parameters
Cas
e
Perforatio
n Opening
Size ()
Proppan
t (mesh)
Shear
Rate
(s-1)
Proppan
t
Loading
(ppg)
Number of
Perforation
Fracture
Orientation
s
1 100 100 60 05 Top single Vertical
2 100 100 60 05 Bottom Single Vertical
3 100 100 60 05 Multi-Perforation Vertical
4 100 100 35 05 Top single Vertical
5 100 100 35 05 Bottom Single Vertical
6 100 100 35 05 Multi-Perforation Vertical
7 60 100 60 05 Multi-Perforation Vertical
8 40 100 60 05 Multi-Perforation Vertical
9 100 100 60 05 Multi-Perforation Inclined
10 100 4070 60 05 Multi-Perforation Vertical
11 100 2040 60 05 Multi-Perforation Vertical
To perform these experiments the expermintal procedure used is as follows
1 The fracture slot was filled with only fracture fluid In our case slickwater to mimic
the pad stage on the hydraulic fracturing treatment
2 The mixer was turned on and proppant was added The proppant concentration was
05 ppg in order to make the slurry
3 The slurry was pumped into the fracture slot at different shear rate (60119904minus1 35119904minus1
and 8119904minus1) The injection process was continued until no change could be observed
in the dimensions of the proppant dune bed inside the fracture
4 High-resolution cameras were used to capture and record the proppant transport
during the experiments
5 The captured videos were tracked and analyzed using a video analysis MATLAB
code
101
6 All the above procedures were repeated for all the experiment cases mentioned in
Table 2
24 EXPERIMENT ANALYSIS APPROACHES
The experiment results were analyzed using the following calculation parameters
241 Equilibrium Dune Level (EDL) Equilibrium dune level (EDL) is the ratio
of sand dune height to fracture model height multiplied by 100 It is measured by using
the program Plot Digitizer where the fracture slot height is divided to the highest point of
proppant bed inside the fracture The ratio between proppant dune to fracture height can be
obtained by applying the following equation (Alotaibi and Miskimins 2018)
Equilibrium Dune Level (EDL) = 119864119902119906119894119897119894119887119903119894119906119898 119889119906119899119890 ℎ119890119894119892ℎ119905
119865119903119886119888119905119906119903119890 119904119897119900119905 ℎ119890119894119892ℎ119905times 100 (1)
242 Proppant Dune Level Development (PDLD) Proppant dune level
development (PDLD) is defined as the ratio between proppant dune levels before reaching
EDL to the EDL Kadhim et al (2017)
Proppant Dune Level Development (PDLD) = 119863119906119899119890 119871119890119907119890119897 (119863119871)
119864119902119906119894119897119894119887119903119894119906119898 119889119906119899119890 ℎ119890119894119892ℎ119905 (119864119863119871)times 100 (2)
243 Equilibrium Dune Length (EDX) Proppant dune length (EDX) is defined
as the ratio between the average dune lengths to the fracture model length multiplied by
100 as shown by the following equation
Fracture propped area (FPA) =119886119903119890119886 119900119891 119901119903119900119901119901119886119899119905 119889119894119904119905119903119894119887119906119905119890119889 119894119899 119905ℎ119890 119891119903119886119888119905119906119903119890
119879119900119905119886119897 119891119903119886119888119905119906119903119890 119886119903119890119886 (3)
244 Pressure Losses Calculations Since the pressure loss across the fractures
is a function of flow rate of the fluid pressure losses effect calculations were investigated
to study the effect of pressure loss across fracture on fracture propped area Typically the
102
following equation (Clark and Zhu 1996) is used to calculate the pressure drop across the
fracture slot
∆119875 = 12119897120583119876119904
ℎ1199083 (4)
where ∆P is the pressure losses across the slot in psi Qs is the slurry flowrate in cm3s μ
is the slurry viscosity in poise h l w are the slot dimensions high and length in cm
respectively
3 RESULTS AND ANALYSIS
31 NUMBER OF PERFORATION EFFECT
To study the perforation impact on proppant transport a 100 perforation opening
size high shear rate 60 (1s) fracture orientation (vertical fracture) proppant size 100 mesh
were used Figure 2 illustrates that changing the number of perforations at first FPV had
similar results in terms of height of proppant and distance the proppant travels inside the
fracture For instance at the first FPV all change the perforation position from the top
perforation system to bottom perforation system had the same delivered amount of
proppant where the fluid carried proppant farther than 56 cm of the fracture length (Xf)
As well as using multi-perforation system at first FPV had the same Xf of proppant as the
single point system At the beginning of injection treatment the fracture propped area looks
similar Later of this treatment the fracture propped area changes because the contribution
of perforations were changed
Figure 3 presents the EDL of different perforation numbers A multi-perforation
system setup used consists of four perforations single-perforation system (top perforation
103
and bottom perforation) The results show that EDL varied tediously in all cases For
example the EDL of the top perforation (single point) was around 71 whereas the EDL
of the multi-perforation system was about 67 Therefore the changes in EDL are very
small between the two different perforation systems
Figure 2 Effect of number of perforations at first FPV
Interestingly Figures 4 and 5 display how different numbers of perforations can
influence the fracture propped area Contribution of proppant transport during top
perforation (single point) leads to have better results compared to a multi-perforation
system Approximately 66 and 48 of fractures were propped using top perforation and
multi-perforation respectively Based on this findings limited-perforation system would
have probably better propped fracture area compared to multi-perforation system
0
5
10
15
20
25
30
0 10 20 30 40 50 60
Fra
ctu
re h
eig
ht
cm
Distance from fracture inlet cm
Top Perf (single inlet) Bottom Perf (single inlet) Multi-Perf System
104
Figure 3 Effect of number of perforations on EDL
Figure 4 Effect of number of perforations on fracture propped area
Figure 5 Real picture of experiment results shown number of perforation effect on
proppant transport Top-perf (left) Bottom-perf (middle) and Multi-perf (right)
0
10
20
30
40
50
60
70
80
90
100
Top - Perf (single Perf) Bottom-Perf (single
Perf)
Multi-Perf
Eq
uil
ibri
um
du
ne
lev
el
(ED
L)
Number of Perforation
0
20
40
60
80
100
Top - Perf (single Perf) Bottom-Perf (single Perf) Multi-PerfFra
ctu
re p
rop
ped
are
a
Number of perforation
Slu
rry
ou
tlet
Top-Perf (Single Perf) Bottom-Perf (Single
Perf) Multi-Perf
Slu
rry
in
let
inje
cti
on
105
32 PERFORATION OPENING SIZE EFFECT
To study the perforation opening size impact on proppant transport 100 60
40 perforation opening size high shear rate 60 (1s) fracture orientation (vertical
fracture) proppant size 100 mesh and multi-perforation system were used Figure 6 shows
that at the first FPV proppant is transported farther by decreasing the perforation opening
size from 100 to 40 because fluid velocity increases with decreasing perforation
diameter To illustrate this at the first FPV the Xf of proppant inside the fracture was 56
cm 52 cm and 48 cm from the fracture inlet of 40 60 and 100 perforation opening
size respectively
Gruesbeck and Collins (1982) noticed that changing the perforation diameter from
38 to frac12 inch did not affect proppant transport performance However our study results do
not completely agree with their conclusion In 60 perforation opening size case the EDL
reached to over 80 EDL which represented almost 17 of the EDL higher than both
perforation opening size cases 100 and 40EDL as shown in Figure 7
Figure 6 Effect of perforation opening size at first FPV
0
5
10
15
20
25
30
0 10 20 30 40 50 60
Fra
ctu
re h
eig
ht
cm
Distance from fracture inlet cmMulti 100 opening Perf Multi 60 opening Perf
106
Figure 7 Effect of perforation opening size on EDL
Figures 8 and 9 show a similar trend for fracture propped area where decreasing
perforation opening size to 60 leads to a 21 increase in fracture propped area compared
to the100 opening When the opening size was decrease to 40 only a 3 impact on
fracture propped area was observed compared to 100 fully opened perforations
Figure 8 Real picture of experiment results shown perforation opening size effect on
proppant transport perf opening 100 (left) perf opening 60 (middle) and perf
opening 40 (right)
0
10
20
30
40
50
60
70
80
90
100
Opening 100 Opening 60 Opening 40
Eq
uil
ibri
um
du
ne
lev
el (
ED
L)
Perforation opening size
Slu
rry
in
let
inje
ctio
n
Slu
rry
ou
tlet
prod
uct
ion
Perf Opening 60 Perf Opening 40 Perf Opening 100
107
33 SHEAR RATE EFFECT
To study the shear rate impact on proppant transport 100 perforation opening
size multi-perforation system fracture orientation (vertical fracture) and proppant size
100 mesh were all kept constant for this investigation Figure 9 based on results attained
from the first FPV proppant reached farther into fracture tip at high shear rate of 60 119904minus1
with a hight height around 2 cm of the total fracture height in the sand bed At a low shear
rate of 35 119904minus1 poppant did not transport deep and proppant height was larger with
approximately 4 cm proppant height Overall it could be said that at the beginning of
fracture treatment higher shear rates can form a smaller proppant bed and a longer
distribution close to the fracture tip while at low shear rates there is less proppant
distribution and larger sand beds
Figure 9 Effect of fracture shear rate at first FPV
Figure 10 amp11 show EDL inside the fracture at high (60119904minus1) and low shear rate
(35119904minus1) At low shear rate proppant bank formed near wellbore whereas However due to
0
5
10
15
20
25
30
0 10 20 30 40 50 60
Fra
ctu
re h
eig
ht
cm
Distance from fracture inlet cm
Multi system - 60 S-1 Multi system - 35 S-1 Multi system - 8 S-1
108
vertexes around wellbore proppant bank moved farther because swirls play major
mechanism during proppant transportat so proppant bank near well wellbore is less In
contrast decreasing shear rate leads to high proppant dune level and much proppant
accumulate near wellbore Erosional effects play a major role at high shear rates which
majorty affecte EDL This consistency in results with ALotibi at al (2015) confirming that
better proppant performance can be obtained by applying a lower shear rate
Figure 12 shows the EDL as a function of shear rate At low shear rates increasing
the settling velocity increases EDL by 78 while the increasing shear rate to 60119904minus1 caused
increased erosional forces and decreases EDL by 65 Generally these results implied that
equilibrium dune level is inversely proportional with shear rate
Figure 10 Real picture of experiment results shown shear rate effect on proppant
transport high shear rate (left) and low shear rate (right)
Slu
rry
ou
tlet
pro
du
ctio
n
Shear Rate 60119956minus120783
Slu
rry
in
let
inje
ctio
n
Slu
rry
ou
tlet
pro
du
ctio
n
Shear Rate 35119956minus120783
Slu
rry
in
let
inje
ctio
n
109
Figure 11 Effect of high (60119904minus1) and low (35119904minus1shear rates on EDL
Additionally Figure 13 showed that varying shear rate from 60 119904minus1 to 35 119904minus1
causes a 23 reduction in fracture propped area Decreasing fracture propped area can
negatively affect fracture conductivity and reduce productivity of the well These results
agree with previous work done by Melhotra (2016) and Li et al (2016) whose results
found that increasing injection rate leads to a decrease in the dune height level
Figure 12 Effect of shear rate on EDL
0
5
10
15
20
25
30
0 10 20 30 40 50 60
Fra
ctu
re h
eig
ht
cm
Distance from fracture inlet cm
High shear
rate
0
20
40
60
80
100
Eq
uil
ibri
um
du
ne
level
(ED
L)
Shear rate (1s)
35 60
110
Figure 13 Effect of shear rate on on fracture propped area
34 FRACTURE ORIENTATION EFFECT
To study the fracture orientation impact on proppant transport 100 perforation
opening size multi-perforation system high shear rate of 60 (1s) and proppant size 100
mesh were all kept constant variables Figure 14 shows proppant transport behavior at the
first FPV of the fracturing treatment Results show that proppant amount had delivered
deeper to fracture tip in inclined fracture compared to vertical fracture At the fracture tip
proppant dune height in inclined fracture was three times (3 cm) the proppant dune height
(1 cm) in vertical fracture The placement of proppant transport during vertical fractures
remaining stable on proppant bed The reason behind this is that in vertical fractures three
forces (gravity buoyancy drag) control particle settling whereas in inclined fractures in
addition to the original three forces frictional forces dominate the particles movements and
reduce proppant settling velocity
0
20
40
60
80
100
Frc
act
ure
pro
pp
ed a
rea
Shear rate (1s)
35 60
111
Figure 14 Effect of fracture orientation (vertical vs inclined) at first FPV
Figure 15 shows the fracture orientation effect on equilibrium dune level In
inclined fractures EDL is larger than in vertical fractures because reduction in settling
velocity is a function of friction forces Ba Geri et al (2018) As a result 13 of EDL
enhancement occurred in inclined fractures compared to vertical fractures
Figure 15 Effect of fracture orientation (vertical vs inclined) on EDL
0
5
10
15
20
25
30
0 10 20 30 40 50 60
Fra
ctu
re h
eig
ht
cm
Distance from fracture inlet cm
Vertical Fracture
Inclined Fracture
0
10
20
30
40
50
60
70
80
90
100
Inclined Vertical
Eq
uil
ibri
um
du
ne
lev
el (
ED
L)
Fracture Orientation
112
Figures 16 and 17 show the fracture orientation effects on fracture propped area
The fracture propped area was around 52 and 48 in the inclined fracture and vertical
fracture respectively This result indicated that fracture propped area has the same trend
as EDL which is around 8 improvement on fracture propped area noticed in inclined
fracture compared to vertical fracture This result might imply that inclinded fracture could
have better fracture conductivity compared to vertical fracture These observations
matched our previous experimental results Ba Geri et al (2018) and simulation work
results Kou et al (2018) where both confirmed that proppant transport efficiency ismuch
better in inclined fractures than in vertical fractures
Figure 16 Effect of fracture orientation (vertical vs inclined) on fracture propped area
0
20
40
60
80
100
Inclined Vertical
Frc
act
ure
pro
pp
ed a
rea
Fracture orientation
113
Figure 17 Real picture of experiment results shown perforation opening size effect on
proppant transport inclined fracture (left) and vertical fracture (right)
35 PROPPANT SIZE DISTRIBUTION EFFECT
To study the proppant size impact on proppant transport 100 perforation opening
size multi-perforation system high shear rate 60 (1s) and fracture orientation (vertical
fracture) were all kept constant during experiment Figure 18 shows proppant height in the
fracture as a function of proppant traveled distance from fracture inlet at 1st FPV Due to
the size effect it is clearly observed that using large proppant size 2040 settled near the
wellbore whereas small proppant sizes (100 mesh and 4070 mesh) settled uniformly across
the whole fracture section The results observed form using proppant size 2040 mesh
showed that proppant height near wellbore was 6 cm while the proppant height decrease
farther from wellbore inlet to about 2 cm in fracture center and fracture tip In contrast
using small size of proppant like 100 mesh formed same level of proppant height along the
fracture slot without any significant change near wellbore
Slu
rry
in
let
inje
ctio
n
Inclined Fracture
Slu
rry
ou
tlet
prod
uct
ion
Vertical Fracture
114
Figure 18 Effect of proppant size at first FPV
Figure 19 shows that there is a linear relationship between equilibrium dune level
and proppant size distribution The EDL is increased rapidly from 67 to 90 when size
of proppant increased from 100 mesh to 2040 mesh at higher shear rate 60119904minus1
respectively The results agree with Tong et al (2016) including that equilibrium dune level
increased with increasing proppant size at higher shear rates
Figure 19 Effect of proppant size on EDL
0
5
10
15
20
25
30
0 10 20 30 40 50 60
Fra
ctu
re h
eig
ht
cm
Distance from fracture inlet cm
100 mesh
4070 mesh
2040 mesh
0
20
40
60
80
100
100 4070 2040Eq
uil
ibri
um
du
ne
lev
el (
ED
L)
Proppant size mesh
115
Figure 20 Effect of proppant size on on fracture propped area
Figures 20 and 21 present the effect of proppant size on fracture propped area The
graph shows that increasing proppant size cause a reduction in proppant settling velocity
and proppant bank formed around wellbore as shown when 2040 proppant size used On
contrast using a small size of proppant such as 100 mesh leads to less proppant FPA
Interestingly 4070 proppant size provided the best results where FPA almost close of
2040 FPA
Figure 21 Real picture of experiment results shown proppant size effect on proppant
transport 100 mesh (left) 4070 mesh (middle) and 2040 mesh (right)
0
10
20
30
40
50
60
70
80
90
100
100 4070 2040
Fra
ctu
re p
rop
ped
are
a
Proppant size mesh
Slu
rry
ou
tlet
prod
uct
ion
Slu
rry
in
let
inje
ctio
n
100 Mesh 4070 Mesh 2040 Mesh
116
4 DISCUSSION
41 EFFECT OF PRESSURE LOSS ALONG THE FRACTURE SLOT ON
PROPPANT TRANSPORT PERFORMANCE
Figures 22 a and b show pressure difference across fracture calculated from
equation 5 and propped fracture area as a function of slurry shear rate Results show a linear
relationship between pressure loss across fracture and propped fracture area with shear rate
Fracture treatments using high shear rate bcause high pressure drops in the fracture which
decreasing fracture propped area by 23 compared to using low shear rates
Figure 22 a and b pressure loss along fracture slot on shear rate (left) and shear rate
effecton Fracture propped area (right)
Applying equation (5) to calculate pressure drop across fracture slot is shown in
Table 3 Linear relationship between pressure losses and EDL and Xf at 1st fracture pore
volume (FPV) was noticed At the beginning of injection treatment high shear rate 60119904minus1
delivered the proppant fracture to fracture tip 54 cm with EDL 158 cm In contrast we
noticed that by decreasing the shear rate to 35119904minus1 the EDL was 41 cm while the proppant
to 50cm of fracture length As result of increasing shear rate changing on EDL and
0
20
40
60
80
100
Frc
act
ure
pro
pp
ed a
rea
Shear rate (1s)
35 60
0
5
10
15
20
Shear Rate (1s)
ΔP
acr
oss
fra
ctu
re s
lot
psi
60 35 8
117
proppant Xf occurred because the pressure loss across the fracture increased from 98 psi
to 162 psi
Table 3 Shows pressure losses effect at 1st FPV on EDL and Xf
At 1st FPV
Shear
rate (119904minus1)
ΔP across
slot (psi)
EDL
(cm)
Xf
(cm)
High 60 162 158 54
low 35 98 41 50
42 MECHANISMS OF PROPPANT TRANSPORT
The mechanisms of developing proppant transport within the fracture slot are
summarized in Table 5 Proppant dune level development (PDLD) was used to determine
the dominate mechanism of each stage of these foure stages by applying Eqaution
421 Stage 1 Hindered and Free Settling This stage occurs when EDL started
forming height and continues until the of PDLD is 15 and the buildup angle is between
0deg to 93deg Due to increasing of sand dune height at the beginning of this stage proppant
particles do not roll inside the fracture Thus large size 2040 mesh of proppants were
moving as clusters or groups and spread along the fracture referring as ldquohindered settlingrdquo
While changing proppant size to the fine particles 100 mesh settled freely farther in
fracture
422 Stage 2 Saltation In this stage PDLD reaches 15 to 42 while the buildup
angle ranges from 93deg to 193deg Saltation is the only mechanism observed in this stage due
to lift force of the proppant The physical dynamics of the is lifting force plays a major role
in moving the particles by causing the proppant to jump and leave the sand bed surface
118
Because of the speed difference between the flow above and below the particles the
pressure difference acts as a liftting force Therefore the particle jumps and leaves as a
result of the force caused by the pressure difference exceeding the force of gravity Around
18 of PDLD is developed in this stage leading to reduction in the cross-section flow
area
423 Stage 3 Suspension Rolling and Swirl at Inlet This stage occurrs when
PDLD is between 42 to 71 and the buildup angle is from 193deg to 26deg Three different
mechanisms dominate proppant performance and transport within the fracture suspension
rolling and swirl at the inlet Erosional forces increased causing rolling of the proppant on
the sand bed due to the particle drag force being higher than the gravitational force The
major development above 30 of EDL happened in this stage leading to the presence of
swirl and vortices at the inlet due to high flow turbulence Therefore proppant transport
efficiency is dominated mainly by these vortices
424 Stage 4 Saltation Rolling and Swirl at Inlet This stage occurrs when
PDLD is between 71 and 100 and the buildup angle is between 26deg to 42deg The
combination of three mechanisms controls the proppant transport performance saltation
rolling and swirl at the inlet The vortices which assist in forming the proppant pile shape
The vortex diameter can sometimes be 15 the fracture half-length
The dynamic oscillatory-shear measurements were conducted to measure the
elasticity profile characterizations and first normal stress N1 The oscillatory test was
implemented over a range of frequencies from 001-100Hz All rheological properties
measurements were conducted at lab and high temperature ranges
119
Table 4 Four proppant transport mechanisms to reach the PDLD
425 Thermal Stability Measurement The influence of temperature during
fracturing operations has not been fully understood in shale oil reservoirs This paper
investigated the effect of thermal stability of rheology characterizations of HVFRs which
tends to alter parameters such as time dependency fluid elasticity viscosity and first
normal stress To better mimic the real fracturing process the experiments were performed
under elevated temperatures by using an advanced rheometer Viscosity-shear profile
measurements for three different temperatures of 77 122 176 have been conducted
for both HVFRs and linear gel fracture fluids
426 Static Settling Velocity Measurement At this point the graduated cylinder
is filled with HVFR and the cell is positioned vertically To measure proppant settling
120
velocity in unconfined fluids high-resolution video camera is used to record the settling
process In this setup proppant diameter ranged from 0453 mm to 6 mm A single proppant
was dropped in the HVFR and allowed to settle A high-resolution video camera has been
used to capture the process of free proppant settling An image analysis tool called
ldquoTrackerrdquo ( httpwwwcabrilloedu~dbrowntracker) was applied to get accurate
measurements of vertical position of the proppant at different time steps (Ba Geri et al
2018) The slope of relationship between proppant vertical positions to steps time step is
called terminal settling velocity For more accurate results settling velocity of each particle
were repeated three times
5 CONCLUSIONS
This laboratory study investigated several factors that affect proppant transport
efficacy It has provided new and interesting perceptions into the understanding of proppant
placement and distribution across the fracture The following conclusions can be drawn
from this work
bull Limited-entry technique has a large impact on proppant transport within fractures A
single top perforation had a 27 improvement in the fracture propped area compared
to a multi-perforation system
bull High shear rates have negative effects on the EDL and fracture propped area Increasing
the shear rate caused a decrease in both the EDL by 17 and on fracture propped area
by 23
121
bull Decreasing the perforation opening size can help proppant to travel closer to the
fracture tip at the beginning of the treatment A 60 perforation opening size provided
better results in terms of the EDL and fracture propped area
bull Pressure loss in the fracture slot leads to a decrease in the EDL and fracture propped
area Pressure losses were found to get significantly affected by changing shear rate
from 60119904minus1 to 35119904minus1
bull Four proppant transport mechanisms were noticed that could potential dominate
proppant transport behavior during fracturing treatments Vortices play a major role
when the dune height increases and accumulated near wellbore
REFERENCES
Alotaibi M A amp Miskimins J L (2018 May 1) Slickwater Proppant Transport in
Hydraulic Fractures New Experimental Findings and Scalable Correlation Society
of Petroleum Engineers httpsdoi102118174828-PA
Ba Geri M Imqam A amp Dunn-Norman S (2018 October 5) Proppant Transport
Behavior in Inclined Versus Vertical Hydraulic Fractures An Experimental Study
Society of Petroleum Engineers httpsdoi102118191813-18ERM-MS
Daneshy A A (1973 April 1) A Study of Inclined Hydraulic Fractures Society of
Petroleum Engineers httpsdoi1021184062-PA
Dinh A V amp Tiab D (2010 December 1) Transient-Pressure Analysis of a Well with
an Inclined Hydraulic Fracture Using Type Curve Matching Society of Petroleum
Engineers httpsdoi102118120540-PA
Gruesbeck C amp Collins R E (1982 December 1) Particle Transport through
Perforations Society of Petroleum Engineers httpsdoi1021187006-PA
Kadhim D Imqam A amp Dunn-Norman S (2017 July 24) Ceramic Proppant Transport
and Placement in Heterogeneous Fracture Systems Unconventional Resources
Technology Conference httpsdoi1015530URTEC-2017-2697613
122
Kern L R Perkins T K amp Wyant R E (1959 July 1) The Mechanics of Sand
Movement in Fracturing Society of Petroleum Engineers
httpsdoi1021181108-G
Kou R Moridis G J amp Blasingame T A (2018 January 23) Analysis and Modeling
of Proppant Transport in Inclined Hydraulic Fractures Society of Petroleum
Engineers httpsdoi102118189856-MS
Liu He Zhang Guangming Zhang Jin et al (2010 May) Friction calculation and surface
pressure presiction in oil well hydraulic fracturing Chinese Journal of Rock
Mechanics and Engineering Vol 29 Supp 1
McMechan D E amp Shah S N (1991 August 1) Static Proppant-Settling Characteristics
of Non-Newtonian Fracturing Fluids in a Large-Scale Test Model Society of
Petroleum Engineers httpsdoi10211819735-PA
Medlin W L Sexton J H amp Zumwalt G L (1985 January 1) Sand Transport
Experiments in Thin Fluids Society of Petroleum Engineers
httpsdoi10211814469-MS
Miller C K Waters G A amp Rylander E I (2011 January 1) Evaluation of Production
Log Data from Horizontal Wells Drilled in Organic Shales Society of Petroleum
Engineers httpsdoi102118144326-MS
Patankar NA Joseph DD Wang J Barree RD Conway M and Asadi M 2002
Power Law Correlations for Sediment Transport in Pressure Driven Channel Flow
International Journal of Multiphase Flow Vol 28 Pg 1269 ndash 1292
Sahai R Miskimins J L amp Olson K E (2014 February 4) Laboratory Results of
Proppant Transport in Complex Fracture Systems Society of Petroleum Engineers
httpsdoi102118168579-MS
Tong S amp Mohanty K K (2016) Proppant transport study in fractures with
intersections Fuel 181 463-477
Wang J Joseph DD Patankar NA Conway M and Barree RD 2003 Bi-Power
Law Correlations for Sediment Transport in Pressure Driven Channel Flows
International Journal of Multiphase Flow Vol 29 Pg 475 - 494
Warpinski N R (2010 November 1) Stress Amplification and Arch Dimensions in
Proppant Beds Deposited by Waterfracs Society of Petroleum Engineers
httpsdoi102118119350-PA
123
Willingham J D Tan H C amp Norman L R (1993 January 1) Perforation Friction
Pressure of Fracturing Fluid Slurries Society of Petroleum Engineers
httpsdoi10211825891-MS
Woodworth T R amp Miskimins J L (2007 January 1) Extrapolation of Laboratory
Proppant Placement Behavior to the Field in Slickwater Fracturing Applications
Society of Petroleum Engineers httpsdoi102118106089-MS
Wright C A amp Conant R A (1995 January 1) Hydraulic Fracture Reorientation in
Primary and Secondary Recovery from Low-Permeability Reservoirs Society of
Petroleum Engineers httpsdoi10211830484-MS
124
V VISCOELASTIC CHARACTERIZATION EFFECT OF HIGH-VISCOSITY
FRICTION REDUCERS AND PROPPANT TRANSPORT PERFORMANCE
IN HIGH-TDS ENVIRONMENT
Mohammed Ba Geri1 Abdulaziz Ellafi2 Ralph Flori1 Jerry Noles3 and Sangjoon Kim3
1 Deparment of Petroleum Engineering Missouri University of Science and Technology
Rolla MO 65409
2 Department of Petroleum Engineering University of North Dakota Grand Forks ND
58202
3 CoilChem LLC Washington Oklahoma
ABSTRACT
The viscoelastic property of high-viscosity friction reducers (HVFRs) was
developed as an alternative fracturing fluid system because of advantages such as the
ability to transport particles higher fracture conductivity and the potential of a lower cost
due to fewer chemicals and equipment required on location However concerns remain
about using HVFRs to transport proppant in DI water and harsh brine solutions (eg 2wt
KCl and 10 lbs brine) The primary objective of this study is to investigate the viscoelastic
property in order to understand the true proppant transporting capacity of fracturing fluids
in a high-TDS environment
To address the evaluation performance of HVFRs numerous papers associated
with the viscoelastic property of hydraulic fracturing fluids were investigated and
summarized This paper also provides a full comparison study of viscosity and elastic
modulus between HVFRs and among fracturing fluids such as xanthan polyacrylamide-
based emulsion polymer and guar Moreover viscosity profiles and elastic modulus were
125
conducted at different temperatures Better proppant transportation effect though higher
viscosity through Stokersquos law and the effect on proppant transportation from the elastic
modulus comparison were also investigated Finally the results of the HVFR Conductivity
test and the successful field test were explained
The results of the experimental work show that the viscoelastic property of HVFRs
provides behavior that is able to transport proppant The viscosity profile decreased slightly
as the temperature increased from 75 to 150 when the DI water was used While using
10 lbs brine the viscosity was reduced by 33 The longer polymer chains of HVFR
indicated a better elastic modulus in DI water The elastic modulus also indicated that the
highest values were found at frequency 45 Hz from each amplitude and lower values were
found as the amplitude was increased Although high molecular weight HVFRs were
utilized on the conductivity test the results observed that the regained permeability was up
to 110 Finally the promising results from the case study showed that HVFRs could be
economically and efficiently used for the purpose of proppant transportation and pressure
reduction in high TDS fluids
1 INTRODUCTION
The ultimate aim of hydraulic fracturing treatments in horizontal wells is to increase
the flow and conductivity of unconventional oilgas reservoirs by creating a long fracture
from 100 to 1000 ft and a conductive fracture width in the order of a tenth of an inch The
success of the process strongly relies on selecting appropriate slurry fluids and proppants
since these factors govern the proppant transport to place and fill the conductive pathways
126
connecting with the proppant particles Furthermore the effective behavior of the proppant
distribution is essential to understand increasing the well productivity and economics
especially in the case of tight formations (Ba Geri et al 2018 Shrivastava and Sharma
2018) Therefore fracture fluids and proppants characterization are crucial parameters that
require detailed study in order to achieve a predictable and reliable performance as well as
avoiding the early proppant settling near the wellbore (Acharya 1988 Shah 1993)
Common fracturing fluids that have been used in industry are Newtonian fluids
such as slickwater and non-Newtonian viscous fluids with varying degrees of elasticity
including complex polymer solutions crosslinked foams emulsions and surfactant gels
Early in the shale boom high viscosity fluid conventional crosslinked gel was used as the
Frac fluid system in the formation such as the Bakken Formation to add viscosity and
create fracture width However the post-treatment production test indicates that the fluid
does not achieve the desired hydraulic fracturing design objectives because of its low
capability to carry proppant in the fractures Also field results reported high damage causes
with the high-cost operation as well as environmental concerns (Ba Geri et al 2019a)
Although 95 of fracture treatment jobs switched the pumping fluids to hybrid and
slickwater since their low cost and reaching proppant loading improved long term
production in most US shale plays the water-based fracturing stimulation requires an
enormous consumption of clean water to perform the treatments and tends to increase
environmental issues because of the large amount of flow back water which contains
chemicals and toxic components that impact underground water resources (Li and Zhang
2019) As a result slickwater fracturing fluid becomes undesirable and high viscosity
friction reducers (HVFRs) in fracturing fluids have recently been adopted for use in shale
127
plays since they are low cost and provide an effective proppant transport mechanism
(Harris et al 2009 Hu et al 2015 Gomaa et al 2015 Srinivasan et al 2018 Ellafi A et
al 2019 Ba Geri et al 2018 Ba Geri et al 2019 bampc)
In 1988 Acharya studied the settling rates of proppants and the rheological
parameters of two types of cross-linked gels (titanate and borate cross-linked) using
theoretical transport equations and experimental works This paper concluded that the
proppantrsquos characteristics and rheological parameters for fracturing fluids are crucial
considerations for modeling the proppant transport in hydraulic fracturing design
Moreover Shah (1993) investigated the rheological characterization of the various
concentrations of slurry fluid (hydroxypropyl guar (HPG)) in the range of 3040 and 60
Ibm HPGl000 gal to obtain the flow behavior as a result of differential pressure vs flow
rate into the experimental vertical-fracture-flow model This work used proppant sizes of
2040-mesh sand with three concentration values that varied from 0 to 12 Ibmgal at three
temperature conditions (80 110 and 140degF) The data that was gathered presented
correlations of apparent viscosity as a function of fluid concentration fracture shear rate
experiment temperature and proppant concentration Also the correlation can be used to
model 2D or 3D fracture-design simulators in order to estimate fracture geometry and
extension
In 2000 Samuel et al studied the application of viscoelastic surfactant in tight
formations to minimize fracture height growth and increase effective fracture length The
paper presented case studies for low permeability gas wells in Rock Springs Wyoming
and El Reno Oklahoma Field results based on the pressure transient analysis and tracer
indicated that the viscoelastic surfactant fracturing fluid was more beneficial as fracture
128
fluid treatments in both unconventional and conventional formations compared to
traditional and new generations of cross-linked gels
Furthermore Asadi et al (2002) discussed the method for obtaining fracturing
fluids with zero shear viscosity and how this factor is important to evaluate model and
predict the proppant transport in hydraulic fractures Viscoelastic parameters of the
fracturing fluids were measured as a function of oscillatory frequency to determine zero
shear viscosity by involving Maxwellrsquos model at various relaxation times The authors
reported examples and a detailed explanation on the methodology of the fluid viscosity
elasticity and relaxation time measurements to obtain the zero-shear fluid viscosity In
2005 Harris et al conducted an experimental work on fracturing fluids such as metal and
borate crosslinked fluids linear gel fluids and surfactant gel fluids to show how these
fluid types are different in terms of proppant transport by considering the size and
concentration of proppants using a modified Fann Model 50-type viscometer The
experiment outcomes divided fracturing fluids into three major fluid classes with different
capabilities to transport proppant by considering fracture transport velocity a permanent
network structure and a transient network structure
After that Harris et al (2008) compared three measurement techniques steady
shear measurements dynamic oscillatory shear measurements and slurry viscosity The
approaches were applied to the same fracturing fluids in a previous study for verification
of transport prediction Moreover Walters et al (2009) introduced a new clean
biopolymer-based fracturing fluid that has high conductivity stable viscosity low pipe
friction excellent proppant transport and the capability to be used with produced water
They discussed field trials of 14 frac stages over four wells Based on their evaluation this
129
fracturing treatment fluid can provide excellent proppant transport with high fracture
conductivity in tight formations In 2015 Gomaa et al studied the minimum rheological
properties required for effective transport behavior of the proppants by using combinations
of rotational and oscillatory measurements They observed that fracturing additives may or
may not enhance the carrying of the proppants based on the internal fluid structure
Furthermore Hu et al (2015) examined the settling behavior of the carboxymethyl
hydroxypropyl guar (CMHPG) crosslinked with borate by correlating with the rheological
properties of the fluids The authors concluded that the main mechanisms during proppant
transport to enhance particle suspension or transportation are shear thickening and elastic
lifting The research outcome provided guidance to develop the chemistry of fracturing
treatment fluids Huang et al (2018) conducted experimental research to study the effect
of injection parameters on the proppant transport behavior by using different polymer
concentrations in rough vertical hydraulic fractures The results showed that effective
vertical proppant flow occurred when a high polymer slurry concentration was used
In 2018 Aften studied five HVFRs to investigate the viscosities and apply eight
factors for example temperature hydration approach polymer concentration brine
composition additive interaction and pumping and tubular transport using response
surface methodology This study established a reliable approach for gauging performance
and examining the field operations of HVFR systems in a high-TDS environment Finally
Ba Geri M et al (2019 a b c amp d) conducted several studies on HVFR fluids to
investigate the rheological behavior and its effect on the static proppant settling velocity
The research outcomes showed interesting insights into the understanding of high viscous
friction reducer fracture fluids compared to linear gel and slickwater fracture fluids To
130
evaluate the performance of HVFRs on proppant transport a comprehensive literature
review was developed including laboratory work simulation investigation and field case
studies that were summarized and analyzed to understand the viscoelasticity properties of
HVFRs
This research aims to investigate the viscoelastic property that can help to
understand the true proppant transport capacity of fracturing fluids To evaluate HVFRs
performance a full comparison study between HVFRs and three different fracturing fluids
such as xanthan polyacrylamide-based emulsion polymer and guar was provided These
fracturing fluids were examined on different water quality DI water 2 wt KCl and 10
lbs brine (saturated NaCl Solution (TDS 347000 ppm)) In addition viscosity profiles
and elastic modulus were conducted at different temperatures also proppant settling rates
were tested Finally successful field implementations using the new HVFR system were
fully explained
11 PRODUCED WATER IN USA BASINS
Using produced water instead of fresh water is gaining traction to minimize
freshwater usage reduce environmental impacts and increase hydrocarbon recovery from
unconventional formations However generally polymer friction reducers perform more
poorly in high salinity waters High salinity produced waters are more common in the
Marcellus the Permian and the Bakken basins with TDS (total dissolved solids) levels
measured at 43000 ppm 350000 ppm and over 225000 ppm respectively (Be Geri M
et al 2019a Whitfield S 2017)
131
A high salinity environment and hardness are the main barriors to using produced
water as a fracturing fluid-based system due to their negative effect on the fracture fluid
elastic profile as well as the hydration process required to build up enough viscosity to
carry or transport proppant The lifetime and the magnitude of the viscoelastic property of
fracturing fluids depends on several factors such as the source of water (eg levels of TDS
and hardness) polymer dosage fluid pH and test temperature (Li L et al 2014) Thus
switching based-fracturing fluids from fresh water to a high-TDS water system was not an
easy task for the operators and service oil companies
This research used a new high viscosity friction reducer (HVFR) as an alternative
fracturing fluid for downhole conditions with temperature ranges between 150 to 250
The HVFR system proved compatible with high-TDS environments that exceed 340000
ppm Four different fracturing fluids (HVFR xanthan polyacrylamide emulsion polymer
and guar) were tested The HVFR displayed have better viscoelastic performance than the
other tested fluids for transporting the proppant
2 EXPERIMENT DESCRIPTION
21 EXPERIMENT MATERIALS
211 Fracturing Fluids Four different samples of friction reducers were
prepared HVFR xanthan polyacrylamide-based emulsion polymer and guar HVFR
xanthan and guar were slurries containing 3 lbs per gal The polyacrylamide emulsion
polymer was used by itself In this test each product sample was added in DI water 2 wt
KCl and 10 lbs brine (saturated NaCl Solution (TDS 347000 ppm)) following the ratio
132
of 2 gal per 10 bbl The HVFR is anionic polymer and the molecular weight is 18 to 26
million (gmole) Table 1 shows the molecular weight of the tested friction reducers
212 Frac Sand and Dosage To measure the settling rate Ottawa Frac Sand
2040 (particle density 2212 lbsgal) employed was The dosage of frac sand in each
HVFR fracturing fluid was 05 lbs per gallon
Table 1 The molecular weight of friction reducers
Friction Reducers Molecular Weight (gmole)
HVFR 18000000-26000000
Xanthan 1000000-7000000
Emulsion 6000000-11000000
Guar 50000 ndash 8000000
22 MEASUREMENTS OF RHEOLOGICAL PROPERTY
Based on the hydraulic fracturing industry practice the shear rates while pumping
the fluid slurry into the fractures are within the range 10 119904minus1 to 170 119904minus1as well as 511 119904minus1
to determine fluid apparent viscosity In lab studies the common shear rate was either 40
119904minus1 or 100 119904minus1 (Hu et al 2015 Gomaa et al 2015 Ba Geri M et al 2019d)
221 Friction Reducers Preparation for Rheological Property Four friction
reducers were prepared HVFR xanthan polyacrylamide emulsion polymer and guar
HVFR xanthan and guar were dry powder and were mingled with modified base oil to be
compared with the viscosity profile of emulsion polymer The HVFR xanthan and guar
slurries contained 3 lbs of dry solid per gal The polyacrylamide emulsion polymer was
133
used by itself in this test Each product sample was added in DI water 2 wt KCl and 10
lbs brine (saturated NaCl solution (TDS 347000 ppm)) as the ratio of 2 gal per 10 bbl
222 Fracturing Fluid Viscosity Measurement This study investigated the
viscosity of fracturing fluids at share rates 40 119904minus1 100 119904minus1 and 170 119904minus1 Before measuring
the viscosity of each fracturing fluid the fluid was vigorously stirred in the beaker for 30
min The viscosity reading was set to two temperatures ambient 75 and 150
223 Elasticity Characterization (Elastic Modulus Grsquo) Several methods can
be used to measure the elastic properties of viscoelastic fluid such as the viscoelastic
characterization of the fracturing fluids N1 relaxation time the dynamic oscillatory
frequency test and the amplitude sweep test This study investigated the viscoelasticity
behavior of the tested fluid by testing dynamic oscillatory frequency through M5600
(Grace Instrument)
224 Friction Reducers Preparation for Elasticity Property HVFR xanthan
polyacrylamide emulsion polymer and guar were prepared to compare the elastic modulus
of each fracturing fluid Dry HVFR xanthan and guar were suspended in modified base
oil The slurry contained 3 lbs of active ingredient per gal In addition polyacrylamide
emulsion polymer was tested by itself The dosage rate of each slurry was 2 gal per 10 bbl
of DI water and 10 lbs brine solution The hydraulic fracturing fluid was stirred for 30
min prior to measuring the elastic modulus
225 Elastic Modulus Measurement The elastic modulus was measured by
oscillatory motion M5600 (Grace Instrument) was used for this test and set up with
frequencies in increments from 05 to 45 Hz by 05 Hz and amplitudes at 50 200 and
400 The elastic modulus value was calculated by averaging four times measurement
134
23 THE SETTLING RATE MEASUREMENT OF FRAC SAND IN HVFR
FRACTURING FLUID
231 HVFR Fracturing Fluid Preparation Four HVFR fracturing fluids were
prepared to research the frac sand settlement rate in a viscous solution The HVFR dosage
was 05 075 10 and 125 gal per 1000 gal of fresh water The HVFR fracturing fluid
was stirred for 30 min and then was poured into a 1000 ml round glass cylinder
232 Test Method on Frac Sand Settlement Rate Following the ratio of 05 lbs
of frac sand per 1000 gal of fracturing fluid frac sand was placed in a 1000 ml cylinder
The cylinder stopper was completely sealed to prevent fluid loss The cylinder was
vigorously shaken to disperse frac sand evenly in the cylinder for 20 sec As soon as the
cylinder was placed on the table the time was started and then stopped once all of the frac
sand had settled to the bottom of the cylinder The measurement was repeated three times
on each fracturing fluid and the values were averaged
3 RESULTS AND ANALYSIS
31 THE VISCOSITY PROFILES OF VARIOUS FRICTION REDUCERS IN DI
WATER 2 WT KCL AND 10 LBS BRINE (SATURATED NACL
SOLUTION (TDS 347000 PPM))
Of all fluid sources HVFR represented the highest viscosity as shown in Figures
1 2 and 3 while xanthan polyacrylamide emulsion and guar showed mixed results
depending on water conditions The viscosity variation in different water conditions might
be affected by molecular weight and chemical structure Table 1 shows the different
molecular weights of HVFR xanthan emulsion polymer and guar HVFR has a relatively
high molecular weights while xanthan emulsion polymer and guar have low molecular
135
weight At about 50 higher the molecular weight of HVFR helped it become heat resistant
and viscous in all types of fluids Thus the HVFR fracturing fluid system can suspend and
transport proppant deeper into the fractures Proppant suspension and transportation can be
explained by Stokersquos law which is covered by a later section in this paper proppant settling
rate result
From Figure 1 using DI water at a low shear rate of 40 sminus1 and increasing the
temperature from 75 to 150 caused the viscosity profile of HVFR to slightly decrease
from 14868 cp to 14147 cp respectively The same trend was noticed at a high shear rate
of 170 sminus1 In contrast Figure 3 shows that changing the water quality from DI water to
10 lbs Brine (Saturated NaCl Solution) at the low shear rate 40 119904minus1 caused the viscosity
of HVFR to drop sharply by 33 from 2724 cp to 1826 cp while increasing the
temperature from 75 to 150
The effect of fracture fluid on the viscosity profile can be illustrated by Figure 3
At room temperature 75 and high-TDS water both HVFR and guar indicated quite close
viscosity readings and both polyacrylamide emulsion and xanthan fluids exhibited similar
viscosity profiles however synthetic polymers HVFR and polyamide emulsion polymer
represented better viscosity reading This means that the synthetic chemical structure is
more heat resistant than guar and xanthan structures created by nature The results revealed
similar thermal properties of HVFR and emulsion polymer from the viscosity readings in
the 2wt KCl solution as well HVFR and emulsion showed less viscosity reduction than
guar and xanthan comparing the viscosity values at 75 and 150
136
Figure 1 The viscosity profile of various friction reducers in DI water
Figure 2 The viscosity profile of various friction reducers in 2wt KCl solution
Figure 3 The viscosity profile of various friction reducers in 10 lbs brine
0
40
80
120
160
200
Vis
co
sit
y (
cp
s)
at
75 O
F
Shear Rate (1s)
Dosage 2 gal per 10 bbl
Fluid DI water
HVFR
Xanthan
Polyacrylamide Emulsion
Guar
40 100 1700
40
80
120
160
200
HVFR
Xanthan
Polyacrylamide Emulsion
Guar
Dosage 2 gal per 10 bbl
Fluid DI water
Vis
co
sit
y (
cp
s)
at
15
0 O
F
Shear Rate (1s)
40 100 170
0
5
10
15
20
25
30
35
40
Vis
co
sit
y (
cp
s)
at
75
OF
Shear Rate (1s)
40 100 170
Dosage 2 gal per 10 bbl
Fluid 10 lbs brine solution HVFR
Xanthan
Polyacrylamide Emulsion
Guar
0
5
10
15
20
25
30
Dosage 2 gal per 10 bbl
Fluid 10 lbs brine solution HVFR
Xanthan
Polyacrylamide Emulsion
Guar
40 100 170
Shear Rate (1s)
Vis
co
sit
y (
cp
s)
at
150 O
F
137
32 THE N AND K VALUES OF VARIOUS FRICTION REDUCERS IN DI
WATER 2 WT KCL AND 10 LBS BRINE (SATURATED NACL
SOLUTION (TDS 347000 PPM))
Table 2 represents the values of n and K which are called flow behavior index
and flow consistency index respectively Flow behavior index determines rheological
properties Newtonian or non-Newtonian while flow consistency index measures the yield
stress of fluid As published in other papers all of the friction reducers in this test have
indicated a non-Newtonian fluid shear thinning as n value is less than 1 In Di water
HVFR showed the most shear thinning characteristics through the lowest n while guar
was less affected by the shear rate than others In 2 wt KCl and 10 lbs brine solutions
the n values of HVFR and k guar are relatively higher comparing to xanthan and emulsion
polymer It means the viscosity of HVFR and guar is less affected by the shear rate
increments Although considering the true viscosity value the higher n value may be
interpreted as better suspension effect on proppant transportation because the viscosity
reduction percentage from low shear rate to high shear rate should be smaller than other
cases with lower n value The viscosity reading at various shear rates and the n value
should be helpful to evaluate the capability of fracturing fluid to transport proppant
33 THE ELASTIC MODULUS COMPARISON OF VARIOUS FRICTION
REDUCERS IN DI WATER AND 10 LBS BRINE SOLUTION (TDS 347000
PPM)
Figure 4 shows the effect of frequency and amplitude on the elastic modulus The
elastic modulus was increased as the frequency was increased while the amplitude
increment lowered the elastic modulus
138
Table 2 The n and K values with viscosities reading of friction reducers in various
fluids
Fluids Friction
Reducers
Temp
(degF) n K
Visc
40(1s) cP
Visc
100(1s) cP
Visc
170(1s) cP
DI
Water
HVFR 76 022 471 14868 7252 4786
150 015 579 14147 6493 4136
Xanthan 802 033 178 8693 4726 332
151 037 131 7242 4067 2912
Emulsion
Polymer
81 037 077 4336 2443 1753
151 031 081 3587 1903 1319
Guar 80 060 016 2053 1426 1155
151 054 011 1148 752 589
2
wt KCl
HVFR 744 055 031 3299 219 1728
151 047 029 2276 1401 1058
Xanthan 76 010 061 122 536 333
152 006 058 983 417 254
Emulsion
Polymer
74 036 038 2041 1135 807
151 024 052 1835 918 615
Guar 746 052 025 2373 1526 1181
151 041 024 151 879 643
10
lbs
Brine
Solution
HVFR 82 051 030 2724 1741 1344
151 049 022 1826 114 868
Xanthan 79 019 044 1232 585 38
1516 012 048 1018 453 284
Emulsion
Polymer
83 014 062 1439 654 414
151 009 078 1448 626 385
Guar 79 061 021 2742 1925 1568
151 056 012 1326 889 705
This means that the physical activity of polymer is chains directly related with the
elastic modulus The short wavelength by frequency increment made polymer chains more
active in the solution and caused the increment of the elastic modulus The longer polymer
chains (higher molecular weight) of HVFR indicated a better elastic modulus in DI water
than the other tested fracturing fluids Figure 5 represents the elastic modulus of friction
reducers in 10 lbs brine at 75 150 and 250 First of all it was difficult to properly
139
interpret the elastic modulus characteristics of friction reducers at 150 and 250 because
the abundant cations in 10 lbs brine solution interrupted the hydration of the friction
reducers and furthermore the high temperature made the polymer chains loose Both
factors lowered elastic modulus values The very low the elastic modulus values at 150 and
250 in the 10 lbs brine solution might be caused by reading errors of the M5600
instrument Thus the results would observe only the elastic modulus in the 10 lbs brine at
75 guar elastic modulus seemed comparable with HVFR because the diol groups of
guars let the polymer chains crosslinked with cations (sodium) in 10 lbs bine solution The
increment of crosslinking density helped the elastic modulus improve
34 PROPPANT SETTLING RATE RESULT
The settling rate was calculated with the fluid height 3366 cm in a 1000 ml
cylinder and equalize frac sand settlement time (sec) Figure 6 represents the settling rate
of frac sand with various HVFR dosages The settling rate was reduced with HVFR dosage
increment This result can be explained using Stokersquos Law shown in equation (1) The
settling velocity and fluid viscosity are in inverse proportion to each other proving that the
relatively higher viscosity of HVFR represents better proppant transportation capability
when compared to other friction reducers such as xanthan and emulsion polymer The
results show that increasing the dosage of HVFR from 05 gpt to 125 gpt exhibited a slower
settling rate of the proppant by three times from 12 cms to 04 cms respectively
Stokersquos Law for Settling Solids
140
119881 =119892((
1205881120588
)minus1)1198892
18 υ (1)
Table 3 The effect of dosage of HVFRs on proppant settling rate
Figure 4 Frac sand settling rate comparison with various HVFR dosage
V Settling Velocity of the Solid
g acceleration of gravity
ρ1 Mass Density of the Solid
ρ Mass Density of the Fluid
d Diameter of the Solid (Assuming Spherical)
υ Kinematic Viscosity of the Fluid
Dosage per 1000 gal
(Polymer Concentration) Settling Rate (cms)
050 gal 117
075 gal 079
100 gal 060
125 gal 044
141
Figure 5 The elastic modulus measurement of HVFR xanthan emulsion polymer and
guar at 75 150 and 250 in DI water (left) 10 lbs brine solution (right)
35 HVFR ELASTIC MODULUS CHARACTERISTICS BY AMPLITUDE
FREQUENCY FLUID TYPE AND TEMPERATURE
As shown in Figures 7 8 and 9 the elastic modulus of HVFR could be determined
by amplitude frequency fluid type and temperature In this study the HVFR dosage was
2 gal per 10 bbl The elastic modulus of HVFR fracturing fluid was presented with various
frequencies and amplitudes in Figure 7 The frequencies and amplitudes affect the polymer
chains motion responding to the elastic modulus of fracturing fluid As shown in Figure
0
05
1
15
FR1405
Xanthan Gum
Emulsion Polymer
Guar Gum
At 250 OF
Ela
sti
c M
od
ulu
s (
G)
(d
yn
cm
2)
HVFR
0
02
04
06
08
1
FR1405
Xanthan Gum
Emulsion Polymer
Guar Gum
At 150 OF
Ela
sti
c M
od
ulu
s (
G)
(d
yn
cm
2)
HVFR
0
1
2
3
4
FR1405
Xanthan Gum
Emulsion Polymer
Guar Gum
At 75 OF
Ela
sti
c M
od
ulu
s (
G)
(d
yn
cm
2)
HVFR
Amplitude
50
Amplitude
200
Amplitude 400
Frequency 05-
0
5
10
15
20
25
30
35
40
Ela
sti
c M
od
ulu
s (
G)
(d
yn
cm
2)
At 250 OF
Xanthan
Emulsion Polymer
Guar
HVFR
0
10
20
30
40
50
60
Xanthan
Emulsion Polymer
Guar
Ela
sti
c M
od
ulu
s (
G)
(d
yn
cm
2)
At 150 OF HVFR
0
10
20
30
40
50
60
Ela
stic
Mo
du
lus
(G)
(dyn
cm
2 )
At 75 OF
Xanthan
Emulsion Polymer
Guar
HVFR
Amplitude 50
Frequency 05-
Amplitude 200
Amplitude 400
142
7 the elastic modulus indicated the highest values at the frequency 45 Hz from each
amplitude and lower values were indicated as the amplitude was increased The higher
wavelength raised the elastic modulus as the shear stress was increased while the higher
amplitude reduced the value of elastic modulus as stretching out the polymer chains length
ways and losing elastic property in result
This study will be useful for designing fracturing fluids with optimal proppant
transportation conditions The higher elastic modulus helps proppants suspended in fluid
by polymer chains activity Figure 8 shows the HVFR elastic modulus characteristics by
water condition Plenty of cations in the 10 lbs brine solution (TDS 347000 ppm)
hindered the chainsrsquo stretching of high molecular weight polymer and resulted in a low
elastic modulus The temperature also affected the elastic modulus of HVFR fracturing
fluid as presented in Figure 9 The elastic modulus readings at 250 were significantly
reduced as the polymer chains become slack
Figure 6 The elastic modulus characteristic of HVFR by amplitude and frequency at
room ambient
0
10
20
30
40
50
60
Elas
tic M
odul
us (G
)(dy
ncm
2 )
HVFR
Fluid DI water
Amplitude 50
Frequency 05-45 Hz
Amplitude 200
Frequency 05-45 Hz
Amplitude 400
Frequency 05-45 Hz
143
36 HVFR ELASTIC MODULUS PROFILES IN DI WATER amp 10 LBS BRINE
(TDS 347000 PPM)
Figure 8 presents elastic modulus Grsquo as a function of frequency (Hz) at 400
amplitude for 2 gal per 10 bbl of HVFR at two different water qualities DI water (left)
and high-TDS water with 10 lbs brine (right) Case I using DI water with HVFR provides
a strong elastic profile and linear relationship by increasing the test frequency the elastic
modulus Grsquo increase In contrast with case II at high-TDS (340000 ppm) the elastic
modulus increased until the frequency reached 2 Hz After that the elastic modulus
decreased sharply and came close to the zero dincm2
Generally speaking water salinity plays a key role in changing the fluid elasticity
negatively To illustrate at 2 Hz the elastic modulus was 1515 dyncm2 and 183 dyncm2
in both DI water and 10 lbs brine respectively The cations efficiency reduces in high-
TDS water due to the presence of high cations like magnesium and calcium causing
polymer precipitation These polyvalent ions in high-TDS environments can cause
electrostatic crosslink of the polymer which in tum causes precipitation Aften W (2010)
Figure 7The elastic modulus characteristic of HVFR by fluids (DI Water vs 10 lbs
brine)
5
10
15
20
25
30
0 05 1 15 2 25 3 35 4 45 5
HVFR
Ela
sti
c M
od
ulu
s (
G)(d
yn
cm
2)
Frequency (Hz)
Fluid DI WaterAmplitude 400
0
05
1
15
2
25
3
0 05 1 15 2 25 3 35 4 45 5
HVFR
Ela
sti
c M
od
ulu
s (
G)
(dy
nc
m2)
Frequency (Hz)
HVFRFluid 10 lbs BrineAmplitude 400
144
37 HVFR ELASTIC MODULUS PROFILES BY TEMPERATURE
Figure 9 shows elastic modulus Grsquo as a function of frequency (Hz) at 400
amplitude for 2 gal per 10 bbl dosage at different temperatures 75 150 and 250 At
room temperatures 75 and 150 the viscoelastic property was similar and the HVFR
showed that temperatures under 150 did not affect the polymer chains physically while
exhibited a lower value of Grsquo at high temperature around 250 It also observed that the
elastic modulus increased with frequency increments from 05 to 45 Hz
Figure 8 The elastic modulus characteristic of HVFR by temperature
38 FIELD CASE STUDY
A well-C is operated in Wolfcamp Shale TD (Total Depth) was about 22000 ft
and TVD (Total Vertical Depth) was approximately 8900 ft as shown in Figure 10 The
operation pressure range was from 7000 and 11000 psi The fluid type was slickwater
and the proppant size was 4070 white The fluid flow rate was between about 60 and 100
145
bpm In this frac job HVFR as well as other chemicals such as acid and gel breaker were
employed The initial pressure was about 11000 psi The dosage of HVFR from 125 gpt
to 05 gpt was treated for proppant transportation According to these results that HVFR
could be economically and efficiently used for proppant transportation and pressure
reduction at dosage rates as low as 05 gpt
Figure 9 Hydraulic fracture treatment plot from Well-C using HVFRs
4 DISCUSSION THE POTENTIAL OF FORMATION DAMAGE
Achieving high fracture conductivity is a primary goal of hydraulic fracturing
treatment because these conductive channels enable the flow of oil and gas from the
formation to the wellbore Many factors influence the fracture conductivity such as
proppant size and type fracture closure stress and fracturing fluid type HVFR fracturing
fluids are rapidly gaining popularity because of their numerous advantages such as better
146
proppant carrying capability In addition using HVFRs fracturing fluids lowers overall
costs due to fewer chemicals (Be Geri M et al 2019a)
Currently HVFRs have been successfully used as a completion fluid in
unconventional formations However some concerns remain of the potential formation
damage that might occur by using these high molecular weight polyacrylamide-based
fluids Therefore to address these concerns experimental investigation prior to this
research (SPE-197081) was performed to evaluate the potential of formation damage that
might occur due to using HVFRs To evaluate using HVFR fracture fluids a conductivity
test of an anionic polymer HVFR with a high molecular weight (18 to 26 million (gmole)
was conducted under closure pressure 2000 psi and at the reservoir temperature 165
Figure 11 showed the conductivity and permeability of fracturing fluids There are
three types of fracturing fluids baseline (no HVFR addition) 05 gpt and 25 gpt The
pressure and temperature under this test were 2000 psi and 165 respectively At 2000
psi fluid conductivities and proppant permeabilities of baseline and 05 gpt were quite
close In fact 05 gpt fracturing fluid showed better compatibility and permeability than
the baseline even though the HVFR used in this test has a very high molecular weight
positive results concluded that 110 and 94 regained permeability was observed at
dosages of 05 gpt and 25 gpt
147
5 CONCLUSIONS
This paper presented the overall understanding of HVFR xanthan emulsion
polymer and guar on viscosity and elastic modulus in DI water and harsh brine solutions
Based on the active ingredient weight and volume of friction reducers HVFR has good
characteristics for proppant transportation and pressure reduction from viscosity and elastic
modulus results The relatively higher molecular weight and thermal stability of the
synthetic polymer chemical structure supported the desired properties in frac operation
Figure 10 Conductivity and permeability on baseline 05 gpt and 25 gpt at 2000 psi
and 24 hr
In medium brine and high brine solutions through 2wt and 10 lbs brine HVFR
the n (flow behavior index) value of HVFR and Guar was higher than emulsion polymer
and xanthan The lower viscosity reduction from low shear rate to high shear rate may
improve proppant transport deeper into the fracture From Stokersquos law and the viscosity
1600
1800
2000
2200
2400
2600
2800
90
95
100
105
110
115
120
Co
nd
ucti
vit
y (
md
-ft)
Perm
eab
ility (D
arc
y)
Experimental Condition 2 KCl soln at 2000 psi amp 165 OF
and at 24 hr
Permeability
Conductivity
Baseline (0 gpt) 05 gpt 25 gpt
HVFR Dosage
148
profiles of friction reducers the investigation could prove HVFR has a good proppant
transportation capability
The elastic modulus is also related to the proppant transport characteristic It is a
physical stress affecting fluid properties and proppant transportation by the activity of
polymer chains Higher elastic modulus values represent the capability to transport
proppants farther As a result this research observed that HVFR has an excellent elastic
modulus when compared to other friction reducers
Based on the results of viscosity profiles and elastic modulus the research focused
on HVFR properties on the effects of amplitude frequency fluid type and temperature
The elastic modulus of HVFR has good heat resistance up to 150 as shown in the
viscosity profile In addition to the viscosity profile and elastic modulus the permeability
and conductivity of HVFR supports the induction of HVFR in frac operations As shown
in one of field cases in this paper the use of HVFR has been rapidly grown and the future
of utilizing HVFRs looks promising
REFERENCES
Acharya A R (1988 November 1) Viscoelasticity of Crosslinked Fracturing Fluids and
Proppant Transport Society of Petroleum Engineers httpsdoi10211815937-
PA
Aften C (2018 October 5) Analysis of Various High Viscosity Friction Reducers and
Brine Ranges Effectiveness on Proppant Transport Society of Petroleum
Engineers httpsdoi102118191792-18ERM-MS
Aften C W (2010 January 1) Study of Friction Reducers For Recycled Stimulation
Fluids In Environmentally Sensitive Regions Society of Petroleum Engineers
httpsdoi102118138984-MS
149
Aggour T M amp Economides M J (1999 February 1) Impact of Fluid Selection on
High-Permeability Fracturing Society of Petroleum Engineers
httpsdoi10211854536-PA
Asadi M Conway M W amp Barree R D (2002 January 1) Zero Shear Viscosity
Determination of Fracturing Fluids An Essential Parameter in Proppant Transport
Characterizations Society of Petroleum Engineers httpsdoi10211873755-MS
Ba Geri M Imqam A amp Dunn-Norman S (2018 October 5) Proppant Transport
Behavior in Inclined Versus Vertical Hydraulic Fractures An Experimental Study
Society of Petroleum Engineers httpsdoi102118191813-18ERM-MS
Ba Geri M Imqam A amp Suhail M (2019 March 15 a) Investigate Proppant Transport
with Varying Perforation Density and its Impact on Proppant Dune Development
Inside Hydraulic Fractures Society of Petroleum Engineers
httpsdoi102118195018-MS
Ba Geri M Imqam A amp Flori R (2019 April 8 b) A Critical Review of Using High
Viscosity Friction Reducers as Fracturing Fluids for Hydraulic Fracturing
Applications Society of Petroleum Engineers httpsdoi102118195191-MS
Ba Geri M Imqam A Bogdan A amp Shen L (2019 c April 8) Investigate the
Rheological Behavior of High Viscosity Friction Reducer Fracture Fluid and Its
Impact on Proppant Static Settling Velocity Society of Petroleum Engineers
httpsdoi102118195227-MS
Ellafi A M Ba Geri B Bubach and H Jabbari (2019 June 23) Formation Evaluation
and Hydraulic Fracture Modeling of Unconventional Reservoirs Sabrsquoatayn Basin
Case Study American Rock Mechanics Association
Geri M B Flori R amp Sherif H (2019 July 25) Comprehensive Study of Elasticity and
Shear-Viscosity Effects on Proppant Transport Using HFVRs on High-TDS
Produced Water Unconventional Resources Technology Conference
doi1015530urtec-2019-99
Gomaa A M Gupta D V S amp Carman P (2015 April 13) Viscoelastic Behavior and
Proppant Transport Properties of a New High-Temperature Viscoelastic Surfactant-
Based Fracturing Fluid Society of Petroleum Engineers
httpsdoi102118173745-MS
Harris P C Morgan R G amp Heath S J (2005 January 1) Measurement of Proppant
Transport of Frac Fluids Society of Petroleum Engineers
httpsdoi10211895287-MS
150
Harris P C Walters H G amp Bryant J (2009 November 1) Prediction of Proppant
Transport From Rheological Data Society of Petroleum Engineers
httpsdoi102118115298-PA
Hu Y T Chung H amp Maxey J E (2015 February 3) What is More Important for
Proppant Transport Viscosity or Elasticity Society of Petroleum Engineers
httpsdoi102118173339-MS
Li L Sun H Qu Q Le H V Ault M Zhou J hellip Smith D (2014 October 27)
High-Temperature Fracturing Fluids Prepared with Extremely High-TDS and Hard
Produced Water Society of Petroleum Engineers httpsdoi102118170607-MS
Li S amp Zhang D (2019 April 1) How Effective Is Carbon Dioxide as an Alternative
Fracturing Fluid Society of Petroleum Engineers httpsdoi102118194198-PA
Samuel M Polson D Graham D Kordziel W Waite T Waters G hellip Downey R
(2000 January 1) Viscoelastic Surfactant Fracturing Fluids Applications in Low
Permeability Reservoirs Society of Petroleum Engineers
httpsdoi10211860322-MS
Shah S N (1993 May 1) Rheological Characterization of Hydraulic Fracturing Slurries
Society of Petroleum Engineers httpsdoi10211822839-PA
Shrivastava K amp Sharma M M (2018 January 23) Proppant Transport in Complex
Fracture Networks Society of Petroleum Engineers httpsdoi102118189895-
MS
Srinivasan K Ajisafe F Alimahomed F Panjaitan M Makarychev-Mikhailov S amp
Mackay B (2018 August 28) Is There Anything Called Too Much Proppant
Society of Petroleum Engineers httpsdoi102118191800-MS
Walters H G Stegent N A amp Harris P C (2009 January 1) New Frac Fluid Provides
Excellent Proppant Transport and High Conductivity Society of Petroleum
Engineers httpsdoi102118119380-MS
Whitfield S (2017 June 1) Permian Bakken Operators Face Produced Water Challenges
Society of Petroleum Engineers httpsdoi1021180617-0048-JPT
151
VI A COMPREHENSIVE REVIEW OF FORMATION DAMAGE CAUSED BY
HIGH-VISCOSITY FRICTION REDUCERS WOLFCAMP CASE STUDY
Mohammed Ba Geri1 Abdulaziz Ellafi2 Ralph Flori1 Jerry Noles3 and Sangjoon Kim3
1 Deparment of Petroleum Engineering Missouri University of Science and Technology
Rolla MO 65409
2 Department of Petroleum Engineering University of North Dakota Grand Forks ND
58202
3 CoilChem LLC Washington Oklahoma
ABSTRACT
The success of using the hydraulic fracture treatment can be evaluated by
measuring fracture conductivity and regained permeability However selecting the most
suitable fracture fluid system plays an essential role in minimizing or eliminating formation
damage To address potential formation damage that may during fracturing treatment this
research presents a comprehensive review of a good number of published papers that are
carefully reviewed and summarized Theses works include experimental research case
studies and simulation work on recent improvements on using HVFR to carry proppant
and capture the optimum design in fracturing operations This paper also provides
formation damage mechanisms such as chemical mechanical biological and thermal
mechanisms Moreover the research explains the fracture damage categories including the
damage inside the fracture and damage inside the reservoir The advantages of using
HVFRs are also fully explained Experimental rheological characterization was studied to
investigate the viscoelastic property of HVFRs on proppant transport In addition
152
successful implication of utilizing HVFRs in the Wolfcamp formation in the Permian
Basin was discussed
The research findings were analyzed to reach conclusions on how HVFRs can be
an alternative fracture fluid system within many unconventional reservoirs Compared to
the traditional hydraulic fracture fluid system the research shows the many potential
advantages that HVFR fluids offer including superior proppant transport capability almost
100 retained conductivity around 30 cost reduction and logistics such as minimizing
chemical usage by 50 and the ability to stonre operation equipment on location reduce
water consumption by 30 and achieve environmental benefits Finally this
comprehensive review addresses up-to-date of using HVFRs challenges and emphasizes
necessities for using high viscosity friction reducers as alternative fracture fluids
1 INTRODUCTION
Selecting optimal fracturing fluids plays a key role in successful hydraulic
fracturing treatment The primary goal of the hydraulic fracturing process is to achieve high
fracture conductivity because these conductive channels enable the flow of oil and gas
from the formation to the wellbore The fracture damages can negatively impact the
effectiveness of the stimulation process Several numerical studies confirmed that
hydraulic damage could decrease the well productivity by up to 50 Han (2014)
Conventional fracturing fluids such as guar-based fluids build a filter cake on the surface
of the shale matrix Therefore the potential of formation damage after using viscous
fracturing fluids increases because the formed filter cake blocks the pore-throat of low
153
permeability rocks (Wang et al 2010) In addition utalising viscous fracturing fluids has
the potential of decreasing the fracture conductivity due to a higher residual polymer Many
factors influence the fracture conductivity such as proppant size and type fracture closure
stress and fracturing fluid type (Ba Geri et al 2019d)
Many investigations have been conducted concerning fracture damage evaluation
Bennion et al (1999) summarized some issues and solutions associated with low
permeability gas reservoirs during the stimulation and production process The research
concluded that improper fluid selection is one of the major mechanisms that cause
formation damage Reinickeetal et al (2010) conducted an experimental study to
investigate the mechanical damage that occurred at the hydraulic fracture face In some
cases reservoir fluids are not compatible with fracturing fluids due to its chemical
complicity (Aggour and Economides 1999) Farah et al (2016) performed numerical
techniques in order to evaluate the formation damage caused by fracturing-fluid during the
fracturing treatment and its influence on the hydrocarbon production and unconventional
gas formation Cooke C (1975) studied the impact of several types of fracturing fluids on
fracture conductivity and described a theoretical method to evaluate fluid residue on
fracture conductivity Davles and Kulper (1988) studied several factors that affect
proppant-pack and fracture conductivity such as closure stress multiphase flow proppant
size proppant type and fracturing fluids Norman et al (1989) evaluated commonly used
hydraulic fracturing fluids using a simplified technique and reached the conclusion that the
quickest fluids to clean up are flowing foams uncrosslinked gels and crosslinked fluids
Voneiff et al (1996) performed a simulation study to investigate the impact of
unbroken fracturing fluids on the productivity performance of gas wells The conclusions
154
of their research were unbroken fracture fluids initial gas production decreased by 80
fracture clean-up can by delayed by weeks or months and 30 reduction in gas reserves
Pope et al (1996) discussed the effects of viscous fingering of using guar-based fracturing
fluids on fracture conductivity and concluded that for predicting the retained permeability
known polymer concentration polymer molecular weight and temperature are required
Behr et al (2006) developed a numerical model-initialization in order to evaluate the
fracture damage that occurs after closure in tight gas reservoirs Wang et al (2008) ran a
simulation study in order to understand how polymers in the fractures can affect the
cleanup process
Recently HVFRs as a completion fluid have been successfully used in
unconventional formations (Motiee et al 2016 Van Domelen 2017 and Ba Geri et al
2019b) However some concerns remain because of the potential formation damage that
might occur by using these high molecular weight polyacrylamide-based fluids as
completion fluids Motiee et al (2016) used high concentrations of friction reducers
(HCFR) of 14 gpt They conducted conductivity experiments under a high-temperature
system at 220degF for 25 hours and concluded that using 14gpt of HCFR gives 72 of
regained conductivity while adding 1ppt of breaker increased the regained conductivity up
to 80 Van Domelen (2017) reported a comparison study between 15 lbMgal of
crosslinked and 3 gpt of viscosity-building friction reducers (VFR) under the same
conductivity measurement condition and reached the observation that the final regained
conductivity was 106 and 36 of 3gpt of VFR and 15 lbMgal of crosslinked
respectively Galindo (2019) studied the effect of increasing HVFRs viscosity on formation
155
damage The results showed that HVFRs might cause formation damage if used without a
breaker because of polymer residuals
Ba Geri et al 2019a presented a critical review of using HVFRs in lab studies and
field operations The investigation provided a full understanding of using HVFRs as an
alternative fracture fluid The study notes that limited work has been done to evaluate the
potential of formation damage that could occur when using HVFRs during fracturing
treatment This paper provides a comprehensive study of the effects of utilizing HVFRs on
fracture conductivity and regained permeability Three cases were implemented to study
the effect of formation damage caused by using HVFRs fracturing fluids The Baseline
(without HVFR) in 2 KCl solution was investigated in Case I (base case) while the effect
of increasing the HVFRs dosage by 05 gpt and 25 gpt was investigated in Case II and
Case III In both cases the sieve size distribution was performed before and after the test
Successful field implementation of using HVFRs was also discussed
2 FORMATION DAMAGE MECHANISMS
Formation damage can be described as ldquothe impairment of the invisible by the
inevitable and uncontrollable resulting in an indeterminate reduction of the
unquantifiablerdquo (Bennion 1999) Creating a highly conductive path in ultra-low
permeability unconventional reservoirs is an essential step to allow the hydrocarbons to
flow from the reservoirs to the wellbore To maintain the fracture conductivity high-
viscosity fracture fluids (eg guar gum or crosslinked) are required to carry a high
concentration of proppant (Yuan et al 2015) These viscous fluids should be degraded
156
after the fracture treatment for an easy clean-up process The Well productivity
performance is reduced due to formation damage and usually an expensive treatment is
required to remove fracture damage Formation damage can be classified into four main
mechanisms Figure 1 chemical mechanical biological and thermal These mechanisms
inhibit the flow of fluid formation from reservoirs into the fracture network and
consequently impair hydrocarbon production rates and well productivity (Civan 2000
Nasr-El-Din 2003 and Wang et al 2008)
Figure 1 Classification of the common formation damage mechanisms (Civan 2000)
In general fracture damage can be classified into two categories as shown in the
Table 1
Table 1 Fracture damage categories (Wang et al 2010)
Damage inside the
fracture Damage inside the reservoir
Other factors affect clean
up
Fracture plugging with
chemicals and polymers
Fracture-face damage
Proppant crushing
Proppant embedment
Fluid leakoff
Clay swelling
Relative permeability change
Capillary effects
Gel residue breaker
Fracture-fluid viscosity
Viscous fingering
Formation temperature
Fracture conductivity
Reservoir heterogeneity
Fracture geometry
Formation Damage
ThermalBiologicalMechanicalChemical
157
It is important to minimize or eliminate formation damage as this plays a key role
in increasingwell productivity In unconventional reservoirs well performance is a strong
function of fracture conductivity and permeability of the region near the wellbore
Therefore many researchers focus their studies to develop techniques to minimize or
prevent formation damage This paper will provide a better understanding of the distinct
changes of the mechanical characterization on the HVFRs that could be used as guidance
for fracture engineers to design and select more effective high viscous friction reducers
By doing so the promising results of using HVFRs can minimize formation damage and
maximize well productivity and the ultimate operator goal will be achieved
3 WHY HIGH VISCOSITY FRICTION REDUCERS
The primary function of friction reducers is changing turbulent flow to laminar
flow which can reduce frictional loss that occurs while pumping fracturing fluids by up to
80 Recently high-viscosity friction reducers (HVFRs) have gained popularity as drilling
and hydraulic fracturing fluids because the HVFRs exhibit numerous advantages such as
the following (Ba Geri et al 2019a ampb)
bull Reduced pipe friction during fracturing treatments
bull High regain conductivities compared to linear and crosslinked gels
bull Lower operational cost
o Uses less water compared to conventional slickwater treatments
o Consumes 33-48 less chemicals than conventional treatments
158
o Requires less equipment on location
o Requires fewer number of tank trucks in the field
bull More fracture complexity using a less viscous fluid system
bull Better hydrocarbon production results compare to or greater than other fluids
bull Improved flexibility to design treatments that balance technical economic and
operational goals
bull Reduced freshwater proppant and equipment requirements compared with
conventional fluid systems
bull Minimized environmental footprint with selection of engineered additives
bull Simplified operations by reduced screen out risks
4 EXPERIMENTAL DESCRIPTION
41 EXPERIMENTAL MATERIALS
411 Experimental Materials Three different samples baseline (wo HVFR)
05 gpt (05 gal of HVFR per 1000 gal) and 25 gpt (25 gal of HVFR per 1000 gal) were
selected to prepare typical hydraulic fracturing fluids The HVFR is anionic polymer and
the molecular weight is 18 to 23 million The conductivity and permeability test were
conducted in 2 KCl solution at 165 and at a closure stress of 2000 psi to prepare the
fracturing fluid at lab temperature
412 Proppant The proppant size that was selected for this study was between
mesh size 30 and 50 Tables 2 3 and 4 represent the sieve analysis of proppant used for
159
the test with the baseline 05 gpt and 25 gpt The sieve size distribution was performed
before and after the test
Table 2 Proppant sieve analysis for baseline
Mesh Size Length (mm) Baseline
Pre Sieve () Post Sieve ()
30 0600 02 00
35 0500 275 266
40 0425 496 472
45 0355 199 232
50 0300 28 30
Total 1000 1000
Median Particle Diameter (MPD mm) 0463 0458
Table 3 Proppant sieve analysis for 05 gpt
Mesh Size Length (mm) Baseline
Pre Sieve () Post Sieve ()
30 0600 02 02
35 0500 275 265
40 0425 496 478
45 0355 199 225
50 0300 28 29
Total 1000 999
Median Particle Diameter (MPD mm) 0463 0459
Table 4 Proppant sieve analysis for 25 gpt
Mesh Size Length (mm) Baseline
Pre Sieve () Post Sieve ()
30 0600 02 18
35 0500 275 287
40 0425 496 487
45 0355 199 183
50 0300 28 26
Total 1000 1001
Median Particle Diameter (MPD mm) 0463 0458
160
5 MEASUREMENTS OF RHEOLOGICAL PROPERTY
51 SHEAR VISCOSITY CHARACTERIZATION (K N)
Based on the standard practice in the hydraulic fracturing industry the most typical
shear rates that were measured while pumping the fluid slurry into the fractures are within
the range 10 119904minus1 to 170 119904minus1as well as 511 119904minus1 to determine fluid apparent viscosity In lab
studies the common shear rate was either 40 119904minus1 or 100 119904minus1 (Hu et al 2015 Gomaa et al
2015 Ba Geri et al 2019campf) This study investigated three different fracture fluid shear
rates 40 119904minus1 100 119904minus1 and 170 119904minus1
52 SHEAR ELASTICITY CHARACTERIZATION (ELASTIC MODULUS Grsquo)
Several methods can be used to measure the elastic properties of viscoelastic fluid
such as the viscoelastic characterization of the fracturing fluids N1 relaxation time
dynamic oscillatory frequency test and the amplitude sweep test This study investigated
the viscoelasticity behavior of the tested fluid by testing the dynamic oscillatory frequency
through M5600 (Grace Instrument)
53 FRACTURE CONDUCTIVITY EXPERIMENT PROCEDURE
Conductivity cells were loaded with proppants with 20 lbft2 loading between Ohio
Sandstone Cores 1000 psi closure stress was initially applied for 12-24 hours and then
the pressure was increased to 2000 psi for 50 hr The conductivity and permeability of the
samples were measured at 0 24 and 50 hr Equations (1) and (2) represent conductivity
and permeability respectively
161
Conductivity 119896119882119891 =2678μQ
120549119875 (1)
Permeability 119896 =3214μQ
120549119875119882119891 (2)
where
k Proppant Pack Permeability (Darcy)
k119882119891 Proppant Pack Conductivity (Millidarcy-feet)
μ Viscosity of Liquid (cp)
Q Flow Rate (1198881198983min)
P Differential Pressure (psi)
119882119891 Proppant Pack Width (in)
6 RESULTS AND ANALYSIS
61 RHEOLOGICAL CHARACTERIZATION OF THE HVFRS
611 Viscosity Profile Measurement Figure 2 shows the HVFR viscosity profile
in fresh water The range of pH and TDS in this water was 7-8 and 300-450 ppm
respectively Divalent cations such as Ca2+ and Mg2+ were under 10 ppm The HVFR
solution was vigorously stirred for 30 minutes and then each solutionrsquos viscosity was
measured at shear rates 40 100 and 170 119904minus1 through the M5600 rheometer (Grace
Instrument) at room ambient As shown in Figure 2 the viscosity has been proportionally
increased with the HVFR dosage and represents the shear thinning property For instance
at a loading of 3 gpt the results for HVFR showed that HVFR has high viscosity (31 cp)
at a lower shear rate of 040 119904minus1 compared to the viscosity of high shear rate of 0170 119904minus1
162
showed a much lower viscosity of around 14 cp The second observation was that at the
same shear rate (eg 40 119904minus1) increasing the HVFR dosage from 1 gpt to 3 gpt leads to an
increase in the viscosity profile from around 8 cp to 31 cp respectively
Figure 2 HVFR viscosity profile with various dosage in fresh water
612 Elasticity Profile Measurment The viscoelastic properties of HVFR were
measured through the M5600 (Grace Instrument) The dosage ratio was 05 10 20 and
30 gal of HVFR per 1000 in fresh water Prior to the viscoelastic test each sample was
stirred to be completely dispersed in fluids for 30 minutes In this experiment the
frequency was set at 05 to 30 Hz with 05 Hz increments and the amplitude was 200
The viscoelastic properties were measured at room ambient Figure 3 represents the elastic
modulus (Grsquo) of HVFR in fresh water The elastic modulus of the HVFR solution was
increased with the increase of the HVFR dosage
0
10
20
30
40
50
B
C
D
Vis
co
sit
y (
cp
s)
Shear Rate (1s)
40 100 170
1 gpt
2 gpt
3 gpt
HVFR DosageFluid Fresh Water
163
To illustrate at a low dosage of HVFR (less than 1 gpt) the elastic modulus is
almost zero while increasing the dosage up to 3 gpt provides a strong elasticity profile
above 5 dyncm2 In addition the elastic modulus of HVFR was increased with the test
frequency For example Grsquo increased from 1 dyncm2 to almost 6 dyncm2 by increasing
the frequency from 05 Hz to 3 Hz respectively
0
1
2
3
4
5
6
7
B
C
D
E
Ela
sti
c M
od
ulu
s (
G)
(d
yn
cm
2) 05 gal per 1000 gal
10 gal per 1000 gal20 gal per 1000 gal30 gal per 1000 gal
HVFR Dosage in Fresh WaterAmplitude 200
05 10 15 20 25 30
Frequency (Hz)
Figure 3 HVFR elastic property with various dosage in fresh water
62 CONDUCTIVITY AND PERMEABILITY MEASUREMENT ON BASELINE
05 GPT AND 25 GPT
Figure 4 represents the conductivity and permeability of the baseline 05 gpt and
25 gpt depending on pressure and time The measurement of the sample baseline means
the reading of fluid conductivity and proppant permeability without HVFR As adding 05
gal and 25 gal of HVFR per 1000 gal of 2 KCl solution the effect of HVFR was
investigated As shown in figure 1 (A-1000 psi at 24 hr) the 05 gpt and 25 gpt samples
164
regained conductivity and permeability at about 95 and 93 respectively compared
with baseline samples At 2000 psi in Figure 4 (B) the fluid conductivity and proppant
permeability of 05 gpt showed quite close with the characteristic of baseline As time goes
in Figures 4 (C) and (D) shows that at 2000 psi 05 gpt of HVFR contributed to improve
the conductivity and permeability
Figure 4 Conductivity and permeability on baseline 05 gpt and 25 gpt by pressure and
time
Table 4 represents the regain percentage of conductivity and permeability on
samples 05gpt and 25 gpt The conductivity and permeability of 05 gpt at 2000 psi for
24 amp 50 hr were great 103 and 108 on regaining permeability were more than what
expected In addition the conductivity and permeability of 25 gpt look fine The overall
165
regained percentage of 25 gpt was 83 to 93 in this conditional environment The polymer
chains in 25 gpt might interfere with conductivity and permeability
Table 5 The regain percentage of 05 gpt and 25 gpt
Stress
psi
Time (hr)
stress
Conductivity (md-ft)
Permeability (Darcy)
Regain
(Permeability)
Baseline 05 gpt 25 gpt 05 gpt 25 gpt
1000 24 3568177 3401168 3317164 95 93
2000 0 2177109 2183108 182190 99 83
2000 24 2153107 2228110 189094 103 88
3000 50 2122106 2304114 194496 108 91
63 CASE STUDY WOLFCAMP FORMATION REEVES COUNTY TX
631 Geological Background A well-H was located in the Wolfcamp formation
in West Texas The well depth was about 10000 feet along the basin axis and the lateral
section was approximately 8300 feet The net pay thickness of Woflcamp is about 1000
feet to over 4000 feet and the average porosity is 7 The maximum pressure was 9800
psi and the backside pressure was 2000 psi In this job slick was employed as the base
treatment fluid
632 Fracture Design and Execution Figure 5 shows a plot of the individual-
stage fracturing treatment In the early stages of the treatment the pressure reached close
to 9600 psi which could be an indication of creating more fractured area while during the
remainder of the process the pressure was within the range of 7200 psi and 8600 psi The
proppant concentration was increased gradually from 05 ppg to 15 ppg with increasing
the dosage of HVFRs from 050 gpt to 1 gpt The fracture treatment was placed as the
fracture design expectation In the field trial the low dosage of HVFRs (eg 1 gpt)
166
provided promising production results as well as reduction on the cost related to using
HVFR
Figure 5 Hydraulic fracture treatment plot from Well-H using HVFRs
Figure 6 represents real time data from Wolfcamp Well-H Desirable pressure
responded at the prop dosage 025 ppg which entered the formation with 03 gpt During
operation the dosage range of HVFR was increased from 03 gpt to 1 gpt The upper
pressure reached 9400 psi however most of the operation was conducted between 7200
psi and 8600 psi The prop amount was approximately 19000 lbs per stage and 100 of
0310 0337 0404 0431 0458
Time (Hr Min)
05 ppg
10 ppg
15 ppg
1 gpt
050 gpt
720 bpm
1080 bpm
4 lbsmin
6 lbsmin
8 lbsmin
4800 psi
7200 psi
9600 psi
- Sand Dosage (ppg (lbs per gallon)) - HVFR Conc (ppt (lbs per thousand gallons)
- Discharge Rate (bpm (barrel per min) - Blender HVFR Rate (lbsmin)
- Wellside (psi)
167
the prop was placed in the formation Compared to the cost of linear gel using HVFR
provided about 25-30 cost reduction
Figure 6 HVFR dosage real time data
7 CONCLUSIONS
This paper provides a comprehensive review of formation damage caused by using
fracture fluids The formation damage mechanisms (eg chemical mechanical biological
thermal) and fracture damage categories were explained After that experimental work
investigated the viscoelastic properties of HVFRs and the potential of formation damage
caused by using a new fracture fluid system (HVFRs) was determined Finally a field case
study was discussed including the advantages of utilizing HVFRs as an alternative fracture
fluid system to the conventional fracture fluids such as linear gel HVFRs were used
0
05
1
15
2
25
8000
8500
9000
9500
700 720 740 760 780 800 820 840
PolyMax-1000 (ppt)4070 White (ppg)Pressure (psi)
Time (min)
HVFR (ppt)
075 ndash 25 ppt
025 ndash 10 ppg
168
Successfuly in the Wolfcamp formation causing production improvement and 25-30 cost
reduction
The viscoelastic property of high molecular weight (18 to 23 million) of HVFRs
shows promising results on fracture conductivity and regained permeability Through the
conductivity and permeability test it was found that 05 gpt of HVFR did not affect the
conductivity and permeability during the frac operation Even the dosage of 05 gpt helped
to improve fluid conductivity and proppant permeability with up to 108 of regain at
2000 psi and 165 for 50 hr which is a remarkable finding The high dosage of 25 gpt
in the frac operation may initially hinder the conductivity and permeability due to polymer
chains However the conductivity and permeability have gradually improved to 91 of
regain as time goes on
REFERENCES
Aggour T M amp Economides M J (1999 February 1) Impact of Fluid Selection on
High-Permeability Fracturing Society of Petroleum Engineers
httpsdoi10211854536-PA
Ba Geri M Imqam A amp Dunn-Norman S (2018 October 5) Proppant Transport
Behavior in Inclined Versus Vertical Hydraulic Fractures An Experimental Study
Society of Petroleum Engineers doi102118191813-18ERM-MS
Ba Geri M Imqam A amp Suhail M (2019 March 15) Investigate Proppant Transport
with Varying Perforation Density and its Impact on Proppant Dune Development
Inside Hydraulic Fractures Society of Petroleum Engineers doi102118195018-
MS
Ba Geri M Imqam A amp Flori R (2019a April 8) A Critical Review of Using High
Viscosity Friction Reducers as Fracturing Fluids for Hydraulic Fracturing
Applications Society of Petroleum Engineers httpsdoi102118195191-MS
169
Ba Geri M Imqam A Bogdan A amp Shen L (2019b April 8) Investigate the
Rheological Behavior of High Viscosity Friction Reducer Fracture Fluid and Its
Impact on Proppant Static Settling Velocity Society of Petroleum Engineers
httpsdoi102118195227-MS
Ba Geri M R Flori A Imqam L Shen amp A Bogdan (2019c June) Static Proppant
Settling Velocity Characteristics in High Viscosity Friction Reducers Fluids for
Unconfined and Confined Fractures American Rock Mechanics Association
Ba Geri M Ellafi A Flori R Noles J amp Kim S (2019f October) Viscoelastic
Characterization Effect of High-Viscosity Friction Reducers and Proppant
Transport Performance in High-TDS Environment Society of Petroleum
Engineers httpsdoi102018196014-MS
Behr A Mtchedlishvili G Friedel T amp Haefner F K A (2006 May 1) Consideration
of Damaged Zone in a Tight Gas Reservoir Model with a Hydraulically Fractured
Well Society of Petroleum Engineers httpsdoi10211882298-PA
Bennion D B Thomas F B amp Bietz R F (1996 January 1) Low Permeability Gas
Reservoirs Problems Opportunities and Solutions for Drilling Completion
Stimulation and Production Society of Petroleum Engineers
httpsdoi10211835577-MS
Civan Faruk Reservoir Formation Damage Fundamentals Modeling Assessment and
Mitigation 2000
Cooke C E (1975 October 1) Effect of Fracturing Fluids on Fracture Conductivity
Society of Petroleum Engineers httpsdoi1021185114-PA
Davies D R amp Kuiper T O H (1988 May 1) Fracture Conductivity in Hydraulic
Fracture Stimulation Society of Petroleum Engineers httpsdoi10211817655-
PA
Farah N Ding D-Y amp Wu Y-S (2017 August) Simulation of the Impact of
Fracturing-Fluid-Induced Formation Damage in Shale Gas Reservoirs Society of
Petroleum Engineers httpsdoi102118173264-PA
Galindo T (2019 January 29) Can Proppant Transport be Negatively Affected by Too
Much Viscosity Society of Petroleum Engineers httpsdoi102118194317-MS
Geri M B Flori R amp Sherif H (2019 July 25) Comprehensive Study of Elasticity and
Shear-Viscosity Effects on Proppant Transport Using HFVRs on High-TDS
Produced Water Unconventional Resources Technology Conference
doi1015530urtec-2019-99
170
Geri M B Ellafi A Ofori B Flori R amp Sherif H (2019 July 31) Successful
Implementation of High Viscosity Friction Reducers from Laboratory to Field
Scale Middle Bakken Case Study Unconventional Resources Technology
Conference doi1015530urtec-2019-447
Gomaa A M Gupta D V S V amp Carman P S (2015 February 3) Proppant
Transport Viscosity Is Not All Itrsquos Cracked Up to Be Society of Petroleum
Engineers httpsdoi102118173323-MS
Han Jiahang (2014) Hydraulic Fracture Damage Analysis in Tight Gas Reservoirs PhD
Dissertation
Hu Y T Chung H amp Maxey J E (2015 February 3) What is More Important for
Proppant Transport Viscosity or Elasticity Society of Petroleum Engineers
httpsdoi102118173339-MS
Motiee M Johnson M Ward B Gradl C McKimmy M amp Meeheib J (2016
February 1) High Concentration Polyacrylamide-Based Friction Reducer Used as
a Direct Substitute for Guar-Based Borate Crosslinked Fluid in Fracturing
Operations Society of Petroleum Engineers httpsdoi102118179154-MS
Nasr-El-Din H A (2003 January 1) New Mechanisms of Formation Damage Lab
Studies and Case Histories Society of Petroleum Engineers
httpsdoi10211882253-MS
Norman L R Hollenbeak K H amp Harris P C (1989 January 1) Fracture Conductivity
Impairment Removal Society of Petroleum Engineers httpsdoi10211819732-
MS
Pope D S Leung LW Gulbis J amp Constien V G (1996 November 1) Effects of
Viscous Fingering on Fracture Conductivity Society of Petroleum Engineers
httpsdoi10211828511-PA
Van Domelen M Cutrer W Collins S amp Ruegamer M (2017 March 27)
Applications of Viscosity-Building Friction Reducers as Fracturing Fluids Society
of Petroleum Engineers httpsdoi102118185084-MS
Voneiff G W Robinson B M amp Holditch S A (1996 November 1) The Effects of
Unbroken Fracture Fluid on Gas Well Performance Society of Petroleum
Engineers httpsdoi10211826664-PA
Wang Y Holditch S A amp McVay D A (2008 January 1) Simulation of Gel Damage
on Fracture-Fluid Cleanup and Long-Term Recovery in Tight-Gas Reservoirs
Society of Petroleum Engineers httpsdoi102118117444-MS
171
Wang J Y Holditch S amp McVay D (2010 September 1) Modeling Fracture-Fluid
Cleanup in Tight-Gas Wells Society of Petroleum Engineers
httpsdoi102118119624-PA
Yuan B Su Y Moghanloo RG Rui Z Wang W Shang Y 2015 A new analytical
multi-linear solution for gas flow toward fractured horizontal wells with different
fracture intensity J Nat Gas Sci Eng 23 227e238
172
SECTION
3 CONCLUSIONS
This project evaluates the rheological characterization of HVFRs and investigates
the compatibility of HVFRs with the Permian and Bakken produced water Correlateing
the friction reductions measurment on high-TDS produced water was also studied in
produced water and fresh water as well The obtained results from this experimental
investigation provides new insights into the pressure reduction and proppant transport
theories that leads to the developing conclusions as follows
bull HVFR indicated high viscosity values and heat resistant property among friction
reducer samples
bull Based on viscosity values and well temperature by depth HVFR has great proppant
suspension and transportation capacity
bull HVFR showed a great elastic property helping proppant transportation
bull The high viscosity reading and elastic property of HVFR turned into a good fit in
frac operation
bull Also HVFR has other properties such as high molecular weight thermal stability
high regained conductivity and permeability in frac operation comparing other
friction reducers
bull The Future of utilizing HVFR looks promising from a field test
173
REFERENCES
Acharya AR 1988 Viscoelasticity of Crosslinked Fracturing Fluids and Proppant
Transport SPE Production Engineering 3 483-488 SPE-15937-PA
httpdxdoiorg10211815937-PA
Adrian RJ 2005 Twenty Years of Particle Image Velocimetry Experiments in Fluids 39
(2) 159-169 httpdxdoiorg101007s00348-005-0991-7
Ba Geri M Flori R Ellafi A Noles J Essman J Kim S amp Alkamil E H K (2019
November 11) Correlated Friction Reduction and Viscoelastic Characterization of
Utilizing the Permian Produced Water with HVFRs during Hydraulic Fracturing
Society of Petroleum Engineers doi102118197748-MS
Ellafi A Jabbari H Ba Geri M amp Alkamil E (2019 November 11) Can HVFRs
Increase the Oil Recovery in Hydraulic Fractures Applications Society of
Petroleum Engineers doi102118197744-MS
174
VITA
Mohammed Salem Ba Geri was born in Hadramout Yemen He received his
bachelorrsquos degree in Petroleum Engineering from Hadramout University of Science and
Technology Yemen in 2007 He was awarded a fully funded scholarship from Hadramout
Establishment for Human Development (HEHD) to obtain his masterrsquos degree in Saudi
Arabia 2010
Mohammed worked for one year at University of Salford Manchester from 2013 to
2014 Then he worked at Ministry of Oil amp Minerals in Yemen as a reservoir engineer from
2014 to 2016 He was awarded a fully funded scholarship from Hadramout Establishment
for Human Development (HEHD) to obtain his PhD degree in USA in 2017 He recived a
PhD in Petroleum Engineering from Missouri University of Science and Technology
Rolla MO in December 2019
Ba Geri was a member of Society of Petroleum Engineers (SPE) He served as a
volunteer with the SPE since 2010 The field of his research evaluate high viscosity
friction reducers on proppant transport and formation damage His area of interest
stimulationshydraulic fracturing well completions unconventional reservoirs and
production engineering He had several research papers in proppant transport high
viscosity friction reducerrsquos evaluation unconventional shale reservoirs and tight gas
- Investigating the performance of high viscosity friction reducers used for proppant transport during hydraulic fracturing
-
- Recommended Citation
-
- II
-
v
ACKNOWLEDGMENTS
First and foremost I would like to thank Allah for giving me the strength and
opportunity to undertake this accomplished satisfactorily
I would like to express my sincere gratitude to my advisor Dr Ralph Flori for his
guidance patience encouragement and support during my PhD study I would also like
to thank Dr David Rogers Dr Mingzhen Wei Dr Kelly Liu DrSteven Hilgedick and Dr
Vamegh Rasouli for their great effort assistant and serving on my PhD committee
Equally I would like to express my appreciation to the police department at
Missouri SampT for their unlimited support and creative environment Million thanks go to
Chief Doug Roberts Assistant Chief Oscar Kemp Sergeant Bryan Fox and all the
Sergeants officers guards and CSOs team
Many thanks to my sponsor Al sheikh Engrsquor Abdullah Ahmed Bugshan Chief
Executive Officer of Hadramout Establishment for Human Development for sponsoring
my PhD I would also like to acknowledge the BJ Services US Silica and CoilChem LLC
that provided all the necessary materials for this research My further appreciation goes to
Jerry Noles Sangjoon Kim and CoilChem team for there unaltimate assistant during this
acadimec journey
The deepest gratefulness goes to all my friends for encouraging and propelling me
to endeavor to achieve my goals
Last but not least my cordial gratitude my precious and my love goes to my
parents my grandmother my beloved sisters brothers nephews nieces brotherrsquos in-law
sistersrsquo in-law and my sweet heart my wife thanks all for your continued support
vi
TABLE OF CONTENTS
Page
PUBLICATION DISSERTATION OPTION iii
ABSTRACT iv
ACKNOWLEDGMENTS v
LIST OF ILLUSTRATIONS xv
LIST OF TABLES xx
NOMENCLATURE xxii
SECTION
1 INTRODUCTION 1
2 RESEARCH OBJECTIVES 3
PAPER
I A CRITICAL REVIEW OF HIGH-VISCOSITY FRICTION REDUCERS
APPLICATIONS AS AN ALTERNATIVE HUDRAULIC FRACTURING
FLUIDS SYSTEM 5
ABSTRACT 5
1 INTRODUCTION 6
2 DESCRIPTION OF FRICTION REDUCERS AND HIGH-VISCOUS
FRICTION REDUCERS 9
3 LABORATORY AND FIELD STUDIES USING HVFR 13
31 DATA ANALYSIS OF USING HVFRS AT FIELD AND LAB
CONDITIONS 13
32 FRICTION REDUCER AS ADDITIVES VS AS A HVFR FRACTURE
FLUID 14
33 SCREENING CRITERIA GUIDELINES FOR HVFRS 18
vii
4 CONDUCTIVITY PROFILE 19
5 BREAKABILITY PROFILE 20
6 PRODUCED WATER WITH HVFRS 23
7 ECONOMIC ANALYSIS 26
8 CONCLUSIONS 29
REFERENCES 30
II INVESTIGATE THE RHEOLOGICAL BEHAVIOR OF HIGH
VISCOSITY FRICTION REDUCER FRACTURE FLUID AND ITS IMPACT
ON PROPPANT STATIC SETTLING VELOCITY 35
ABSTRACT 35
1 INTRODUCTION 37
2 PROPPANT STATIC SETTLING VELOCITY IN HYDRAULIC
FRACTURING 39
21 PARTICLE SHEAR RATE (ϔ) 40
22 APPARENT SHEAR VISCOSITY (μa) 40
23 WEISSENBERG NUMBER (Wi) 40
24 ELASTICITY TO VISCOSITY RATIO (λeυ) 41
25 FORCES INFLUENCED PARTICLES SETTLING VELOCITY 41
3 EXPERIMENT DESCRIPTION 42
31 MATERIALS 42
311 Hydraulic Fracturing Fluids 42
312 Preparing Fracturing Fluids 43
313 Proppant Sizes 43
314 Rheometer 43
32 SETTLING VELOCITY IN UNCONFINED FRACTURE SETUP 43
viii
33 RHEOLOGICAL CHARACTERIZATION OF THE HVFRS 44
331 Viscosity Profile Measurement 44
332 Elasticity Profile Measurement 44
333 Thermal Stability Measurement 44
334 Static Settling Velocity Measurement 44
4 RESULTS AND DISCUSSION 45
41 VISCOSITY MEASUREMENT RESULTS 45
42 ELASTICITY MEASUREMENT RESULTS 48
421 Normal Stress Measurements 50
43 THERMAL STABILITY MEASUREMENT RESULTS 52
44 SETTLING VELOCITY MEASUREMENT RESULTS 53
441 Qualitative Multi-Particle Static Settling Velocity 53
442 Quantitative Single Particle Static Settling Velocity 55
4421 Proppant size effect on static settling velocity55
4422 Effect of elasticity and viscosity properties on settling
velocity 56
5 COST ANALYSIS 60
6 CONCLUSIONS 61
REFERENCES 62
III STATIC PROPPANT SETTLING VELOCITY CHARACTERISTICS IN
HIGH-VISCOSITY FRICTION REDUCERS FLUIDS FOR UNCONFINED
AND CONFINED FRACTURES 65
ABSTRACT 65
1 INTRODUCTION 66
2 PROPPANT STATIC SETTLING VELOCITY 69
ix
21 WALL EFFECT (Fw) 69
22 PARTICLE SHEAR RATE (ϔ) 69
23 ELASTICITY TO VISCOSITY RATIO (λeυ) 70
24 FORCES INFLUENCED PARTICLES SETTLING VELOCITY 71
3 EXPERIMENT DESCRIPTION 72
31 MATERIALS 72
311 Hydraulic Fracturing Fluids 72
312 Preparing Fracturing Fluids 72
313 Proppant Sizes 72
314 Rheometer 72
32 EXPERIMENT SETUP 72
321 Unconfined Fracture Wall Experiments 72
322 Confined Fracture Wall Experiments 73
33 EXPERIMENT PROCEDURES 75
331 Viscosity Rheological Characterization of the HVFRs 75
3311 Viscosity profile measuremant 75
3312 Elasticity profile measurement 75
3313 Static settling velocity measurement 75
332 Static Settling Velocity Calculations Based on Power Law
Parameters (K n) 76
4 RESULTS AND DISCUSSION 77
41 VISCOSITY MEASUREMENT RESULTS 77
42 ELASTICITY MEASUREMENT RESULTS 78
43 SETTLING VELOCITY MEASUREMENT RESULTS 81
x
44 PROPPANT SETTLING VELOCITY PERFORMANCE IN
UNCONFINED FRACTURE WALL 81
45 PROPPANT SETTLING VELOCITY PERFORMANCE IN CONFINED
FRACTURE WALL 81
46 WALL EFFECT ON STATIC SETTLING VELOCITY 84
47 EFFECT OF VISCOSITY AND ELASTICITY OF HFVR ON PROPPANT
SETTLING VELOCITY 85
48 EFFECT OF ELASTICITY TO VISCOSITY RATIO (ΛEΥ) 87
5 COST ANALYSIS 88
REFERENCES 90
IV INVESTIGATE PROPPANT TRANSPORT WITH VARYING
PERFORATION DENSITY AND ITS IMPACT ON PROPPANT
DUNE DEVELOPMENT INSIDE HYDRAULIC FRACTURES 93
ABSTRACT 93
1 INTRODUCTION 94
2 EXPERIMENT DESCRIPTION 97
21 EXPERIMENT MATERIALS 97
22 FRACTURE MODEL SETUP 98
23 EXPERIMENT PROCEDURE 99
24 EXPERIMENT ANALYSIS APPROACHES 101
241 Equilibrium Dune Level (EDL) 101
242 Proppant Dune Level Development (PDLD) 101
243 Equilibrium Dune Length (EDX) 101
244 Pressure Losses Calculations 101
3 RESULTS AND ANALYSIS 102
31 NUMBER OF PERFORATION EFFECT 102
xi
32 PERFORATION OPENING SIZE EFFECT 105
33 SHEAR RATE EFFECT 107
34 FRACTURE ORIENTATION EFFECT 110
35 PROPPANT SIZE DISTRIBUTION EFFECT 113
4 DISCUSSION 116
41 EFFECT OF PRESSURE LOSS ALONG THE FRACTURE SLOT
ON PROPPANT TRANSPORT PERFORMANCE 116
42 MECHANISMS OF PROPPANT TRANSPORT 117
421 Stage 1 Hindered and Free Settling 117
422 Stage 2 Saltation 117
423 Stage 3 Suspension Rolling and Swirl at Inlet 118
424 Stage 4 Saltation Rolling and Swirl at Inlet 118
425 Thermal Stability Measurement 119
426 Static Settling Velocity Measurement 119
5 CONCLUSIONS 120
REFERENCES 121
V VISCOELASTIC CHARACTERIZATION EFFECT OF HIGH-
VISCOSITY FRICTION REDUCERS AND PROPPANT
TRANSPORT PERFORMANCE IN HIGH-TDS ENVIRONMENT 124
ABSTRACT 124
1 INTRODUCTION 125
11 PRODUCED WATER IN USA BASINS 130
2 EXPERIMENT DESCRIPTION 131
21 EXPERIMENT MATERIALS 131
211 Fracturing Fluids 131
xii
212 Frac Sand and Dosage 132
22 MEASUREMENTS OF RHEOLOGICAL PROPERTY 132
221 Friction Reducers Preparation for Rheological Property 132
222 Fracturing Fluid Viscosity Measurement 133
223 Elasticity Characterization (Elastic Modulus Grsquo) 133
224 Friction Reducers Preparation for Elasticity Property 133
225 Elastic Modulus Measurement 133
23 THE SETTLING RATE MEASUREMENT OF FRAC SAND IN HVFR
FRACTURING FLUID 134
231 HVFR Fracturing Fluid Preparation 134
232 Test Method on Frac Sand Settlement Rate 134
3 RESULTS AND ANALYSIS 134
31 THE VISCOSITY PROFILES OF VARIOUS FRICTION REDUCERS
IN DI WATER 2 WT KCL AND 10 LBS BRINE (SATURATED
NACL SOLUTION (TDS 347000 PPM)) 134
32 THE N AND K VALUES OF VARIOUS FRICTION REDUCERS
IN DI WATER 2 WT KCL AND 10 LBS BRINE (SATURATED
NACL SOLUTION (TDS 347000 PPM)) 137
33 THE ELASTIC MODULUS COMPARISON OF VARIOUS
FRICTION REDUCERS IN DI WATER AND 10 LBS BRINE
SOLUTION (TDS347000PPM) 137
34 PROPPANT SETTLING RATE RESULT 139
35 HVFR ELASTIC MODULUS CHARACTERISTICS BY
AMPLITUDE FREQUENCY FLUID TYPE AND TEMPERATURE 141
36 HVFR ELASTIC MODULUS PROFILES IN DI WATER amp 10 LBS
BRINE (TDS 347000 PPM) 143
37 HVFR ELASTIC MODULUS PROFILES BY TEMPERATURE 144
38 FIELD CASE STUDY 144
xiii
4 DISCUSSION THE POTENTIAL OF FORMATION DAMAGE 145
5 CONCLUSIONS 147
REFERENCES 148
VI A COMPREHENSIVE REVIEW OF FORMATION DAMAGE CAUSED
BY HIGH-VISCOSITY FRICTION REDUCERS WOLFCAMP CASE
STUDY 151
ABSTRACT 151
1 INTRODUCTION 152
2 FORMATION DAMAGE MECHANISMS 155
3 WHY HIGH VISCOSITY FRICTION REDUCERS 157
4 EXPERIMENTAL DESCRIPTION 158
41 EXPERIMENTAL MATERIALS 158
411 Experimental Materials 158
412 Proppant 158
5 MEASUREMENTS OF RHEOLOGICAL PROPERTY 160
51 SHEAR VISCOSITY CHARACTERIZATION (K N) 160
52 SHEAR ELASTICITY CHARACTERIZATION (ELASTIC
MODULUS Grsquo) 160
53 FRACTURE CONDUCTIVITY EXPERIMENT PROCEDURE 160
6 RESULTS AND ANALYSIS 161
61 RHEOLOGICAL CHARACTERIZATION OF THE HVFRS 161
611 Viscosity Profile Measurement 161
612 Elasticity Profile Measurment 162
xiv
62 CONDUCTIVITY AND PERMEABILITY MEASUREMENT
ON BASELINE 05 GPT AND 25 GPT 163
63 CASE STUDY WOLFCAMP FORMATION REEVES COUNTY TX 165
631 Geological Background 165
632 Fracture Design and Execution 165
7 CONCLUSIONS 167
REFERENCES 168
SECTION
3 CONCLUSIONS 172
REFERENCES 173
VITA 174
xv
LIST OF ILLUSTRATIONS
PAPER I Page
Figure 1 Visualization of proppant transport using friction reducer and high-viscosity
friction reducers 8
Figure 2 Friction reducers types 9
Figure 3 Chemical structure of various Friction Reduction (FR) agents and a
comparison of friction pressure for water containing only 2 KCl vs
water containing 2 KCl and 2 gallons per 1000 gallons (FR) and 10
Guar pumped down 4 frac12rdquo 115 4rdquo ID casing 11
Figure 4 Field case studies distribution of using HVFRs in North America 14
Figure 5 Box plots of temperature ranges of HVFRs in the lab measurements
and field application 15
Figure 6 Maximum loading of HVFRs applied in the field 15
Figure 7 Box plots of HVFR concentration ranges in the lab measurements and
field application 16
Figure 8 Box plots of concentration ranges of FR and HVFRs 16
Figure 9 Box plots of viscosity ranges of HVFRs at high shear rate 511 S-1 17
Figure 10 Box plots of viscosity ranges of HVFRs at low shear rate 70 S-1 18
Figure 11 Chemical cost reduction of using HVFRs from different case studies 27
Figure 12 Production improvement of using HVFRs from different case studies 28
Figure 13 Chemical cost comparison for standard Bakken system 29
PAPER II
Figure 1 Schematic of fracture setup for unconfined fluids 43
Figure 2 Effect of HVFR (left) and linear gel (right) concentrations as a function of
shear rate 46
Figure 3 Viscosity as a function of concentration of HVFRs (left) and linear gel
(right) at low shear rates 47
xvi
Figure 4 Elastic modulus and storage modulus as a function for HVFR-2 at
different concentration 49
Figure 5 Elastic modulus and storage modulus as a function of angular frequency
for linear gel at different concentrations 20ppt and 40ppt 50
Figure 6 Relaxation time as a function of concentration of HVFR-1 HVFR-2 and
HVFR-3 (left) and linear gel (right) 50
Figure 7 Effect of HVFR 2 concentration as a function in normal stress profile 51
Figure 8 Effect of HVFR 2 concentration as a function in normal stress profile 51
Figure 9 Thermal stability of viscosity as a function of shear rate of HVFR-2 (left)
and linear gel (right) 52
Figure 10 Thermal stability of viscosity as a function of shear rate of HVFR-2
(left) and linear gel (right) 53
Figure 11 Multi-static measurement for proppant settling time using HVFR-2 (2gpt)hellip54
Figure 12 Multi-static measurement for proppant settling time using HVFR-2 (4gpt)hellip55
Figure 13 Multi-static measurement for proppant settling time using liner gel (20 ppt)55
Figure 14 Effect of proppant settling velocity in HVFR-2 gpt vs linear gel-20 ppt
fracture fluids 56
Figure 15 Viscosity as a function of shear rate for HVFR-2 loading 2 gpt (left) and linear
gel loading 20 ppt (right) 57
Figure 16 Calculated elasticviscous ratio as a function of shear rate for HVFR-2
2 gpt and linear gel ndash 20 ppt 59
PAPER III
Figure 1 Schematic of fracture setup for unconfined fluids 73
Figure 2 Schematic of fracture setup for confined fluids 74
Figure 3 Schematic of the experimental fracture cell for measuring inclination
angle effect 75
Figure 4 Effect of HVFR-3 concentration as a function in viscosity shear profile 78
Figure 5 Elastic modulus Grsquo and storage modulus G`` as a function of HVFR-3
concentrations 79
xvii
Figure 6 Effect of HVFR 3 concentration as a function in Normal stress profile 80
Figure 7 Effect of proppant settling velocity in HVFR-3 gpt vs slickwater fracture
fluids 82
Figure 8 Settling velocity of HVFR vs slickwater in vertical fractures by 90 angle
vs inclined fractures angles 60 and 45 degree in confined fractures of
9 mm fracture width 83
Figure 9 Settling velocity reduction in slickwater versus HVFR-3 loading 2 in
different fracture orientation 84
Figure 10 Wall factors as a function of particle diameter to wall spacing in the
HVFR-3 loading 2 gpt 85
Figure 11 Viscosity as a function of shear rate for HVFR-3 loading 2gpt 86
Figure 12 Velocity ratio as a function of proppant diameter in HVFR-3 loading
2 gpt 87
Figure 13 Calculated elasticviscous ratio as a function of shear rate for HVFR-3
loading 2 gpt 88
PAPER IV
Figure 1 Schematic schematic of the experimental proppant transport evaluation
system 99
Figure 2 Effect of number of perforations at first FPV 103
Figure 3 Effect of number of perforations on EDL 104
Figure 4 Effect of number of perforations on fracture propped area 104
Figure 5 Real picture of experiment results shown number of perforation effect on
proppant transport top-perf (left) bottom-perf (middle) and
multi-perf (right) 104
Figure 6 Effect of perforation opening size at first FPV 105
Figure 7 Effect of perforation opening size on EDL 106
Figure 8 Real picture of experiment results shown perforation opening size effect
on proppant transport perf opening 100 (left) perf opening 60
(middle) and perf opening 40 (right) 106
Figure 9 Effect of fracture shear rate at first FPV 107
xviii
Figure 10 Real picture of experiment results shown shear rate effect on proppant
transport high shear rate (left) and low shear rate (right) 108
Figure 11 Effect of high (60s minus 1) and low (35s minus 1shear rates on EDL 109
Figure 12 Effect of shear rate on EDL 109
Figure 13 Effect of shear rate on on fracture propped area 110
Figure 14 Effect of fracture orientation (vertical vs inclined) at first FPV 111
Figure 15 Effect of fracture orientation (vertical vs inclined) on EDL 111
Figure 16 Effect of fracture orientation (vertical vs inclined) on fracture propped
area 112
Figure 17 Real picture of experiment results shown perforation opening size effect
on proppant transport inclined fracture (left) and vertical fracture (right) 113
Figure 18 Effect of proppant size at first FPV 114
Figure 19 Effect of proppant size on EDL 114
Figure 20 Effect of proppant size on on fracture propped area 115
Figure 21 Real picture of experiment results shown proppant size effect on proppant
transport 100 mesh (left) 4070 mesh (middle) and 2040 mesh (right) 115
Figure 22 a and b pressure loss along fracture slot on shear rate (left) and shear rate
effect on Fracture propped area (right) 116
PAPER V
Figure 1 The viscosity profile of various friction reducers in DI water 136
Figure 2 The viscosity profile of various friction reducers in 2wt KCl solution 136
Figure 3 The viscosity profile of various friction reducers in 10 lbs brine 136
Figure 4 Frac sand settling rate comparison with various HVFR dosage 140
Figure 5 The elastic modulus measurement of HVFR xanthan emulsion polymer
and guar at 75 150 and 250 in DI water (left) 10 lbs brine solution
(right) 141
xix
Figure 6 The elastic modulus characteristic of HVFR by amplitude and frequency
at room ambient 142
Figure 7The elastic modulus characteristic of HVFR by fluids (DI water vs
10 lbs brine) 143
Figure 8 The elastic modulus characteristic of HVFR by temperature 144
Figure 9 Hydraulic fracture treatment plot from Well-C using HVFRs 145
Figure 10 Conductivity and permeability on baseline 05 gpt and 25 gpt at
2000 psi and 24 hr 147
PAPER VI
Figure 1 Classification of the common formation damage mechanisms 156
Figure 2 HVFR viscosity profile with various dosage in fresh water 162
Figure 3 HVFR elastic property with various dosage in fresh water 163
Figure 4 Conductivity and permeability on baseline 05 gpt and 25 gpt by
pressure and time 164
Figure 5 Hydraulic fracture treatment plot from Well-H using HVFRs 166
Figure 6 HVFR dosage real time data 167
xx
LIST OF TABLES
PAPER I Page
Table 1 Summary of viscosity data of HVFRs reviewed in this paper 19
Table 2 High viscosity friction reducers concentration gpt 19
Table 3 Fracture conductivity data of HVFRs reported in this paper 21
Table 4 Breakability data of HVFRs summarized in this paper 22
Table 5 Chemical composition of produced water in Delaware basin 24
Table 6 Produced water TDS used with HVFRs 25
Table 7 Stimulation summary of case study 29
PAPER II
Table 1 Power law model equations and parameters (n k) for HVFRs and linear gel 47
Table 2 Weissenberg number calculation as a function of relaxation time and
particle shear rate 58
Table 3 ElasticViscous ratio 120582119890120592 calculations 59
Table 4 Stimulation summary of case study 60
PAPER III
Table 1 Power law model equations and parameters (n k) for HVFR-3 78
Table 2 Particles shear rate calculations for HVFR 86
Table 3 ElasticViscous ratio 120582119890120592 calculations 89
PAPER IV
Table 1 APIISO properties of the tested US silica white sand proppants 98
Table 2 List of experiments and parameters 100
Table 3 shows pressure losses effect at 1st FPV on EDL and Xf 117
xxi
Table 4 Four proppant transport mechanisms to reach the PDLD 119
PAPER V
Table 1 The molecular weight of friction reducers 132
Table 2 The n and K values with viscosities reading of friction reducers in
various fluids 138
Table 3 The effect of dosage of HVFRs on proppant settling rate 140
PAPER VI
Table 1 Fracture damage categories 156
Table 2 Proppant sieve analysis for baseline 159
Table 3 Proppant sieve analysis for 05 gpt 159
Table 4 Proppant sieve analysis for 25 gpt 159
Table 5 The regain percentage of 05 gpt and 25 gpt 165
xxii
NOMENCLATURE
Symbol Description
ϔ particle shear rate
η(ϔ) Shear viscosity
N1(ϔ) First normal stress
μa Apparent shear viscosity
Wi Weissenberg number
λ Relaxation time
λeυ Elasticity to viscosity ratio
ρp Particle density
ρf Fluid density
CD Drag coefficient
1
35
1 INTRODUCTION
Hydraulic fracturing is the most efficient and effective technique enabling greater
economic access for oil and gas production in unconventional shale gas plays Increasing
production and reserves from low-permeability hydrocarbon bearing rocks prerequisite
stimulation treatment is required to make the fracturing process successfully and
economically feasible Transport of proppant into fractures that either hydraulically created
or naturally existed should be fully understood Proppant transport is influenced by a
complex combination of parameters including particle size density fracture dimensions
base fluid rheological properties Different types of fluids are used to enable the transport
of proppant into the fractures An important characteristic of fracturing fluid is to be
compatible with reservoir fluids should be cost effective environmentally friendly and
cause less damage to formation and fracture conductivity
Most of the fluids encountered in the industrial applications tend to have both the
shear thinning and the viscoelastic properties A shear-thinning characteristic indicates that
the fluid viscosity decreases with the increasing shear rate A viscoelastic fluid
demonstrates both viscous and elastic behavior under deformation in hydraulic fracturing
for effective proppant transport and to avoid their premature settling hydraulic fracturing
fluids are advised to have viscoelasticity (Acharya 1988 Adrian 2005) Therefore
knowledge of the particle settling behavior and the particle settling velocity in viscoelastic
shear thinning fluids is indispensable to optimize the properties of these industrial fluids
Essentially fluid selection and proppant placement play the main key in the hydraulic
fracturing process (Ba Geri et al 2019 Ellafi et al 2019)
2
Several types of farcing fluids have been applied including the use of slickwater
linear gel crosslinked in the USA basins The success of a fluid selection process depends
primarily on the length of the fracture and proppant distribution and placement in fracks
Thus understanding fluid composition ability to create fractures the capability to carry
and transport proppant deep into the fracture easy to flow back with minimal damage effect
through production from shale formation is the key a crucial successful fracking treatment
Even though slickwater (water fracturing with few chemical additives) used to be
one of the most common fracturing fluids several concerns are still associated with its use
including usage of freshwater high-cost operation and environmental issues Therefore
current practice in hydraulic fracturing is to use alternative fluid systems that are cost
effective and have a less environmental impact such as fluids which utilize high viscosity
friction reducers (HVFRs) which typically are high molecular weight polyacrylamides
Moreover the recent and rapid success of using HVFRs in hydraulic fracturing treatments
is due to several advantages over other fracture fluids (eg linear gel) which include better
proppant carrying capability induce more complex fracture system network with higher
fracture length and overall lower costs due to fewer chemicals and less equipment on
location
3
2 RESEARCH OBJECTIVES
The ultimate goal of this project is to expand the horizon of understanding proppant
transport using different fracture fluids in particular HVFRs in complex fracture system
Our new fracture model will be capable of achieving that goal The new fracture model can
be used to evaluate the impact of fracture geometry half-length injection pump rate
proppant type size amp shape proppant concentration fluids viscosity fluids elasticity leak-
off number of perforations natural fracture angles particle settling velocity fracture wall
roughness width heterogeneity and proppant distribution in the complex fracture network
on the transport of the proppant through fractures using different fracture fluids The
specific objectives of this research therefore include
bull To provide a better understanding of the advanced technologies of using high
viscosity friction reducer including the capability of carrying proppant in hydraulic
fracturing treatments The goal also is to statistically analyze the main associated
factors with HVFR such as concentration temperature viscosity and breakability
bull This project investigated several major factors affect proppant settling velocity
including viscosity measurement profiles elasticity properties (Normal forces and
relaxation time) and thermal stability profile
bull In addition this work conducted laboratory work intensively to fill the knowledge
gap This study investigated three factors that could affect proppant settling velocity
performance proppant size wall effect and fracture orientation
4
bull This study was deeply investigated five factors that affect proppant transport
performance number of perforations perforation opening size slurry shear rate
fracture orientation and proppant size distribution
bull This work will provide a comprehensive study of the effects of elasticity and shear
viscosity on proppant settling velocity using HVFRs and linear gel in fresh water
and produced water
bull A proper fracture lab slot will be upscaling to evaluate proppant transport
performance using HVFRs to the field implementations
5
PAPER
I A CRITICAL REVIEW OF HIGH-VISCOSITY FRICTION REDUCERS
APPLICATIONS AS AN ALTERNATIVE HUDRAULIC FRACTRUING
FLUIDS SYSTEM
Mohammed Ba Geri Abdulmohsin Imqam and Ralph Flori
Deparment of Petroleum Engineering Missouri University of Science and Technology
Rolla MO 65409
ABSTRACT
The primary purpose of using traditional friction reducers in stimulation treatments
is to overcome the tubular drag while pumping at high flow rates Hydraulic fracturing is
the main technology used to produce hydrocarbon from extremely low permeability rock
Even though slickwater (water fracturing with few chemical additives) used to be one of
the most common fracturing fluids several concerns are still associated with its use
including usage of freshwater high-cost operation and environmental issues Therefore
current practice in hydraulic fracturing is to use alternative fluid systems that are cost
effective and have less environmental impact such as fluids that utilize high-viscosity
friction reducers (HVFRs) which typically are polyacrylamides with high molecular
weight
This paper carefully reviews and summarizes over 40 published papers including
experimental work field case studies and simulation work This work summarizes the
most recent improvements of using HVFRs including the capability of carrying proppant
6
reducing water and chemical requirements compatibility with produced water and
environmental benefits in hydraulic fracturing treatments A further goal is to gain insight
into the effective design of HVFR-based fluid systems
The findings of this study are analyzed from over 26 field case studies of many
unconventional reservoirs In comparing HVFRs to the traditional hydraulic fracture fluids
system the paper summaries many potential advantages offered by HVFR fluids including
superior proppant transport capability almost 100 retained conductivity cost reduction
50 reduction in chemical use by less operating equipment on location 30 less water
consumption and fewer environmental concerns The study also reported that the common
HVFR concentration used was 4 gpt HVFRs were used in the field at temperature ranges
from 120 to 340 Finally this work addresses up-to-date challenges and emphasizes
necessities for using HVFRs as alternative fracture fluids
1 INTRODUCTION
Hydraulic fracturing has been successfully implemented since its inception in 1947
To achieve commercial production from ultra-low permeability formation development in
fracturing fluids is the key factor for stimulation operations Although a variety of
fracturing fluids have been used to increase the productivity of unconventional reservoirs
low viscous (slickwater) and high viscous (crosslinkers linear gel) fluids still have some
problems in terms of lower capability to carry proppant creating formation damage high-
cost operation and environmental concerns
7
In recent years the oil industry has adopted the use of high-viscosity friction
reducers (HVFRrsquos) in fracturing fluids due to several operational and economic reasons
(Hu et al 2018 Van Domelen et al 2017 Motiee et al 2016) Friction reducers are mostly
long-chain polyacrylamide-based (PAM) polymers Usually friction reducers are added to
water-based fracturing fluids to hydrate ldquoon the flyrdquo as water in oil emulsions (Wu et al
2013 Tomson et al 2017) Most water-soluble polymeric friction reducers have high
molecular weight (normally over 10 M) polymers Sun et al (2011) The primary function
of friction reducers is to change turbulent flow to laminar flow by reducing frictional loss
by 70-80 while pumping fracturing fluids (Tomson et al 2017 Sun et al 2011 White
and Mungal 2008)
Both academic research and industrial implementation have demonstrated the
success of friction reducers within and outside the oil industry Aften et al (2014) Because
of the ability of friction reducers to flocculate solids in liquid phase PAM polymers have
been used extensively in water treatment In the oil and gas industry PAM has primarily
been used in a variety of applications including enhanced oil recovery (EOR) acid gelling
agents clay control during drilling and hydraulic fracturing These applications require
flexibility and simplicity of PAMs stability under harsh conditions such as high reservoir
temperatures and high salinity waters (Ryles et al 1986 StimLab 2012 Clark et al 1976)
Research continues developing improved hydraulic fracturing fluids to lessen the
problems associated with current fracturing fluids like guar-based gels and slickwater
Slickwater fracturing fluids have low concentrations of friction reducers falling between
05 and 2 gallons per thousand gallon (gpt) (Rodvelt et al 2015 Ifejika et al 2017) HVFR
fluids can replace slickwater by minimizing proppant pack damage and can carry the same
8
amount of proppant as linear gel or better with less formation damage (Ba Geri et al
2019b Kunshin et al 2018) Figure 1 shows that HVFRs can have better proppant transport
capability along fractures compared to slickwater with friction reducer additives
Figure 1 Visualization of proppant transport using friction reducer and high-viscosity
friction reducers (slbcombroadband)
The objectives of this critical review study are to provide better understanding of
the advanced technologies of using high-viscosity friction reducers including capability of
carrying proppant reducing water and chemical requirements compatibility with produced
water and environmental benefits in hydraulic fracturing treatments The goal also is to
statistically analyze the main associated factors with HVFRs such as concentration
temperature viscosity and breakability
9
2 DESCRIPTION OF FRICTION REDUCERS AND HIGH-VISCOUS
FRICTION REDUCERS
Friction reducers are typically long-chain polyacrylamides (PAM) in dry powder
and liquid forms that can be added in the concentration range from 05 to 2 gpt to water to
make slickwater PAMs for unconventional reservoirs can be classified into three main
categories (see Figure 2) anionic nonionic and cationic Hashmi et al (2014) They may
also be classified as hydrophobic and amphoteric Tomson et al (2017) An anionic nature
for most friction reducers is obtained from 30 mole acrylic acid co-polymers The
maximum reduction of friction reducers can be obtained by dissolving the polymer into
aqueous solution to become fully inverted before injected as fracturing fluid Friction
reducers have high dissolvability level in water a high viscosity and sufficient energy loss
reduction
Figure 2 Friction reducers types
The most common friction reducer is anionic due to its lower cost and better drag
reduction Chung et al (2014) Water salinity and quality are the two main factors that
determine the effectiveness of friction reducers Drag reduction of friction reducers rely on
their backbone flexibility and radius of gyration (molecular size) Drag reduction decreases
by increasing the molecular weight or size In freshwater the friction reducers have large
10
radius of gyration which increases in the friction reducers performance The same amount
of friction reducers in produced water has small gyration radius so increased FR
concentration is needed to attain the same drag reduction level in high TDS water (Chung
et al 2014 Rimassa et al 2009 Shah et al 2018) Lastly less friction reduction can be
provided by uncharged (non-ionic) friction reducers than charged ones (Ozuruigbo et al
2014 Chung et al 2014)
Using polymers in oil field applications has evolved and expanded from acid
gelling agents drilling operations and EOR applications to fracturing fluid systems that
are carefully designed to have optimum characteristics To achieve these characteristics
different chemical structure forms have been developed to fit the designed purpose of each
case In addition the chemistry of the water that is used in hydraulic fracturing
treatmentsmdashand particularly its salinitymdashare two main factors considered during friction
reducer selection As presented in Figure 3 the most prevalent friction reducers used in the
oil and gas industry are polyacrylamide- (PAM-) based polymers acrylamido-methyl-
propane sulfonate polymer (AMPS) polyacrylic acid (PAAc) and hydrolyzed
polyacrylamide (PHPA) Montgomery (2013) Their structural forms are as shown in
Figure 3
There are also many forms of the friction reducer that can be delivered to the field
application The most popular forms are the liquid inverse emulsion and dried In addition
to these polymers other types of friction reducers are viscoelastic surfactants dispersion
polymers fibers metal complexed surfactants and various microscopic structures Aften
et al (2014)
11
The inclusion of a friction reducer is one of the main components of slickwater
fracture fluids and other stimulation fluids The primary function of friction reducers is
changing turbulent flow to laminar flow which can reduce frictional loss during pumping
fracturing fluids up to 80 Recently high-viscosity friction reducers (HVFRs) have
gaining popularity as drilling and hydraulic fracturing fluids because the HVFRs exhibit
numerous advantages such as the following
Figure 3 Chemical structure of various friction reduction (FR) agents and
a comparison of friction pressure for water containing only 2 KCl vs water containing
2 KCl and 2 gallons per 1000 gallons (FR) and 10 Guar pumped down 4 frac12rdquo 115 4rdquo
ID casing (Montgomery 2013)
bull Reduced pipe friction during fracturing treatments
bull High regain conductivities compared to linear and crosslinked gels
bull Lower operational cost
o Uses less water compared to conventional slickwater treatments
o Consumes 33-48 less chemicals
o Requires less equipment on location
o Requires less number of tanks trucks in the field
bull More fracture complexity using a less viscous fluid system
bull Better hydrocarbon production results compare to or greater than other fluids
12
bull Improved flexibility to design treatments that balance technical economic and
operational goals
bull Reduced freshwater proppant and equipment requirements compared with
conventional fluid systems
bull Minimized environmental footprint with selection of engineered additives
bull Simplified operations by reduced screen out risks
In order to make a successful hydraulic fracturing treatment the fracking fluid
selection process is a significant step in these ultra-low permeability reservoirs The
ultimate purpose of the fracturing fluid is to induce a complex network fracture system and
to have the capability of carrying proper amount of proppant deeply into the fractures
Essentially fluid selection and proppant placement are key to the hydraulic fracturing
process The ultimate success of the fluid selection process depends primarily on the length
of the fracture achieved and proppant distribution and placement in fracks Thus
understanding fluid properties and performance such as its composition ability to create
fractures ability to carry and transport proppant deep into the fracture and ease to flowback
with minimal damage through production from shale formations is the key to a crucial
successful fracking fluid and treatment Ideally the HVFRs should have the following
physical characterization to achieve the ultimate performance as fracturing fluids (Sareen
et al 2014 Ke et al 2006 Carman et al 2007 Aften et al 2010)
1 The polymer should have good dispersion or solubility in various aqueous
phases
2 Compatible with other fracturing fluids additives eg clay stabilizer
3 Should be less shear sensitive
13
4 Quick to hydrate in fluid ldquoon-the-flyrdquo
5 Compatible with high TDS and hardness
6 Easy to break and clean up
7 Good thermal stability and
8 Low environmental impact
3 LABORATORY AND FIELD STUDIES USING HVFR
This work analyzes data collected from more than 26 field case studies that
implemented High-viscosity friction reducers in unconventional reservoirs For example
in the Permian basin four different case studies were applied using HVFR successfully
which represent 16 of case study distribution of using HVFRs in North America The
main findings of each case are highlighted in Figure 4
31 DATA ANALYSIS OF USING HVFRS AT FIELD AND LAB CONDITIONS
Figure 5 shows the temperature ranges for lab and field conditions HVFRrsquos were
tested at minimum temperatures of 70 in the lab and 140 at field conditions The
reported data also showed that HVFRrsquos were tested at maximum temperature of 180 in
the lab and 335 in field studies
Figure 6 shows the HVFR concentration range used in hydraulic fracture treatment
in different US basins (Van Domelen et al 2017 Hu et al 2018) The collected data show
that HVFR concentration ranged were from 25 gpt to 35 gpt
14
Figure 4 Field case studies distribution of using HVFRs in North America
Figure 7 reports the concentration distributions of HVFRs in lab evaluation and
field application The lab test covers a wide HVFR concentration ranges from 1gpt to
10gpt while the field applications have an HVFR concentration range between 05 gpt and
4 gpt
32 FRICTION REDUCER AS ADDITIVES VS AS A HVFR FRACTURE FLUID
Figure 8 presents the low concentrations of friction reducers used only as fluid
additives versus their higher concentration used as a key ingredient in HVFR-based
fracture fluids Friction reducers as an additive cover a small range from 05 gpt to 2 gpt
while as HVFRs covered a large range from 1 gpt to 10 gpt
Figure 9 reveals the viscosity ranges of HVFR fluids at high shear rate (511119904minus1)
corresponding to various concentrations of HVFR in the fluids HVFRrsquos at 8 gpt can have
viscosities as high as 54 cp whereas at low concentrations such as 2gpt of HVFR the
typical viscosity ranges were from 7 to 15 cp
15
Figure 5 Box plots of temperature ranges of HVFRs in the lab measurements and field
application
Figure 6 Maximum loading of HVFRs applied in the field
Figure 10 illustrates the viscosity ranges of HVFR fluids at low shear rate (70 s-1)
corresponding to various concentrations of HVFR in the fluids Since the shear rate inside
the fractures is between 100119904minus1 and 10119904minus1 the selected viscosity profile for data analysis
was at 70119904minus1 Ba Geri et al (2019a)
0
05
1
15
2
25
3
35
4
STACKAnadarko
Basin
within the
Meramec
Eagle Ford
Fayette County
TX
Haynesville
HV
FR
Lo
ad
ing
g
pt
Field name
16
Figure 7 Box plots of HVFR concentration ranges in the lab measurements and field
application
Figure 8 Box plots of concentration ranges of FR and HVFRs
The rapid increase in viscosity as shear rate decreases helps in carrying proppant
farther through the fractures For example the window range of 4 gpt HVFRs for the
viscosity was from 20 cp to 80 cp
17
Figure 9 Box plots of viscosity ranges of HVFRs at high shear rate 511 119904minus1
Table 1 summarizes the extracted viscosity data of HVFRs The viscosity profile
of HVFRs depends on many factors including polymer concentration shear rate time
solvent properties and temperature Aften et al (2014) Increasing temperature from 70
to 180 decreases the viscosity from 40 cp to 30 cp Motiee et al (2016) Decreasing
HVFR concentration from 8 gpt to 2 gpt can reduce the viscosity by 75 (from 40 cp to
10 cp at the same shear rate and temperature conditions) Kunshin et al (2018) A thermal
study of high concentration 8 gpt of HVFRs was studied by Ba Geri et al (2019) The study
observed that increase HFVR temperature from 77 to 176 decreased the HVFR
viscosity profile from 33 cp to 13 cp respectively
18
Figure 10 Box plots of viscosity ranges of HVFRs at low shear rate 70 119904minus1
33 SCREENING CRITERIA GUIDELINES FOR HVFRS
Table 2 provides screening guidelines for HVFRs in terms of fluid concentration
and viscosity The range of each property used in the lab measurements and field
application is reported for more successful treatment The concentration of HVFRs is a
significant parameter for the selection process The maximum concentration of HVFRs
was 10 gpt and 4 gpt in the laboratory and field application respectively Several factors
control the concentration selection such as water source high TDS and formation damage
so in the field trials 4 gpt was the maximum In addition the temperature effect was also
investigated in this paper The maximum temperature was 180 and 335 in laboratory
and field application respectively Increasing the temperature lowered the HVFR viscosity
profile due to the thermal degradation of the fluid
19
Table 1 Summary of viscosity data of HVFRs reviewed in this paper
Measurement Conditions
HVFRs Concentration
(gpt)
Temperature
[]
Shear Rate
(119904119890119888minus1)
Viscosity
(cp) Reference
HCFR 10 70 511 40 Motiee et al 2016
HCFR 2 70 511 7 Motiee et al 2016
HCFR 6 70 150 40 Motiee et al 2016
HCFR 6 180 150 30 Motiee et al 2016
HVFR 45 NA 511 165 Hu et al 2018
HVFR 225 NA 511 102 Dahlgren et al 2018
HVFR 4 200 50 17 Dahlgren et al 2018
HVFR 2 200 50 5 Dahlgren et al 2018
HVFR 8 70 511 40 Kunshin et al 2018
HVFR 2 70 511 10 Kunshin et al 2018
HVFR 8 77 511 33 Ba Geri et al 2019b
HVFR 8 176 511 13 Ba Geri et al 2019b
Table 2 High viscosity friction reducers concentration gpt
Minimum Maximum Mean Median Standard Deviation
Laboratory 1 10 436 4 225
Field 05 4 263 275 087
High Viscosity Friction Reducers Temperature
Minimum Maximum Mean Median Standard Deviation
Laboratory 70 180 1267 135 275
Field 140 335 2393 158 487
4 CONDUCTIVITY PROFILE
Achieving high fracture conductivity is a primary goal of hydraulic fracturing
treatment because these conductive channels enable flow of oil and gas from the formation
20
to the wellbore Many factors influence the fracture conductivity such as proppant size and
type fracture closure stress and fracturing fluid type HVFR fracturing fluids are rapidly
gaining in popularity because of their numerous advantages Table 3 summarizes the
regained conductivity using HVFR fracture fluids Motiee et al (2016) used high
concentrations of friction reducers (HCFR) of 14 gpt They conducted conductivity
experiments under high temperature system 220degF for 25 hours and concluded that using
14gpt of HCFR gives 72 of regained conductivity while by adding 1ppt of breaker the
regained conductivity increased up to 80
Moreover Van Domelen et al (2017) evaluated the viscosity-building friction
reducers experimentally and in the field application The experiment conditions were 2
lbsqft 3050 sand at 180 degF using 1gpt of breaker The study presented that the regained
permeability was 96 at time zero then the regained permeability increased to 93 and
106 by increasing test time from 24 hours to 50 hours Huang et al (2018) presented an
engineered low-polymer-loading non-cross-linked (ELN) fluid A conductivity test was
performed using carbonate core and sandstone core under closure pressure 1800 psi at
250 Promising results concluded that 89 and 91 regained permeability was observed
for sandstone and carbonate core respectively
5 BREAKABILITY PROFILE
Currently HVFRs as a completion fluid have been successfully used in
unconventional formations However some concerns remain of the potential formation
damage that might occur by using these high molecular weight polyacrylamide-based
21
fluids Therefore to address these concerns different types of breaker system are required
to eliminate or minimize the possible damage to fracturing treatment (Kern 1962 Brannon
and Ault 1991 Economides and Nolte 2000)
Table 3 Fracture conductivity data of HVFRs reported in this paper
HVFRs
Type
Concentration
(gpt)
Breaker
(gpt)
Closure
Stress
(psi)
Shut-
in
Time
(hrs)
Temperature
[]
Regained
Conductivity
() Reference
HCFR 14 NB 2000
25 220
72 Motiee et al
2016
HCFR 14 1 2000 25 220 80
VFR 3 1 2000
24 180
93 Van Domelen et
al 2017
VFR 3 1 2000 50 180 106
ELN NA NA 1800
NA 250
91 Huang et al
2018
Degradation of polyacrylamide can occur biologically and chemically Various
types of breakers such as oxidative breakers are commonly used to break the polymers and
reduce their viscosity The chemical reaction of the breaker is controlled by several factors
such as breaker dosage temperature and composition of the fluid breaker chemistry
polymer concentration and pH Table 4 summarizes the work that has been performed for
evaluating the breakability profile after using HVFR fracture fluids Stim-Lab (2012)
investigated using high loading (14 gpt) of HVFRs with and without breaker on retained
conductivity compared to linear gel 30 ppt At the same lab conditions temperature 220
closure pressure 2000 psi and test time 25 hours retained conductivity present was 72
22
without breaker while with using 1 ppt of ammonium persulfate the retained conductivity
increased up to 80
Table 4 Breakability data of HVFRs summarized in this paper
Breaker
Type
Concentration
(gpt) FR
Breaker
(ppt)
Time
(hrs) Temperature
[]
Breaker
Released
()
Reference
AP 14 1 25 220 80 Stim-Lab2012
NA 3 1 24 180 93 Van Domelen et
al 2017
Ammonium
Persulfate 3 1 2 180 33 Sun et al 2010
Live
oxidizer 3 01 2 180 83 Sun et al 2010
Live
oxidizer 3 05 2 180 92 Sun et al 2010
Van Domelen et al (2017) conducted a conductivity test to compare the crosslinked
and Viscous FR (VFR) with 1ppt breaker The measurements were performed at the same
conditions of temperature 180 and 2lbsq of 3050 of proppant After 24 hours of testing
the regained conductivity was 33 and 93 of 15 lbMgal crosslinked and 3 gpt of VFR
correspondingly Sun et al (2010) studied breaker behavior on viscous slickwater in
unconventional reservoirs Adding 1ppt of encapsulated oxidizer breaker to 8 gpt HVFR
at 180 for 2 hours began break down viscosity profile After two hours the viscosity
decreases from 120 cp to 80 cp at shear rate 40 119904minus1 At the same experiment conditions
they tried to use another breaker live oxidizer breaker with different concentration 01 ppt
and 05 ppt The viscosity profile of 8 gpt HVFR rapidly dropped out from 120 cp to 20 cp
when the 01 of live oxidizer breaker was used They also compared solid residue from 20
ppt of linear gel and from 40 gpt HVFR at 150 for two hours The observation of the test
was that HVFR had only little residue while liner gel had a large amount of residue
23
6 PRODUCED WATER WITH HVFRS
Slickwater fracture fluid has been proven as one of the best fracture fluids in terms
of high fracture length and low cost However government regulations have increased due
to large amounts of water consumption in hydraulic fracturing techniques to increase the
productivity of shale rocks According to the US Environmental Protection Agency (EPA)
the hydraulic fracturing operations require between 70 and 140 billion gallons of water
annually in the United States alone (API 2017) Therefore using produced water instead
of fresh water is gaining traction to minimize water usage reduce environmental impacts
and increase hydrocarbon recovery from unconventional formations However generally
polymer friction reducers perform more poorly in high salinity waters High salinity
produced waters are more common in the Marcellus and the Bakken basins with high TDS
ranging fro7m 30000 to 50000ppm and over 225000 mgl respectively Almuntashri
(2014) noted that produced water contains solid suspension and bacteria these bacteria
generate enzymes that degrade the polymer viscosity significantly
Sareen et al (2014) developed a friction reducer (Table 5) compatible with high-
salinity produced water used with slickwater in hydraulic fracturing treatments The case
study in Delaware basin reported that the friction reducer was compatible with produced
water containing over 250000 ppm TDS and 90000 ppm total hardness The maximum
concentration of friction reducer was 15 gpt and the bottomhole temperature was 136
The application was implemented in 17-stages with significant 40 reduction on the
amount of proppant increasing the oil production by 50 and 20increase of gas
production compared to conventional friction reducer
24
Table 5 Chemical composition of produced water in Delaware basin (Sareen et al 2014)
Specific gravity 12 pH 602
Temperature 70
Cations ppm Anions ppm
Sodium 73978 Chloride 149750
Calcium 12313 Sulfates 250
Soluble Iron (Fe) 10 Bicarbonates 61
Magnesium 4992
Total Hardness 51781 ppm (CaCO3)
Total Dissolved Solids 241354 ppm
Calcium Carbonate Index 1083360
Calcium Sulfate Index 4440000
Table 6 summarizes the work that has been performed to evaluate using produced
water with HVFRs Sareen et al (2014) presented an experimental study on HFVRs in
fresh water and salt water with HVFR varying from 1 to 6 gpt A variety of HVFR systems
were tested including both anionic and cationic HVFRs with surfactants They examined
their viscosity profile and settling velocity measurements The study concluded that
surfactant and polymer type systems play a key role in the viscosity-shear rate profile
Sanders et al (2016) presented field trials using dry friction reducer (DFR) in the
Fayetteville shale with produced water having approximately 10000 ppm TDS The DFR
provided a better placement of proppant and has more advantages compared to gel-based
systems in terms of environmental effect and logistical costs Johnson et al (2018) reported
successful case studies implemented in Marcellus and Bakken shale using high-brine
viscosity-building friction reducer (HBVB) in high brine produced water The TDS in
Marcellus formation was in the range of 30000 to 50000 ppm Lab measurements were
performed to HBVB at shear rate 50 119904minus1 The viscosity profile of HBVB loading 5 gpt at
50 119904minus1 was 45 cp and decreased to 12 cp in fresh water and produced water
25
correspondingly In Marcellus shale HBVB is used in the field to replace guar-based
systems HBVB has better performance results in lab measurements and field applications
Moreover seven different types of friction reducers were selected to apply in the Bakken
field in North Dakota six of them did not work well because they were not compatible
with the produced water The seventh one was successfully used with loading from 15 gpt
to 36 gpt HBVB Six stages of that well were treated by HBVB product with effective
carrying proppant concentration up to 3 ppa
To conclude utilizing produced water for hydraulic fracturing in the oil and gas
industry is gaining popularity because using produced water leads to operational cost
savings and has environmental benefits However compatibility of the friction reducers
with the various types of produced water requires different test protocols
Table 6 Produced water TDS used with HVFRs
HVFRs
Loading
(gpt)
Temperature
()
Produced
water TDS
(ppm)
Produced
water total
hardness
(ppm)
Findings References
15 136 240000 50000
50 oil production
increase 40 less
proppant
Sareen et al
2014
075 175 10000 NA Better placement of
proppant
Sanders et al
2016
358 NA 50000 NA Significant cost
reduction
Johnson et al
2018
26
7 ECONOMIC ANALYSIS
Several successful field case studies were adopted using HVFRs as an alternative
for conventional hydraulic fracturing fluids They addressed clearly the main concern of
the HVFR systems which is its capability to carry a sufficient amount of proppant with
less formation damage Hu et al (2018) In 2012 Stim-Lab performed an extensive
investigation about regained conductivity using high concentration (14 gpt) of HVFRs
compared to 30 ppt linear gel fluid Superior results from the evaluation test shows that 14
gpt can regain conductivity up to 80 Dahlgren et al (2018) reported economics cost
evolution in the STACK play using three case studies In cases 1 and 2 the fracturing fluid
system was changed from a hybrid system to HVFR with max proppant concentration of 5
ppg Moreover in Case 3 HVFR was used for around 32 stages with successful chemical
cost reduction about 38 Due to the fast hydration process and fewer chemicals used the
chemical cost savings that used on case 1 2 and 3 were 32 33 and 38 respectively
Figure 11 presents the chemical cost reduction of using HVFRs during hydraulic fracturing
applications In the Utica plays the cost reduction reached almost 80 compared with
previous hydraulic fluids
Furthermore using HVFRs provided promising results in production
improvements as shown in Figure 12 The Eagle Ford Haynesville and Utica reported
over 60 improvement in hydrocarbon production while around 30 increasing in oil
production occurred in the STACK play
27
Figure 11 Chemical cost reduction of using HVFRs from different case studies
Dahlgren et al (2018) showed case studies of using HVFRs in the STACK play
Interestingly one of these two compared wells completed identically in fracturing design
Well 1 was treated with hybrid guar-based fluid system consisting of 18 linear gel and
18 crosslinked Well 2 used HVFR starting with 5 gpt and end up the fracture treatment
by 3 gpt of HVFR All the other parameters were the same in both stimulation process in
Well 1 and Well 2 as shown in Table 8 The field results showed over 30 improvement
in production and 32 reduction of chemical cost in Well 2 where HVFR was used
compared to using guar-based fluids in Well 1
Using fewer chemicals during hydraulic fracturing treatment improves well
economics Motiee et al (2016) present a case study about the operational cost reduction
using HVFRrsquos compared to crosslinked fluid systems
0102030405060708090
100
Co
st r
ed
uct
ion
Field or basin name
28
Figure 12 Production improvement of using HVFRs from different case studies
The data results reported that the average reduction ranged from 33 to 48 of the
chemical volume used in fracturing treatment as well as 22 average reduction on fluid
cost as shown in Figure 13
Another logistic of cost reduction is the fracturing fluids material themselves
Earthstone Energy Inc reported several case studies replacing crosslinked or hybrid
system with HVFRs where the average completion cost was reduced by 35 and the
charge in pump pressure decreased by 17 Since the characterization nature of HVFRs
has rapid solubility on water HVFRs hydrate quickly ldquoon-the-flyrdquo Therefore hydration
unit is not required in the field which helps to save cost as well Van Domelen et al (2017)
0102030405060708090
100
Pro
du
ctio
n I
mp
rov
men
t
Field or basin name
29
Table 7 Stimulation summary of case study (Dahlgren et al 2018)
SW
MBL
HVFR
MBL
18
LIN
MBL
18 XL
MBL
TOTAL
FLUID MBL
100
MESH
MM
4070
MM
TOTAL
PROP MM
Well 1 243 0 21 41 3054 47 76 123
Well 2 251 56 0 0 3073 47 76 123
Figure 13 Chemical cost comparison for standard Bakken system (Motiee et al 2016)
8 CONCLUSIONS
This study provides a comprehensive review on using high viscous friction reducers
as a potential alternative for conventional fracture fluid Potential advantages of using
HVFRs over other fracture fluids were discussed Results for laboratory and successful
field studies that used HVFR were also analyzed and presented The following conclusions
can be drawn from this work
30
bull Screening criteria for using HVFRs were presented to understand the optimum
selection of HVFRs HVFR concentration and temperature are the main factors that
influence the viscosity profile of HVFRs The median used of these factors in the
field application was 275 gpt and 158 for the HVFR concentration and
temperature respectively
bull Successful field case studies and lab measurements discussed the use of HVFRs as
an alternative fracturing fluid system to the conventional fracturing fluids (eg
linear gel system)
bull Numerous advantages of using HVFRs are reported including the ability of carrying
proppant less formation damage and reduction in chemical cost and water usage
bull High viscous friction reducers using produced water showed promising results but
more investigation with different produced water composition is still required
bull High viscous friction reducers showed improvement on the hydrocarbon
production in many filed case studies reaching over 70 improvement
REFERENCES
Aften C W (2010 January 1) Study of Friction Reducers For Recycled Stimulation
Fluids In Environmentally Sensitive Regions Society of Petroleum Engineers
httpsdoi102118138984-MS
Aften C W (2014 October 21) Friction Reducers Fresh Rheological Insights Married to
Performance Society of Petroleum Engineers httpsdoi102118171025-MS
Al-Khaldy M D Dutta A Goswami B Al-Rashidi` A Rondon L J Warrakey M
amp Abdel Samie M A (2014 November 10) First-Ever Level 4 Multilateral Well
in North Kuwait Successfully Completed Improves Oil Production Society of
Petroleum Engineers httpsdoi102118171792-MS
31
Al-Muntasheri G A (2014 April 17) A Critical Review of Hydraulic Fracturing Fluids
over the Last Decade Society of Petroleum Engineers httpsdoi102118169552-
MS
API A P (nd) Energy and Opportunity Retrieved April 10 2017 from
httpwwwhydraulicfracturingcomsection=energy-and-opportunity
Ba Geri M Imqam A amp Suhail M (2019a March 19) Investigate Proppant Transport
with Varying Perforation Density and Its Impact on Proppant Dune Development
Inside Hydraulic Fractures Society of Petroleum Engineers httpsdoi102118
195018-MS
Ba Geri M Imqam A Bogdan A Shen L (2019b April 9) Investigate the Rheological
Behavior of High Viscosity Friction Reducer Fracture Fluid and Its impact on
Proppant Static Settling Velocity Society of Petroleum Engineers
httpsdoi102118195227-MS
Brannon H D amp Ault M G (1991 January 1) New Delayed Borate-Crosslinked Fluid
Provides Improved Fracture Conductivity in High-Temperature Applications
Carman P S amp Cawiezel K (2007 January 1) Successful Breaker Optimization for
Polyacrylamide Friction Reducers Used in Slickwater Fracturing Society of
Petroleum Engineers httpsdoi102118106162-MS
Castro-Vera E Chuc E A Gutierrez L amp Sanchez A (2015 October 26)
Implementation of Low-Residue Polysaccharide Fracturing Fluid System Aids
Flowback Recovery at Chicontepec Basin Field Experiences on Sandstone Tight-
Oil Wells Society of Petroleum Engineers httpsdoi102118176722-MS
Chung H C Hu T Ye X amp Maxey J E (2014 October 27) A Friction Reducer Self-
Cleaning to Enhance Conductivity for Hydraulic Fracturing Society of Petroleum
Engineers httpsdoi102118170602-MS
Clark R K Scheuerman R F Rath H amp Van Laar H G (1976 June 1)
PolyacrylamidePotassium-Chloride Mud for Drilling Water-Sensitive Shales
Society of Petroleum Engineers httpsdoi1021185514-PA
Cooke C E (1975 October 1) Effect of Fracturing Fluids on Fracture Conductivity
Society of Petroleum Engineers httpsdoi1021185114-PA
Dahlgren K Green B Williams B Inscore J Domelen M V amp Fenton A (2018
January 23) Case Studies of High Viscosity Friction Reducers HVFR in the
STACK Play Society of Petroleum Engineers httpsdoi102118189893-MS
32
Economides MJ and Nolte KG 2000 Reservoir Stimulation Third Edition John Wiley
amp Sons
Hashmi G Kabir C S amp Hasan A R (2014 October 27) Interpretation of Cleanup
Data in Gas-Well Testing From Derived Rates Society of Petroleum Engineers
httpsdoi102118170603-MS
httpswwwslbcom-mediaFilesstimulationengineered-fracturing-fluidspdf
Hu Y T Fisher D Kurian P amp Calaway R (2018 January 23) Proppant Transport
by a High Viscosity Friction Reducer Society of Petroleum Engineers
httpsdoi102118189841-MS
Huang J Perez O Huang T Safari R amp Fragachan F E (2018 October 16) Using
Engineered Low Viscosity Fluid in Hydraulic Fracturing to Enhance Proppant
Placement Society of Petroleum Engineers httpsdoi102118191395-18IHFT-
MS
Ifejika E De Cumont B amp Kashani N (2017 January 24) Optimum Production
Metrics to Predict Unconventional Wellamp39s Long-term Performance Society
of Petroleum Engineers httpsdoi102118184817-MS
Johnson M Winkler A Aften C Sullivan P Hill W A amp VanGilder C (2018
October 5) Successful Implementation of High Viscosity Friction Reducer in
Marcellus Shale Stimulation Society of Petroleum Engineers
httpsdoi102118191774-18ERM-MS
Ke M Qu Q Stevens R F Bracksieck N E Price C R amp Copeland D L (2006
January 1) Evaluation of Friction Reducers for High-Density Brines and Their
Application in Coiled Tubing at High Temperatures Society of Petroleum
Engineers httpsdoi102118103037-MS
Kern LR 1962 Method and Composition for Formation Fracturing US Patent No 3
058 909
Kunshin A amp Dvoynikov M (2018 October 15) Design and Process Engineering of
Slotted Liner Running in Extended Reach Drilling Wells Society of Petroleum
Engineers httpsdoi102118191520-18RPTC-MS
Li L Saini R amp Mai N (2018 September 24) High-TDS Produced Water-Based Low-
Damaging Fracturing Fluids for Applications at 300degF or Higher Society of
Petroleum Engineers httpsdoi102118191749-MS
33
Li L Sun H Qu Q Le H V Ault M Zhou J hellip Smith D (2014 October 27)
High-Temperature Fracturing Fluids Prepared with Extremely High-TDS and Hard
Produced Water Society of Petroleum Engineers httpsdoi102118170607-MS
Montgomery C (2013 May 20) Fracturing FluidltbrgtComponents International Society
for Rock Mechanics and Rock Engineering
Motiee M Johnson M Ward B Gradl C McKimmy M amp Meeheib J (2016
February 1) High Concentration Polyacrylamide-Based Friction Reducer Used as
a Direct Substitute for Guar-Based Borate Crosslinked Fluid in Fracturing
Operations Society of Petroleum Engineers httpsdoi102118179154-MS
Ozuruigbo C Q amp Fan C (2014 September 30) Influence of Friction Reducer on Scale
Inhibitor Performance and Scaling Tendency in Slickwater Fracturing Society of
Petroleum Engineers httpsdoi102118171661-MS
Rimassa S M Howard P amp Arnold M O (2009 January 1) Are You Buying Too
Much Friction Reducer Because of Your Biocide Society of Petroleum Engineers
httpsdoi102118119569-MS
Reddy B R (2013 April 8) Laboratory Characterization of Gel Filter Cake and
Development of Non-Oxidizing Gel Breakers for Zirconium Crosslinked
Fracturing Fluids Society of Petroleum Engineers httpsdoi102118164116-MS
Rodvelt G Yuyi S amp VanGilder C (2015 October 13) Use of a Salt-Tolerant Friction
Reducer Improves Production in Utica Completions Society of Petroleum
Engineers httpsdoi102118177296-MS
Sanders M Felling K Thomson S Wright S amp Thorpe R (2016 February 1) Dry
Polyacrylamide Friction Reducer Not Just for Slick Water Society of Petroleum
Engineers httpsdoi102118179146-MS
Sareen A Zhou M J Zaghmoot I Cruz C Sun H Qu Q amp Li L (2014 December
10) Successful Slickwater Fracturing in Ultrahigh TDS Produced Water by Novel
Environmentally Preferred Friction Reducer International Petroleum Technology
Conference httpsdoi102523IPTC-17824-MS
Shah S Asadi M Wheeler R Brannon H Kakadjian S Ainley B hellip Archacki D
(2018 February 7) Methodology for Evaluating Drag Reduction Characteristics of
Friction Reducer Society of Petroleum Engineers httpsdoi102118189537-MS
STIM-LAB Proppant Consortium Report July 2012 Section 31 Friction Reducers used
in Slickwater Applications
34
Sun H Wood B Stevens R F Cutler J Qu Q amp Lu M (2011 January 1) A
Nondamaging Friction Reducer for Slickwater Frac Applications Society of
Petroleum Engineers httpsdoi102118139480-MS
Sun H Wood B Stevens R F Cutler J Qu Q amp Lu M (2011 January 1) A
Nondamaging Friction Reducer for Slickwater Frac Applications Society of
Petroleum Engineers httpsdoi102118139480-MS
Sun H Stevens R F Cutler J L Wood B Wheeler R S amp Qu Q (2010 January
1) A Novel Nondamaging Friction Reducer Development and Successful
Slickwater Frac Applications Society of Petroleum Engineers httpsdoi102118136806-MS
Tomson R C Guraieb P Graham S Yan C Ghorbani N Hanna T amp Cooper C
(2017 January 24) Development of a Universal Ranking for Friction Reducer
Performance Society of Petroleum Engineers httpsdoi102118184815-MS
Van Domelen M Cutrer W Collins S amp Ruegamer M (2017 March 27)
Applications of Viscosity-Building Friction Reducers as Fracturing Fluids Society
of Petroleum Engineers httpsdoi102118185084-MS
White C M and Mungal M G 2008 Mechanics and Prediction of Turbulent Drag
Reduction with Polymers Ann Rev Fluid Mech 40235-256
Wu Q Ma Y Sun Y amp Bai B (2013 March 23) The Flow Behavior of Friction
Reducer in Microchannels During Slickwater Fracturing Society of Petroleum
Engineers httpsdoi102118164476-MS
35
35
II INVESTIGATE THE RHEOLOGICAL BEHAVIOR OF HIGH VISCOSITY
FRICTION REDUCER FRACTURE FLUID AND ITS IMPACT ON
PROPPANT STATIC SETTLING VELOCITY
Mohammed Ba Geri1 Abdulmohsin Imqam1 Andrey Bogdan2 and Lingjuan Shen2
1 Deparment of Petroleum Engineering Missouri University of Science and Technology
Rolla MO 65409
2 BJ Services Tomball TX
ABSTRACT
The recent and rapid success of using high viscosity friction reducers (HVFRs) in
hydraulic fracturing treatments is due to several advantages over other fracture fluids (eg
linear gel) which include better proppant carrying capability induce more complex
fracture system network with higher fracture length and overall lower costs due to fewer
chemicals and less equipment on location However some concerns remain like how
HVFRs rheological properties can have impact on proppant transport into fractures The
objective of this study is to provide a comprehensive understanding of the influence the
rheological characterization of HVFRs have on proppant static settling velocity within
hydraulic fracturing process
To address these concerns comprehensive rheological tests including viscosity
profile elasticity profile and thermal stability were conducted for both HVFR and linear
gel In the steady shear-viscosity measurement viscosity behavior versus a wide range of
shear rates was studied Moreover the influence of elasticity was examined by performing
oscillatory-shear tests over the range of frequencies Normal stress was the other elasticity
36
factor examined to evaluate elastic properties Also the Weissenberg number was
calculated to determine the elastic to viscous forces Lastly quantitative and qualitative
measurements were carried out to study proppant settling velocity in the fluids made from
HVFRs and linear gel
The results of rheological measurement reveal that a lower concentration of HVFR-
2 loading at 2gpt has approximately more than 8 times the viscosity of linear gel loading
at 20ppt Elastic measurement exposes that generally HVFRs have a much higher
relaxation time compared to linear gel Interestingly the normal stress N1 of HVFR-2 2gpt
was over 3 times that of linear gel loading 20ppt This could conclude that linear gel
fracture fluids have weak elastic characterization compared to HVFR The results also
concluded that at 80 Co linear gel has a weak thermal stability while HVFR-2 loses its
properties only slightly with increasing temperature HVFR-2 showed better proppant
settling velocity relative to guar-based fluids The reduction on proppant settling velocity
exceed 75 when HVFR-2 loading at 2gpt was used compared to 20ppt of linear gel Even
though much work was performed to understand the proppant settling velocity not much
experimental work has investigated the HVFR behavior on the static proppant settling
velocity measurements This paper will provide a better understanding of the distinct
changes of the mechanical characterization on the HVFRs which could be used as guidance
for fracture engineers to design and select better high viscous friction reducers
37
1 INTRODUCTION
Over the last few recent years high viscosity friction reducers (HVFRs) have been
successfully used in the oil and gas industry across all premier shale plays in North America
including Permian Bakken and Eagle Ford (Van Domenlen et al 2017 Dahlgren et al
2018) Besides reducing friction HVFRs have also been used to suspend and carry
proppants farther into the fracturersquos networks Very recently the popularity of using
HVFRs in frac fluid has increased
A friction reducer is the main component of slick water fracture fluids and
stimulation technology packages The primary function of friction reducers is changing
turbulent flow to laminar flow by reducing friction by 70-80 while pumping fracturing
fluids (Schein 2005) Recently the oil industry started to use high viscosity friction
reducers (HVFRs) as a direct replacement for linear and crosslinked gels due to several
operational and economic reasons (Motiee et al 2016) High viscosity friction reducers
(HVFRs) have been used as fracturing fluids because of the advantages such as reducing
pipe friction during the fracturing process the high potential of placing more proppant
volumes compared to conventional hydraulic fluids system such as hybrid and crosslinked
creating complex fracture networks due to a less viscous system possible higher fracture
conductivity improved production results comparable as using liner gel or crosslinked
designs potentially lower costs due to fewer chemicals and less equipment on location
less environmental footprint and simplified hydraulic fracturing treatments by minimizing
screen out risks (Motiee et al 2016 Van Domenlen et al 2017 Dahlgren et al 2018 Ba
Geri et al 2019)
38
Both academic research and oil industrial implementation have shown promising
results of using high viscosity friction reducers Motiee et al 2016 studied high
concentration friction reducers (HCFR) as a direct substitute for guar-based crosslinked
fluid Different concentration of HCFR (2 4 6 and 8 gpt) were compared with 25 ppt
linear gel to study proppant settling velocity HCFR showed better proppant settling
velocity relative to guar-based fluids The results also concluded that at 180 25 ppt linear
gel has a weak thermal stability while HCFR only slight loses its properties Shen et al
2018 investigated rheological characterization of HVFRs and measured the settling
velocity of multi-particle proppant The results concluded that both the viscosity and
elasticity of HVFRs can affect the proppant carrying capacity during hydraulic fracturing
treatments
Hu et al 2018 addressed some concerns related to proppant transport capability
using HVFRs and linear gel Viscosity and elasticity measurements were examined to
compare HVFRs with linear gel They observed that at low shear rates HVFRs had higher
viscosity Also normal forces for linear gels are much lower than HVFRs with increased
shear rate Dahlgren et al 2018 identified three case studies in which STACK play replaced
traditional fracturing fluid with HVFR Viscosity-shear measurements were performed at
2 3 and 4 gpt HVFRs concentration with and without a breaker The study noticed that
the viscosity profile was negatively affected by breaker
Johnson et al 2018 presented a successful implementation of high brine friction
reducers (HBFRs) in high TDS water exceeding 60000TDS They observed that the
viscosity of HBFRs decreased with increased brines ranges Drylie et al 2018 conducted
viscosity measurements at a high shear rate of 511119904minus1and a low shear rate 001 119904minus1 for 1
39
and 6 gpt of HVFR and 24 ppt of guar The study noticed that at 1gpt of HVFR there was
no change in viscosity profile in contrast at a low shear rate HVFRs have a much higher
viscosity than guar Most pervious work investigated the rheological characterization of
HFVRs in low temperature conditions and did not consider that changes in rheological that
could happen at high pressure environment In addition there was not serious effort to
relate the effect of HVFR rheology on proppant settling velocity
This work presents a comprehensive investigation performed to compare linear gel
fracturing fluids with high viscosity friction reducers This paper investigated several major
factors including viscosity measurement profiles elasticity properties (Normal forces and
relaxation time) thermal stability profile and static settling velocities The question which
is the key factor the shear-viscosity or the elasticity of HVFRS governing the settling
velocity were also investigated by performing qualitative and quantitative of settling
velocity measurements of multi-particles and single particle proppant
2 PROPPANT STATIC SETTLING VELOCITY IN HYDRAULIC
FRACTURING
This study provides insights on the elastic and viscous properties of HVFR and
liner gel fluids Weissenberg number and elasticity to viscosity ratio are calculated to
measure the elastic properties of the fluids and to identify which rheological properties has
significant contribution to the proppant settling velocity (Broadbent and Mena 1974
Acharya et al 1981 Malhotra and Sharma 2012)
40
21 PARTICLE SHEAR RATE (ϔ)
Calculating apparent particle shear rate leads to overestimate or underestimate the
particle shear rate therefore determining the particle shear rate range within the Power
law model (K n) is an essential step to describe the shear thinning effect of the HVFRs
and linear gel fluids Equation 1 can be used to estimate the particle shear rate (Uhlherr et
al 1976 Shah et al 2007)
ϔ = 2 lowast 119881119904119889119901 (1)
where ϔ is the particle shear rate 119881119904 is the terminal settling velocity 119889119901 is the particle
diameter
22 APPARENT SHEAR VISCOSITY (120525119834)
Lali et al 1989 introduced Equation 2 to estimate the apparent shear viscosity
120583119886 = 119870ϔ119899minus1 (2)
where μ_a is the apparent shear viscosity K is the Consistency indexn is the flow
behavior index
23 WEISSENBERG NUMBER (119830119842)
To study viscoelastic fluid properties and fluid deformation degree Weissenberg
number should be measured Weissenberg dimensionless number can be defined as
follows
Wi =Elastic forces
Viscous forces= λ ϔ (3)
where Wi is the Weissenberg number λ is the relaxation time ϔ is the particle shear rate
41
24 ELASTICITY TO VISCOSITY RATIO (120524119838120534)
Viscoelastic fluids consist of two main properties (viscosity and elasticity) To
evaluate which property gives the greatest contribution during proppant transport Equation
4 was used to measure the elasticity to viscosity ratio (120582119890120592) (Shen et al 2018)
120582119890120592 =051205911198731(ϔ)
120578(ϔ) (4)
where λeυ is the elasticity to viscosity ratio 1198731(ϔ) is the first normal stress 120591 is
relaxation time and 120578(ϔ) is the shear viscosity
The numerator consists of the elasticity portion (relaxation time 120591 and first normal
stress 1198731(ϔ)) and the denominator is a function of only the viscosity profile (120578(ϔ)) The
elasticviscous ratio demonstrated by elasticity once their value more than one while if the
elasticviscous ratio less than one that indicates is the viscosity play main role during
proppant transport
25 FORCES INFLUENCED PARTICLES SETTLING VELOCITY
In a Newtonian fluid settling velocity of single particle can be calculated from the
Stokes model which is usually referred as Stokes Equation 7 in the creeping flow regime
(119877119890119901 lt 1) Because the settling velocity is a function of Reynolds number and drag forces
itrsquos important to calculate all parameters related to the settling velocity Khan and
Richardson 1987 Several studies developed theoretical expressions tha can used to
calculate drage coefficient Renaud et al (2004) and of Tripathi et al (1994) The most
common correlation was derived by Stokes which can be used to calculate settling velocity
(Vs) are shown in Equation 5 ndash 7 (Arnipally 2018)
42
119877119890119901 lt 1 (creeping flow regime)
119877119890119901 =119863119901119881119904120588119891
120583119891 (5)
119862119863 =24
119877119890119901 (6)
119881119904 =(120588119904minus120588119891)119892119863119904
2
18120583119891 (7)
Three main forces dominate the vertical motion of solid particles in a fluid gravitational
force FG buoyancy force FB and drag force FD (Arnipally 2018)
119865119892 = 120588119901119907119901119892 (8)
119907119901 = 12058711988911990136 (9)
119865119887 = 120588119907119901119892 (10)
119865119863 = 1198621198631198601205881198911198812
2 (11)
where 120588119901 is the particle density 119907119901 is the volume of the particle 120588119891 is the fluid density 119889119901
is the particle diameter g is the acceleration due to gravity (981 m119904minus2) 119862119863 is the drag
coefficient A is the projected area and V is the settling velocity
3 EXPERIMENT DESCRIPTION
31 MATERIALS
311 Hydraulic Fracturing Fluids Two fracture fluid samples were used in this
study 1) HVFRs with different compositions (HVFR-1 HVFR-2 HVFR-3) 2) linear gel
(GW-3d) All fracture fluid samples were provided by BJ Services Company
43
312 Preparing Fracturing Fluids According to standard industry practice for
using HVFRs four different concentrations 1 2 4 8 gallons per thousand gallons (gpt) of
each sample were mixed with deionized (DI) water Linear gel (GW-3d) fluid was tested
with three different concentrations 10 20 40 pounds per thousand gallons (ppt)
313 Proppant Sizes Proppant US silica sand size of 3060 mesh and glass bead
sizes of 2 4 and 6mm were used to measure terminal settling velocity in HVFRs
314 Rheometer A high accuracy advanced rheometer with a parallel-plate
system was used to measure viscosity-shear profile normal forces and the dynamic
oscillatory-shear measurements at lab and high temperature ranges
32 SETTLING VELOCITY IN UNCONFINED FRACTURE SETUP
Figure 1 shows the setup of an unconfined settling velocity measurement The
experiment was performed in a 1000 ml transparent graduated glass cylinder with a
diameter at least 25 times the proppant diameter to ensure proppant settling velocity was
not influenced by the walls of the glass container In addition alongside the glass container
a foot ruler was placed to measure the fluid level inside the model as shown in the setup
Figure 1 Schematic of fracture setup for unconfined fluids
44
33 RHEOLOGICAL CHARACTERIZATION OF THE HVFRS
331 Viscosity Profile Measurement Two different rheological tests were
performed including steady shear-viscosity and time dependency using an advanced
rheometer with a parallel-plate system (PP50TG using a 030 mm gap) To investigate the
viscous behavior tests were implemented under varying shear rate from 01-1000 119904minus1 with
measurements at 21 pointdecade
332 Elasticity Profile Measurement The dynamic oscillatory-shear
measurements were conducted to measure the elasticity profile characterizations and first
normal stress N1 The oscillatory test was implemented over a range of frequencies from
001-100Hz All rheological properties measurements were conducted at lab and high
temperature ranges
333 Thermal Stability Measurement The influence of temperature during
fracturing operations has not been fully understood in shale oil reservoirs This paper
investigated the effect of thermal stability of rheology characterizations of HVFRs which
tends to alter parameters such as time dependency fluid elasticity viscosity and first
normal stress To better mimic the real fracturing process the experiments were performed
under elevated temperatures by using an advanced rheometer Viscosity-shear profile
measurements for three different temperatures of 77 122 176 have been conducted
for both HVFRs and linear gel fracture fluids
334 Static Settling Velocity Measurement At this point the graduated cylinder
is filled with HVFR and the cell is positioned vertically To measure proppant settling
velocity in unconfined fluids high-resolution video camera is used to record the settling
process In this setup proppant diameter ranged from 0453 mm to 6 mm A single proppant
45
was dropped in the HVFR and allowed to settle A high-resolution video camera has been
used to capture the process of free proppant settling An image analysis tool called
ldquoTrackerrdquo ( httpwwwcabrilloedu~dbrowntracker) was applied to get accurate
measurements of vertical position of the proppant at different time steps (Ba Geri et al
2018) The slope of relationship between proppant vertical positions to steps time step is
called terminal settling velocity For more accurate results settling velocity of each particle
were repeated three times
4 RESULTS AND DISCUSSION
41 VISCOSITY MEASUREMENT RESULTS
In Figure 2 a viscosity measurement profile is presented In order to understand
the HVFRs characterizations three different HVFRs fracture fluids with a wide range of
concentrations (1 2 4 8gpt) along with several linear gel concentrations (10 20 40ppt)
were measured using an advanced rheometer at 25 in a wide range of shear rates from
01 to 1000 119904minus1 All the results exhibit that the HVFRs fluids follow a shear thinning
behavior that as shear rate increases the viscosity decreases At a loading of 8gpt results
for HVFR-2 showed that HVFRs have high viscosity (20000cp) at a lower shear rate of
01 119904minus1 compared to HVFR-1 and HVFR-3 with 9000cp and 10000cp respectively
Linear gel with a loading of 40ppt at the same low shear rate of 01 119904minus1 showed a much
lower viscosity of around 1200 cp
46
Figure 2 Effect of HVFR (left) and linear gel (right) concentrations as a function of
shear rate
Table 1 shows the Power law model equations fitting for all HVFRs and linear gel
samples at different concentrations The Power law model is clearly best fit of the
experiments results of HVFRs and linear gel fluids whereas the R-square values of the
equation are close to the unit The results also observed that by increasing HVFRs or linear
gel concentration the K and n values increased
Figure 3 shows that HVFR-2 has highest viscosity profile at a low shear rate of 01
119904minus1 For instance at a loading of 8 gpt HVFR-2 had a viscosity of almost 23000 cp
which is around double the viscosity of HVFR 1 amp 3 at the same loading Moreover
HVFR-2 loading 2 has higher viscosity profile up to 2670cp while linear gel loading 20ppt
has less viscosity around 311cp which represent almost 9 time increasing in viscosity
profile of HVFR-2 loading 2gpt
To conclude HVFRs have higher viscosity profile along all the shear rate ranges
compared to linear gel HVFR-2 viscosity increased substantially from 176 cp to 22724
cp as the concentration increased from 1gpt to 8gpt however linear gels have much lower
1
10
100
1000
10000
01 1 10 100 1000
Vis
cosi
ty cp
Shear Rate 1s
Linear Gel
40ppt
20ppt
10ppt
1
10
100
1000
10000
100000
01 1 10 100 1000
Vis
cosi
ty cp
Shear Rate 1s
HVFR-2
8 gpt
4 gpt
2 gpt
1 gpt
47
viscosity ranges and their viscosity could increase from 39 cp to 1242 cp as the
concentration increased from 10 ppt to 40 ppt
Table 1 Power law model equations and parameters (n k) for HVFRs and linear gel
HVFR Concentration gpt
Fluid Name 1 2 4 8
HVFR-1 120583 = 18603120574minus056 120583 = 37898120574minus059 120583 = 96933120574minus064 120583 = 263425120574minus069
R-square 09996 09997 09998 09997
HVFR-2 120583 = 19287120574minus070 120583 = 55264120574minus073 120583 = 147163120574minus078 120583 = 447822120574minus082
R-square 09994 09996 09997 09998
HVFR-3 120583 = 6152120574minus043 120583 = 195120574minus0540 120583 = 60708120574minus063 120583 = 181535120574minus069
R-square 09984 09987 09992 09994
Linear Gel Concentration ppt
Fluid name 10 20 40
Linear Gel 120583 = 1144120574minus010 120583 = 17298120574minus038 120583 = 116322120574minus048
R-square 09786 09955 09830
Figure 3 Viscosity as a function of concentration of HVFRs (left) and Linear gel (right)
at low shear rates
0
5000
10000
15000
20000
25000
1 2 3 4 5 6 7 8 9
Vis
cosi
ty
cp
Concentration gpt
Shear Rate 01 (1s)
HVFR-1
HVFR-2
HVFR-3
0
200
400
600
800
1000
1200
1400
0 5 10 15 20 25 30 35 40
Vis
cosi
ty
cp
Concentration ppt
Shear Rate 01 (1s)
Linear Gel
48
42 ELASTICITY MEASUREMENT RESULTS
The time associated with changing the structure of the polymer fluids is the
relaxation time τ and it can be used to quantify the elasticity of the fluid Since the HVFRs
have a high molecular weight understanding the elasticity is very important To evaluate
the viscoelastic characterizations of HVFRs a small amplitude oscillatory shear test was
carried out in the fluid solutionrsquos linear viscoelastic regime using an advanced rheometer
with a parallel-plate system Storage moduli (Grsquo) represents elastic responses and loss
moduli (Grdquo) represents viscous responses Relaxation time is referred to as the inverse of
the cross over point (t = 1ω) where Grsquo is equal to Grdquo The longer relaxation time of the
fluid means has more elastic properties while the shorter relaxation time means the fluid
carrys less elastic properties Figure 4 shows the Grsquo and Grdquo of HVFR as a function angular
frequency All HVFR-2 concentrations were showing a good elastic property with high
relaxation time ranges The relaxation time increased with increasing the concentrations of
HVFR
In contrast Figure 5 shows the storage modulus and loss modulus as a function of
angular frequency for linear gel with very low elastic properties At higher concentration
of linear gel 40ppt the elastic properties are much lower around 01 sec Therefore the
linear gel might depend only on viscous properties to carry and place the proppant during
hydraulic fracturing treatment
Figure 6 showed the relaxation time was increased by increasing the fracturing fluid
concentration for both fluids In HVFR2 concentration of 4 gpt has a relaxation time of
approximately 17 second and it increased to 37 second at 8 gpt The results show that
HVFR-2 has a better elastic property than HVFR-1 and HVFR-3 Also at similar
49
equivalent loading concentrations results indicated that HVFRs have better elastic
properties compare to liner gel Even though concentration of linear gel increased to 40
ppt it still has a very small relaxation time with around 01s
Figure 4 Elastic modulus and storage modulus ` as a function for HVFR-2 at different
concentration
It could be concluded that for all tested fluid samples HVFRs fluid system have
higher elastic properties than linear gel fluid system Despite increasing the concentration
of linear gel to 40 ppt it still is showing very low elastic properties
50
Figure 5 Elastic modulus and storage modulus as a function of angular frequency for
linear gel at different concentrations 20ppt and 40ppt
Figure 6 Relaxation time as a function of concentration of HVFR-1 HVFR-2 and
HVFR-3 (left) and linear gel (right)
421 Normal Stress Measurements Normal stress is another significant elastic
property which can be measured by Rheometer as a function of shear rate Figure 7 shows
the normal stress (N1) as a function of shear rate of HVFR-2 at different loading At low
shear rates (from 01 to 10 119904minus1) the normal stress was very low whereas increasing the
shear rate above 10 119904minus1 showed an increase in normal stress Normal stress was increased
00001
0001
001
01
1
10
Sto
rag
e M
od
ulu
s G
[
Pa
]
Lo
ss M
od
ulu
s G
[Pa
]
Angular Frequancy [rads]
G - 40ppt
G - 40ppt
G -20ppt
G - 20ppt
0
002
004
006
008
01
012
0 10 20 30 40
Rel
ax
ati
on
Tim
e s
Concentration ppt
Linear Gel
0
5
10
15
20
25
30
35
40
1 3 5 7
Rel
ax
ati
on
Tim
e s
Concentration gpt
HVFR-1
HVFR-2
HVFR-3
51
substantially as the HVFR concentration increase For example at 1000119904minus1 the normal
stress was 20 Pa and 285 Pa for 1gpt and 8gpt respectively This result is consistent with
the elastic range trend measured previously by the relaxation time
Figure 7 Effect of HVFR 2 concentration as a function in normal stress profile
In Figure 8 although a high concentration of linear gel (40ppt) has been selected to
examine the first normal stress N1 at high shear rate 1000119904minus1 the N1 was only 50 Pa
This elasticity is however still much less than HVFRs with a concentration of 4 gpt
Figure 8 Effect of HVFR 2 concentration as a function in normal stress profile
0
50
100
150
200
250
300
01 1 10 100 1000
Norm
al
Str
ess
(N1
) P
a
Shear Rate 1s
8gpt
4gpt
2gpt
1gpt
0
10
20
30
40
50
60
01 1 10 100 1000
Norm
al
Str
ess
N1
Shear Rate 1s
40ppt
20 ppt
10ppt
52
43 THERMAL STABILITY MEASUREMENT RESULTS
Figure 9 shows the rheological measurements for both HVFR-2 and linear gel at
temperature ranges of 25 Co 50 Co and 80 Co Results reveal that polyacrylamide-based
HVFs systems have better thermal stability than linear gel at different shear rate ranges
Increased temperature to 50 Co did not show any change in viscosity profile but when
temperature increased to 80 Co little bit changes occurred However linear gel loses
significantly its viscous properties with increasing shear rate when temperature increased
to 80 Co For example at shear rate of 1 s-1 the viscosity of linear gel dropped from 1000
cp to 100 cp as the temperature increased from 25 Co to 80 Co
Figure 9 Thermal stability of viscosity as a function of shear rate of HVFR-2 (left) and
linear gel (right)
Figure 10 shows the elastic effect (first normal stress N1) loses its properties with
increasing temperature for both fracture fluids but more significant for linear gel At high
shear rate of 1000 S-1 normal stress for HVFR decreased from 340 Pa to 230 Pa and 70 Pa
1
10
100
1000
10000
01 1 10 100 1000
Vis
cosi
ty cp
Shear Rate 1s
40 ppt - T=25C
40 ppt - T=50C
40 ppt - T=80C
1
10
100
1000
10000
100000
01 1 10 100 1000
Vis
cosi
ty c
p
(Shear Rate 1sec)
HVFR-2 8gpt - T = 25 CHVFR-2 8gpt - T = 50 CHVFR-2 8gpt - T = 80 C
53
as temperature increased from 25 Co to 50 Co and 80 Co respectively However at same
shear rate normal stress for linear gel dropped significantly from 50 Pa to 10 Pa and 5 Pa
within the same of temperature ranges
Figure 10 Thermal stability of viscosity as a function of shear rate of HVFR-2 (left) and
linear gel (right)
44 SETTLING VELOCITY MEASUREMENT RESULTS
Several factors can control the proppant transport in complex fracture system
including proppant type proppant size fracture geometry and fracture fluid characteristics
including viscosity and elasticity This section is showing how the rheological and elastic
properties of HVFR and linear gel could affect the proppant settling velocity
441 Qualitative Multi-Particle Static Settling Velocity To qualify the settling
velocity of multi-particles two different loadings (2 and 4gpt) of HVFR-2 and a loading
of linear gel (20ppt) were hydrated in DI and mixed well with proppant concentration of 2
ppa The mixture was poured immediately into a 100 ml graduated cylinder A time lapse
0
10
20
30
40
50
60
01 1 10 100 1000
Norm
al
Forc
es
Pa
Shear Rate 1s
40 ppt - T=25C40 ppt - T=50C40 ppt - T=80C
0
50
100
150
200
250
300
350
400
01 1 10 100 1000
Norm
al
Forc
es
P
a
Shear Rate (1sec)
HVFR-2 8gpt - T = 25 C
HVFR-2 8gpt - T = 50 C
HVFR-2 8gpt - T = 80 C
54
camera was set up to capture the settling rate for certain time All multi-particle static
settling time have been measured in the lab conditions
Figure 11 shows at a low load of HVFR-2 (2gpt) most of the proppant took 10
minutes to settle with few proppants were still suspended in the fluid However as it shown
in Figure 12 as the concentration of HVFR increased to 4gpt a longer settling time (60
minute) was observed with more proppant still suspended at fluid Proppant settling time
in linear gel was significantly less than both concentrations of HVFR as it is shown in
Figure 13 In linear gel loading of 20ppt the proppant was settled completely at 15 seconds
with very few proppants still suspended in the fluid The settling rate in linear gel (20ppt)
was almost 40 times higher than HVFR-2 (2gpt) this might occur because HVFR-2 has
higher viscous and elastic properties than the linear gel fluid
Figure 11 Multi-static measurement for proppant settling time using HVFR-2 (2gpt)
55
Figure 12 Multi-static measurement for proppant settling time using HVFR-2 (4gpt)
Figure 13 Multi-static measurement for proppant settling time using linear gel (20 ppt)
442 Quantitative Single Particle Static Settling Velocity
4421 Proppant size effect on static settling velocity Single particle static
velocity measurements were performed in unconfined conditions using a HVFR-2 loading
2gpt and linear gel loading 20ppt at an ambient temperature Three different glass beads
sizes of 2 mm 4 mm and 6 mm were selected to study the effect of proppant sizes on
56
different fracture fluids Figure 11 shows the terminal static settling velocity calculations
for both fluids Result clearly indicated that for all proppant sizes proppant had higher
settling velocities when it placed inside the linear gel compared to HVFR For example
settling velocity of proppant size of 4 mm was 5 cmsec for HVFR and increased
significantly to 20 cmsec for linear gel These results indicate that HVFR could have better
proppant suspension capability than linear gel Results also indicated that increasing
particle sizes increases the proppant settling velocity
Figure 14 Effect of proppant settling velocity in HVFR-2 gpt vs linear gel-20 ppt
fracture fluids
4422 Effect of elasticity and viscosity properties on settling velocity Figure
12 presented steady a shear rate-viscosity measurement profile as a function of shear rate
for HVFR-2 loading of 2 gpt and linear gel loading of 20 ppt The power law model (k n)
is fitted only for the shear rate ranges at which proppant shear rate results obtained from
Figure 11 (ranges from 62 to 98 119904minus1 )
0
5
10
15
20
25
30
35
40
45
0 1 2 3 4 5 6 7 8
Ter
min
al
Set
tlin
g V
elo
city
cm
sec
Particle Diameter mm
LG 20 2mm LG-20 4mm LG-20 6mm
HVFR-2 2mm HVFR-2 4mm HVFR-2 6mm
57
Figure 15 Viscosity as a function of shear rate for HVFR-2 loading 2 gpt (left)
and linear gel loading 20 ppt (right)
To illustrate the particle settling behavior profile the Weissenberg number is
measured since it can be used to evaluate elasticity measurements Table 2 presents the
result of calculating the Weissenberg number as a function of experimental settling velocity
measurement for different elastic property (λ=14 and 003) and approximately similar
viscosity profile shear rate ranges The results obtained from Weissenberg number was
much higher in HVFR compared to linear gel This implies that elastic properties might
have significant effect on settling velocity compared with viscosity properties but this
trend still needs further study because both fracture fluids did not have a very similar
viscosity profile
The Elasticity to Viscosity Ratio (λeυ) equation was also used to help in
determining which properties of the fracture fluids demonstrated the particle settling
velocity Large shear rate ranges were used to cover the possible ranges of proppant
transport shear rate that occurred with in hydraulic fracture
58
Table 2 Weissenberg Number calculation as a function of relaxation time and particle
shear rate
Test
Fluid
Relaxation
time (s)
Diameter of
Particles (mm)
Settling
Velocity
(cmsec)
Weissenberg
Number
Particle
Shear Rate
(1s)
HVFR-2
14 2 063 876 626
14 4 393 2748 1963
14 6 669 3120 2229
LG - 20
003 2 539 16 5393
003 4 1775 27 8877
003 6 2943 29 9810
Table 3 presents the Power law model equations for the relationship between
viscosity and shear rate as well as the exponential model for the first normal stress for both
HVFR-2 and linear gel to calculate elasticviscous ratio Figure 13 shows that for HVFR-
2 loading 2 gpt the equation 120582119890120592 = 069 ϔ14 indicates that elasticity becomes more
dominate when the shear rate is larger than 126119904minus1 For linear gel (20 ppt) elastic effects
are almost negligible since the contribution of elasticity become more important when
shear rates are larger than 501119904minus1 as illustrated by 120582119890120592 = 00008 ϔ117 The results could
also be indicated that elastic properties of HVFR dominate proppant transport within a
wide range of shear rates covering large portion of hydraulic fracture where shear rates
across fracture decreases as proppant transport deep inside fracture However still more
59
work is needed to confirm these results where fracture fluids with similar viscosity ranges
have different elastic properties or vice versa are required for such investigations
Table 3 ElasticViscous ratio 120582119890120592 calculations
The Ratio of Elasticity to Viscosity Calculation
Fluid name
Viscosity equation from
viscosity profile
Elasticity equation from
N1 profile
ElasticViscous
ratio
HVFR-2 gpt 120578(ϔ) = 0552ϔminus073 1198731(ϔ) = 0548ϔ0665 120582119890120592 = 069 ϔ14
R-square 09996 0968
Linear Gel- 20 ppt 120578(ϔ) = 0172ϔminus038 1198731(ϔ) = 0096ϔ0798 120582119890120592 = 00008 ϔ117
R-square 09955 09169
Figure 16 Calculated elasticviscous ratio as a function of shear rate for HVFR-2 2 gpt
and Linear gel ndash 20 ppt
000001
00001
0001
001
01
1
10
100
1000
10000
100000
01 1 10 100 1000
λe
v
Shear Rate 1s
HVFR-2gpt
Linear Gel -20ppt
60
5 COST ANALYSIS
HVFRs are in high demand now in hydraulic fracturing processes instead of
conventional linear gel systems due to economical and operational factors Economically
using HVFRs reduces chemical volume costs from 48 to 33 and the volume can also be
reduced by 30 when switching to the HVFR system (Motiee et al 2016 Domelen et al
2017) Moreover there is potential of using less equipment on location due to HVFRs
having high solubility in water so there is no need for a hydration unit or blending in the
field This paper presents that using a low loading of HVFR provides much better result
compared to the using a common concentration of linear gel (20 ppt)
Table 4 Stimulation summary of case study (Dahlgren et al 2018)
SW
MBL
HVFR
MBL
18
LIN
MBL
18 XL
MBL
TOTAL
FLUID MBL
100
MESH
MM
4070
MM
TOTAL
PROP MM
Well 1 243 0 21 41 3054 47 76 123
Well 2 251 56 0 0 3073 47 76 123
Dahlgren et al 2018 presented field case studies of using HVFRs in the STACK
play Interestingly one of these was a comparison between two wells completed identically
in fracturing design Well 1 was treated with a hybrid guar-based fluid system consisting
of 18 linear gel and 18 crosslinked Well 2 used a HVFR starting with 5 gpt and ending
the fracture treatment with 3 gpt of HVFR All the other parameters were the same in both
61
stimulation processes in well 1 and well 2 as shown in the Table 4 The field results showed
an over 30 improvement in production as well as chemical cost reduction of 32 in well
2 where HVFR was used compared to using guar-based fluids in well 1
6 CONCLUSIONS
This laboratory study investigated rheological and elastic properties of high viscous
friction reducer fracture fluids Proppant settling velocity was also investigated at different
conditions The outcomes of this work give valuable insights into the properties and
performance of high viscous friction reducer fracture fluids compared to linear gel fluids
The following conclusions can be drawn from this work
bull High viscous friction reducer-based fluids with low concentrations of HVFRrsquos have
better viscosity and elastic properties than fluids with typical concentrations of linear
gel
bull High viscous friction reducers have better thermal stability than linear gel Viscosity
and elastic properties of high viscous friction reducers did not be change significantly
compared to linear gel at temperature ranges less than 80 degC
bull High viscous friction reducer showed better elastic properties than linear gel for
different shear rate ranges This implies that high viscous friction reducer-based fluids
have better proppant carrying capability along fractures than linear gel
62
bull Proppant static settling velocity was much higher linear gel fluids compared to high
viscous friction reducer-based fracture fluids The proppant settling velocity is
approximately 40x less when using high viscous friction reducer
REFERENCES
Arnipally S K amp Kuru E (2018 October 1) Settling Velocity of Particles in
Viscoelastic Fluids A Comparison of the Shear-Viscosity and Elasticity Effects
Society of Petroleum Engineers httpsdoi102118187255-PA
Ba Geri M Imqam A amp Dunn-Norman S (2018 October 5) Proppant Transport
Behavior in Inclined Versus Vertical Hydraulic Fractures An Experimental Study
Society of Petroleum Engineers httpsdoi102118191813-18ERM-MS
Ba Geri M Imqam A amp Flori R (2019 April) A Critical Review of Using High
Viscosity Friction Reducers as Fracturing Fluids for Hydraulic Fracturing
Applications Society of Petroleum Engineers httpsdoi102119195191-MS
Broadbent JM Mena B 1974 Slow flow of an elastico-viscous fluid past cylinders and
spheres Chem Eng J 8 11ndash19
Dahlgren K Green B Williams B Inscore J Domelen M V amp Fenton A (2018
January 23) Case Studies of High Viscosity Friction Reducers HVFR in the
STACK Play Society of Petroleum Engineers httpsdoi102118189893-MS
Drylie S Duenckel R Barree R amp Hlidek B (2018 September 24) An Investigation
of Proppant Transport in Friction Reducer Fluid Systems Utilizing a Large Slot
Flow Apparatus Society of Petroleum Engineers httpsdoi102118191720-MS
Hu Y T Chung H amp Maxey J E (2015 February 3) What is More Important for
Proppant Transport Viscosity or Elasticity Society of Petroleum Engineers
httpsdoi102118173339-MS
Hu Y T Fisher D Kurian P amp Calaway R (2018 January 23) Proppant Transport
by a High Viscosity Friction Reducer Society of Petroleum Engineers
httpsdoi102118189841-MS
63
Johnson M Winkler A Aften C Sullivan P Hill W A amp VanGilder C (2018
October 5) Successful Implementation of High Viscosity Friction Reducer in
Marcellus Shale Stimulation Society of Petroleum Engineers
httpsdoi102118191774-18ERM-MS
Khan AR Richardson JF 1987 The resistance to motion of a solid sphere in a fluid
Chem Eng Sci 62 135ndash150
Lali A M Khare A S Joshi J B et al 1989 Behaviour of Solid Particles in Viscous
Non-Newtonian Solutions Settling Velocity Wall Effects and Bed Expansion in
Solid-Liquid Fluidized Beds Powder Tech 57 (1) 39ndash50
httpsdoiorg1010160032-5910(89)80102-0
Loveless D Holtsclaw J Saini R Harris P C amp Fleming J (2011 January 1)
Fracturing Fluid Comprised of Components Sourced Solely from the Food Industry
Provides Superior Proppant Transport Society of Petroleum Engineers
httpsdoi102118147206-MS
Malhotra S amp Sharma MM Settling of Spherical Particles in Unbounded and Confined
Surfactant-Based Shear Thinning Viscoelastic Fluids An Experimental Study
Chemical Engineering Science 84 646-655 (2012)
Montgomery C (2013 May 20) Fracturing FluidltbrgtComponents International Society
for Rock Mechanics and Rock Engineering
Motiee M Johnson M Ward B Gradl C McKimmy M amp Meeheib J (2016
February 1) High Concentration Polyacrylamide-Based Friction Reducer Used as
a Direct Substitute for Guar-Based Borate Crosslinked Fluid in Fracturing
Operations Society of Petroleum Engineers httpsdoi102118179154-MS
Renaud M Mauret E Chhabra RP 2004 Power-law fluid flow over a sphere average
shear rate and drag coefficient Can J Chem Eng 821066ndash1070
Shah SN Fadili YE Chhabra RP 2007 New model for single spherical particle
settling velocity in power law (visco-inelastic) fluids Int J Multiphase Flow 33
51ndash66
Schein G (2005 January 1) The Application and Technology of Slickwater Fracturing
Society of Petroleum Engineers
Shen L Vigderman L Heller D amp Fu D (2018 August 9) Can Friction Reducers
Transport Sand During Fracturing Treatment Unconventional Resources
Technology Conference httpsdoi1015530URTEC-2018-2873723
64
Van Domelen M Cutrer W Collins S amp Ruegamer M (2017 March 27)
Applications of Viscosity-Building Friction Reducers as Fracturing Fluids Society
of Petroleum Engineers httpsdoi102118185084-MS
Tripathi A Chhabra RP Sundararajan T 1994 Power-law fluid over spheroidal
particles Ind Eng Chem Res 33 403ndash410
Uhlherr PHT Le TN Tiu C 1976 Characterization of inelastic power-law fluids
using falling sphere data Can J Chem Eng 54 497ndash502
65
III STATIC PROPPANT SETTLING VELOCITY CHARACTERISTICS IN
HIGH-VISCOSITY FRICTION REDUCERS FLUIDS FOR UNCONFINED
AND CONFINED FRACTURES
Mohammed Ba Geri1 Ralph Flori1 Abdulmohsin Imqam1 Andrey Bogdan2 and
Lingjuan Shen2
1 Deparment of Petroleum Engineering Missouri University of Science and Technology
Rolla MO 65409
2 BJ Services Tomball TX
ABSTRACT
Measuring proppant settling velocity in high viscosity friction reducers (HVFRs)
plays a critical key for evaluating proppant transport in hydraulic fracture treatment
Settling of particles is governed by several factors such as fluid rheology (viscosity and
elasticity) proppant size retardation confining walls effect and fracture orientation The
objective of this experimental study was to determine how these factors would influence
particle settling velocity in hydraulic fracturing applications
The experiments were conducted in unconfined and confined fluid conditions
Fracture cell was designed in certain ways to capture the impact of fracture orientation by
45deg 60deg and 90deg on settling velocity
Results showed HVFR provided better proppant transport capability than regular
FRs used in slickwater Proppant settling velocity using HVFR was decreased by 80
Results obtained from confined fluid experiments showed that proppant settling velocity
decreased due to the confining walls exert retardation impact The wall retardation was also
66
reduced as the fracture width increased Changing fracture orientation from vertical
position (90 degree) to 45 degree led to high reduction in proppant settling velocity
1 INTRODUCTION
The free settling velocity of solid particles in different fluid media is generally
encountered in a wide variety of industrial processes Understanding particles behavior and
particles settling plays a vital role in optimizing design and operation in various industrial
applications including proppant transport in hydraulic fracturing gas flow through pipe
lines and cutting transport during drilling operations as discussed by Arnipally and Kuru
2018 Increasing the efficiency of proppant transport distribution in hydraulic fracture
treatment is required and relies on the knowledge of settling velocity of the particles
Settling of particles is governed by several factors such as fluid rheology (elasticity and
viscosity) proppant size retardation confining walls effect and fracture orientation Since
quantifying the relationship between drag coefficient and Reynoldsrsquo number of particles is
the most significant to know it is required to get the values of the particles settling velocity
Settling velocity at higher Reynolds numbers has been studied extensively and expressed
for the calculation of drag force (Clift et al 1978 Khan and Richardson 1987 Zapryanov
and Tabakova 1999 Michaelides 2002 2003)
Recently the oil industry started to use HVFRs as a direct replacement for linear
and crosslinked gels due to several operational and economic reasons (Motiee et al 2016
Ba Geri et al 2019) such as reducing pipe friction during the fracturing process placing
more proppant creating more complex fracture networks due to a less viscous system
67
possible higher fracture conductivity and potentially lower costs due to fewer chemicals
and less equipment on location (Motiee et al 2016 Van Domenlen et al 2017 Dahlgren
et al 2018 Ba Geri et al 2019b)
Predicting particles settling velocity and proppant transport in different types of
hydraulic fracturing fluids was attained by (Clark and Zhu 1996 Gadde et al 2004)
studied how settling velocity can be affected by changing proppant size fracture width
velocity of fluid and rheology properties of fluids The study concluded that Stokersquos law
is not accurate for predicting proppant settling rate Motiee et al (2016) studied high
concentration friction reducers (HCFR) as a direct substitute for guar-based fluid Different
concentrations of HCFR (2 4 6 and 8 gpt) were compared with 25 ppt linear gel to study
proppant settling velocity HCFR showed better proppant settling velocity relative to guar-
based fluids Tong et al (2017) conducted experimental and simulation studies about
proppant transport in fracture intersections using slickwater They concluded that
increasing shear rate causes reduction on equilibrium bed height and increased proppant
dune length
Shen et al (2018) investigated rheological characterization of HVFRs and
measured the settling velocity of multi-particle proppant They concluded that both the
viscosity and elasticity of HVFRs can affect the proppant carrying capacity during
hydraulic fracturing treatments Hu et al (2018) addressed some concerns related to
proppant transport capability using HVFRs and linear gel They observed that normal
forces for linear gels are much lower than HVFRs with increased shear rate Dahlgren et
al (2018) identified three case studies in which the operator in STACK play replaced
traditional fracturing fluid with HVFR The study noticed that the viscosity profile was
68
negatively affected by breaker Johnson et al (2018) presented a successful implementation
of high brine friction reducers (HBFRs) in high TDS water exceeding 60000TDS They
observed that the viscosity of HBFRs decreased with increased brine concentration ranges
Drylie et al (2018) conducted viscosity measurements at a high shear rate of 511 119904minus1 and
a low shear rate 001 119904minus1 for 1 gpt and 6 gpt of HVFR and 24 ppt of guar The study noticed
that 1gpt of HVFR did not change the viscosity profile significantly in contrast at a low
shear rate HVFRs had much higher viscosity than guar Ba Geri et al (2018) investigated
experimentally the effect of fracture inclination on proppant transport The study concluded
that inclination of fractures can significantly impact on proppant transport due to the
friction or contact force which comes from the fracture wall Although this work studied
the proppant transport using HVFR there was not much work comparing this settling
velocity of HVFRs with traditional slickwater fluids
Additionally even though a lot of work has been performed to understand the
proppant settling velocity in HVFR the effect of confined and unconfined fractures on
static proppant settling velocity measurements has not been thoroughly investigated This
work will conduct laboratory work intensively to fill the knowledge gap This study
investigated five factors that could affect proppant settling velocity performance viscosity
profile elasticity (Normal forces and relaxation time) proppant size wall effect and
fracture orientation
69
2 PROPPANT STATIC SETTLING VELOCITY
This study provides insights on the wall effect factor on measuring proppant static
settling velocity It also evaluates the elastic and viscous properties of HVFRs fluid through
calculating the elasticity to viscosity ratio
21 WALL EFFECT (119917119960)
Proppant settling velocity plays vital factor during proppant transport in complex fracturing
system due to the very narrow widths of natural fractures Therefore the ratio between the proppant
diameters and the fracture width is pointed out in this study For Newtonian fluids (Faxen 1922)
addressed the wall effect on settling velocity on creeping flow regime The study concluded that
wall factor depends on the ratio between particle diameters to cell width A retardation effect of
walls on particle settling velocity reduced the settling velocity This retardation effect can be
quantified as wall factor (119865119908) The wall factor defines as the ratio between the particles settling
velocity in confined walls to settling velocity in unconfined fluids as shown in the Eq 1 (Malhotra
and Sharma 2013)
119865119908 =119878119890119905119905119897119894119899119892 119907119890119897119900119888119894119905119910 119894119899 119888119900119899119891119894119899119894119899119892 119908119886119897119897119904
119878119890119905119905119897119894119899119892 119907119890119897119888119900119894119905119910 119894119899 119906119899119888119900119899119891119894119899119894119899119892 119891119897119906119894119889 (1)
If 119865119908 gt1 settling velocity is affected by confining walls
if 119865119908 le1 wall effect is negligible
22 PARTICLE SHEAR RATE (ϔ)
Calculating apparent particle shear rate leads to avoid overestimation or
underestimation of the right value of particle shear rate therefore determine the particle
70
shear rate range within the Power law model (K n) is essential step to describe the shear
thinning effect of the HVFRs fluids Ba Geri et al (2019b) Eq 2 can be used to estimate
the particle shear rate
ϔ = 2 lowast 119881119904119889119901 (2)
where ϔ is the particle shear rate 119881119904 is the terminal settling velocity 119889119901 is the particle
diameter
23 ELASTICITY TO VISCOSITY RATIO (120640119942120650)
Viscoelastic fluids consist of two main properties (viscosity and elasticity) To
evaluate which property gives the greatest contribution during proppant transport Equation
4 was used to measure the elasticity to viscosity ratio (120582119890120592) (Shen et al 2018)
120582119890120592 =051205911198731(ϔ)
120578(ϔ) (3)
where λeυ is the elasticity to viscosity ratio 1198731(ϔ) is the first normal stress 120591 is
relaxation time and 120578(ϔ) is the shear viscosity
The numerator consists of the elasticity portion (relaxation time 120591 and first normal
stress 1198731(ϔ)) and the denominator is a function of only the viscosity profile (120578(ϔ)) The
elasticviscous ratio demonstrated by elasticity once their value more than one while if the
elasticviscous ratio less than one that indicates is the viscosity play main role during
proppant transport
71
24 FORCES INFLUENCED PARTICLES SETTLING VELOCITY
The most common correlation was derived by Stokes which can be used to calculate
settling velocity Vs if the Reynolds number and drag coefficient 119862119863are known which are
shown in Eq 6 ndash 8 (Arnipally and Kuru 2018)
119877119890119901 lt 1 (creeping flow regime)
119877119890119901 =119863119901119881119904120588119891
120583119891 (4)
119862119863 =24
119877119890119901 (5)
119881119904 =(120588119904minus120588119891)119892119863119904
2
18120583119891 (6)
Three main forces dominate the vertical motion of solid particles in a fluid
gravitational force FG buoyancy force FB and drag force FD (Arnipally 2018)
119865119892 = 120588119901119907119901119892 (7)
119907119901 = 12058711988911990136 (8)
119865119887 = 120588119907119901119892 (9)
119865119863 = 1198621198631198601205881198911198812
2 (10)
where 120588119901 is the particle density 119907119901 is the volume of the particle 120588119891 is the fluid density
119889119901 is the particle diameter g is the acceleration due to gravity (981 m119904minus2) 119862119863 is the drag
coefficient A is the projected area and V is the settling velocity
72
3 EXPERIMENT DESCRIPTION
31 MATERIALS
311 Hydraulic Fracturing Fluids The fracturing fluid tested was regular FR
(without adding any chemical additives) and HVFR-3
312 Preparing Fracturing Fluids According to standard industry practice of
using HVFR-3 four different concentrations (1 2 4 8 gpt) of HVFRs were prepared by
mixing with deionized (DI) water Shen et al (2018)
313 Proppant Sizes Sand proppant size 2040 3050 and 4070 mesh obtained
from US Silica and spherical glass beads sizes (2mm 4mm and 6mm) were used to
measure proppant terminal settling velocity
314 Rheometer A high accuracy advanced MCR 302 Anton-Paar rheometer
with a parallel-plate system was used to measure viscosity-shear profile normal forces
and the dynamic oscillatory-shear measurements at lab temperature conditions
32 EXPERIMENT SETUP
321 Unconfined Fracture Wall Experiments Figure 1 shows the setup of an
unconfined settling velocity measurement The experiment was performed in a 1000 ml
transparent glass graduated cylinder with a diameter at least 25 times of the proppant
diameter to ensure that proppant settling velocity was not influenced by the walls of the
glass container Malhotra and Sharma (2013) In addition a foot ruler was placed alongside
the glass container to measure the fluid level inside the model
73
322 Confined Fracture Wall Experiments Figure 2 shows the schematic of the
experimental fracture cells setup The fracture cell model dimensions are 50 cm height and
7 cm length and kept the same for all the experiments Fracture cells were constructed of
two Plexiglas plates in parallel The spacing between the two parallel Plexiglasses of the
cell is made by gasket rubber to mimic the fracture width Two different fracture widths
were studied 3 mm and 9 mm At this point the cell was filled by either regular FR or
HVFR fluid and positioned vertically High-resolution video camera up to 2000 fps used
to record the proppant settling process Captured videos were tracked and analyzed using
a video analysis software The fracture slot apparatus was illuminated with 4000 Lumens
2X2 ft ndash LED Vapor tight fixture to add extra light Proppant sizes of 2040 3050 and
4070 mesh were used to conduct experiments
Figure 1 Schematic of fracture setup for unconfined fluids
74
Numerous of natural fractures might be inclined from the main fracture by different
angles during fracturing Understanding proppant settling behavior in inclined fracture is
essential for proppant transport in fracture treatment Three different angles 45⁰ 60⁰ and
90⁰ have been investigated to mimic inclined fracture The configuration of this experiment
is to model the particle-wall friction occurred due to the interaction between particles and
inclined walls effect Confined fracture wall setup was positioned as illustrated in Figure 3
to observe the fracture inclination effect Spherical proppants were used with diameter
ranges of 2 mm 4 mm and 6 mm The motion of proppant rolling down in the inclined
cells acting under four forces gravitational force FG buoyancy force FB drag force FD
and Fr friction force
Figure 2 Schematic of fracture setup for confined fluids
75
Figure 3 Schematic of the experimental fracture cell for measuring inclination angle
effect
33 EXPERIMENT PROCEDURES
331 Viscosity Rheological Characterization of the HVFRs
3311 Viscosity profile measurement Steady shear-viscosity rheological test
was performed using an advanced rheometer with a parallel-plate system (PP50TG using
a 030 mm gap) To investigate the viscous behavior the test was implemented by varying
shear rate from 01-1000 119956minus120783 with measurements at 21 pointdecade
3312 Elasticity profile measurement The dynamic oscillatory-shear were
conducted to measure the elasticity profiles including first normal stress N1 relaxation
time and elastic modulus Grsquo The oscillatory test was implemented over a range of
frequencies from 001-100 Hz All rheological property measurements were conducted at
25
3313 Static settling velocity measurement Once the fracturing fluid samples
were prepared at the desired concentration these samples were placed in unconfined and
confined fluids to measure the proppant settling velocity To achieve more accurate results
76
air bubbles were removed from the test fluid by leaving the fluid to rest overnight as
bubbles affect both rheology and settling velocity measurements Next the proppant was
dropped into the fluid column and the camera started capturing the proppant movement
An image analysis tool called ldquoTrackerrdquo
(httpwwwcabrilloedu~dbrowntracker) was applied to get accurate measurements of
vertical position of the proppant at different time steps The slope relationship between
proppant vertical positions to time steps is called terminal settling velocity For more
accurate results settling velocity of each particle was repeated several times Ba Geri et al
2018
332 Static Settling Velocity Calculations Based on Power Law Parameters
(K n)Static settling velocity of spherical particles in viscoelastic power law fluids can be
calculated using the developed model of Shah et al (2007) Two constants (A B) were
employed as a function of power law parameters n k The procedure to calculate the
settling velocity of a spherical particle in viscoelastic Power law fluid is as follows
Step-1
119860 = 69148 1198992 minus 24838119899 + 22642 (11)
119861 = minus05067 1198992 + 1323119899 minus 01744 (12)
Step-2
(1198621198632minus1198991198771198902)
1
2 = (13082minus119899119889119901
119899+2120588119891119899(120588119875minus120588119891)
2minus119899
22(119899minus1)1198702 )
1
2
(13)
Step-3
77
119877119890 = [(119862119863
2minus1198991198771198902)12
119860]
1
119861
(14)
Step-4
119881infin119868119873119864119871 = [2119899minus1119870119877119890
119889119901119899120588119891
]
1
2minus119899 (15)
119881119890119897119900119888119894119905119910 119877119886119905119894119900 = 119881infin119864119871
119881infin119868119873119864119871 (16)
119881infin119864119871 Experimental settling velocity of a particle in unconfining fluid
119881infin119868119873119864119871 Calculated on the basis of apparent viscosity data based on the power-law parameters (k
n)
4 RESULTS AND DISCUSSION
41 VISCOSITY MEASUREMENT RESULTS
Figure 4 shows viscosity measurement profile as a function of loading
concentration All the results exhibit that the HVFRs fluids follow a shear thinning
behavior that as shear rate increases the viscosity decreases At a loading of 8gpt results
for HVFR showed that HVFRs had high viscosity (7766 cp) at a lower shear rate of 01
sminus1 which is around 46 times of the viscosity when the concentration decreased to 1gpt
Table 1 shows the viscosity profile of four different concentrations (1 2 4 8 gpt)
of HVFR-3 All the measurements result of HVFRs exhibited that HVFR-3 fluid follows
shear thinning behavior
78
Figure 4 Effect of HVFR-3 concentration as a function in viscosity shear profile
Table 1 Power law model equations and parameters (n k) for HVFR-3
HVFR Concentration gpt (gallons per thousands of gallons)
Fluid
Name 1 2 4 8
HVFR-3 120583 = 6152120574minus043 120583 = 206120574minus0570 120583 = 60708120574minus063 120583 = 181535120574minus069
R-square 09984 09987 09992 09994
42 ELASTICITY MEASUREMENT RESULTS
The Relaxation time τ can be used to quantify the elasticity of the polymer fluids
Since the HVFRs have high molecular weight the understanding of the elasticity is very
important To evaluate viscoelastic characterizations of HVFR-3 small amplitude
oscillatory shear was carried out in fluid solutionrsquos linear viscoelastic regime using an
advanced rheometer with a parallel-plate system Storage modulus (Grsquo) which represents
elastic response and loss modulus (Grdquo) represents viscous response were both measured
1
10
100
1000
10000
01 1 10 100 1000
Vis
cosi
ty
cp
Shear Rate 1s
8 gpt
4 gpt
2 gpt
1 gpt
79
at wide range of angular frequencies from 001-100 Hz Relaxation time referred as the
inverse of the cross over point (t = 1ω) where the Grsquo equal to Grdquo Figure 5 shows Grsquo and
Grdquo measurements as a function of angular frequency The results showed that low loading
at 1 gpt and 2 gpt had very low relaxation time As the concentration of HVFR increased
the relaxation time became more significant For example at loading of 4 gpt the relaxation
time was 4s and increased to 8 s when loading increased to 8 gpt Normal stress is another
significant elastic property of HVFRs which can be measured as a function of shear rate
Figure 5 Elastic modulus Grsquo and storage modulus G`` as a function of HVFR-3
concentrations
The normal stress is zero in Newtonian fluids due to the isotropic of the fluid
However in polymeric fluids such as friction reducers which can develop anisotropy in the
80
orientation between flow-gradient direction (tyy) and the flow (txx) due to their
microstructures N1 usually is not zero
1198731 = 120591119909119909 minus 120591119910119910 (17)
1198731 = 120591119910119910 minus 120591119911119911 (18)
Figure 6 presents elastic property (normal force N1) as a function of shear rate At
low shear rate the normal stress was very low and started to increase as the shear rate and
loading of HFVRs increased At low shear rates (from 01 to 10 s-1) the normal stress was
very low whereas increasing the shear rate above 10 s-1 showed an increase in normal stress
Normal stress was increased substantially as the HVFR concentration increase For
example at 1000 s-1 the normal stress was approximately 20 Pa and 130 Pa for 2 gpt and
8gpt respectively This result is consistent with the elastic range trend measured previously
by the relaxation time
Figure 6 Effect of HVFR 3 concentration as a function in Normal stress profile
0
20
40
60
80
100
120
140
01 1 10 100 1000
Norm
al
Str
ess
(N1
) P
a
Shear Rate 1s
8 gpt
4 gpt
2 gpt
81
43 SETTLING VELOCITY MEASUREMENT RESULTS
Several factors can control the proppant transport in complex fracture system
including proppant type proppant size fracture geometry and fracture fluids
characteristics eg viscosity and elasticity (Loveless et al 2011 Montgomery 2013) In
this section single particle static velocity measurements were performed in confining and
uncoffining using HVFR-3 loading 2gpt in ambient temperature setup The importance of
measuring proppant static settling velocity is to mimic the conditions of fracture treatment
after stop pumping which represents low shear rate
44 PROPPANT SETTLING VELOCITY PERFORMANCE IN UNCONFINED
FRACTURE WALL
Three different glass beads of diameter sizes 2 mm 4 mm 6 mm were selected to
study the effect of settling velocity in HVFR and slickwater Figure 7 shows terminal
settling velocity as a function of particle diameter and fluid types At same particle size of
2 mm the settling velocity in HVFR was 35 cmsec while in slickwater settling velocity
increased by factor 56 to reach 197 cmsec All the tested particle sizes showed HVFR
has better settling performance compared to slickwater This reduction in settling velocity
using HVFR-3 could help to transport the proppant farther into the fractures
45 PROPPANT SETTLING VELOCITY PERFORMANCE IN CONFINED
FRACTURE WALL
The fracture orientations were examined because in inclination fractures fraction
force plays main factor to reduce the proppant settling velocity (Kou et al 2018 and Ba
82
Geri et al 2018) HVFR-3 with loading 2gpt and slickwater were both used in this
investigation
Figure 7 Effect of proppant settling velocity in HVFR-3 gpt vs slickwater fracture
fluids
Three different fracture orientations (fracture angle 90⁰ fracture angle 60⁰ and
facture angle 45⁰) and three different proppant glass beads sizes (2 mm 4 mm 6 mm) were
used Figure 8 shows settling velocity as a function of proppant sizes and fracture fluid
types at different fracture orientations The results showed that settling velocity
measurements decreased by increasing fracture inclination from 90⁰ to 45⁰ At same
particle size 6 mm of using HVFR the settling velocity in vertical fracture was 26 cmsec
while settling velocity was 96 cmsec in 45⁰ inclined fracture All the results for different
particle sizes and different fracture fluids were showing the same effect of fracture
0
5
10
15
20
25
30
35
40
45
0 1 2 3 4 5 6 7 8
Ter
min
al
Set
tlin
g V
elo
city
cm
sec
Particle Diameter mm
HVFR-3 2mm HVFR-3 4mm HVFR-3 6mm
Slickwater -2mm Slickwater-4mm Slickwater-6mm
83
inclination Results also confirmed our previous observation where HVFR had better
settling velocity performance than slickwater
Figure 9 shows further analysis to understand the effect of HVFR on proppant
settling velocity in comparing with slickwater at different fracture orientations Proppant
size of 2 mm results were used to make this comparison At same condition of fracture
orientation with 45 degree the reduction on settling velocity was over 90 by changing
fracture fluids from slickwater to HVFR-3 The reduction on settling velocity not only in
inclined fractures but also in vertical fracture (angle 90 degree) which reached around 80
once changing fracturing fluids from slickwater to HVFR-3 This substantial reduction in
settling velocity the HVFR could be better alternative for conventional slick water
Figure 8 Settling velocity of HVFR vs Slickwater in vertical fractures by 90 angle vs
inclined fractures angles 60 and 45 degree in confined fractures of 9 mm fracture width
84
Figure 9 Settling velocity reduction in slickwater versus HVFR-3 loading 2 in different
fracture orientation
46 WALL EFFECT ON STATIC SETTLING VELOCITY
Referring to the settling velocity results illustrated in Figures 7 and 8 for un-
confined fluid and confined fluids the wall effect for HVFR was obtained Settling for
these particles were occurred in the creeping flow regime Figure 10 shows 119865119908 as a function
of r (ratio between particle diameter and wall spacing) for the two different fracture widths
of 9 mm and 3 mm It can be seen that wall factors decrease with increase in value of r
This occurred because wall retardation effects increase as particle diameter becomes
comparable to wall spacing In addition to the wall retardation to reduce the proppant
settling velocity fluid elasticity plays main effect to decrease settling velocity of proppant
85
Figure 10 Wall factors as a function of particle diameter to wall spacing in the HVFR-3
loading 2 gpt
47 EFFECT OF VISCOSITY AND ELASTICITY OF HFVR ON PROPPANT
SETTLING VELOCITY
Figure 11 shows steady shear rate-viscosity measurements profile as a function of
shear rate for HVFR-3 HVFRs follow shear thinning model behavior The power law
model (k n) was fitted in the measured data of experimentally in range of particle shear
rate from 33 to 86 119904minus1 The particle shear rate range was selected based on shear particle
calculation using Eq 2 and it summarized in Table 2 for each proppant particle sizes
Figure 12 shows the velocity ratio calculation using HVFR-3 loading 2 gpt as a
function of proppant diameter Equation 16 was used to calculate the velocity ratio
between the measured settling velocity in the lab divided by the calculated velocity based
on power law model parameters (n k) Results showed that velocity ratio for the proppant
86
sizes were less than 1 This could imply that viscosity properties of HVFR3 with loading
of 2 gpt had greater effect on proppant settling velocity than elasticity did
Figure 11 Viscosity as a function of shear rate for HVFR-3 loading 2gpt
Table 2 Particles shear rate calculations for HVFR
Particle
size
Particl
e Size
(cm)
Particle
Shear
Rate
(1sec)
K
(Pasn) n
4070 mesh 0033 33
0206 057
3050 mesh 0473 87
2040 mesh 0635 187
2 mm 020 37
4 mm 040 85
6 mm 060 867
87
Figure 12 Velocity ratio as a function of proppant diameter in HVFR-3 loading 2 gpt
48 EFFECT OF ELASTICITY TO VISCOSITY RATIO (120640119942120650)
Equation 3 used to determine which properties of the fracture fluids demonstrated
the particle settling velocity at wide ranges of shear rates The estimation of shear rate
range is varying during hydraulic fracturing treatments where typically fracturing
treatment conducting within range 300 119904minus1 to 900 119904minus1 Friction loss caused reduction on
shear rate to become in the range of 10 119904minus1 to 100 119904minus1 and continue decreasing until the
shear rate goes to zero at fracture tip Table 3 presents the power law model equations of
the relationship between viscosity and shear rate as well as exponential model for first
normal stress for both HVFR-3 to calculate elasticviscous ratio
Figure 13 shows that for HVFR-3 loading 2 gpt 120582119890120592 = 0004 lowast ϔ055 indicates
that elasticity effect almost negligible since the contribution of elasticity become more
0
02
04
06
08
1
12
14
0 01 02 03 04 05 06 07
V E
L
Vs
INE
L
Proppant Diameter mm
4070 3050 2040
Reduction in velocity due to elasticity
Reduction in velocity due to viscosity
88
important when shear rate larger than 1000119904minus1 The results could imply that viscous
properties of HVFR-3 loading 2 gpt dominate proppant transport The results could imply
that viscous properties of HVFR-3 loading 2 gpt dominate proppant transport within a wide
range of shear rate from injection point until delivering proppant to fracture tip whereas
plays somehow effect at high shear rate gt 1000 119904minus1
5 COST ANALYSIS
This laboratory study investigated several factors that affect the Proppant settling
in high viscous friction reducer fracture fluids Proppant settling velocity was investigated
as function of fluid rheology (viscosity and elasticity) proppant size retardation confining
walls and fracture orientation
Figure 13 Calculated elasticviscous ratio as a function of shear rate for HVFR-3
loading 2 gpt
0001
001
01
1
01 1 10 100 1000
λev
Shear Rate 1s
HVFR-3 2gpt
89
Table 3 ElasticViscous ratio 120582119890120592 calculations
The outcomes of this work have provided interesting perceptions into the
understanding of high viscous friction reducer fracture fluids compared to slickwater
fracture fluids The following conclusions can be drawn from this work
bull High viscosity friction reducers provided better proppant transport capability than
using slickwater fracturing fluids Proppant settling velocity could be reduced by above
80 when slickwater was replaced by HVFR
bull Viscosity properties dominated proppant settling velocity while elasticity effect was
almost negligible for HVFR at low loading concentration of 2 gpt
bull Wall retardation effect increase as particle diameter becomes comparable to wall
spacing and it can also depend on HVFR elasticity
bull Changing fracture orientation from vertical position (90 degree) to incline by 45 degree
caused high reduction in proppant settling velocity This reduction could be caused by
wall friction forces when proppant settle into the bottom of the fracture
The Ratio of Elasticity to Viscosity Calculation
Fluid name Viscosity equation
from viscosity profile Elasticity equation
from N1 profile ElasticViscous
ratio
HVFR-3-2gpt 120578(ϔ) = 0195ϔminus054 1198731(ϔ) = 0018ϔ0005 120582119890120592 = 00039 ϔ055
R-square 09988 08674
90
REFERENCES
Arnipally S K and E Kuru 2018 Settling Velocity of Particles in Viscoelastic Fluids
A Comparison of the Shear-Viscosity and Elasticity Effects In Proceedings of the
SPE Annual Technical Conference and Exhibition 9-11 October San Antonio
Texas USA httpsdoi102118187255-PA
Ba Geri M A Imqam and S Dunn-Norman 2018 Proppant Transport Behavior in
Inclined Versus Vertical Hydraulic Fractures An Experimental Study In
Proceedings of the SPEAAPG Eastern Regional Meeting 7-11 October
Pittsburgh Pennsylvania USA httpsdoi102118191813-18ERM-MS
Ba Geri M A Imqam A Bogdan AL Shen 2019b Investigate the rheological behavior
of high viscosity friction reducer fracture fluid and its impact on proppant static
settling velocity In Proceedings of the SPE Oklahoma City Oil amp Gas Symposium
Oklahoma 7 ndash 11 April 2019 httpsdoi102118195227-MS
Ba Geri M A Imqam and R Flori 2019a A critical review of using high viscosity
friction reducers as fracturing fluids for hydraulic fracturing applications In
Proceedings of the SPE Oklahoma City Oil amp Gas Symposium Oklahoma 7 ndash 11
April 2019 httpsdoi102118195191-MS
Clark P E and Q Zhu 1996 Convective Transport of Propping Agents During Hydraulic
Fracturing In Proceedings of the SPE Eastern Regional Meeting 23-25 October
Columbus Ohio httpsdoi10211837358-MS
Dahlgren K B Green B Williams J Inscore V Domelen V and A Fenton 2018
Case Studies of High Viscosity Friction Reducers HVFR in the STACK Play In
Proceedings of the SPE Hydraulic Fracturing Technology Conference and
Exhibition 23-25 January The Woodlands Texas USA
httpsdoi102118189893-MS
Drylie S R Duenckel R Barree and B Hlidek 2018 An Investigation of Proppant
Transport in Friction Reducer Fluid Systems Utilizing a Large Slot Flow
Apparatus In Proceedings of the SPE Annual Technical Conference and
Exhibition 24-26 September Dallas Texas USA httpsdoi102118191720-MS
Faxen H 1922 Der Widerstand gegen die Bewegung einer starren Kugel in einerzumlahen
Fl uml ussigkeit die zwischen zwei parallelen ebenen Wumlanden eingeschlossenist
Ann Phys 68 89ndash119
91
Gadde P B Y Liu J Norman R Bonnecaze and M M Sharma 2004 Modeling
Proppant Settling in Water-Fracs In Proceedings of the SPE Annual Technical
Conference and Exhibition 26-29 September Houston Texas
httpsdoi10211889875-MS
Hu Y T D Fisher P Kurian and R Calaway 2018 Proppant Transport by a High
Viscosity Friction Reducer In Proceedings of the SPE Hydraulic Fracturing
Technology Conference and Exhibition 23-25 January The Woodlands Texas
USA httpsdoi102118189841-MS
Johnson M A Winkler C Aften P Sullivan W A Hill and C VanGilder 2018
Successful Implementation of High Viscosity Friction Reducer in Marcellus Shale
Stimulation In Proceedings of the SPEAAPG Eastern Regional Meeting 7-11
October Pittsburgh Pennsylvania USA httpsdoi102118191774-18ERM-MS
Khan AR JF Richardson 1987 ldquoThe resistance to motion of a solid sphere in a fluid
Chemrdquo Eng Sci 62 135ndash150
Kou R G J Moridis and T A Blasingame 2018 Analysis and Modeling of Proppant
Transport in Inclined Hydraulic Fractures In Proceedings of the SPE Hydraulic
Fracturing Technology Conference and Exhibition 23-25 January The
Woodlands Texas USA httpsdoi102118189856-MS
Lali A M A S Khare Joshi J B et al 1989 Behaviour of Solid Particles in Viscous
Non-Newtonian Solutions Settling Velocity Wall Effects and Bed Expansion in
Solid-Liquid Fluidized Beds Powder Tech 57 (1) 39ndash50
httpsdoiorg1010160032-5910(89)80102-0
Loveless D JHoltsclaw R Saini P C Harris and J Fleming 2011 Fracturing Fluid
Comprised of Components Sourced Solely from the Food Industry Provides
Superior Proppant Transport In Proceedings of the SPE Annual Technical
Conference and Exhibition 30 October-2 November Denver Colorado USA
httpsdoi102118147206-MS
Malhotra S and M M Sharma 2013 Settling of Spherical Particles in Unbounded and
Confined Surfactant-based Shear Thinning Viscoelastic fluids An Experimental
Study Chemical Engineering Science vol 84 092013
Michaelides EE 2002 Analytical expressions for the motion of particles In DeKee D
Chhabra RP (Eds) Transport Processes in Bubbles Drops and Particles 2nd ed
Taylor amp Francis New York (Chapter 2)
Michaelides EE 2003 ldquoHydrodynamic force and heatmass transfer from particles
bubbles and drops ndash the Freeman Scholar Lecturerdquo J Fluid Eng (AMSE) 125
209ndash238
92
Montgomery C 2013 Fracturing FluidltbrgtComponents International Society for Rock
Mechanics and Rock Engineering
Motiee M Johnson M Ward B Gradl C McKimmy M and J Meeheib 2016 High
Concentration Polyacrylamide-Based Friction Reducer Used as a Direct Substitute
for Guar-Based Borate Crosslinked Fluid in Fracturing Operations In Proceedings
of the SPE Hydraulic Fracturing Technology Conference 9-11 February The
Woodlands Texas USA httpsdoi102118179154-MS
Shah SN Fadili YE Chhabra RP 2007 New model for single spherical particle
settling velocity in power law (visco-inelastic) fluids Int J Multiphase Flow 33
51ndash66
Shen L L Vigderman D Heller and D Fu 2018 Can Friction Reducers Transport
Sand During Fracturing Treatment In Proceedings of the SPEAAPGSEG
Unconventional Resources Technology Conference 23-25 July Houston Texas
USA httpsdoi1015530URTEC-2018-2873723
Tong S R Singh amp K K Mohanty 2017 Proppant Transport in Fractures with Foam-
Based Fracturing Fluids In Proceedings of the SPE Annual Technical Conference
and Exhibition 9-11 October San Antonio Texas USA
httpsdoi102118187376-MS
Van Domelen M W Cutrer S Collins and MRuegamer 2017 Applications of
Viscosity-Building Friction Reducers as Fracturing Fluids In Proceedings of the
SPE Oklahoma City Oil and Gas Symposium 27ndash31 March Oklahoma City
Oklahoma USA httpsdoi102118185084-MS
Zapryanov Z and STabakova 1999 Dynamics of Bubbles Drops and Rigid Particles
Kluwer Academic Publishers Dordrecht The Netherlands
93
IV INVESTIGATE PROPPANT TRANSPORT WITH VARYING
PERFORATION DENSITY AND ITS IMPACT ON PROPPANT DUNE
DEVELOPMENT INSIDE HYDRAULIC FRACTURES
Mohammed Ba Geri1 Abdulmohsin Imqam1 and Mohammed Suhail2
1 Deparment of Petroleum Engineering Missouri University of Science and Technology
Rolla MO 65409
2 King Saud University Riyadh Saudi Arabia
ABSTRACT
Proppant transport adequately during hydraulic fracturing treatment assumes same
perforation contribution through multi-perforation system Proppant transport performance
into the different ordination fracture system using multi-entry perforation technique is still
not fully understood This experimental study was aimed to deeply investigate five factors
that affect proppant transport performance number of perforations perforation opening
size shear rate fracture orientation and proppant size distribution The impact of these
factors on proppant transport performance from different perspective was studied Fracture
slot model was designed and built to observe easily the effects of perforation density and
fracture orientation
The results of this experimental work show that limited-entry perforation technique
has significant impact on proppant transport within fractures where single top perforation
had better proppant placement than multi-perforation system Fracture area was
approximately propped with 66 and 48 using top perforation and multi-perforation
system respectively Slurry with high shear rate has a negative effect on the proppant
94
equilibrium dune level (EDL) and fracture propped area (FPA) Fracturing treatment using
high shear rate causes high pressure drop in the fracture that leads to decreasing EDL by
17 and fracture propped area by 23 comparing to using low shear rate Using large
proppant size (2040) leads to form high EDL and FPA compared to 100 mesh size
Proppant transport dominated by four mechanisms and the vertexes near wellbore plays
main mechanism to carry proppant farther inside the fracture
1 INTRODUCTION
Pressurized low viscosity fracture fluids (eg slickwater) have been used in
hydraulic fracturing treatments for a long time because low viscous fluids have the ability
to create desirable fracture geometries and long fracture lengths in ultra-tight permeability
reservoirs Many experimental studies have been conducted in vertical fracture slots to
highlight the factors that affect the proppant transport process (Kern et al 1959 Medlin et
al 1985 Patankar et al 2002 Wang et al 2003 Woodworth and Miskimins 2007) Multi-
stage fracturing techniques are essential to providing effective pathways for hydrocarbon
fluids to flow from unconventional reservoirs to the wellbore Each stage is comprised of
many clusters and each cluster consists of several reservoir entry points called
perforations Analysis of well logging data in horizontal wells in unconventional reservoirs
indicated that there was no contribution from 20 to 40 of perforation clusters on well
production Miller et al (2011) Crump and Conway (1988) Economides and Nolte
(2000) They observed that not all perforation is produced in shale basins for instance 21
95
32 and 39 in the Eagle Ford shale the Woodford shale and the Haynesville shale
respectively
Therefore meeting performance expectations requires enhancing the effective
completion quality and reducing completion cost by selecting optimum designs for
completion parameters like clusters and number of perforations Although the previous
work concluded that the production rate in multi-system perforation is less than limited-
perforation systems the reasons behind this are is still not understood This study will
highlight the effect of perforation density and perforation number on proppant transport
performance in terms of proppant equilibrium dune level and fracture propped area
Predicting particle settling velocity and proppant transport in different types of
hydraulic fracturing fluids including Newtonian and non-Newtonian fluids was attained
by (Clark and Zhu 1996) Gadde et al (2004) studied how settling velocity can be affected
by changing proppant size fracture width velocity of fluid and rheologicaly properties of
fluids The study concluded that using Stokersquos law is not an accurate way of predicting
proppant settling rate Liu and Sharma (2005) used different rheological characterizations
of fracturing fluids to study the effect of particle diameter on fracture width and settling
velocity They concluded that for large particle diameters the horizontal velocity of
proppant is less than the fluid velocity due to a large wall effect Alotaibi et al (2015)
extensively investigated the development of dune level and proppant transport mechanisms
at different stages of fracturing treatment using slickwater They observed that proppant
was sorted from smallest to largest until reaching EDL Mohanty et al (2016) conducted
experimental and simulation studies about proppant transport in fracture intersections using
slickwater
96
They concluded that increasing shear rate causes reduction in equilibrium bed
height while proppant dune length increases by increasing the shear rate Kadhim et al
(2017) conducted experimental study using slot fracture model to investigate the
heterogeneous fracture width wall roughness and leak-off on proppant settling
mechanisms They found that fracture wall roughness plays significant role on proppant
transport where noticed that settling velocity decreased and leads to decreased equilibrium
dune level They also observed that fracture width has more influence on settling velocity
than horizontal proppant velocity Desipt of the amount of previous work the effect of
perforation density on EDL and FPA has not been investigated thoroughly This paper will
provide a full understanding of proppant transport from different angles including pressure
loss across fractures injection shear rate and number of perforations that contributed to
proppant transport treatment
In addition due to the understanding that a created fracture orients perpendicular
to the minimum horizontal principal stress most existing studies assumed that proppant
transport occurred in a vertical geometry model Wright et al (1995) presented field studies
illustrating that over the production time of the Chevron Lost Hills the inclination changed
from 82⁰ to 45⁰ degrees between fracture treatments Dinh et al (2009) studied field
examples showing that fracture orientation is vertical near the wellbore but deviated
inclination as the moved away from the wellbore Kou et al (2018) developed a simulation
model to evaluate proppant transport in inclined fractures
Their results observed that proppant performance is better placement in inclined
fractures Ba Geri et al (2018) experimentally investigated the effect of fracture inclination
on proppant transport The study concluded that inclination of fractures can have a
97
significant impact on proppant transport due to the friction or contact force that comes
from the fracture wall This friction affects the settling velocity of the proppant and the
proppant distribution efficiency inside the fracture Increasing the fracture inclination angle
increases the fracture propped area This current study is extended work to our previous
publication Ba Geri et al (2018) in terms of studying perforation density and opening size
perforation impact on EDL and FPA
Based on the authorrsquos knowledge most of the previous lab work did not seriously
consider the impact of perforation density and fracture orientation on proppant transport
Thus this work will conduct intensive laboratory work to fill that knowledge gap This
study has deeply investigated five factors that affect proppant transport performance
number of perforations perforation opening size slurry shear rate fracture orientation and
proppant size distribution The impacts of these factors on proppant transport performance
from different perspectives was investigated based on the following 1) Behavior of
proppant transport in fracture half-length (Xf) at first fracture pore volume (FPV) 2) Dune
bed level development and fracture propped area at first FPV and EDL 3) Pressure drops
along fracture slot during proppant transport inside fracture This study also identifies and
define the mechanisms of proppant transport inside fractures
2 EXPERIMENT DESCRIPTION
21 EXPERIMENT MATERIALS
The experiments were conducted using white sand proppant supplied by US Silica
company and slickwater (without any chemicals additives) Three different sand sizes
98
(2040 4070 and 100 mesh) were used to investigate proppant size distribution effect US
silica proppant properties are shown in Table 1 All the experiments were conducted using
a proppant concentration of 05 lbgal
Table 1 APIISO properties of the tested US silica white sand proppants
Proppant
Type Roundness Sphericity
Particle
Density
(gcc)
Mean Particle Diameter
(mesh)
White
sand 07 08 265 100 4070 2040
22 FRACTURE MODEL SETUP
Figure 1 shows the proppant transport model apparatus that was built to mimic
proppant slurry transport in hydraulic fracturing treatments A lab fracture model is 61 cm
in length and 61 cm in height with fracture width of 0635 cm The orientation of the model
can be adjusted from vertical to inclined positions Four injection points (representing four
perforations of 0635 cm diameter) were made perpendicular to the fracture slot Along the
height of fracture slot four perforations were installed at the inlet and outlet of the fracture
slot During the proppant slurry injection all the four inlet perforations were used and only
one perforation at the outlet (the bottome one) was opened The other components of the
apparatus are the mixer mixing tank cameras pressure sensors flowmeters and safety
valve The fracture slot apparatus was illuminated with 4000 Lumens 61 cm x 61 cm ndash
LED vapor tight fixture to add extra light to capture clearly the proppant transport inside
fracture
99
Figure 1 Schematic Schematic of the experimental proppant transport evaluation system
23 EXPERIMENT PROCEDURE
To mimic a low viscosity slickwater stimulation treatment in a reservoir water
initially filled the fracture slot as shown in Figure 1 Three different US Silica White sand
sizes (2040 4070 and 100 mesh) were used to study the facture propped area due to
proppant size distribution in transport treatment Eleven experiments were designed and
conducted to investigate proppant transport behavior using different perforation density
and oriented fractures The number of experiments that conducted with their descriptions
are summarized in Table 2
100
Table 2 List of experiments and parameters
List of Experiments and Parameters
Cas
e
Perforatio
n Opening
Size ()
Proppan
t (mesh)
Shear
Rate
(s-1)
Proppan
t
Loading
(ppg)
Number of
Perforation
Fracture
Orientation
s
1 100 100 60 05 Top single Vertical
2 100 100 60 05 Bottom Single Vertical
3 100 100 60 05 Multi-Perforation Vertical
4 100 100 35 05 Top single Vertical
5 100 100 35 05 Bottom Single Vertical
6 100 100 35 05 Multi-Perforation Vertical
7 60 100 60 05 Multi-Perforation Vertical
8 40 100 60 05 Multi-Perforation Vertical
9 100 100 60 05 Multi-Perforation Inclined
10 100 4070 60 05 Multi-Perforation Vertical
11 100 2040 60 05 Multi-Perforation Vertical
To perform these experiments the expermintal procedure used is as follows
1 The fracture slot was filled with only fracture fluid In our case slickwater to mimic
the pad stage on the hydraulic fracturing treatment
2 The mixer was turned on and proppant was added The proppant concentration was
05 ppg in order to make the slurry
3 The slurry was pumped into the fracture slot at different shear rate (60119904minus1 35119904minus1
and 8119904minus1) The injection process was continued until no change could be observed
in the dimensions of the proppant dune bed inside the fracture
4 High-resolution cameras were used to capture and record the proppant transport
during the experiments
5 The captured videos were tracked and analyzed using a video analysis MATLAB
code
101
6 All the above procedures were repeated for all the experiment cases mentioned in
Table 2
24 EXPERIMENT ANALYSIS APPROACHES
The experiment results were analyzed using the following calculation parameters
241 Equilibrium Dune Level (EDL) Equilibrium dune level (EDL) is the ratio
of sand dune height to fracture model height multiplied by 100 It is measured by using
the program Plot Digitizer where the fracture slot height is divided to the highest point of
proppant bed inside the fracture The ratio between proppant dune to fracture height can be
obtained by applying the following equation (Alotaibi and Miskimins 2018)
Equilibrium Dune Level (EDL) = 119864119902119906119894119897119894119887119903119894119906119898 119889119906119899119890 ℎ119890119894119892ℎ119905
119865119903119886119888119905119906119903119890 119904119897119900119905 ℎ119890119894119892ℎ119905times 100 (1)
242 Proppant Dune Level Development (PDLD) Proppant dune level
development (PDLD) is defined as the ratio between proppant dune levels before reaching
EDL to the EDL Kadhim et al (2017)
Proppant Dune Level Development (PDLD) = 119863119906119899119890 119871119890119907119890119897 (119863119871)
119864119902119906119894119897119894119887119903119894119906119898 119889119906119899119890 ℎ119890119894119892ℎ119905 (119864119863119871)times 100 (2)
243 Equilibrium Dune Length (EDX) Proppant dune length (EDX) is defined
as the ratio between the average dune lengths to the fracture model length multiplied by
100 as shown by the following equation
Fracture propped area (FPA) =119886119903119890119886 119900119891 119901119903119900119901119901119886119899119905 119889119894119904119905119903119894119887119906119905119890119889 119894119899 119905ℎ119890 119891119903119886119888119905119906119903119890
119879119900119905119886119897 119891119903119886119888119905119906119903119890 119886119903119890119886 (3)
244 Pressure Losses Calculations Since the pressure loss across the fractures
is a function of flow rate of the fluid pressure losses effect calculations were investigated
to study the effect of pressure loss across fracture on fracture propped area Typically the
102
following equation (Clark and Zhu 1996) is used to calculate the pressure drop across the
fracture slot
∆119875 = 12119897120583119876119904
ℎ1199083 (4)
where ∆P is the pressure losses across the slot in psi Qs is the slurry flowrate in cm3s μ
is the slurry viscosity in poise h l w are the slot dimensions high and length in cm
respectively
3 RESULTS AND ANALYSIS
31 NUMBER OF PERFORATION EFFECT
To study the perforation impact on proppant transport a 100 perforation opening
size high shear rate 60 (1s) fracture orientation (vertical fracture) proppant size 100 mesh
were used Figure 2 illustrates that changing the number of perforations at first FPV had
similar results in terms of height of proppant and distance the proppant travels inside the
fracture For instance at the first FPV all change the perforation position from the top
perforation system to bottom perforation system had the same delivered amount of
proppant where the fluid carried proppant farther than 56 cm of the fracture length (Xf)
As well as using multi-perforation system at first FPV had the same Xf of proppant as the
single point system At the beginning of injection treatment the fracture propped area looks
similar Later of this treatment the fracture propped area changes because the contribution
of perforations were changed
Figure 3 presents the EDL of different perforation numbers A multi-perforation
system setup used consists of four perforations single-perforation system (top perforation
103
and bottom perforation) The results show that EDL varied tediously in all cases For
example the EDL of the top perforation (single point) was around 71 whereas the EDL
of the multi-perforation system was about 67 Therefore the changes in EDL are very
small between the two different perforation systems
Figure 2 Effect of number of perforations at first FPV
Interestingly Figures 4 and 5 display how different numbers of perforations can
influence the fracture propped area Contribution of proppant transport during top
perforation (single point) leads to have better results compared to a multi-perforation
system Approximately 66 and 48 of fractures were propped using top perforation and
multi-perforation respectively Based on this findings limited-perforation system would
have probably better propped fracture area compared to multi-perforation system
0
5
10
15
20
25
30
0 10 20 30 40 50 60
Fra
ctu
re h
eig
ht
cm
Distance from fracture inlet cm
Top Perf (single inlet) Bottom Perf (single inlet) Multi-Perf System
104
Figure 3 Effect of number of perforations on EDL
Figure 4 Effect of number of perforations on fracture propped area
Figure 5 Real picture of experiment results shown number of perforation effect on
proppant transport Top-perf (left) Bottom-perf (middle) and Multi-perf (right)
0
10
20
30
40
50
60
70
80
90
100
Top - Perf (single Perf) Bottom-Perf (single
Perf)
Multi-Perf
Eq
uil
ibri
um
du
ne
lev
el
(ED
L)
Number of Perforation
0
20
40
60
80
100
Top - Perf (single Perf) Bottom-Perf (single Perf) Multi-PerfFra
ctu
re p
rop
ped
are
a
Number of perforation
Slu
rry
ou
tlet
Top-Perf (Single Perf) Bottom-Perf (Single
Perf) Multi-Perf
Slu
rry
in
let
inje
cti
on
105
32 PERFORATION OPENING SIZE EFFECT
To study the perforation opening size impact on proppant transport 100 60
40 perforation opening size high shear rate 60 (1s) fracture orientation (vertical
fracture) proppant size 100 mesh and multi-perforation system were used Figure 6 shows
that at the first FPV proppant is transported farther by decreasing the perforation opening
size from 100 to 40 because fluid velocity increases with decreasing perforation
diameter To illustrate this at the first FPV the Xf of proppant inside the fracture was 56
cm 52 cm and 48 cm from the fracture inlet of 40 60 and 100 perforation opening
size respectively
Gruesbeck and Collins (1982) noticed that changing the perforation diameter from
38 to frac12 inch did not affect proppant transport performance However our study results do
not completely agree with their conclusion In 60 perforation opening size case the EDL
reached to over 80 EDL which represented almost 17 of the EDL higher than both
perforation opening size cases 100 and 40EDL as shown in Figure 7
Figure 6 Effect of perforation opening size at first FPV
0
5
10
15
20
25
30
0 10 20 30 40 50 60
Fra
ctu
re h
eig
ht
cm
Distance from fracture inlet cmMulti 100 opening Perf Multi 60 opening Perf
106
Figure 7 Effect of perforation opening size on EDL
Figures 8 and 9 show a similar trend for fracture propped area where decreasing
perforation opening size to 60 leads to a 21 increase in fracture propped area compared
to the100 opening When the opening size was decrease to 40 only a 3 impact on
fracture propped area was observed compared to 100 fully opened perforations
Figure 8 Real picture of experiment results shown perforation opening size effect on
proppant transport perf opening 100 (left) perf opening 60 (middle) and perf
opening 40 (right)
0
10
20
30
40
50
60
70
80
90
100
Opening 100 Opening 60 Opening 40
Eq
uil
ibri
um
du
ne
lev
el (
ED
L)
Perforation opening size
Slu
rry
in
let
inje
ctio
n
Slu
rry
ou
tlet
prod
uct
ion
Perf Opening 60 Perf Opening 40 Perf Opening 100
107
33 SHEAR RATE EFFECT
To study the shear rate impact on proppant transport 100 perforation opening
size multi-perforation system fracture orientation (vertical fracture) and proppant size
100 mesh were all kept constant for this investigation Figure 9 based on results attained
from the first FPV proppant reached farther into fracture tip at high shear rate of 60 119904minus1
with a hight height around 2 cm of the total fracture height in the sand bed At a low shear
rate of 35 119904minus1 poppant did not transport deep and proppant height was larger with
approximately 4 cm proppant height Overall it could be said that at the beginning of
fracture treatment higher shear rates can form a smaller proppant bed and a longer
distribution close to the fracture tip while at low shear rates there is less proppant
distribution and larger sand beds
Figure 9 Effect of fracture shear rate at first FPV
Figure 10 amp11 show EDL inside the fracture at high (60119904minus1) and low shear rate
(35119904minus1) At low shear rate proppant bank formed near wellbore whereas However due to
0
5
10
15
20
25
30
0 10 20 30 40 50 60
Fra
ctu
re h
eig
ht
cm
Distance from fracture inlet cm
Multi system - 60 S-1 Multi system - 35 S-1 Multi system - 8 S-1
108
vertexes around wellbore proppant bank moved farther because swirls play major
mechanism during proppant transportat so proppant bank near well wellbore is less In
contrast decreasing shear rate leads to high proppant dune level and much proppant
accumulate near wellbore Erosional effects play a major role at high shear rates which
majorty affecte EDL This consistency in results with ALotibi at al (2015) confirming that
better proppant performance can be obtained by applying a lower shear rate
Figure 12 shows the EDL as a function of shear rate At low shear rates increasing
the settling velocity increases EDL by 78 while the increasing shear rate to 60119904minus1 caused
increased erosional forces and decreases EDL by 65 Generally these results implied that
equilibrium dune level is inversely proportional with shear rate
Figure 10 Real picture of experiment results shown shear rate effect on proppant
transport high shear rate (left) and low shear rate (right)
Slu
rry
ou
tlet
pro
du
ctio
n
Shear Rate 60119956minus120783
Slu
rry
in
let
inje
ctio
n
Slu
rry
ou
tlet
pro
du
ctio
n
Shear Rate 35119956minus120783
Slu
rry
in
let
inje
ctio
n
109
Figure 11 Effect of high (60119904minus1) and low (35119904minus1shear rates on EDL
Additionally Figure 13 showed that varying shear rate from 60 119904minus1 to 35 119904minus1
causes a 23 reduction in fracture propped area Decreasing fracture propped area can
negatively affect fracture conductivity and reduce productivity of the well These results
agree with previous work done by Melhotra (2016) and Li et al (2016) whose results
found that increasing injection rate leads to a decrease in the dune height level
Figure 12 Effect of shear rate on EDL
0
5
10
15
20
25
30
0 10 20 30 40 50 60
Fra
ctu
re h
eig
ht
cm
Distance from fracture inlet cm
High shear
rate
0
20
40
60
80
100
Eq
uil
ibri
um
du
ne
level
(ED
L)
Shear rate (1s)
35 60
110
Figure 13 Effect of shear rate on on fracture propped area
34 FRACTURE ORIENTATION EFFECT
To study the fracture orientation impact on proppant transport 100 perforation
opening size multi-perforation system high shear rate of 60 (1s) and proppant size 100
mesh were all kept constant variables Figure 14 shows proppant transport behavior at the
first FPV of the fracturing treatment Results show that proppant amount had delivered
deeper to fracture tip in inclined fracture compared to vertical fracture At the fracture tip
proppant dune height in inclined fracture was three times (3 cm) the proppant dune height
(1 cm) in vertical fracture The placement of proppant transport during vertical fractures
remaining stable on proppant bed The reason behind this is that in vertical fractures three
forces (gravity buoyancy drag) control particle settling whereas in inclined fractures in
addition to the original three forces frictional forces dominate the particles movements and
reduce proppant settling velocity
0
20
40
60
80
100
Frc
act
ure
pro
pp
ed a
rea
Shear rate (1s)
35 60
111
Figure 14 Effect of fracture orientation (vertical vs inclined) at first FPV
Figure 15 shows the fracture orientation effect on equilibrium dune level In
inclined fractures EDL is larger than in vertical fractures because reduction in settling
velocity is a function of friction forces Ba Geri et al (2018) As a result 13 of EDL
enhancement occurred in inclined fractures compared to vertical fractures
Figure 15 Effect of fracture orientation (vertical vs inclined) on EDL
0
5
10
15
20
25
30
0 10 20 30 40 50 60
Fra
ctu
re h
eig
ht
cm
Distance from fracture inlet cm
Vertical Fracture
Inclined Fracture
0
10
20
30
40
50
60
70
80
90
100
Inclined Vertical
Eq
uil
ibri
um
du
ne
lev
el (
ED
L)
Fracture Orientation
112
Figures 16 and 17 show the fracture orientation effects on fracture propped area
The fracture propped area was around 52 and 48 in the inclined fracture and vertical
fracture respectively This result indicated that fracture propped area has the same trend
as EDL which is around 8 improvement on fracture propped area noticed in inclined
fracture compared to vertical fracture This result might imply that inclinded fracture could
have better fracture conductivity compared to vertical fracture These observations
matched our previous experimental results Ba Geri et al (2018) and simulation work
results Kou et al (2018) where both confirmed that proppant transport efficiency ismuch
better in inclined fractures than in vertical fractures
Figure 16 Effect of fracture orientation (vertical vs inclined) on fracture propped area
0
20
40
60
80
100
Inclined Vertical
Frc
act
ure
pro
pp
ed a
rea
Fracture orientation
113
Figure 17 Real picture of experiment results shown perforation opening size effect on
proppant transport inclined fracture (left) and vertical fracture (right)
35 PROPPANT SIZE DISTRIBUTION EFFECT
To study the proppant size impact on proppant transport 100 perforation opening
size multi-perforation system high shear rate 60 (1s) and fracture orientation (vertical
fracture) were all kept constant during experiment Figure 18 shows proppant height in the
fracture as a function of proppant traveled distance from fracture inlet at 1st FPV Due to
the size effect it is clearly observed that using large proppant size 2040 settled near the
wellbore whereas small proppant sizes (100 mesh and 4070 mesh) settled uniformly across
the whole fracture section The results observed form using proppant size 2040 mesh
showed that proppant height near wellbore was 6 cm while the proppant height decrease
farther from wellbore inlet to about 2 cm in fracture center and fracture tip In contrast
using small size of proppant like 100 mesh formed same level of proppant height along the
fracture slot without any significant change near wellbore
Slu
rry
in
let
inje
ctio
n
Inclined Fracture
Slu
rry
ou
tlet
prod
uct
ion
Vertical Fracture
114
Figure 18 Effect of proppant size at first FPV
Figure 19 shows that there is a linear relationship between equilibrium dune level
and proppant size distribution The EDL is increased rapidly from 67 to 90 when size
of proppant increased from 100 mesh to 2040 mesh at higher shear rate 60119904minus1
respectively The results agree with Tong et al (2016) including that equilibrium dune level
increased with increasing proppant size at higher shear rates
Figure 19 Effect of proppant size on EDL
0
5
10
15
20
25
30
0 10 20 30 40 50 60
Fra
ctu
re h
eig
ht
cm
Distance from fracture inlet cm
100 mesh
4070 mesh
2040 mesh
0
20
40
60
80
100
100 4070 2040Eq
uil
ibri
um
du
ne
lev
el (
ED
L)
Proppant size mesh
115
Figure 20 Effect of proppant size on on fracture propped area
Figures 20 and 21 present the effect of proppant size on fracture propped area The
graph shows that increasing proppant size cause a reduction in proppant settling velocity
and proppant bank formed around wellbore as shown when 2040 proppant size used On
contrast using a small size of proppant such as 100 mesh leads to less proppant FPA
Interestingly 4070 proppant size provided the best results where FPA almost close of
2040 FPA
Figure 21 Real picture of experiment results shown proppant size effect on proppant
transport 100 mesh (left) 4070 mesh (middle) and 2040 mesh (right)
0
10
20
30
40
50
60
70
80
90
100
100 4070 2040
Fra
ctu
re p
rop
ped
are
a
Proppant size mesh
Slu
rry
ou
tlet
prod
uct
ion
Slu
rry
in
let
inje
ctio
n
100 Mesh 4070 Mesh 2040 Mesh
116
4 DISCUSSION
41 EFFECT OF PRESSURE LOSS ALONG THE FRACTURE SLOT ON
PROPPANT TRANSPORT PERFORMANCE
Figures 22 a and b show pressure difference across fracture calculated from
equation 5 and propped fracture area as a function of slurry shear rate Results show a linear
relationship between pressure loss across fracture and propped fracture area with shear rate
Fracture treatments using high shear rate bcause high pressure drops in the fracture which
decreasing fracture propped area by 23 compared to using low shear rates
Figure 22 a and b pressure loss along fracture slot on shear rate (left) and shear rate
effecton Fracture propped area (right)
Applying equation (5) to calculate pressure drop across fracture slot is shown in
Table 3 Linear relationship between pressure losses and EDL and Xf at 1st fracture pore
volume (FPV) was noticed At the beginning of injection treatment high shear rate 60119904minus1
delivered the proppant fracture to fracture tip 54 cm with EDL 158 cm In contrast we
noticed that by decreasing the shear rate to 35119904minus1 the EDL was 41 cm while the proppant
to 50cm of fracture length As result of increasing shear rate changing on EDL and
0
20
40
60
80
100
Frc
act
ure
pro
pp
ed a
rea
Shear rate (1s)
35 60
0
5
10
15
20
Shear Rate (1s)
ΔP
acr
oss
fra
ctu
re s
lot
psi
60 35 8
117
proppant Xf occurred because the pressure loss across the fracture increased from 98 psi
to 162 psi
Table 3 Shows pressure losses effect at 1st FPV on EDL and Xf
At 1st FPV
Shear
rate (119904minus1)
ΔP across
slot (psi)
EDL
(cm)
Xf
(cm)
High 60 162 158 54
low 35 98 41 50
42 MECHANISMS OF PROPPANT TRANSPORT
The mechanisms of developing proppant transport within the fracture slot are
summarized in Table 5 Proppant dune level development (PDLD) was used to determine
the dominate mechanism of each stage of these foure stages by applying Eqaution
421 Stage 1 Hindered and Free Settling This stage occurs when EDL started
forming height and continues until the of PDLD is 15 and the buildup angle is between
0deg to 93deg Due to increasing of sand dune height at the beginning of this stage proppant
particles do not roll inside the fracture Thus large size 2040 mesh of proppants were
moving as clusters or groups and spread along the fracture referring as ldquohindered settlingrdquo
While changing proppant size to the fine particles 100 mesh settled freely farther in
fracture
422 Stage 2 Saltation In this stage PDLD reaches 15 to 42 while the buildup
angle ranges from 93deg to 193deg Saltation is the only mechanism observed in this stage due
to lift force of the proppant The physical dynamics of the is lifting force plays a major role
in moving the particles by causing the proppant to jump and leave the sand bed surface
118
Because of the speed difference between the flow above and below the particles the
pressure difference acts as a liftting force Therefore the particle jumps and leaves as a
result of the force caused by the pressure difference exceeding the force of gravity Around
18 of PDLD is developed in this stage leading to reduction in the cross-section flow
area
423 Stage 3 Suspension Rolling and Swirl at Inlet This stage occurrs when
PDLD is between 42 to 71 and the buildup angle is from 193deg to 26deg Three different
mechanisms dominate proppant performance and transport within the fracture suspension
rolling and swirl at the inlet Erosional forces increased causing rolling of the proppant on
the sand bed due to the particle drag force being higher than the gravitational force The
major development above 30 of EDL happened in this stage leading to the presence of
swirl and vortices at the inlet due to high flow turbulence Therefore proppant transport
efficiency is dominated mainly by these vortices
424 Stage 4 Saltation Rolling and Swirl at Inlet This stage occurrs when
PDLD is between 71 and 100 and the buildup angle is between 26deg to 42deg The
combination of three mechanisms controls the proppant transport performance saltation
rolling and swirl at the inlet The vortices which assist in forming the proppant pile shape
The vortex diameter can sometimes be 15 the fracture half-length
The dynamic oscillatory-shear measurements were conducted to measure the
elasticity profile characterizations and first normal stress N1 The oscillatory test was
implemented over a range of frequencies from 001-100Hz All rheological properties
measurements were conducted at lab and high temperature ranges
119
Table 4 Four proppant transport mechanisms to reach the PDLD
425 Thermal Stability Measurement The influence of temperature during
fracturing operations has not been fully understood in shale oil reservoirs This paper
investigated the effect of thermal stability of rheology characterizations of HVFRs which
tends to alter parameters such as time dependency fluid elasticity viscosity and first
normal stress To better mimic the real fracturing process the experiments were performed
under elevated temperatures by using an advanced rheometer Viscosity-shear profile
measurements for three different temperatures of 77 122 176 have been conducted
for both HVFRs and linear gel fracture fluids
426 Static Settling Velocity Measurement At this point the graduated cylinder
is filled with HVFR and the cell is positioned vertically To measure proppant settling
120
velocity in unconfined fluids high-resolution video camera is used to record the settling
process In this setup proppant diameter ranged from 0453 mm to 6 mm A single proppant
was dropped in the HVFR and allowed to settle A high-resolution video camera has been
used to capture the process of free proppant settling An image analysis tool called
ldquoTrackerrdquo ( httpwwwcabrilloedu~dbrowntracker) was applied to get accurate
measurements of vertical position of the proppant at different time steps (Ba Geri et al
2018) The slope of relationship between proppant vertical positions to steps time step is
called terminal settling velocity For more accurate results settling velocity of each particle
were repeated three times
5 CONCLUSIONS
This laboratory study investigated several factors that affect proppant transport
efficacy It has provided new and interesting perceptions into the understanding of proppant
placement and distribution across the fracture The following conclusions can be drawn
from this work
bull Limited-entry technique has a large impact on proppant transport within fractures A
single top perforation had a 27 improvement in the fracture propped area compared
to a multi-perforation system
bull High shear rates have negative effects on the EDL and fracture propped area Increasing
the shear rate caused a decrease in both the EDL by 17 and on fracture propped area
by 23
121
bull Decreasing the perforation opening size can help proppant to travel closer to the
fracture tip at the beginning of the treatment A 60 perforation opening size provided
better results in terms of the EDL and fracture propped area
bull Pressure loss in the fracture slot leads to a decrease in the EDL and fracture propped
area Pressure losses were found to get significantly affected by changing shear rate
from 60119904minus1 to 35119904minus1
bull Four proppant transport mechanisms were noticed that could potential dominate
proppant transport behavior during fracturing treatments Vortices play a major role
when the dune height increases and accumulated near wellbore
REFERENCES
Alotaibi M A amp Miskimins J L (2018 May 1) Slickwater Proppant Transport in
Hydraulic Fractures New Experimental Findings and Scalable Correlation Society
of Petroleum Engineers httpsdoi102118174828-PA
Ba Geri M Imqam A amp Dunn-Norman S (2018 October 5) Proppant Transport
Behavior in Inclined Versus Vertical Hydraulic Fractures An Experimental Study
Society of Petroleum Engineers httpsdoi102118191813-18ERM-MS
Daneshy A A (1973 April 1) A Study of Inclined Hydraulic Fractures Society of
Petroleum Engineers httpsdoi1021184062-PA
Dinh A V amp Tiab D (2010 December 1) Transient-Pressure Analysis of a Well with
an Inclined Hydraulic Fracture Using Type Curve Matching Society of Petroleum
Engineers httpsdoi102118120540-PA
Gruesbeck C amp Collins R E (1982 December 1) Particle Transport through
Perforations Society of Petroleum Engineers httpsdoi1021187006-PA
Kadhim D Imqam A amp Dunn-Norman S (2017 July 24) Ceramic Proppant Transport
and Placement in Heterogeneous Fracture Systems Unconventional Resources
Technology Conference httpsdoi1015530URTEC-2017-2697613
122
Kern L R Perkins T K amp Wyant R E (1959 July 1) The Mechanics of Sand
Movement in Fracturing Society of Petroleum Engineers
httpsdoi1021181108-G
Kou R Moridis G J amp Blasingame T A (2018 January 23) Analysis and Modeling
of Proppant Transport in Inclined Hydraulic Fractures Society of Petroleum
Engineers httpsdoi102118189856-MS
Liu He Zhang Guangming Zhang Jin et al (2010 May) Friction calculation and surface
pressure presiction in oil well hydraulic fracturing Chinese Journal of Rock
Mechanics and Engineering Vol 29 Supp 1
McMechan D E amp Shah S N (1991 August 1) Static Proppant-Settling Characteristics
of Non-Newtonian Fracturing Fluids in a Large-Scale Test Model Society of
Petroleum Engineers httpsdoi10211819735-PA
Medlin W L Sexton J H amp Zumwalt G L (1985 January 1) Sand Transport
Experiments in Thin Fluids Society of Petroleum Engineers
httpsdoi10211814469-MS
Miller C K Waters G A amp Rylander E I (2011 January 1) Evaluation of Production
Log Data from Horizontal Wells Drilled in Organic Shales Society of Petroleum
Engineers httpsdoi102118144326-MS
Patankar NA Joseph DD Wang J Barree RD Conway M and Asadi M 2002
Power Law Correlations for Sediment Transport in Pressure Driven Channel Flow
International Journal of Multiphase Flow Vol 28 Pg 1269 ndash 1292
Sahai R Miskimins J L amp Olson K E (2014 February 4) Laboratory Results of
Proppant Transport in Complex Fracture Systems Society of Petroleum Engineers
httpsdoi102118168579-MS
Tong S amp Mohanty K K (2016) Proppant transport study in fractures with
intersections Fuel 181 463-477
Wang J Joseph DD Patankar NA Conway M and Barree RD 2003 Bi-Power
Law Correlations for Sediment Transport in Pressure Driven Channel Flows
International Journal of Multiphase Flow Vol 29 Pg 475 - 494
Warpinski N R (2010 November 1) Stress Amplification and Arch Dimensions in
Proppant Beds Deposited by Waterfracs Society of Petroleum Engineers
httpsdoi102118119350-PA
123
Willingham J D Tan H C amp Norman L R (1993 January 1) Perforation Friction
Pressure of Fracturing Fluid Slurries Society of Petroleum Engineers
httpsdoi10211825891-MS
Woodworth T R amp Miskimins J L (2007 January 1) Extrapolation of Laboratory
Proppant Placement Behavior to the Field in Slickwater Fracturing Applications
Society of Petroleum Engineers httpsdoi102118106089-MS
Wright C A amp Conant R A (1995 January 1) Hydraulic Fracture Reorientation in
Primary and Secondary Recovery from Low-Permeability Reservoirs Society of
Petroleum Engineers httpsdoi10211830484-MS
124
V VISCOELASTIC CHARACTERIZATION EFFECT OF HIGH-VISCOSITY
FRICTION REDUCERS AND PROPPANT TRANSPORT PERFORMANCE
IN HIGH-TDS ENVIRONMENT
Mohammed Ba Geri1 Abdulaziz Ellafi2 Ralph Flori1 Jerry Noles3 and Sangjoon Kim3
1 Deparment of Petroleum Engineering Missouri University of Science and Technology
Rolla MO 65409
2 Department of Petroleum Engineering University of North Dakota Grand Forks ND
58202
3 CoilChem LLC Washington Oklahoma
ABSTRACT
The viscoelastic property of high-viscosity friction reducers (HVFRs) was
developed as an alternative fracturing fluid system because of advantages such as the
ability to transport particles higher fracture conductivity and the potential of a lower cost
due to fewer chemicals and equipment required on location However concerns remain
about using HVFRs to transport proppant in DI water and harsh brine solutions (eg 2wt
KCl and 10 lbs brine) The primary objective of this study is to investigate the viscoelastic
property in order to understand the true proppant transporting capacity of fracturing fluids
in a high-TDS environment
To address the evaluation performance of HVFRs numerous papers associated
with the viscoelastic property of hydraulic fracturing fluids were investigated and
summarized This paper also provides a full comparison study of viscosity and elastic
modulus between HVFRs and among fracturing fluids such as xanthan polyacrylamide-
based emulsion polymer and guar Moreover viscosity profiles and elastic modulus were
125
conducted at different temperatures Better proppant transportation effect though higher
viscosity through Stokersquos law and the effect on proppant transportation from the elastic
modulus comparison were also investigated Finally the results of the HVFR Conductivity
test and the successful field test were explained
The results of the experimental work show that the viscoelastic property of HVFRs
provides behavior that is able to transport proppant The viscosity profile decreased slightly
as the temperature increased from 75 to 150 when the DI water was used While using
10 lbs brine the viscosity was reduced by 33 The longer polymer chains of HVFR
indicated a better elastic modulus in DI water The elastic modulus also indicated that the
highest values were found at frequency 45 Hz from each amplitude and lower values were
found as the amplitude was increased Although high molecular weight HVFRs were
utilized on the conductivity test the results observed that the regained permeability was up
to 110 Finally the promising results from the case study showed that HVFRs could be
economically and efficiently used for the purpose of proppant transportation and pressure
reduction in high TDS fluids
1 INTRODUCTION
The ultimate aim of hydraulic fracturing treatments in horizontal wells is to increase
the flow and conductivity of unconventional oilgas reservoirs by creating a long fracture
from 100 to 1000 ft and a conductive fracture width in the order of a tenth of an inch The
success of the process strongly relies on selecting appropriate slurry fluids and proppants
since these factors govern the proppant transport to place and fill the conductive pathways
126
connecting with the proppant particles Furthermore the effective behavior of the proppant
distribution is essential to understand increasing the well productivity and economics
especially in the case of tight formations (Ba Geri et al 2018 Shrivastava and Sharma
2018) Therefore fracture fluids and proppants characterization are crucial parameters that
require detailed study in order to achieve a predictable and reliable performance as well as
avoiding the early proppant settling near the wellbore (Acharya 1988 Shah 1993)
Common fracturing fluids that have been used in industry are Newtonian fluids
such as slickwater and non-Newtonian viscous fluids with varying degrees of elasticity
including complex polymer solutions crosslinked foams emulsions and surfactant gels
Early in the shale boom high viscosity fluid conventional crosslinked gel was used as the
Frac fluid system in the formation such as the Bakken Formation to add viscosity and
create fracture width However the post-treatment production test indicates that the fluid
does not achieve the desired hydraulic fracturing design objectives because of its low
capability to carry proppant in the fractures Also field results reported high damage causes
with the high-cost operation as well as environmental concerns (Ba Geri et al 2019a)
Although 95 of fracture treatment jobs switched the pumping fluids to hybrid and
slickwater since their low cost and reaching proppant loading improved long term
production in most US shale plays the water-based fracturing stimulation requires an
enormous consumption of clean water to perform the treatments and tends to increase
environmental issues because of the large amount of flow back water which contains
chemicals and toxic components that impact underground water resources (Li and Zhang
2019) As a result slickwater fracturing fluid becomes undesirable and high viscosity
friction reducers (HVFRs) in fracturing fluids have recently been adopted for use in shale
127
plays since they are low cost and provide an effective proppant transport mechanism
(Harris et al 2009 Hu et al 2015 Gomaa et al 2015 Srinivasan et al 2018 Ellafi A et
al 2019 Ba Geri et al 2018 Ba Geri et al 2019 bampc)
In 1988 Acharya studied the settling rates of proppants and the rheological
parameters of two types of cross-linked gels (titanate and borate cross-linked) using
theoretical transport equations and experimental works This paper concluded that the
proppantrsquos characteristics and rheological parameters for fracturing fluids are crucial
considerations for modeling the proppant transport in hydraulic fracturing design
Moreover Shah (1993) investigated the rheological characterization of the various
concentrations of slurry fluid (hydroxypropyl guar (HPG)) in the range of 3040 and 60
Ibm HPGl000 gal to obtain the flow behavior as a result of differential pressure vs flow
rate into the experimental vertical-fracture-flow model This work used proppant sizes of
2040-mesh sand with three concentration values that varied from 0 to 12 Ibmgal at three
temperature conditions (80 110 and 140degF) The data that was gathered presented
correlations of apparent viscosity as a function of fluid concentration fracture shear rate
experiment temperature and proppant concentration Also the correlation can be used to
model 2D or 3D fracture-design simulators in order to estimate fracture geometry and
extension
In 2000 Samuel et al studied the application of viscoelastic surfactant in tight
formations to minimize fracture height growth and increase effective fracture length The
paper presented case studies for low permeability gas wells in Rock Springs Wyoming
and El Reno Oklahoma Field results based on the pressure transient analysis and tracer
indicated that the viscoelastic surfactant fracturing fluid was more beneficial as fracture
128
fluid treatments in both unconventional and conventional formations compared to
traditional and new generations of cross-linked gels
Furthermore Asadi et al (2002) discussed the method for obtaining fracturing
fluids with zero shear viscosity and how this factor is important to evaluate model and
predict the proppant transport in hydraulic fractures Viscoelastic parameters of the
fracturing fluids were measured as a function of oscillatory frequency to determine zero
shear viscosity by involving Maxwellrsquos model at various relaxation times The authors
reported examples and a detailed explanation on the methodology of the fluid viscosity
elasticity and relaxation time measurements to obtain the zero-shear fluid viscosity In
2005 Harris et al conducted an experimental work on fracturing fluids such as metal and
borate crosslinked fluids linear gel fluids and surfactant gel fluids to show how these
fluid types are different in terms of proppant transport by considering the size and
concentration of proppants using a modified Fann Model 50-type viscometer The
experiment outcomes divided fracturing fluids into three major fluid classes with different
capabilities to transport proppant by considering fracture transport velocity a permanent
network structure and a transient network structure
After that Harris et al (2008) compared three measurement techniques steady
shear measurements dynamic oscillatory shear measurements and slurry viscosity The
approaches were applied to the same fracturing fluids in a previous study for verification
of transport prediction Moreover Walters et al (2009) introduced a new clean
biopolymer-based fracturing fluid that has high conductivity stable viscosity low pipe
friction excellent proppant transport and the capability to be used with produced water
They discussed field trials of 14 frac stages over four wells Based on their evaluation this
129
fracturing treatment fluid can provide excellent proppant transport with high fracture
conductivity in tight formations In 2015 Gomaa et al studied the minimum rheological
properties required for effective transport behavior of the proppants by using combinations
of rotational and oscillatory measurements They observed that fracturing additives may or
may not enhance the carrying of the proppants based on the internal fluid structure
Furthermore Hu et al (2015) examined the settling behavior of the carboxymethyl
hydroxypropyl guar (CMHPG) crosslinked with borate by correlating with the rheological
properties of the fluids The authors concluded that the main mechanisms during proppant
transport to enhance particle suspension or transportation are shear thickening and elastic
lifting The research outcome provided guidance to develop the chemistry of fracturing
treatment fluids Huang et al (2018) conducted experimental research to study the effect
of injection parameters on the proppant transport behavior by using different polymer
concentrations in rough vertical hydraulic fractures The results showed that effective
vertical proppant flow occurred when a high polymer slurry concentration was used
In 2018 Aften studied five HVFRs to investigate the viscosities and apply eight
factors for example temperature hydration approach polymer concentration brine
composition additive interaction and pumping and tubular transport using response
surface methodology This study established a reliable approach for gauging performance
and examining the field operations of HVFR systems in a high-TDS environment Finally
Ba Geri M et al (2019 a b c amp d) conducted several studies on HVFR fluids to
investigate the rheological behavior and its effect on the static proppant settling velocity
The research outcomes showed interesting insights into the understanding of high viscous
friction reducer fracture fluids compared to linear gel and slickwater fracture fluids To
130
evaluate the performance of HVFRs on proppant transport a comprehensive literature
review was developed including laboratory work simulation investigation and field case
studies that were summarized and analyzed to understand the viscoelasticity properties of
HVFRs
This research aims to investigate the viscoelastic property that can help to
understand the true proppant transport capacity of fracturing fluids To evaluate HVFRs
performance a full comparison study between HVFRs and three different fracturing fluids
such as xanthan polyacrylamide-based emulsion polymer and guar was provided These
fracturing fluids were examined on different water quality DI water 2 wt KCl and 10
lbs brine (saturated NaCl Solution (TDS 347000 ppm)) In addition viscosity profiles
and elastic modulus were conducted at different temperatures also proppant settling rates
were tested Finally successful field implementations using the new HVFR system were
fully explained
11 PRODUCED WATER IN USA BASINS
Using produced water instead of fresh water is gaining traction to minimize
freshwater usage reduce environmental impacts and increase hydrocarbon recovery from
unconventional formations However generally polymer friction reducers perform more
poorly in high salinity waters High salinity produced waters are more common in the
Marcellus the Permian and the Bakken basins with TDS (total dissolved solids) levels
measured at 43000 ppm 350000 ppm and over 225000 ppm respectively (Be Geri M
et al 2019a Whitfield S 2017)
131
A high salinity environment and hardness are the main barriors to using produced
water as a fracturing fluid-based system due to their negative effect on the fracture fluid
elastic profile as well as the hydration process required to build up enough viscosity to
carry or transport proppant The lifetime and the magnitude of the viscoelastic property of
fracturing fluids depends on several factors such as the source of water (eg levels of TDS
and hardness) polymer dosage fluid pH and test temperature (Li L et al 2014) Thus
switching based-fracturing fluids from fresh water to a high-TDS water system was not an
easy task for the operators and service oil companies
This research used a new high viscosity friction reducer (HVFR) as an alternative
fracturing fluid for downhole conditions with temperature ranges between 150 to 250
The HVFR system proved compatible with high-TDS environments that exceed 340000
ppm Four different fracturing fluids (HVFR xanthan polyacrylamide emulsion polymer
and guar) were tested The HVFR displayed have better viscoelastic performance than the
other tested fluids for transporting the proppant
2 EXPERIMENT DESCRIPTION
21 EXPERIMENT MATERIALS
211 Fracturing Fluids Four different samples of friction reducers were
prepared HVFR xanthan polyacrylamide-based emulsion polymer and guar HVFR
xanthan and guar were slurries containing 3 lbs per gal The polyacrylamide emulsion
polymer was used by itself In this test each product sample was added in DI water 2 wt
KCl and 10 lbs brine (saturated NaCl Solution (TDS 347000 ppm)) following the ratio
132
of 2 gal per 10 bbl The HVFR is anionic polymer and the molecular weight is 18 to 26
million (gmole) Table 1 shows the molecular weight of the tested friction reducers
212 Frac Sand and Dosage To measure the settling rate Ottawa Frac Sand
2040 (particle density 2212 lbsgal) employed was The dosage of frac sand in each
HVFR fracturing fluid was 05 lbs per gallon
Table 1 The molecular weight of friction reducers
Friction Reducers Molecular Weight (gmole)
HVFR 18000000-26000000
Xanthan 1000000-7000000
Emulsion 6000000-11000000
Guar 50000 ndash 8000000
22 MEASUREMENTS OF RHEOLOGICAL PROPERTY
Based on the hydraulic fracturing industry practice the shear rates while pumping
the fluid slurry into the fractures are within the range 10 119904minus1 to 170 119904minus1as well as 511 119904minus1
to determine fluid apparent viscosity In lab studies the common shear rate was either 40
119904minus1 or 100 119904minus1 (Hu et al 2015 Gomaa et al 2015 Ba Geri M et al 2019d)
221 Friction Reducers Preparation for Rheological Property Four friction
reducers were prepared HVFR xanthan polyacrylamide emulsion polymer and guar
HVFR xanthan and guar were dry powder and were mingled with modified base oil to be
compared with the viscosity profile of emulsion polymer The HVFR xanthan and guar
slurries contained 3 lbs of dry solid per gal The polyacrylamide emulsion polymer was
133
used by itself in this test Each product sample was added in DI water 2 wt KCl and 10
lbs brine (saturated NaCl solution (TDS 347000 ppm)) as the ratio of 2 gal per 10 bbl
222 Fracturing Fluid Viscosity Measurement This study investigated the
viscosity of fracturing fluids at share rates 40 119904minus1 100 119904minus1 and 170 119904minus1 Before measuring
the viscosity of each fracturing fluid the fluid was vigorously stirred in the beaker for 30
min The viscosity reading was set to two temperatures ambient 75 and 150
223 Elasticity Characterization (Elastic Modulus Grsquo) Several methods can
be used to measure the elastic properties of viscoelastic fluid such as the viscoelastic
characterization of the fracturing fluids N1 relaxation time the dynamic oscillatory
frequency test and the amplitude sweep test This study investigated the viscoelasticity
behavior of the tested fluid by testing dynamic oscillatory frequency through M5600
(Grace Instrument)
224 Friction Reducers Preparation for Elasticity Property HVFR xanthan
polyacrylamide emulsion polymer and guar were prepared to compare the elastic modulus
of each fracturing fluid Dry HVFR xanthan and guar were suspended in modified base
oil The slurry contained 3 lbs of active ingredient per gal In addition polyacrylamide
emulsion polymer was tested by itself The dosage rate of each slurry was 2 gal per 10 bbl
of DI water and 10 lbs brine solution The hydraulic fracturing fluid was stirred for 30
min prior to measuring the elastic modulus
225 Elastic Modulus Measurement The elastic modulus was measured by
oscillatory motion M5600 (Grace Instrument) was used for this test and set up with
frequencies in increments from 05 to 45 Hz by 05 Hz and amplitudes at 50 200 and
400 The elastic modulus value was calculated by averaging four times measurement
134
23 THE SETTLING RATE MEASUREMENT OF FRAC SAND IN HVFR
FRACTURING FLUID
231 HVFR Fracturing Fluid Preparation Four HVFR fracturing fluids were
prepared to research the frac sand settlement rate in a viscous solution The HVFR dosage
was 05 075 10 and 125 gal per 1000 gal of fresh water The HVFR fracturing fluid
was stirred for 30 min and then was poured into a 1000 ml round glass cylinder
232 Test Method on Frac Sand Settlement Rate Following the ratio of 05 lbs
of frac sand per 1000 gal of fracturing fluid frac sand was placed in a 1000 ml cylinder
The cylinder stopper was completely sealed to prevent fluid loss The cylinder was
vigorously shaken to disperse frac sand evenly in the cylinder for 20 sec As soon as the
cylinder was placed on the table the time was started and then stopped once all of the frac
sand had settled to the bottom of the cylinder The measurement was repeated three times
on each fracturing fluid and the values were averaged
3 RESULTS AND ANALYSIS
31 THE VISCOSITY PROFILES OF VARIOUS FRICTION REDUCERS IN DI
WATER 2 WT KCL AND 10 LBS BRINE (SATURATED NACL
SOLUTION (TDS 347000 PPM))
Of all fluid sources HVFR represented the highest viscosity as shown in Figures
1 2 and 3 while xanthan polyacrylamide emulsion and guar showed mixed results
depending on water conditions The viscosity variation in different water conditions might
be affected by molecular weight and chemical structure Table 1 shows the different
molecular weights of HVFR xanthan emulsion polymer and guar HVFR has a relatively
high molecular weights while xanthan emulsion polymer and guar have low molecular
135
weight At about 50 higher the molecular weight of HVFR helped it become heat resistant
and viscous in all types of fluids Thus the HVFR fracturing fluid system can suspend and
transport proppant deeper into the fractures Proppant suspension and transportation can be
explained by Stokersquos law which is covered by a later section in this paper proppant settling
rate result
From Figure 1 using DI water at a low shear rate of 40 sminus1 and increasing the
temperature from 75 to 150 caused the viscosity profile of HVFR to slightly decrease
from 14868 cp to 14147 cp respectively The same trend was noticed at a high shear rate
of 170 sminus1 In contrast Figure 3 shows that changing the water quality from DI water to
10 lbs Brine (Saturated NaCl Solution) at the low shear rate 40 119904minus1 caused the viscosity
of HVFR to drop sharply by 33 from 2724 cp to 1826 cp while increasing the
temperature from 75 to 150
The effect of fracture fluid on the viscosity profile can be illustrated by Figure 3
At room temperature 75 and high-TDS water both HVFR and guar indicated quite close
viscosity readings and both polyacrylamide emulsion and xanthan fluids exhibited similar
viscosity profiles however synthetic polymers HVFR and polyamide emulsion polymer
represented better viscosity reading This means that the synthetic chemical structure is
more heat resistant than guar and xanthan structures created by nature The results revealed
similar thermal properties of HVFR and emulsion polymer from the viscosity readings in
the 2wt KCl solution as well HVFR and emulsion showed less viscosity reduction than
guar and xanthan comparing the viscosity values at 75 and 150
136
Figure 1 The viscosity profile of various friction reducers in DI water
Figure 2 The viscosity profile of various friction reducers in 2wt KCl solution
Figure 3 The viscosity profile of various friction reducers in 10 lbs brine
0
40
80
120
160
200
Vis
co
sit
y (
cp
s)
at
75 O
F
Shear Rate (1s)
Dosage 2 gal per 10 bbl
Fluid DI water
HVFR
Xanthan
Polyacrylamide Emulsion
Guar
40 100 1700
40
80
120
160
200
HVFR
Xanthan
Polyacrylamide Emulsion
Guar
Dosage 2 gal per 10 bbl
Fluid DI water
Vis
co
sit
y (
cp
s)
at
15
0 O
F
Shear Rate (1s)
40 100 170
0
5
10
15
20
25
30
35
40
Vis
co
sit
y (
cp
s)
at
75
OF
Shear Rate (1s)
40 100 170
Dosage 2 gal per 10 bbl
Fluid 10 lbs brine solution HVFR
Xanthan
Polyacrylamide Emulsion
Guar
0
5
10
15
20
25
30
Dosage 2 gal per 10 bbl
Fluid 10 lbs brine solution HVFR
Xanthan
Polyacrylamide Emulsion
Guar
40 100 170
Shear Rate (1s)
Vis
co
sit
y (
cp
s)
at
150 O
F
137
32 THE N AND K VALUES OF VARIOUS FRICTION REDUCERS IN DI
WATER 2 WT KCL AND 10 LBS BRINE (SATURATED NACL
SOLUTION (TDS 347000 PPM))
Table 2 represents the values of n and K which are called flow behavior index
and flow consistency index respectively Flow behavior index determines rheological
properties Newtonian or non-Newtonian while flow consistency index measures the yield
stress of fluid As published in other papers all of the friction reducers in this test have
indicated a non-Newtonian fluid shear thinning as n value is less than 1 In Di water
HVFR showed the most shear thinning characteristics through the lowest n while guar
was less affected by the shear rate than others In 2 wt KCl and 10 lbs brine solutions
the n values of HVFR and k guar are relatively higher comparing to xanthan and emulsion
polymer It means the viscosity of HVFR and guar is less affected by the shear rate
increments Although considering the true viscosity value the higher n value may be
interpreted as better suspension effect on proppant transportation because the viscosity
reduction percentage from low shear rate to high shear rate should be smaller than other
cases with lower n value The viscosity reading at various shear rates and the n value
should be helpful to evaluate the capability of fracturing fluid to transport proppant
33 THE ELASTIC MODULUS COMPARISON OF VARIOUS FRICTION
REDUCERS IN DI WATER AND 10 LBS BRINE SOLUTION (TDS 347000
PPM)
Figure 4 shows the effect of frequency and amplitude on the elastic modulus The
elastic modulus was increased as the frequency was increased while the amplitude
increment lowered the elastic modulus
138
Table 2 The n and K values with viscosities reading of friction reducers in various
fluids
Fluids Friction
Reducers
Temp
(degF) n K
Visc
40(1s) cP
Visc
100(1s) cP
Visc
170(1s) cP
DI
Water
HVFR 76 022 471 14868 7252 4786
150 015 579 14147 6493 4136
Xanthan 802 033 178 8693 4726 332
151 037 131 7242 4067 2912
Emulsion
Polymer
81 037 077 4336 2443 1753
151 031 081 3587 1903 1319
Guar 80 060 016 2053 1426 1155
151 054 011 1148 752 589
2
wt KCl
HVFR 744 055 031 3299 219 1728
151 047 029 2276 1401 1058
Xanthan 76 010 061 122 536 333
152 006 058 983 417 254
Emulsion
Polymer
74 036 038 2041 1135 807
151 024 052 1835 918 615
Guar 746 052 025 2373 1526 1181
151 041 024 151 879 643
10
lbs
Brine
Solution
HVFR 82 051 030 2724 1741 1344
151 049 022 1826 114 868
Xanthan 79 019 044 1232 585 38
1516 012 048 1018 453 284
Emulsion
Polymer
83 014 062 1439 654 414
151 009 078 1448 626 385
Guar 79 061 021 2742 1925 1568
151 056 012 1326 889 705
This means that the physical activity of polymer is chains directly related with the
elastic modulus The short wavelength by frequency increment made polymer chains more
active in the solution and caused the increment of the elastic modulus The longer polymer
chains (higher molecular weight) of HVFR indicated a better elastic modulus in DI water
than the other tested fracturing fluids Figure 5 represents the elastic modulus of friction
reducers in 10 lbs brine at 75 150 and 250 First of all it was difficult to properly
139
interpret the elastic modulus characteristics of friction reducers at 150 and 250 because
the abundant cations in 10 lbs brine solution interrupted the hydration of the friction
reducers and furthermore the high temperature made the polymer chains loose Both
factors lowered elastic modulus values The very low the elastic modulus values at 150 and
250 in the 10 lbs brine solution might be caused by reading errors of the M5600
instrument Thus the results would observe only the elastic modulus in the 10 lbs brine at
75 guar elastic modulus seemed comparable with HVFR because the diol groups of
guars let the polymer chains crosslinked with cations (sodium) in 10 lbs bine solution The
increment of crosslinking density helped the elastic modulus improve
34 PROPPANT SETTLING RATE RESULT
The settling rate was calculated with the fluid height 3366 cm in a 1000 ml
cylinder and equalize frac sand settlement time (sec) Figure 6 represents the settling rate
of frac sand with various HVFR dosages The settling rate was reduced with HVFR dosage
increment This result can be explained using Stokersquos Law shown in equation (1) The
settling velocity and fluid viscosity are in inverse proportion to each other proving that the
relatively higher viscosity of HVFR represents better proppant transportation capability
when compared to other friction reducers such as xanthan and emulsion polymer The
results show that increasing the dosage of HVFR from 05 gpt to 125 gpt exhibited a slower
settling rate of the proppant by three times from 12 cms to 04 cms respectively
Stokersquos Law for Settling Solids
140
119881 =119892((
1205881120588
)minus1)1198892
18 υ (1)
Table 3 The effect of dosage of HVFRs on proppant settling rate
Figure 4 Frac sand settling rate comparison with various HVFR dosage
V Settling Velocity of the Solid
g acceleration of gravity
ρ1 Mass Density of the Solid
ρ Mass Density of the Fluid
d Diameter of the Solid (Assuming Spherical)
υ Kinematic Viscosity of the Fluid
Dosage per 1000 gal
(Polymer Concentration) Settling Rate (cms)
050 gal 117
075 gal 079
100 gal 060
125 gal 044
141
Figure 5 The elastic modulus measurement of HVFR xanthan emulsion polymer and
guar at 75 150 and 250 in DI water (left) 10 lbs brine solution (right)
35 HVFR ELASTIC MODULUS CHARACTERISTICS BY AMPLITUDE
FREQUENCY FLUID TYPE AND TEMPERATURE
As shown in Figures 7 8 and 9 the elastic modulus of HVFR could be determined
by amplitude frequency fluid type and temperature In this study the HVFR dosage was
2 gal per 10 bbl The elastic modulus of HVFR fracturing fluid was presented with various
frequencies and amplitudes in Figure 7 The frequencies and amplitudes affect the polymer
chains motion responding to the elastic modulus of fracturing fluid As shown in Figure
0
05
1
15
FR1405
Xanthan Gum
Emulsion Polymer
Guar Gum
At 250 OF
Ela
sti
c M
od
ulu
s (
G)
(d
yn
cm
2)
HVFR
0
02
04
06
08
1
FR1405
Xanthan Gum
Emulsion Polymer
Guar Gum
At 150 OF
Ela
sti
c M
od
ulu
s (
G)
(d
yn
cm
2)
HVFR
0
1
2
3
4
FR1405
Xanthan Gum
Emulsion Polymer
Guar Gum
At 75 OF
Ela
sti
c M
od
ulu
s (
G)
(d
yn
cm
2)
HVFR
Amplitude
50
Amplitude
200
Amplitude 400
Frequency 05-
0
5
10
15
20
25
30
35
40
Ela
sti
c M
od
ulu
s (
G)
(d
yn
cm
2)
At 250 OF
Xanthan
Emulsion Polymer
Guar
HVFR
0
10
20
30
40
50
60
Xanthan
Emulsion Polymer
Guar
Ela
sti
c M
od
ulu
s (
G)
(d
yn
cm
2)
At 150 OF HVFR
0
10
20
30
40
50
60
Ela
stic
Mo
du
lus
(G)
(dyn
cm
2 )
At 75 OF
Xanthan
Emulsion Polymer
Guar
HVFR
Amplitude 50
Frequency 05-
Amplitude 200
Amplitude 400
142
7 the elastic modulus indicated the highest values at the frequency 45 Hz from each
amplitude and lower values were indicated as the amplitude was increased The higher
wavelength raised the elastic modulus as the shear stress was increased while the higher
amplitude reduced the value of elastic modulus as stretching out the polymer chains length
ways and losing elastic property in result
This study will be useful for designing fracturing fluids with optimal proppant
transportation conditions The higher elastic modulus helps proppants suspended in fluid
by polymer chains activity Figure 8 shows the HVFR elastic modulus characteristics by
water condition Plenty of cations in the 10 lbs brine solution (TDS 347000 ppm)
hindered the chainsrsquo stretching of high molecular weight polymer and resulted in a low
elastic modulus The temperature also affected the elastic modulus of HVFR fracturing
fluid as presented in Figure 9 The elastic modulus readings at 250 were significantly
reduced as the polymer chains become slack
Figure 6 The elastic modulus characteristic of HVFR by amplitude and frequency at
room ambient
0
10
20
30
40
50
60
Elas
tic M
odul
us (G
)(dy
ncm
2 )
HVFR
Fluid DI water
Amplitude 50
Frequency 05-45 Hz
Amplitude 200
Frequency 05-45 Hz
Amplitude 400
Frequency 05-45 Hz
143
36 HVFR ELASTIC MODULUS PROFILES IN DI WATER amp 10 LBS BRINE
(TDS 347000 PPM)
Figure 8 presents elastic modulus Grsquo as a function of frequency (Hz) at 400
amplitude for 2 gal per 10 bbl of HVFR at two different water qualities DI water (left)
and high-TDS water with 10 lbs brine (right) Case I using DI water with HVFR provides
a strong elastic profile and linear relationship by increasing the test frequency the elastic
modulus Grsquo increase In contrast with case II at high-TDS (340000 ppm) the elastic
modulus increased until the frequency reached 2 Hz After that the elastic modulus
decreased sharply and came close to the zero dincm2
Generally speaking water salinity plays a key role in changing the fluid elasticity
negatively To illustrate at 2 Hz the elastic modulus was 1515 dyncm2 and 183 dyncm2
in both DI water and 10 lbs brine respectively The cations efficiency reduces in high-
TDS water due to the presence of high cations like magnesium and calcium causing
polymer precipitation These polyvalent ions in high-TDS environments can cause
electrostatic crosslink of the polymer which in tum causes precipitation Aften W (2010)
Figure 7The elastic modulus characteristic of HVFR by fluids (DI Water vs 10 lbs
brine)
5
10
15
20
25
30
0 05 1 15 2 25 3 35 4 45 5
HVFR
Ela
sti
c M
od
ulu
s (
G)(d
yn
cm
2)
Frequency (Hz)
Fluid DI WaterAmplitude 400
0
05
1
15
2
25
3
0 05 1 15 2 25 3 35 4 45 5
HVFR
Ela
sti
c M
od
ulu
s (
G)
(dy
nc
m2)
Frequency (Hz)
HVFRFluid 10 lbs BrineAmplitude 400
144
37 HVFR ELASTIC MODULUS PROFILES BY TEMPERATURE
Figure 9 shows elastic modulus Grsquo as a function of frequency (Hz) at 400
amplitude for 2 gal per 10 bbl dosage at different temperatures 75 150 and 250 At
room temperatures 75 and 150 the viscoelastic property was similar and the HVFR
showed that temperatures under 150 did not affect the polymer chains physically while
exhibited a lower value of Grsquo at high temperature around 250 It also observed that the
elastic modulus increased with frequency increments from 05 to 45 Hz
Figure 8 The elastic modulus characteristic of HVFR by temperature
38 FIELD CASE STUDY
A well-C is operated in Wolfcamp Shale TD (Total Depth) was about 22000 ft
and TVD (Total Vertical Depth) was approximately 8900 ft as shown in Figure 10 The
operation pressure range was from 7000 and 11000 psi The fluid type was slickwater
and the proppant size was 4070 white The fluid flow rate was between about 60 and 100
145
bpm In this frac job HVFR as well as other chemicals such as acid and gel breaker were
employed The initial pressure was about 11000 psi The dosage of HVFR from 125 gpt
to 05 gpt was treated for proppant transportation According to these results that HVFR
could be economically and efficiently used for proppant transportation and pressure
reduction at dosage rates as low as 05 gpt
Figure 9 Hydraulic fracture treatment plot from Well-C using HVFRs
4 DISCUSSION THE POTENTIAL OF FORMATION DAMAGE
Achieving high fracture conductivity is a primary goal of hydraulic fracturing
treatment because these conductive channels enable the flow of oil and gas from the
formation to the wellbore Many factors influence the fracture conductivity such as
proppant size and type fracture closure stress and fracturing fluid type HVFR fracturing
fluids are rapidly gaining popularity because of their numerous advantages such as better
146
proppant carrying capability In addition using HVFRs fracturing fluids lowers overall
costs due to fewer chemicals (Be Geri M et al 2019a)
Currently HVFRs have been successfully used as a completion fluid in
unconventional formations However some concerns remain of the potential formation
damage that might occur by using these high molecular weight polyacrylamide-based
fluids Therefore to address these concerns experimental investigation prior to this
research (SPE-197081) was performed to evaluate the potential of formation damage that
might occur due to using HVFRs To evaluate using HVFR fracture fluids a conductivity
test of an anionic polymer HVFR with a high molecular weight (18 to 26 million (gmole)
was conducted under closure pressure 2000 psi and at the reservoir temperature 165
Figure 11 showed the conductivity and permeability of fracturing fluids There are
three types of fracturing fluids baseline (no HVFR addition) 05 gpt and 25 gpt The
pressure and temperature under this test were 2000 psi and 165 respectively At 2000
psi fluid conductivities and proppant permeabilities of baseline and 05 gpt were quite
close In fact 05 gpt fracturing fluid showed better compatibility and permeability than
the baseline even though the HVFR used in this test has a very high molecular weight
positive results concluded that 110 and 94 regained permeability was observed at
dosages of 05 gpt and 25 gpt
147
5 CONCLUSIONS
This paper presented the overall understanding of HVFR xanthan emulsion
polymer and guar on viscosity and elastic modulus in DI water and harsh brine solutions
Based on the active ingredient weight and volume of friction reducers HVFR has good
characteristics for proppant transportation and pressure reduction from viscosity and elastic
modulus results The relatively higher molecular weight and thermal stability of the
synthetic polymer chemical structure supported the desired properties in frac operation
Figure 10 Conductivity and permeability on baseline 05 gpt and 25 gpt at 2000 psi
and 24 hr
In medium brine and high brine solutions through 2wt and 10 lbs brine HVFR
the n (flow behavior index) value of HVFR and Guar was higher than emulsion polymer
and xanthan The lower viscosity reduction from low shear rate to high shear rate may
improve proppant transport deeper into the fracture From Stokersquos law and the viscosity
1600
1800
2000
2200
2400
2600
2800
90
95
100
105
110
115
120
Co
nd
ucti
vit
y (
md
-ft)
Perm
eab
ility (D
arc
y)
Experimental Condition 2 KCl soln at 2000 psi amp 165 OF
and at 24 hr
Permeability
Conductivity
Baseline (0 gpt) 05 gpt 25 gpt
HVFR Dosage
148
profiles of friction reducers the investigation could prove HVFR has a good proppant
transportation capability
The elastic modulus is also related to the proppant transport characteristic It is a
physical stress affecting fluid properties and proppant transportation by the activity of
polymer chains Higher elastic modulus values represent the capability to transport
proppants farther As a result this research observed that HVFR has an excellent elastic
modulus when compared to other friction reducers
Based on the results of viscosity profiles and elastic modulus the research focused
on HVFR properties on the effects of amplitude frequency fluid type and temperature
The elastic modulus of HVFR has good heat resistance up to 150 as shown in the
viscosity profile In addition to the viscosity profile and elastic modulus the permeability
and conductivity of HVFR supports the induction of HVFR in frac operations As shown
in one of field cases in this paper the use of HVFR has been rapidly grown and the future
of utilizing HVFRs looks promising
REFERENCES
Acharya A R (1988 November 1) Viscoelasticity of Crosslinked Fracturing Fluids and
Proppant Transport Society of Petroleum Engineers httpsdoi10211815937-
PA
Aften C (2018 October 5) Analysis of Various High Viscosity Friction Reducers and
Brine Ranges Effectiveness on Proppant Transport Society of Petroleum
Engineers httpsdoi102118191792-18ERM-MS
Aften C W (2010 January 1) Study of Friction Reducers For Recycled Stimulation
Fluids In Environmentally Sensitive Regions Society of Petroleum Engineers
httpsdoi102118138984-MS
149
Aggour T M amp Economides M J (1999 February 1) Impact of Fluid Selection on
High-Permeability Fracturing Society of Petroleum Engineers
httpsdoi10211854536-PA
Asadi M Conway M W amp Barree R D (2002 January 1) Zero Shear Viscosity
Determination of Fracturing Fluids An Essential Parameter in Proppant Transport
Characterizations Society of Petroleum Engineers httpsdoi10211873755-MS
Ba Geri M Imqam A amp Dunn-Norman S (2018 October 5) Proppant Transport
Behavior in Inclined Versus Vertical Hydraulic Fractures An Experimental Study
Society of Petroleum Engineers httpsdoi102118191813-18ERM-MS
Ba Geri M Imqam A amp Suhail M (2019 March 15 a) Investigate Proppant Transport
with Varying Perforation Density and its Impact on Proppant Dune Development
Inside Hydraulic Fractures Society of Petroleum Engineers
httpsdoi102118195018-MS
Ba Geri M Imqam A amp Flori R (2019 April 8 b) A Critical Review of Using High
Viscosity Friction Reducers as Fracturing Fluids for Hydraulic Fracturing
Applications Society of Petroleum Engineers httpsdoi102118195191-MS
Ba Geri M Imqam A Bogdan A amp Shen L (2019 c April 8) Investigate the
Rheological Behavior of High Viscosity Friction Reducer Fracture Fluid and Its
Impact on Proppant Static Settling Velocity Society of Petroleum Engineers
httpsdoi102118195227-MS
Ellafi A M Ba Geri B Bubach and H Jabbari (2019 June 23) Formation Evaluation
and Hydraulic Fracture Modeling of Unconventional Reservoirs Sabrsquoatayn Basin
Case Study American Rock Mechanics Association
Geri M B Flori R amp Sherif H (2019 July 25) Comprehensive Study of Elasticity and
Shear-Viscosity Effects on Proppant Transport Using HFVRs on High-TDS
Produced Water Unconventional Resources Technology Conference
doi1015530urtec-2019-99
Gomaa A M Gupta D V S amp Carman P (2015 April 13) Viscoelastic Behavior and
Proppant Transport Properties of a New High-Temperature Viscoelastic Surfactant-
Based Fracturing Fluid Society of Petroleum Engineers
httpsdoi102118173745-MS
Harris P C Morgan R G amp Heath S J (2005 January 1) Measurement of Proppant
Transport of Frac Fluids Society of Petroleum Engineers
httpsdoi10211895287-MS
150
Harris P C Walters H G amp Bryant J (2009 November 1) Prediction of Proppant
Transport From Rheological Data Society of Petroleum Engineers
httpsdoi102118115298-PA
Hu Y T Chung H amp Maxey J E (2015 February 3) What is More Important for
Proppant Transport Viscosity or Elasticity Society of Petroleum Engineers
httpsdoi102118173339-MS
Li L Sun H Qu Q Le H V Ault M Zhou J hellip Smith D (2014 October 27)
High-Temperature Fracturing Fluids Prepared with Extremely High-TDS and Hard
Produced Water Society of Petroleum Engineers httpsdoi102118170607-MS
Li S amp Zhang D (2019 April 1) How Effective Is Carbon Dioxide as an Alternative
Fracturing Fluid Society of Petroleum Engineers httpsdoi102118194198-PA
Samuel M Polson D Graham D Kordziel W Waite T Waters G hellip Downey R
(2000 January 1) Viscoelastic Surfactant Fracturing Fluids Applications in Low
Permeability Reservoirs Society of Petroleum Engineers
httpsdoi10211860322-MS
Shah S N (1993 May 1) Rheological Characterization of Hydraulic Fracturing Slurries
Society of Petroleum Engineers httpsdoi10211822839-PA
Shrivastava K amp Sharma M M (2018 January 23) Proppant Transport in Complex
Fracture Networks Society of Petroleum Engineers httpsdoi102118189895-
MS
Srinivasan K Ajisafe F Alimahomed F Panjaitan M Makarychev-Mikhailov S amp
Mackay B (2018 August 28) Is There Anything Called Too Much Proppant
Society of Petroleum Engineers httpsdoi102118191800-MS
Walters H G Stegent N A amp Harris P C (2009 January 1) New Frac Fluid Provides
Excellent Proppant Transport and High Conductivity Society of Petroleum
Engineers httpsdoi102118119380-MS
Whitfield S (2017 June 1) Permian Bakken Operators Face Produced Water Challenges
Society of Petroleum Engineers httpsdoi1021180617-0048-JPT
151
VI A COMPREHENSIVE REVIEW OF FORMATION DAMAGE CAUSED BY
HIGH-VISCOSITY FRICTION REDUCERS WOLFCAMP CASE STUDY
Mohammed Ba Geri1 Abdulaziz Ellafi2 Ralph Flori1 Jerry Noles3 and Sangjoon Kim3
1 Deparment of Petroleum Engineering Missouri University of Science and Technology
Rolla MO 65409
2 Department of Petroleum Engineering University of North Dakota Grand Forks ND
58202
3 CoilChem LLC Washington Oklahoma
ABSTRACT
The success of using the hydraulic fracture treatment can be evaluated by
measuring fracture conductivity and regained permeability However selecting the most
suitable fracture fluid system plays an essential role in minimizing or eliminating formation
damage To address potential formation damage that may during fracturing treatment this
research presents a comprehensive review of a good number of published papers that are
carefully reviewed and summarized Theses works include experimental research case
studies and simulation work on recent improvements on using HVFR to carry proppant
and capture the optimum design in fracturing operations This paper also provides
formation damage mechanisms such as chemical mechanical biological and thermal
mechanisms Moreover the research explains the fracture damage categories including the
damage inside the fracture and damage inside the reservoir The advantages of using
HVFRs are also fully explained Experimental rheological characterization was studied to
investigate the viscoelastic property of HVFRs on proppant transport In addition
152
successful implication of utilizing HVFRs in the Wolfcamp formation in the Permian
Basin was discussed
The research findings were analyzed to reach conclusions on how HVFRs can be
an alternative fracture fluid system within many unconventional reservoirs Compared to
the traditional hydraulic fracture fluid system the research shows the many potential
advantages that HVFR fluids offer including superior proppant transport capability almost
100 retained conductivity around 30 cost reduction and logistics such as minimizing
chemical usage by 50 and the ability to stonre operation equipment on location reduce
water consumption by 30 and achieve environmental benefits Finally this
comprehensive review addresses up-to-date of using HVFRs challenges and emphasizes
necessities for using high viscosity friction reducers as alternative fracture fluids
1 INTRODUCTION
Selecting optimal fracturing fluids plays a key role in successful hydraulic
fracturing treatment The primary goal of the hydraulic fracturing process is to achieve high
fracture conductivity because these conductive channels enable the flow of oil and gas
from the formation to the wellbore The fracture damages can negatively impact the
effectiveness of the stimulation process Several numerical studies confirmed that
hydraulic damage could decrease the well productivity by up to 50 Han (2014)
Conventional fracturing fluids such as guar-based fluids build a filter cake on the surface
of the shale matrix Therefore the potential of formation damage after using viscous
fracturing fluids increases because the formed filter cake blocks the pore-throat of low
153
permeability rocks (Wang et al 2010) In addition utalising viscous fracturing fluids has
the potential of decreasing the fracture conductivity due to a higher residual polymer Many
factors influence the fracture conductivity such as proppant size and type fracture closure
stress and fracturing fluid type (Ba Geri et al 2019d)
Many investigations have been conducted concerning fracture damage evaluation
Bennion et al (1999) summarized some issues and solutions associated with low
permeability gas reservoirs during the stimulation and production process The research
concluded that improper fluid selection is one of the major mechanisms that cause
formation damage Reinickeetal et al (2010) conducted an experimental study to
investigate the mechanical damage that occurred at the hydraulic fracture face In some
cases reservoir fluids are not compatible with fracturing fluids due to its chemical
complicity (Aggour and Economides 1999) Farah et al (2016) performed numerical
techniques in order to evaluate the formation damage caused by fracturing-fluid during the
fracturing treatment and its influence on the hydrocarbon production and unconventional
gas formation Cooke C (1975) studied the impact of several types of fracturing fluids on
fracture conductivity and described a theoretical method to evaluate fluid residue on
fracture conductivity Davles and Kulper (1988) studied several factors that affect
proppant-pack and fracture conductivity such as closure stress multiphase flow proppant
size proppant type and fracturing fluids Norman et al (1989) evaluated commonly used
hydraulic fracturing fluids using a simplified technique and reached the conclusion that the
quickest fluids to clean up are flowing foams uncrosslinked gels and crosslinked fluids
Voneiff et al (1996) performed a simulation study to investigate the impact of
unbroken fracturing fluids on the productivity performance of gas wells The conclusions
154
of their research were unbroken fracture fluids initial gas production decreased by 80
fracture clean-up can by delayed by weeks or months and 30 reduction in gas reserves
Pope et al (1996) discussed the effects of viscous fingering of using guar-based fracturing
fluids on fracture conductivity and concluded that for predicting the retained permeability
known polymer concentration polymer molecular weight and temperature are required
Behr et al (2006) developed a numerical model-initialization in order to evaluate the
fracture damage that occurs after closure in tight gas reservoirs Wang et al (2008) ran a
simulation study in order to understand how polymers in the fractures can affect the
cleanup process
Recently HVFRs as a completion fluid have been successfully used in
unconventional formations (Motiee et al 2016 Van Domelen 2017 and Ba Geri et al
2019b) However some concerns remain because of the potential formation damage that
might occur by using these high molecular weight polyacrylamide-based fluids as
completion fluids Motiee et al (2016) used high concentrations of friction reducers
(HCFR) of 14 gpt They conducted conductivity experiments under a high-temperature
system at 220degF for 25 hours and concluded that using 14gpt of HCFR gives 72 of
regained conductivity while adding 1ppt of breaker increased the regained conductivity up
to 80 Van Domelen (2017) reported a comparison study between 15 lbMgal of
crosslinked and 3 gpt of viscosity-building friction reducers (VFR) under the same
conductivity measurement condition and reached the observation that the final regained
conductivity was 106 and 36 of 3gpt of VFR and 15 lbMgal of crosslinked
respectively Galindo (2019) studied the effect of increasing HVFRs viscosity on formation
155
damage The results showed that HVFRs might cause formation damage if used without a
breaker because of polymer residuals
Ba Geri et al 2019a presented a critical review of using HVFRs in lab studies and
field operations The investigation provided a full understanding of using HVFRs as an
alternative fracture fluid The study notes that limited work has been done to evaluate the
potential of formation damage that could occur when using HVFRs during fracturing
treatment This paper provides a comprehensive study of the effects of utilizing HVFRs on
fracture conductivity and regained permeability Three cases were implemented to study
the effect of formation damage caused by using HVFRs fracturing fluids The Baseline
(without HVFR) in 2 KCl solution was investigated in Case I (base case) while the effect
of increasing the HVFRs dosage by 05 gpt and 25 gpt was investigated in Case II and
Case III In both cases the sieve size distribution was performed before and after the test
Successful field implementation of using HVFRs was also discussed
2 FORMATION DAMAGE MECHANISMS
Formation damage can be described as ldquothe impairment of the invisible by the
inevitable and uncontrollable resulting in an indeterminate reduction of the
unquantifiablerdquo (Bennion 1999) Creating a highly conductive path in ultra-low
permeability unconventional reservoirs is an essential step to allow the hydrocarbons to
flow from the reservoirs to the wellbore To maintain the fracture conductivity high-
viscosity fracture fluids (eg guar gum or crosslinked) are required to carry a high
concentration of proppant (Yuan et al 2015) These viscous fluids should be degraded
156
after the fracture treatment for an easy clean-up process The Well productivity
performance is reduced due to formation damage and usually an expensive treatment is
required to remove fracture damage Formation damage can be classified into four main
mechanisms Figure 1 chemical mechanical biological and thermal These mechanisms
inhibit the flow of fluid formation from reservoirs into the fracture network and
consequently impair hydrocarbon production rates and well productivity (Civan 2000
Nasr-El-Din 2003 and Wang et al 2008)
Figure 1 Classification of the common formation damage mechanisms (Civan 2000)
In general fracture damage can be classified into two categories as shown in the
Table 1
Table 1 Fracture damage categories (Wang et al 2010)
Damage inside the
fracture Damage inside the reservoir
Other factors affect clean
up
Fracture plugging with
chemicals and polymers
Fracture-face damage
Proppant crushing
Proppant embedment
Fluid leakoff
Clay swelling
Relative permeability change
Capillary effects
Gel residue breaker
Fracture-fluid viscosity
Viscous fingering
Formation temperature
Fracture conductivity
Reservoir heterogeneity
Fracture geometry
Formation Damage
ThermalBiologicalMechanicalChemical
157
It is important to minimize or eliminate formation damage as this plays a key role
in increasingwell productivity In unconventional reservoirs well performance is a strong
function of fracture conductivity and permeability of the region near the wellbore
Therefore many researchers focus their studies to develop techniques to minimize or
prevent formation damage This paper will provide a better understanding of the distinct
changes of the mechanical characterization on the HVFRs that could be used as guidance
for fracture engineers to design and select more effective high viscous friction reducers
By doing so the promising results of using HVFRs can minimize formation damage and
maximize well productivity and the ultimate operator goal will be achieved
3 WHY HIGH VISCOSITY FRICTION REDUCERS
The primary function of friction reducers is changing turbulent flow to laminar
flow which can reduce frictional loss that occurs while pumping fracturing fluids by up to
80 Recently high-viscosity friction reducers (HVFRs) have gained popularity as drilling
and hydraulic fracturing fluids because the HVFRs exhibit numerous advantages such as
the following (Ba Geri et al 2019a ampb)
bull Reduced pipe friction during fracturing treatments
bull High regain conductivities compared to linear and crosslinked gels
bull Lower operational cost
o Uses less water compared to conventional slickwater treatments
o Consumes 33-48 less chemicals than conventional treatments
158
o Requires less equipment on location
o Requires fewer number of tank trucks in the field
bull More fracture complexity using a less viscous fluid system
bull Better hydrocarbon production results compare to or greater than other fluids
bull Improved flexibility to design treatments that balance technical economic and
operational goals
bull Reduced freshwater proppant and equipment requirements compared with
conventional fluid systems
bull Minimized environmental footprint with selection of engineered additives
bull Simplified operations by reduced screen out risks
4 EXPERIMENTAL DESCRIPTION
41 EXPERIMENTAL MATERIALS
411 Experimental Materials Three different samples baseline (wo HVFR)
05 gpt (05 gal of HVFR per 1000 gal) and 25 gpt (25 gal of HVFR per 1000 gal) were
selected to prepare typical hydraulic fracturing fluids The HVFR is anionic polymer and
the molecular weight is 18 to 23 million The conductivity and permeability test were
conducted in 2 KCl solution at 165 and at a closure stress of 2000 psi to prepare the
fracturing fluid at lab temperature
412 Proppant The proppant size that was selected for this study was between
mesh size 30 and 50 Tables 2 3 and 4 represent the sieve analysis of proppant used for
159
the test with the baseline 05 gpt and 25 gpt The sieve size distribution was performed
before and after the test
Table 2 Proppant sieve analysis for baseline
Mesh Size Length (mm) Baseline
Pre Sieve () Post Sieve ()
30 0600 02 00
35 0500 275 266
40 0425 496 472
45 0355 199 232
50 0300 28 30
Total 1000 1000
Median Particle Diameter (MPD mm) 0463 0458
Table 3 Proppant sieve analysis for 05 gpt
Mesh Size Length (mm) Baseline
Pre Sieve () Post Sieve ()
30 0600 02 02
35 0500 275 265
40 0425 496 478
45 0355 199 225
50 0300 28 29
Total 1000 999
Median Particle Diameter (MPD mm) 0463 0459
Table 4 Proppant sieve analysis for 25 gpt
Mesh Size Length (mm) Baseline
Pre Sieve () Post Sieve ()
30 0600 02 18
35 0500 275 287
40 0425 496 487
45 0355 199 183
50 0300 28 26
Total 1000 1001
Median Particle Diameter (MPD mm) 0463 0458
160
5 MEASUREMENTS OF RHEOLOGICAL PROPERTY
51 SHEAR VISCOSITY CHARACTERIZATION (K N)
Based on the standard practice in the hydraulic fracturing industry the most typical
shear rates that were measured while pumping the fluid slurry into the fractures are within
the range 10 119904minus1 to 170 119904minus1as well as 511 119904minus1 to determine fluid apparent viscosity In lab
studies the common shear rate was either 40 119904minus1 or 100 119904minus1 (Hu et al 2015 Gomaa et al
2015 Ba Geri et al 2019campf) This study investigated three different fracture fluid shear
rates 40 119904minus1 100 119904minus1 and 170 119904minus1
52 SHEAR ELASTICITY CHARACTERIZATION (ELASTIC MODULUS Grsquo)
Several methods can be used to measure the elastic properties of viscoelastic fluid
such as the viscoelastic characterization of the fracturing fluids N1 relaxation time
dynamic oscillatory frequency test and the amplitude sweep test This study investigated
the viscoelasticity behavior of the tested fluid by testing the dynamic oscillatory frequency
through M5600 (Grace Instrument)
53 FRACTURE CONDUCTIVITY EXPERIMENT PROCEDURE
Conductivity cells were loaded with proppants with 20 lbft2 loading between Ohio
Sandstone Cores 1000 psi closure stress was initially applied for 12-24 hours and then
the pressure was increased to 2000 psi for 50 hr The conductivity and permeability of the
samples were measured at 0 24 and 50 hr Equations (1) and (2) represent conductivity
and permeability respectively
161
Conductivity 119896119882119891 =2678μQ
120549119875 (1)
Permeability 119896 =3214μQ
120549119875119882119891 (2)
where
k Proppant Pack Permeability (Darcy)
k119882119891 Proppant Pack Conductivity (Millidarcy-feet)
μ Viscosity of Liquid (cp)
Q Flow Rate (1198881198983min)
P Differential Pressure (psi)
119882119891 Proppant Pack Width (in)
6 RESULTS AND ANALYSIS
61 RHEOLOGICAL CHARACTERIZATION OF THE HVFRS
611 Viscosity Profile Measurement Figure 2 shows the HVFR viscosity profile
in fresh water The range of pH and TDS in this water was 7-8 and 300-450 ppm
respectively Divalent cations such as Ca2+ and Mg2+ were under 10 ppm The HVFR
solution was vigorously stirred for 30 minutes and then each solutionrsquos viscosity was
measured at shear rates 40 100 and 170 119904minus1 through the M5600 rheometer (Grace
Instrument) at room ambient As shown in Figure 2 the viscosity has been proportionally
increased with the HVFR dosage and represents the shear thinning property For instance
at a loading of 3 gpt the results for HVFR showed that HVFR has high viscosity (31 cp)
at a lower shear rate of 040 119904minus1 compared to the viscosity of high shear rate of 0170 119904minus1
162
showed a much lower viscosity of around 14 cp The second observation was that at the
same shear rate (eg 40 119904minus1) increasing the HVFR dosage from 1 gpt to 3 gpt leads to an
increase in the viscosity profile from around 8 cp to 31 cp respectively
Figure 2 HVFR viscosity profile with various dosage in fresh water
612 Elasticity Profile Measurment The viscoelastic properties of HVFR were
measured through the M5600 (Grace Instrument) The dosage ratio was 05 10 20 and
30 gal of HVFR per 1000 in fresh water Prior to the viscoelastic test each sample was
stirred to be completely dispersed in fluids for 30 minutes In this experiment the
frequency was set at 05 to 30 Hz with 05 Hz increments and the amplitude was 200
The viscoelastic properties were measured at room ambient Figure 3 represents the elastic
modulus (Grsquo) of HVFR in fresh water The elastic modulus of the HVFR solution was
increased with the increase of the HVFR dosage
0
10
20
30
40
50
B
C
D
Vis
co
sit
y (
cp
s)
Shear Rate (1s)
40 100 170
1 gpt
2 gpt
3 gpt
HVFR DosageFluid Fresh Water
163
To illustrate at a low dosage of HVFR (less than 1 gpt) the elastic modulus is
almost zero while increasing the dosage up to 3 gpt provides a strong elasticity profile
above 5 dyncm2 In addition the elastic modulus of HVFR was increased with the test
frequency For example Grsquo increased from 1 dyncm2 to almost 6 dyncm2 by increasing
the frequency from 05 Hz to 3 Hz respectively
0
1
2
3
4
5
6
7
B
C
D
E
Ela
sti
c M
od
ulu
s (
G)
(d
yn
cm
2) 05 gal per 1000 gal
10 gal per 1000 gal20 gal per 1000 gal30 gal per 1000 gal
HVFR Dosage in Fresh WaterAmplitude 200
05 10 15 20 25 30
Frequency (Hz)
Figure 3 HVFR elastic property with various dosage in fresh water
62 CONDUCTIVITY AND PERMEABILITY MEASUREMENT ON BASELINE
05 GPT AND 25 GPT
Figure 4 represents the conductivity and permeability of the baseline 05 gpt and
25 gpt depending on pressure and time The measurement of the sample baseline means
the reading of fluid conductivity and proppant permeability without HVFR As adding 05
gal and 25 gal of HVFR per 1000 gal of 2 KCl solution the effect of HVFR was
investigated As shown in figure 1 (A-1000 psi at 24 hr) the 05 gpt and 25 gpt samples
164
regained conductivity and permeability at about 95 and 93 respectively compared
with baseline samples At 2000 psi in Figure 4 (B) the fluid conductivity and proppant
permeability of 05 gpt showed quite close with the characteristic of baseline As time goes
in Figures 4 (C) and (D) shows that at 2000 psi 05 gpt of HVFR contributed to improve
the conductivity and permeability
Figure 4 Conductivity and permeability on baseline 05 gpt and 25 gpt by pressure and
time
Table 4 represents the regain percentage of conductivity and permeability on
samples 05gpt and 25 gpt The conductivity and permeability of 05 gpt at 2000 psi for
24 amp 50 hr were great 103 and 108 on regaining permeability were more than what
expected In addition the conductivity and permeability of 25 gpt look fine The overall
165
regained percentage of 25 gpt was 83 to 93 in this conditional environment The polymer
chains in 25 gpt might interfere with conductivity and permeability
Table 5 The regain percentage of 05 gpt and 25 gpt
Stress
psi
Time (hr)
stress
Conductivity (md-ft)
Permeability (Darcy)
Regain
(Permeability)
Baseline 05 gpt 25 gpt 05 gpt 25 gpt
1000 24 3568177 3401168 3317164 95 93
2000 0 2177109 2183108 182190 99 83
2000 24 2153107 2228110 189094 103 88
3000 50 2122106 2304114 194496 108 91
63 CASE STUDY WOLFCAMP FORMATION REEVES COUNTY TX
631 Geological Background A well-H was located in the Wolfcamp formation
in West Texas The well depth was about 10000 feet along the basin axis and the lateral
section was approximately 8300 feet The net pay thickness of Woflcamp is about 1000
feet to over 4000 feet and the average porosity is 7 The maximum pressure was 9800
psi and the backside pressure was 2000 psi In this job slick was employed as the base
treatment fluid
632 Fracture Design and Execution Figure 5 shows a plot of the individual-
stage fracturing treatment In the early stages of the treatment the pressure reached close
to 9600 psi which could be an indication of creating more fractured area while during the
remainder of the process the pressure was within the range of 7200 psi and 8600 psi The
proppant concentration was increased gradually from 05 ppg to 15 ppg with increasing
the dosage of HVFRs from 050 gpt to 1 gpt The fracture treatment was placed as the
fracture design expectation In the field trial the low dosage of HVFRs (eg 1 gpt)
166
provided promising production results as well as reduction on the cost related to using
HVFR
Figure 5 Hydraulic fracture treatment plot from Well-H using HVFRs
Figure 6 represents real time data from Wolfcamp Well-H Desirable pressure
responded at the prop dosage 025 ppg which entered the formation with 03 gpt During
operation the dosage range of HVFR was increased from 03 gpt to 1 gpt The upper
pressure reached 9400 psi however most of the operation was conducted between 7200
psi and 8600 psi The prop amount was approximately 19000 lbs per stage and 100 of
0310 0337 0404 0431 0458
Time (Hr Min)
05 ppg
10 ppg
15 ppg
1 gpt
050 gpt
720 bpm
1080 bpm
4 lbsmin
6 lbsmin
8 lbsmin
4800 psi
7200 psi
9600 psi
- Sand Dosage (ppg (lbs per gallon)) - HVFR Conc (ppt (lbs per thousand gallons)
- Discharge Rate (bpm (barrel per min) - Blender HVFR Rate (lbsmin)
- Wellside (psi)
167
the prop was placed in the formation Compared to the cost of linear gel using HVFR
provided about 25-30 cost reduction
Figure 6 HVFR dosage real time data
7 CONCLUSIONS
This paper provides a comprehensive review of formation damage caused by using
fracture fluids The formation damage mechanisms (eg chemical mechanical biological
thermal) and fracture damage categories were explained After that experimental work
investigated the viscoelastic properties of HVFRs and the potential of formation damage
caused by using a new fracture fluid system (HVFRs) was determined Finally a field case
study was discussed including the advantages of utilizing HVFRs as an alternative fracture
fluid system to the conventional fracture fluids such as linear gel HVFRs were used
0
05
1
15
2
25
8000
8500
9000
9500
700 720 740 760 780 800 820 840
PolyMax-1000 (ppt)4070 White (ppg)Pressure (psi)
Time (min)
HVFR (ppt)
075 ndash 25 ppt
025 ndash 10 ppg
168
Successfuly in the Wolfcamp formation causing production improvement and 25-30 cost
reduction
The viscoelastic property of high molecular weight (18 to 23 million) of HVFRs
shows promising results on fracture conductivity and regained permeability Through the
conductivity and permeability test it was found that 05 gpt of HVFR did not affect the
conductivity and permeability during the frac operation Even the dosage of 05 gpt helped
to improve fluid conductivity and proppant permeability with up to 108 of regain at
2000 psi and 165 for 50 hr which is a remarkable finding The high dosage of 25 gpt
in the frac operation may initially hinder the conductivity and permeability due to polymer
chains However the conductivity and permeability have gradually improved to 91 of
regain as time goes on
REFERENCES
Aggour T M amp Economides M J (1999 February 1) Impact of Fluid Selection on
High-Permeability Fracturing Society of Petroleum Engineers
httpsdoi10211854536-PA
Ba Geri M Imqam A amp Dunn-Norman S (2018 October 5) Proppant Transport
Behavior in Inclined Versus Vertical Hydraulic Fractures An Experimental Study
Society of Petroleum Engineers doi102118191813-18ERM-MS
Ba Geri M Imqam A amp Suhail M (2019 March 15) Investigate Proppant Transport
with Varying Perforation Density and its Impact on Proppant Dune Development
Inside Hydraulic Fractures Society of Petroleum Engineers doi102118195018-
MS
Ba Geri M Imqam A amp Flori R (2019a April 8) A Critical Review of Using High
Viscosity Friction Reducers as Fracturing Fluids for Hydraulic Fracturing
Applications Society of Petroleum Engineers httpsdoi102118195191-MS
169
Ba Geri M Imqam A Bogdan A amp Shen L (2019b April 8) Investigate the
Rheological Behavior of High Viscosity Friction Reducer Fracture Fluid and Its
Impact on Proppant Static Settling Velocity Society of Petroleum Engineers
httpsdoi102118195227-MS
Ba Geri M R Flori A Imqam L Shen amp A Bogdan (2019c June) Static Proppant
Settling Velocity Characteristics in High Viscosity Friction Reducers Fluids for
Unconfined and Confined Fractures American Rock Mechanics Association
Ba Geri M Ellafi A Flori R Noles J amp Kim S (2019f October) Viscoelastic
Characterization Effect of High-Viscosity Friction Reducers and Proppant
Transport Performance in High-TDS Environment Society of Petroleum
Engineers httpsdoi102018196014-MS
Behr A Mtchedlishvili G Friedel T amp Haefner F K A (2006 May 1) Consideration
of Damaged Zone in a Tight Gas Reservoir Model with a Hydraulically Fractured
Well Society of Petroleum Engineers httpsdoi10211882298-PA
Bennion D B Thomas F B amp Bietz R F (1996 January 1) Low Permeability Gas
Reservoirs Problems Opportunities and Solutions for Drilling Completion
Stimulation and Production Society of Petroleum Engineers
httpsdoi10211835577-MS
Civan Faruk Reservoir Formation Damage Fundamentals Modeling Assessment and
Mitigation 2000
Cooke C E (1975 October 1) Effect of Fracturing Fluids on Fracture Conductivity
Society of Petroleum Engineers httpsdoi1021185114-PA
Davies D R amp Kuiper T O H (1988 May 1) Fracture Conductivity in Hydraulic
Fracture Stimulation Society of Petroleum Engineers httpsdoi10211817655-
PA
Farah N Ding D-Y amp Wu Y-S (2017 August) Simulation of the Impact of
Fracturing-Fluid-Induced Formation Damage in Shale Gas Reservoirs Society of
Petroleum Engineers httpsdoi102118173264-PA
Galindo T (2019 January 29) Can Proppant Transport be Negatively Affected by Too
Much Viscosity Society of Petroleum Engineers httpsdoi102118194317-MS
Geri M B Flori R amp Sherif H (2019 July 25) Comprehensive Study of Elasticity and
Shear-Viscosity Effects on Proppant Transport Using HFVRs on High-TDS
Produced Water Unconventional Resources Technology Conference
doi1015530urtec-2019-99
170
Geri M B Ellafi A Ofori B Flori R amp Sherif H (2019 July 31) Successful
Implementation of High Viscosity Friction Reducers from Laboratory to Field
Scale Middle Bakken Case Study Unconventional Resources Technology
Conference doi1015530urtec-2019-447
Gomaa A M Gupta D V S V amp Carman P S (2015 February 3) Proppant
Transport Viscosity Is Not All Itrsquos Cracked Up to Be Society of Petroleum
Engineers httpsdoi102118173323-MS
Han Jiahang (2014) Hydraulic Fracture Damage Analysis in Tight Gas Reservoirs PhD
Dissertation
Hu Y T Chung H amp Maxey J E (2015 February 3) What is More Important for
Proppant Transport Viscosity or Elasticity Society of Petroleum Engineers
httpsdoi102118173339-MS
Motiee M Johnson M Ward B Gradl C McKimmy M amp Meeheib J (2016
February 1) High Concentration Polyacrylamide-Based Friction Reducer Used as
a Direct Substitute for Guar-Based Borate Crosslinked Fluid in Fracturing
Operations Society of Petroleum Engineers httpsdoi102118179154-MS
Nasr-El-Din H A (2003 January 1) New Mechanisms of Formation Damage Lab
Studies and Case Histories Society of Petroleum Engineers
httpsdoi10211882253-MS
Norman L R Hollenbeak K H amp Harris P C (1989 January 1) Fracture Conductivity
Impairment Removal Society of Petroleum Engineers httpsdoi10211819732-
MS
Pope D S Leung LW Gulbis J amp Constien V G (1996 November 1) Effects of
Viscous Fingering on Fracture Conductivity Society of Petroleum Engineers
httpsdoi10211828511-PA
Van Domelen M Cutrer W Collins S amp Ruegamer M (2017 March 27)
Applications of Viscosity-Building Friction Reducers as Fracturing Fluids Society
of Petroleum Engineers httpsdoi102118185084-MS
Voneiff G W Robinson B M amp Holditch S A (1996 November 1) The Effects of
Unbroken Fracture Fluid on Gas Well Performance Society of Petroleum
Engineers httpsdoi10211826664-PA
Wang Y Holditch S A amp McVay D A (2008 January 1) Simulation of Gel Damage
on Fracture-Fluid Cleanup and Long-Term Recovery in Tight-Gas Reservoirs
Society of Petroleum Engineers httpsdoi102118117444-MS
171
Wang J Y Holditch S amp McVay D (2010 September 1) Modeling Fracture-Fluid
Cleanup in Tight-Gas Wells Society of Petroleum Engineers
httpsdoi102118119624-PA
Yuan B Su Y Moghanloo RG Rui Z Wang W Shang Y 2015 A new analytical
multi-linear solution for gas flow toward fractured horizontal wells with different
fracture intensity J Nat Gas Sci Eng 23 227e238
172
SECTION
3 CONCLUSIONS
This project evaluates the rheological characterization of HVFRs and investigates
the compatibility of HVFRs with the Permian and Bakken produced water Correlateing
the friction reductions measurment on high-TDS produced water was also studied in
produced water and fresh water as well The obtained results from this experimental
investigation provides new insights into the pressure reduction and proppant transport
theories that leads to the developing conclusions as follows
bull HVFR indicated high viscosity values and heat resistant property among friction
reducer samples
bull Based on viscosity values and well temperature by depth HVFR has great proppant
suspension and transportation capacity
bull HVFR showed a great elastic property helping proppant transportation
bull The high viscosity reading and elastic property of HVFR turned into a good fit in
frac operation
bull Also HVFR has other properties such as high molecular weight thermal stability
high regained conductivity and permeability in frac operation comparing other
friction reducers
bull The Future of utilizing HVFR looks promising from a field test
173
REFERENCES
Acharya AR 1988 Viscoelasticity of Crosslinked Fracturing Fluids and Proppant
Transport SPE Production Engineering 3 483-488 SPE-15937-PA
httpdxdoiorg10211815937-PA
Adrian RJ 2005 Twenty Years of Particle Image Velocimetry Experiments in Fluids 39
(2) 159-169 httpdxdoiorg101007s00348-005-0991-7
Ba Geri M Flori R Ellafi A Noles J Essman J Kim S amp Alkamil E H K (2019
November 11) Correlated Friction Reduction and Viscoelastic Characterization of
Utilizing the Permian Produced Water with HVFRs during Hydraulic Fracturing
Society of Petroleum Engineers doi102118197748-MS
Ellafi A Jabbari H Ba Geri M amp Alkamil E (2019 November 11) Can HVFRs
Increase the Oil Recovery in Hydraulic Fractures Applications Society of
Petroleum Engineers doi102118197744-MS
174
VITA
Mohammed Salem Ba Geri was born in Hadramout Yemen He received his
bachelorrsquos degree in Petroleum Engineering from Hadramout University of Science and
Technology Yemen in 2007 He was awarded a fully funded scholarship from Hadramout
Establishment for Human Development (HEHD) to obtain his masterrsquos degree in Saudi
Arabia 2010
Mohammed worked for one year at University of Salford Manchester from 2013 to
2014 Then he worked at Ministry of Oil amp Minerals in Yemen as a reservoir engineer from
2014 to 2016 He was awarded a fully funded scholarship from Hadramout Establishment
for Human Development (HEHD) to obtain his PhD degree in USA in 2017 He recived a
PhD in Petroleum Engineering from Missouri University of Science and Technology
Rolla MO in December 2019
Ba Geri was a member of Society of Petroleum Engineers (SPE) He served as a
volunteer with the SPE since 2010 The field of his research evaluate high viscosity
friction reducers on proppant transport and formation damage His area of interest
stimulationshydraulic fracturing well completions unconventional reservoirs and
production engineering He had several research papers in proppant transport high
viscosity friction reducerrsquos evaluation unconventional shale reservoirs and tight gas
- Investigating the performance of high viscosity friction reducers used for proppant transport during hydraulic fracturing
-
- Recommended Citation
-
- II
-