investigating the impact of vascular amyloid plaque ...1440/eth... · amyloid angiopathie, caa)...
TRANSCRIPT

Research Collection
Doctoral Thesis
Investigating the impact of vascular amyloid plaque depositionin mouse models of Alzheimer’s disease using non-invasiveimaging techniques
Author(s): Princz-Kranz, Felicitas Laura
Publication Date: 2010
Permanent Link: https://doi.org/10.3929/ethz-a-006097535
Rights / License: In Copyright - Non-Commercial Use Permitted
This page was generated automatically upon download from the ETH Zurich Research Collection. For moreinformation please consult the Terms of use.
ETH Library

Diss. ETH No. 18979
Investigating the impact of vascularamyloid plaque deposition in mousemodels of Alzheimer’s Disease using
non-invasive imaging techniques
A dissertation submitted to the
ETH ZÜRICH
for the degree of
DOCTOR OF SCIENCES
presented by
FELICITAS L. PRINCZ-KRANZ
Dipl. Natw., ETH Zürich
born June 22nd, 1979
citizen of Germany
accepted on the recommendation of
Prof. Markus Rudin, examiner
Prof. Jean-Marc Fritschy, co-examiner
Prof. Roger M. Nitsch, co-examiner
2010


für Beni
iii

iv

Contents
Abstract vii
Zusammenfassung ix
1 Introduction 1
1.1 Alzheimer’s Disease (AD) . . . . . . . . . . . . . . . . . . . . . . . . . . . . . . . 1
1.1.1 Symptoms . . . . . . . . . . . . . . . . . . . . . . . . . . . . . . . . . . . . 1
1.1.2 Neuropathology . . . . . . . . . . . . . . . . . . . . . . . . . . . . . . . . 3
1.1.3 Prevalence . . . . . . . . . . . . . . . . . . . . . . . . . . . . . . . . . . . . 4
1.1.4 Amyloid cascade hypothesis . . . . . . . . . . . . . . . . . . . . . . . . . 5
1.1.5 Vascular aspect of amyloid pathology in AD . . . . . . . . . . . . . . . . 6
1.1.6 Mouse models . . . . . . . . . . . . . . . . . . . . . . . . . . . . . . . . . . 9
1.1.7 Treatment . . . . . . . . . . . . . . . . . . . . . . . . . . . . . . . . . . . . 13
1.1.8 Diagnosis . . . . . . . . . . . . . . . . . . . . . . . . . . . . . . . . . . . . 17
1.1.9 Potential of imaging in diagnosis of AD . . . . . . . . . . . . . . . . . . . 17
1.2 Imaging the brain in AD . . . . . . . . . . . . . . . . . . . . . . . . . . . . . . . . 19
1.2.1 Magnetic Resonance Imaging (MRI) . . . . . . . . . . . . . . . . . . . . . 19
1.2.2 Near Infrared Fluoresence (NIRF) Imaging . . . . . . . . . . . . . . . . . 30
1.3 Aim of the thesis . . . . . . . . . . . . . . . . . . . . . . . . . . . . . . . . . . . . 34
2 Development of in-vivo imaging techniques 37
2.1 Structural consequences of cerebral amyloid angiopathy (CAA) . . . . . . . . . 37
2.2 Functional consequences of CAA . . . . . . . . . . . . . . . . . . . . . . . . . . . 46
2.2.1 Vascular response to acetazolamide in arcAβ mice . . . . . . . . . . . . . 46
2.2.2 Correlation of CAA and impaired vascular responsiveness in APPDutch
mice . . . . . . . . . . . . . . . . . . . . . . . . . . . . . . . . . . . . . . . 63
2.3 Assessment of AD plaque load by NIRF imaging . . . . . . . . . . . . . . . . . . 70
v

CONTENTS
3 Application of imaging in immunotherapy studies 81
3.1 No changes of fMRI response in arcAβ mice upon passive immunization . . . . 84
3.2 Changes in β-amyloid load upon passive immunization revealed by NIRF . . . 94
4 Conclusions and outlook 111
4.1 Vascular aspect of amyloid pathology in AD . . . . . . . . . . . . . . . . . . . . 111
4.2 Molecular imaging of amyloid plaque load using NIRF . . . . . . . . . . . . . . 114
References 130
Acknowledgement 131
vi

CONTENTS
Abstract
Alzheimer’s Disease (AD) is one of the most prominent forms of dementia. Latest numbers
from the American Alzheimer’s Association show that more than 5 million people in the US
suffered from AD in 2009 - a number that is thought to increase along with the increasing life
expectancy of the worldwide population.
The World Health Organisation (WHO) defines AD as a progressive decline of cognitive
functions sufficient to impair personal activities in daily life. The main symptom of AD is
loss of memory, but over the different stages of the disease various additional symptoms
may appear including changes in personality, sensory processing, language control and oth-
ers. Up to now, treatment of AD is symptomatic and allows to meliorate patients state for
a certain time span only. Having an early diagnosis and starting of treatment in the early
stages of AD can help preserve function for months to years, even though the underlying
pathological process cannot necessarily be changed. At the moment definite diagnosis is still
only possible post-mortem. But many approaches are followed in order to allow clinicians to
determine more accurately if a person has dementia or even more precisely AD. One of the
most promising approaches is thought to be non-invasive imaging of the patients brain.
A remarkable number of transgenic mouse models of AD, mostly carrying human mu-
tations in genes crucial for AD pathology, have been generated in the last decades. These
models mimick symptoms as well as molecular mechanisms of AD and allow validation of
diagnostic tools or treatment approaches possibly transferable into clinics.
The vascular aspect of AD is of major importance as blood supply is crucial for the brain
to function properly. Neurons are depending on energy supply from neighbouring cells as
their highly specialized function of electrical information transmission doesn’t allow storage
of energy in high amounts. Amyloid plaques, one of the main pathological hallmarks of AD,
are thought to be involved in the neurodegenerative aspect of the disease. Accumulation of
amyloid plaques around the blood vessels of the brain are known to impair several functions
of the cerebral vasculature.
The objective of this PhD project was to develop and apply non-invasive imaging tools
for studying amyloid pathology in AD models. These would allow to evaluate disease pro-
gression and therapy response in individual animals which is attractive not only for studying
chronic diseases such as AD but also in view of the fact that the methods might be translat-
able into the clinics. In a first step MRI methods for the assessment of structural and func-
tional readouts of parenchymal and vascular AD pathology have been developed. In two
different mouse models the vascular responsiveness was found to be impaired in regions
vii

CONTENTS
with strong vascular amyloid deposition (cerebral amyloid angiopathy, CAA) using func-
tional MRI. The fMRI readouts of vascular function appeared to be of diagnostic quality as
they identified vascular pathologies with good sensitivity and specificity. Microangiography
using MR (MRA) revealed that transgenic mice modeling AD on average showed less major
vessels of the cerebral microvasculature. Both results indicate that CAA leads to structural
and functional consequences in the cerebral vasculature of AD mouse models that can be as-
sessed using non-invasive imaging techniques that are in principle transferable into clinics.
The extent of cerebral amyloid deposition in transgenic mouse models of AD was as-
sessed using the amyloid specific dye AOI987 and near infrared fluoresence (NIRF) imaging.
Clearance of the dye was shown to be faster from the brains of control animals compared to
transgenic mouse models of AD indicating the specific retention of the fluorescent tracer in
the brain of animals displaying massive amyloid burden.
In a second step the developed imaging tools were used for treatment studies. Cur-
rently amyloid deposition modulating antibody treatment is thought to have high poten-
tial for future medication of AD. In contrast to most currently available treatments that are
symptomatic, this approach aims to modulate amyloid deposition which is believed to be
involved in the pathophysiology of the disease. In this PhD thesis both functional MRI (vas-
cular responsiveness) and NIRF imaging (amyloid burden) were applied to study the effects
of amyloid plaque modulating antibodies. We found that NIRF imaging is suited to monitor
the amyloid load over the treatment period in preclinical studies. In fMRI no major change
in vascular response to vasodilation was observed after antibody treatment.
In summary, this thesis provides evidence for the importance of the vascular aspect in
AD amyloid pathology. It furthermore illustrates the role of non-invasive imaging for char-
acterizing animal models of human disease and for evaluating the efficacy of therapeutic
interventions. Moreover, some of the methods might be translatable as diagnostic assays
into clinics.
viii

CONTENTS
Zusammenfassung
Das Wort “Demenz” kommt vom lateinischen Wort “dementia” was so viel bedeutet wie
“ohne Geist”. Damit wird grob beschrieben was dieses Symptom beeinhaltet: den Verlust
geistiger kognitiver Funktionen wie beispielsweise Gedächtnis, Lernen, Sprache, Aufmerk-
samkeit und vieler anderer mehr. Demenz kann viele Gründe haben - die wohl wichtig-
ste Ursache heutzutage ist die Alzheimer Krankheit. Bei Patienten, die an Demenz des
Alzheimer Typs leiden, findet man den Grund für die Störung in den Gehirnen, welche post-
mortem auf Ablagerungen, die sogenanntem Alzheimer Plaques untersucht werden können.
Diese Plaques bestehen zu grossen Teilen aus Peptiden, den Amyloid β-Peptiden, welche
in den Gehirnen der Patienten nicht abgebaut werden können. Es wird angenommen, dass
diese Plaques schlussendlich dafür verantwortlich sind, dass gewissen Nervenzellen, die für
Gedächntnis, Lernen usw. in den Gehirnen der Patienten verantwortlich sind, absterben,
was zu den Symptomen der Demenz führt. 1907 beschrieb der Arzt Alois Alzheimer zum
ersten Mal den Fall einer 51-jährigen Patientin, Auguste D., die wegen “rasch zunehmender
Vergesslichkeit” in eine Klinik eingewiesen wurde und deren Gehirn Alzheimer nach ihrem
Tod obduziert hatte - dort fand er zum ersten Mal die nach ihm benannten Alzheimer Plaques.
Seither wurde viel auf dem Gebiet der Alzheimer Krankheit geforscht - nicht nur um die
Krankheit besser verstehen zu können, sondern auch im Hinblick auf die Tatsache, dass die
Weltbevölkerung immer älter wird und so die Wahrscheinlichkeit, dass ein noch grösserer
Anteil der Bevölkerung an Alzheimer erkrankt, steigt. Weniger als 5% aller Alzheimer Pa-
tienten leidet an der genetischen Variante der Krankheit - über 95% leiden an der sogenan-
nten sporadischen Form von Alzheimer. Da bei der sporadischen Variante hohes Alter den
Hauptrisikofaktor zur Entwicklung der Krankheit darstellt, ist mit steigenden Patienten-
zahlen zu rechnen. Eine Früherkennung und, wenn auch nur sypmtomverzögernde, Be-
handlung würde die Lebensqualität von Patienten in einem frühen Stadium zumindest für
einige Jahre erhöhen.
Hier kommen nun die nicht invasiven bildgebenden Modalitäten ins Spiel. Auch wenn
die definitive Diagnose heutzutage noch immer nur post-mortem gegeben werden kann, ist
in diesem Bereich grosses Potential vorhanden, welches zusätzlich zu heute angewandten
Verhaltenstests genutzt werden könnte. Schon heute wird mit Magnetresonanztomographie
(MRT) und Positronen Emissions Tomoraphie (PET) versucht, potentielle Patienten frühzeitig
zu identifizieren und deren Behandlung wenn möglich sogar über längeren Zeitraum mit
den bildgebenden Verfahren zu verfolgen.
Diese Doktorarbeit beschäftigt sich mit der Anwendung verschiedener bildgebender Ver-
ix

CONTENTS
fahren im präklinischen Bereich. Mausmodelle, welche generiert werden um die Mech-
anismen, Auswirkungen, Konsequenzen, potentiellen Behandlungen usw der Alzheimer
Erkrankung zu untersuchen, wurden verwendet. Bei diesen sogenanntem arcAβ Mäusen
finden sich massive amyloid Ablagerungen im Gehirn, die mit zunehmendem Alter der Tiere
häufiger werden.
Der erste Fokus wurde auf den vaskulären Aspekt der amyloid Ablagerungen (cerebrale
amyloid Angiopathie, CAA) gesetzt. Es wurden zwei verschiedene MRT Methoden ange-
wandt, um die Konsequenzen der Ablagerungen von amyloiden Plaques um die Blutgefässe
des Gehirnes der Tiere zu untersuchen. In einer Studie, die sich mit den strukturellen Aspek-
ten des Projekts befasst, wurden hochaufgelöste MR-Bilder bei 9.4 Tesla Feldstärke gener-
iert, in welchen die anatomischen Details des Maushirnes und auch ansatzweise die struk-
turellen Konsequenzen von CAA, kleine Hirnblutungen, sichtbar gemacht werden konnten.
Ausserdem wurde MR-Angiographie, die Darstellung intakter Blutgefässe mit besonders ho-
her räumlicher Auflösung an arcAβ Mäusen und gesunden Kontrolltieren durchgeführt. Wir
fanden, dass bei arcAβ Mäusen, welche starke amyloid Ablagerungen an ihren Blutgefässen
aufzeigen, die Durchblutung gestört ist. Für grosse, den Cortex versorgende Blutgefässe
wurden Durchblutungsstörungen bereits in anderen Mausmodellen erkannt - im Fall der
arcAβ Tiere konnte mit dieser MRA Studie auch schon auf der Ebene der grösseren Blut-
gefässe der Mikrovaskulatur gezeigt werden, dass Kontrastmittel in wenigeren der Blutge-
fässen präsent ist als in Kontrolltieren. Dies deutet auf eine mangelnde Durchblutung von
Gefässen, welche von CAA betroffen sind, hin und könnte möglicherweise mit den in AD
Patienten beobachteten Perfusionsdefiziten korrelieren.
Eine funktionelle Konsequenz der CAA wurde mit Hilfe von funktionellem MRT unter-
sucht - arcAβ sowie APPDutch Tiere und deren jeweilige Kontrollmäuse wurden bei 4.7 Tesla
Feldstärke darauf untersucht, ob ihre Blutgefässe im Gehirn sich bei Bedarf erweitern kön-
nen. Wir fanden eine reduzierte Gefässfunktion in zwei verschiedenen Mausmodellen für
AD, was dafür spricht, dass CAA dazu führt, dass betroffene Blutgefässe nicht mehr gesund
auf physiologische Änderungen reagieren können.
Ein weiterer Fokus dieser Doktorarbeit lag auf der Anwendung einer anderen in-vivo
molekularen Bildgebungsmodalität. Bei der Nah-Infrarot Fluoreszenz Bildgebung (NIRF)
können kleine Tiere mit Licht im Nah-Infrarot Bereich bestrahlt werden, um Fluorophore
anzuregen und das emittierte Signal kann detektiert werden. Das Signal kann aus ver-
schiedenen Quellen stammen - im Fall dieser Studie wurde ein fluoreszierender Farbstoff,
welcher speziell an amyloid Ablagerungen bindet, in arcAβ Mäuse und Kontrolltiere gespritzt.
Die Auswaschung des Farbstoffes und demzufolge auch des Signals verläuft schneller in
x

CONTENTS
Kontrolltieren als in arcAβ Tieren, bei welchen der Farbstoff an die amyloid Plaques gebun-
den bleibt.
Zusätzlich zur Entwicklung der bereits erwähnten Methoden wurden Studien durchge-
führt, in welchen das Potential der Methoden für die Detektion von Behandlungserfolgen
untersucht wurde. In der Klinik sind zur Zeit verschiedene Behandlungen aktuell - die meis-
ten davon sind symptomatisch und versuchen die Auswirkungen von AD zu verlangsamen.
Es wird angenommen, dass eine Therapie, die zu einer Reduktion der amyloiden Ablagerun-
gen führt, von kausaler Natur ist. Die Idee dazu kommt aus der Beobachtung, dass in
Tierversuchen gezeigt werden konnte, dass bessere Leistungen in Verhaltensexperimenten
mit einer histologisch nachgewiesenen Reduktion von Alzheimer Plaques einhergehen. Es
gibt viele mögliche Ansätze zur Reduktion der amyloiden Plaques. Einer davon ist, die For-
mation der Plaques zu stoppen oder sogar rückgängig zu machen - wie erfolgsversprechend
und nebenwirkungsreich dieser Ansatz ist, bleibt abzuwarten. Im Verlauf dieser Doktorar-
beit wurde mit passiver Immunisierung gearbeitet. Antikörper, welche zuvor gegen men-
schliches β-amyloid generiert worden waren, wurden Mäusen gespritzt und es wurde hy-
pothetisiert, dass diese Antikörper zum Abbau und Entfernung von Plaques führen. Diese
Immunisierung wurde ein Mal im Experiment zur Analyse der funktionellen Konsequenzen
von CAA mit Hilfe von fMRI und ein anderes Mal in einer Studie in der NIRF Bildgebung
angewandt. In der funktionellen MRT Studie konnten keine Unterschiede zwischen behan-
delten und Kontrolltieren festgestellt werden. Im NIRF Experiment konnte gezeigt werden,
dass sich diese Methode eignet um Therapieansätze, welche potentiell die amyloide Patholo-
gie verändern können, in der präklinischen Forschung zu testen.
xi

CONTENTS
xii

Chapter 1
Introduction
1.1 Alzheimer’s Disease (AD)
1.1.1 Symptoms
The word dementia has its origin in the latin expression “de mentia” meaning approximately
“without mind”. It circumscribes the condition of loss of memory and other mental abili-
ties severe enough to interfere with daily life. Dementia is part of the symptoms in several
diseases - the most common one being Alzheimer’s Disease (AD), but many other patholo-
gies include dementia such as vascular dementia, mild cognitive impairment (MCI), mixed
dementia, dementia with lewy bodies, Parkinson’s Disease etc. Dementia is not the only
symptom that occurs in patients suffering from AD. The disease is commonly divided into
three stages: i) mild AD, where memory loss is the main symptom, ii) moderate AD, where
problems in brain regions controlling language, reasoning, sensory processing and concious
thought occur and iii) severe AD, where patients are inable to communicate and depend on
constant professional care. According to the American National Institute of Aging, symp-
toms in the different stages can include the symptons summarized in table 1.1.
1

Chapter
1:Introduction
mild AD moderate AD severe AD
getting lost increased memory loss and confusion inability to recognize oneself or family
trouble handling money and paying bills inability to learn new things inability to communicate
repeating questions problems recognizing family and friends weight loss
taking longer than before to complete normal daily tasks difficulty carrying out tasks that involve multiple steps seizures
poor judgment problems coping with new situations skin infections
losing things or misplacing them in odd places delusions and paranoia difficulty swallowing
mood and personality changes impulsive behavior groaning, moaning, or grunting
increased sleeping
lack of control of bowel and bladder
Table 1.1: Summary of symptoms of Alzheimer’s Disease (AD) at mild, moderate and severe stages of the disease. Adopted from [79].
2

1.1 Alzheimer’s Disease (AD)
1.1.2 Neuropathology
Definite diagnosis of AD can at the moment still only be obtained post-mortem by histolog-
ical examination of the patients brain. Ongoing efforts are put into the development of tools
for precise non-invasive diagnosis. Different aspects of AD can be considered as pathologi-
cal hallmarks. On a macroscopic level the main pathological hallmark is brain atrophy [70].
Reduction of brain matter volume can be caused by neuronal loss or ventricluar swelling -
both leading to brain atrophy. This hallmark has good potential to be detected under in vivo
conditions - the drawback is that brain atrophy does not exclusively occur in AD but also in
other neurodegenerative diseases [33]. Moreover, the hallmark reflects the advanced stage of
the disease. On a microscopic level two main pathological hallmarks are known: β-amyloid
deposits and neurofibrillary tangles (NFT). NFTs have not only been detected in brains of AD
patients but also in patients suffering from other types of dementia. Extensive deposition of
β-amyloid however exclusively occurs in AD pathology.
Amyloid deposits
Amyloid deposits can be subdivided into two subtypes depending on their location: i) amy-
loid deposits occuring in brain parenchyma, mainly cortical regions, hippocampus and amyg-
dala [99] or ii) cerebral congophilic amyloid angiopathy (CAA), with amyloid accumulating
around cerebral blood vessels. Generally, amyloid deposits consist of extracellular accumu-
lation of fibrillar matter, mainly amyloid β (Aβ) peptides. These peptides are downstream
products of cleaving the amyloid precursor protein (APP) and can be stained in brain tis-
sue using various histological stainig methods - the ultimate post-mortem proof for AD
diagnosis. Two different forms of amyloid deposits in the brain parenchyma can be dis-
tinguished. Compact amyloid plaques (also called senile plaques or neuritic plaques) and
diffuse plaques. Compact plaques are roughly spherical in shape with a dense core of aggre-
gated Aβ fibrils frenquently surrounded by dystrophic axons and dendrites and eventually
activated microglia and reactive astrocytes [99]. Diffuse plaques consist of amorphous ex-
tracellular deposits of Aβ and occur in large numbers in the same brain regions as neuritic
plaques. They seem to preceed neuritic plaque occurence and are also present in cognitively
normal elderly individuals. Apparently diffuse and neuritic plaques can occur in the brain
as a “morphological continuum” rather than two distinct types of lesions [99].
3

Chapter 1: Introduction
Neurofibrillary tangles (NFTs)
Another microscopic pathological hallmark, besides amyloid depositions, that can be de-
tected in post-mortem histological analysis is the occurence of intracellular neurofibrillary
tangles (NFTs). Normally the microtubuli-associated protein τ is a player of cellular stability,
transport and axonal growth. In AD and other neurodegenerative disease that can in sum-
mary be called “tauopathies”, τ-proteins become hyperphosphorylated and some shifts in
conformation occur that end in formation of τ-polymers found in NFTs [7]. All neuritic func-
tions mentioned above get compromised upon NFT formation which may ultimately lead to
degeneration.
The combination of NFTs and amyloid depositions is not yet fully understood and re-
searchers invesitigate relationships, cause or consequence or other possible connections be-
tween those two important hallmarks [8].
1.1.3 Prevalence
According to the World Health Organization (WHO) it is estimated that there are currently
about 18 Million people worldwide suffering from AD - it is believed that by 2025 this num-
ber will nearly double. Two forms of AD can be distinguished and patients be grouped
accordingly. The so called early-onset familial AD (FAD), that constitutes less than 5% of the
worldwide population, and the late-onset sporadic AD cases. Various studies have adressed
the question if demography, gender, socioeconomic status, culture etc. have an influence on
the risk of developing AD. Up to now only two riskfactors have been identified: age and
genetic predisposition. Age as the main risk factor (see figure 1.1) may go hand in hand with
some further observations about the distribution of AD in the world. In developing countries
life expectancy is lower than in industrial countries, thus the proportion of people develop-
ing AD is higher in the western world. Similarily the higher longevity of women may explain
the larger number of female patients worldwide.
FAD cases can be attributed to only about 300 families worldwide. Most of the families
have mutations in one of three different genes that have been identified as “causative genes”
for AD. The gene encoding for the amyloid precursor protein (APP) on chromosome 21 has
been found to play a major role, as cleavage of this protein leads, among others, to formation
of the β-amyloid depositions characteristic for AD. In addition it has been reported in 1984
[34] that people with Down syndrome (Trisomie 21) that carry an extra copy of chromosome
21 develop AD-like dementia in early life. This supports the importance of APP mutations
in AD. The other genes that have been identified are Presenilin 1 (PS1) on chromosome 14
4

1.1 Alzheimer’s Disease (AD)
Figure 1.1: The effect of age on the risk of developing AD. Prevalence rates increase
exponantially with increasing age in the western population. Figure from
the World Health Organisation (WHO), 2006.
and Presenilin 2 (PS2) on chromosome 1. Both Presenilins are part of secretases that cleave
APP. Mutations in these genes have been shown to alter secretase properties leading to for-
mation of the more toxic species of β-amyloid peptides. In addition, mutations of a τ-gene on
chromosome 17 can result in formation of neurofibrillary tangles (NFT) [109] another impor-
tant but not exclusive pathological hallmark of AD. A “non-causative” but “susceptibility”
gene encodes for the apolipoprotein E (ApoE), a lipoprotein normally involved in cholesterol
metabolism. Carriers of the ε4 allele of the ApoE gene have a higher risk to develop AD [85].
1.1.4 Amyloid cascade hypothesis
The amyloid cascade hypothesis is one of , if not the main, working hypothesis for AD. Ac-
cording to Hardy and Higgins in 1992 [39], the main pathological events in AD are formation
of amyloid plaques surrounded by neurons containing neurofibrillary tangles (NFT), vascu-
lar damage from excessive vascular amyloid plaque deposition and neuronal loss. The basis
for this hypothesis that showed the importance of amyloid plaques was, amongst others,
formulated of course already in 1907 by Alois Alzheimer when he discovered and described
amyloid depositions [1] and in 1985 by identifying the Aβ petide (Aβ) as the major compo-
nent of amyloid plaques [66]. The hypothesis states that “deposition of Aβ protein (AβP) is
the causative agent of AD pathology and that NFTs, cell loss, vascular damage and dementia
follows as a direct result of this deposition” [39]. Although it was not clear how exactly Aβ
causes neuronal loss and NFT formation, the contribution of calcium homeostasis was hy-
pothesized. First studies had shown that Aβ increased intraneuronal calcium concentrations
and that τ hyperphosphorylation and therefore NFT formation is influenced by intracellular
5

Chapter 1: Introduction
calcium [4]. Ten years later, the conceptually most important observations that reinforce the
amyloid hypothesis have been summarized by the author of the original publication [40].
Data from studying NFT formation in frontotemporal dementia, from crossing APP trans-
genic mouse models with τ-mutants or apoE4-deficient animals and others support the hy-
pothesis that altered APP processing occurs before τ alterations in the pathogenic cascade
of AD mutations. Of course there are also concerns about the amyloid cascade hypothesis:
amyloid plaque load does not correlate with cognitive deficits. This aspect has been adressed
by various researchers and a correlation of soluble Aβ species which also have been reported
to be neurotoxic, and cognitive impairment has been shown [77]. To date, the amyloid cas-
cade hypothesis has been “fine-tuned” several times and slight differences exist but the main
message still stays the same: Aβ peptides, especially 40 or 42 aminoacids long, are gener-
ated and start to form oligomers which initiate inflammation and affect synaptic and neuritic
functioning. Neuronal homeostasis gets disturbed and abnormal processing of microtubuli
associated protein τ leads to NFT formation. Neuronal dysfunction and loss finally lead to
symptoms of dementia. One possible scheme is shown in figure 1.2, trying to summarize
some of the current views (adapted from [40]),
It may be worthwhile mentioning that increased levels of Aβ in the brain that lead to β-
amyloid deposition can be caused by increased production or decreased clearance. Various
possible mechanisms for Aβ clearance under non-pathological circumstances have been pro-
posed, including endocytosis by astrocytes or microglia, enzymatic degradation, clearance
via the blood brain barrier or drainage along periarterial spaces (for review see [108]).
1.1.5 Vascular aspect of amyloid pathology in AD
Changes of cerebral blood vessels in normal aging but especially in AD patients are im-
portant research topics [53]. Maintenance of proper blood vessel conditions is essential, as
ruptures, microbleeding, infarctions, reduced reactivity etc can not only influence the well-
being of neurons but have fatal consequences such as stroke. Deposition of β-amyloid in the
brain of AD patients, and to a small degree also in the brain of all elderly people, is thought
to occur as described in the amyloid cascade hypothesis. Some researchers also propose
that Aβ found in cerebral amyloid angiopathy (CAA) is derived from degenerating smooth
muscle cells [55], [120]. Aβ-CAA affects predominantly small and medium sized brain ves-
sels including meningeal and cerebral arteries, arterioles and, less frequently, capillaries of
subcortical vessels and veins [51], [37], [38], [108], [115]. Neocortical areas are first affected
followed by allocortical regions and cerebellum, while subcortical structures and brainstem
join last [107]. Deposition of β-amyloid along the cerebral vasculature, CAA, occurs in most
6

1.1 Alzheimer’s Disease (AD)
familial AD
missense mutations in APP, PS1 and PS2 genes
increased Aβ production throughout life
sporadic AD
failure of Aβ clearance
slowly rising Aβ levels
accumulation and oligomerization of Aβ species mainly in cortical and limbic brain regions
subtle effects of Aβ oligomers on synapses
gradual deposition of Aβ oligomers as diffuse plaques
activation of microglia and astrocytesinflammation
progression of synaptic and neuritic injuries
change in neuronal ionic homeostasisoxidative injuries
altered activity of neuronal phosphatases/kinase
neuritic dysfunction and loss in affected brain regionsneurotransmitter deficits
DEMENTIA
hyperphosphorylation of protein tau
NFT formation
Figure 1.2: The sequence of pathological events leading to AD proposed by the amy-
loid cascade hypothesis. Both familial and sporadic form of AD are
thought to have the same underlying pathological principles finally caus-
ing dementia. Schematic drawing has been adopted from [30] AD hypothe-
ses and [40].
7

Chapter 1: Introduction
AD patients eventhough the CAA load may vary between patients with similiar degree of
parenchymal β-amyloid load. The extend of CAA varies among AD patients with compara-
ble burden of senile plaques, but different studies reveal the presence of at least mild CAA
in over 80% of AD patients [28] [19]. CAA has been shown to replace degenerated smooth
muscle cells along the cerebral vasculature [42], possibly increasing stiffness of the vessel
wall which may be associated with compromised blood vessel functioning and occurence of
microhemorrages [23] [100].CAA may also occur in elderly humans lacking AD hallmarks
and is therewith not a sufficient neuropathological hallmark of AD [99].
Histological investigations have revealed the architectural structure of CAA-Aβ deposi-
tions starts along the basement membrane situated between tunica adventitia and tunica me-
dia of cerebral arteries and than proceeds to the smooth muscle cell layer which is replaced
slowly by amyloid deposition [55] [122]. In capillaries, devoid of a smooth muscle cell layer,
amyloid deposition also starts in the basement membrane, may extravasate into the neuropil
and may also lead to capillary occlusion in severe cases [122], [108]. How CAA is generated is
still a matter of debate - one main hypothesis is that insufficient drainage along perivascular
spaces may block Aβ clearance [114], [108]. In physiological conditions, extracellular fluid is
transported from the brain via the perivascular spaces. Deposition of Aβ within the perivas-
cular space forms an obstacle and reduces the drainage capacity which leads to increased
parenchymal Aβ deposition. A “vicious circle” between increased Aβ production, impaired
clearance via the perivascular channels and additional factors may ultimately lead to severe
formation of CAA in AD. Some researchers divide CAA into two subtypes: “capillary CAA”
and “classical CAA” [108], mainly according to localization, association to ApoE4 allele and
occurence in AD patients. A summarizing scheme about the development of CAA is shown
in Figure 1.3, taken from the 2008 review from Thal and collegues [108].
As evident from figure 1.3, CAA can be divided into different stages: i) mild CAA with
deposition of Aβ in the vessel walls at the juntion of tunica adventita and media without
loss of smooth muscle cells, ii) moderate CAA where smooth muscle cell degeneration in the
tunica media occurs, compromizing vascular integrity and iii) severe CAA with extensive Aβ
deposition and focal vessel wall fragmentation, mircoaneurysms, signs of hemorrhage and
fibrinoid necrosis [108].
In addition to clinical manifestations of vasculopathy related to the occurrence of micro-
hemorrhages in normal aging and AD, vascular β-amyloid can compromise microvascular
compliance resulting in brain hypoperfusion, blood flow disturbances, vessel occlusion, im-
paired neurovascular coupling and neuronal dysfunction which increases the risk for demen-
tia [116],[117], [38], [106].
8

1.1 Alzheimer’s Disease (AD)
Figure 1.3: Deposition of Aβ along the cerebral vasculature (cerebral amyloid an-
giopathy, CAA). Illustration of how amyloid deposition starts and pro-
gresses in different types of cerebral blood vessels. Figure from [108].
Various mouse models focusing on the CAA aspect in AD have been generated, predom-
inantely carrying those human APP mutations found to lead to a high degree of vascular Aβ
deposition such as the Flemish, Iowa, Arctic or Dutch APP mutations [30].
1.1.6 Mouse models
As in all known diseases that affect human species - especially in those with such increasing
prognostics as AD - researchers try to mimick the disease in animal models. The aim is not
only to get further insight into the disease but mainly to find genetic or mechanistic aspects
and interactions, environmental risk factors, potential treatment and so on in order to cure
the disease. Animal models play a major role in preclinical biomedical research as by genetic,
surgical, pharmacological or behavioural manipulation certain aspects of a human disease
can be imitated and the effect of potential treatments observed. In AD the familial AD cases
(FAD) holds the opportunity to generate transgenic mouse models. Mutations found in the
families carrying FAD can be inserted into the mouse genome and be expressed under strong
promoters so that the transgenic animals develop the desired pathologies. In AD, the three
main players on a genetic level are the amyloid precursor protein (APP), presenilin 1 and 2
and microtubuli-associated protein τ.
9

Chapter 1: Introduction
Mutations in genes encoding APP
More than a decade ago the first transgenic mouse models carrying APP mutations were
generated. Very often a human APP gene sequence carrying mutations which lead to FAD
are inserted into the mouse genome. Most FAD mutations are listed on the homepage of the
Alzheimer Research Forum [30]. 24 APP mutations are listed, most of them indicate the name
of the geographic region where the mutation was found (Dutch, Swedish, London, German
etc) besides the “technical” name that indicates the type and location of the genetic mutation.
The year of discovery, the average age of AD onset in patients and the phenotype are listed
as well.
Figure 1.4: Aminoacid sequence of the transmembrane amyloid precursor protein
(APP). Mutations shown to be pathogenic are indicated in red. Figure from
the homepage of the Alzheimer Research Forum, posted by John Hardy,
National Institute of Aging, USA, 2007 [30].
Many of these FAD mutations are used in our days to generate transgenic mouse models.
10

1.1 Alzheimer’s Disease (AD)
Often multiple copies of the mutated human gene sequence are inserted under strong pro-
moters which lead to extreme expression of mutated amyloid precursor protein. As the mu-
tations normally lead to abnormally high depositions of β-amyloid these transgenic animals
are well suited to investigate not only mechanistical aspects of amyloid deposition but also
behavioural and functional consequences of Aβ deposition and are therefore indispensable
for preclinical research that aim at finding a treatment or cure for AD. An overview of APP
mouse models is presented on the homepage of the Alzheimer Research Forum ([30]). Before
the first human gene sequences were introduced into the mouse genome in 1996, changes in
the mouse genome have been performed like the introduction of multiple copies, translo-
cation and inactivation of the mouse APP sequence. One of the first and certainly most
imporant human APP mutations that was inserted into the mouse genome is the Swedish
mutation. Around 1996 various research groups successfully inserted this mutation into the
mouse genome, and stable mouse lines for AD reserach were born that not only displayed
amyloid pathology but partially also behavioural deficits in learning and memory [45], [13],
[90], [102]. Additional APP transgenic mouse lines that carry either another single FAD mu-
tation or combinations of mutations that increase, specifically distribute or change amyloid
pathology and correspondingly the phenotype [25] , [42] , [63] , [50] , [20] , [60] , [69] , [22]
were generated from that point on.
Mutations in genes encoding α, β and γ-secretases
Another approach to generate mouse models of AD is to modify the activity of the APP
cleaving protein complexes α, β and γ secretase. Processing of APP can occur between two
main pathways: the non-amyloidogenic pathway or the amyloidogenic pathway (see section
1.1.4, amyloid cascade hypothesis). In AD the balance is shifted towards the amyloidogenic
pathway where the final product of APP processing is β-amyloid. Aβ is the starting material
for formation of amyloid depositions in the brain. In FAD cases, mutations in PS1 and PS2,
both being components of γ-secretase, have been found. Therefore modulating the activity of
γ-secretase towards a faster and increased production of Aβ 40 or 42 peptide in mouse mod-
els is pursuit. One of the first human PS1 mutations inserted successfully into the mouse
genome was generated in 1996 [27]. From that moment on cross-breeding of APP and PS
mutation mice was performed resulting in several stable mouse models for AD that in some
cases showed very early Aβ deposition or cognitive impairments [12], [91], [87]. These dou-
ble mutants helped to elucidate the role of combined mutations in APP and PS in developing
AD and the influence of the Aβ 1-40 to 1-42 ratio on location and extent of Aβ deposits.
Mutations in the other secretases, α and β might be another possible approach in modifyig
11

Chapter 1: Introduction
Figure 1.5: Aminoacid sequence of the transmembrane protein Presenilin 1 (PS1) and
Presenilin 2 (PS2). Both, PS1 and PS2 are part of the active cleaving sub-
units of γ secretase. Mutations shown to be pathogenic are indicated in
red. Figure from the homepage of the Alzheimer Research Forum, version
of R.Crook, 2003 and J.Hardy, 2007 respectively [30].
amyloid deposition. Increasing the activity of α-secretase could potentially support process-
ing of APP via the non-amyloidogenic pathway. Reducing the activity of β-secretase may
have the same effect. It has been shown that two enzymes within the β-secretase complex
are mainly responsible for cleavage of APP: beta-site APP cleaving enzyme (BACE)1 and
BACE2. Transgenic and knock-out BACE-mice have been generated but do not seem to dis-
play behavioural AD pathology despite some changes of molecular aspects [17] , [11]. In the
α-secretase the main proteins responsible for cleavage have been identified and first trans-
genic mice overexpressing ADAM10, one of these cleavage proteins, have been generated
indicating the potential of ADAM10 to counteract cognitive deficits in vivo [97].
Mutations in genes encoding protein τ
Despite the good amyloid pathology resulting from mutations in APP and PS, occurence
of neurofibrillary tangles has not been observed. Independently, various transgenic mouse
models that micmick the NFT aspect of AD have been generated. Human τ encoding gene
sequences have been inserted into the mouse genome and transgenic animals displaying
τ-pathology, in part coinciding with cognitive deficits were born [62], [105] [104]. These find-
ings indicate the importance of τ-pathology on neuronal loss, motor behaviour and cognitive
deficits not only in AD but also other τ-pathologies.
12

1.1 Alzheimer’s Disease (AD)
In many AD patients amyloid and τ-pathologies occur concomitantely. Therefore a big
aim of mouse model researchers is to combine transgenic models and generate a AD model
as similar to AD patients pathology as possible. Various attempts have been taken in order
to generate those mice, one of the first ones being the APP/τ mouse [61]. As in these animals
τ pathology is more pronounced compared to single τ mutants, the hypothesis is that either
Aβ or APP influences the formation of NFTs, a mechanism which possibly occurs in human
AD patients as well. Other double transgenic mouse models were generated thereafter - even
a triple transgenic mouse model carrying three mutations, one in APP, one in PS1 and one in
τ, exists [78].
1.1.7 Treatment
Current treatment
Despite the growing number of AD patients no curative treatment for AD is available on the
market. According to the National Institute of Aging the complexity of the disease makes
it very unlikely that one treatment strategy can be applied to all patients to prevent or cure
AD. That is why current treatments focus on several different issues, including maintaining
mental function, managing behavioral symptoms and slowing AD, but no current treatment
has been proven to stop AD. Until 2009 the U.S. Food and Drug Administration (FDA) has
approved 5 drugs to treat AD, all of them acting on neurotransmitter systems in the brain
(for descriptive review see [24]).
Acetylcholin (ACh) is a neurotransmitter that acts on cholinergic receptors located on
neurons responsible for learning and memory. Acetylcholine esterase (AChE) degrades ACh
and therewith stops its action on the receptors. In healthy circumstances release and degra-
dation of ACh in the synaptic cleft are in balanced equilibrium. In AD and other types of
dementia the aim is to increase memory performance and hence increasing levels of ACh
by inhibiting AChE has been shown to be a possible strategy. The substances galantamine
(Razadyne R©, formerly known as Reminyl R©), rivastigmine (Exelon R©), donepezil (Aricept R©)
and tacrine (Cognex R©, rarely prescribed due to safety concerns) all have in common that
they act as AChE inhibitors and have been shown to improve memory performance in AD
patients. Galantamine in addition stimulates nicotinic receptors to release more acetylcholine
and rivastigmine prevents not only the breakdown of acetylcholine but also of butyrylcholine
in the brain [64].
Another approach is interference with the neurotransmitter system of glutamate. Exces-
sive amounts of this neurotransmitter have been shown to have toxic effects on neurons. Re-
13

Chapter 1: Introduction
duction of glutamate action upon its N-metyl-D-aspartate (NMDA) receptor by the NMDA
antagonist memantine (Namenda R©) has proven to be beneficial for memory performance in
AD.
In mild to moderate AD the four AChE inhibitors can be prescribed, in severe AD stages
only donepezil, out of the AChE-inhibitor group, and memantine (normally in combined
prescription) are currently used to meliorate memory decline in AD.
Future perspectives for AD treatment
Eventhough AChE inhibitors and NMDA antagonists will still be the most imporant medica-
tion to relief symptoms of AD, various other approaches are pursued and various are already
in clinical trials [71]. The main focus in the development of curative treatments of AD is set
on causative aspects of the pathology, namely amyloid aggregation and deposition, NFT for-
mation and neuroinflammation.
According to many findings that support the contribution of Aβ in the causative devel-
opment of AD, a main focus of treatment is set on preventing, slowing down, stopping or
even reversing the formation of Aβ plaques. In 2002, Hardy et al. proposed six possible
treatment strategies that interfere at some stage with the amyloid cascade: i) inhibition of β-
or γ-secretase, ii) active or passive immunization iii) anti-inflammatory drugs iv) cholesterol
lowering drugs, v) Cu2+ and Zn2+ chelators and vi) prevention of synaptotoxicity caused
by β-amyloid [40]. In 2006, a review by Mount and Downton summarized the currently
available drugs and the candidate medications in clinical trials. According to the situation at
that timepoint, the most promising treatment strategies were found to be in immunization,
anti-inflammatory drugs interfering with Aβ biology and symptomatic therapy employing
different neurotransmitter systems. Four different drugs that show modulation of amyloid
deposition are presented, AAB-001 (Bapineuzumab) in phase 2 clinical trials, tramiprosate
(Alzhemed R©), R-flurbiprofen (Flurizan R©) and leuprolide acetate (Memryte R©) in clinical
phase 3 trials.
One of the most promising approaches to modulate amyloid deposition is active or pas-
sive immunotherapy (for a review see [76]). The idea behind is comparable to that of com-
monly used vaccines: active immunization i.e. injection of the “untoxic” antigen (in the case
of AD: Aβ peptides) may initiate generation of antibodies in the organism which for the
rest of the life will prevent formation of amyloid depositions by removing Aβ peptides as
soon as they are generated in the body. At this point it may be worthwhile mentioning the
priviledged status of the brain concering immune reactions: the blood brain barrier (BBB)
protects the central nervous system (CNS) from most external influence. This normally also
14

1.1 Alzheimer’s Disease (AD)
includes iummune reactions i.e. infiltration of immune cells into the CNS. How antibodies
infiltarte the CNS and prevent formation of amyloid deposition is a matter of ongoing re-
search. First experiments in 1999 showed that injection of synthetic Aβ1-42 into transgenic
APP mice modeling AD attenuated amyloid pathology [95]. After these findings many active
immunization trials have been initiated - even in AD patients. One clinical trial was halted
shortly after the start due to side effects but long term oberservation of some AD patients
showed that patients that had responded to the immunization and developped antibodies
against Aβ showed less cognitive decline [44] and, post-mortem, less amyloid deposition
than expected [75] and increased incidence of CAA and hemorrhages [9] [10]. Passive im-
munization on the other hand comprises injection of externally generated antibodies against
β-amyloid. Advantage of this approach is a better control of immune reaction but again the
privileged immune status of the CNS renders the approach challenging. Various passive
immunization trials in AD mouse models have shown changes in Aβ load or at least local
distribution [26], [119]. AAB-001 is a humanized monoclonal antibody which was in clinical
phase 2 in 2006. Tramiprostate was shown to bind soluble Aβ preventing it to aggregate into
plaques. R-flurbiprofen and leuprolide acetate both show modulation of Aβ load by not yet
fully understood modes of action and were in phase 3 in 2006 [71].
Currently available drugs as well as selected candidates for treatment of AD that are in
clinical trials are summarized in table 1.2 (adapted from [71]).
15

Chapter
1:Introduction
DRUG (commercial name R©) COMPANY MECHANISM OF ACTION STATUS July 2006
donepezil (Aricept) Pfizer / Eisai Acetylcholinesterase inhibitor approved for mild/moderate/severe AD
rivastigmin (Exelon) Novartis Acetylcholinesterase inhibitor approved for mild/moderate AD
galantamine (Razadyne/Reminyl) Johnson-Johnson Acetylcholinesterase inhibitor approved for mild/moderate AD
memantine (Namenda) Lundbcek / Forest NMDA receptor antagonist approved for severe AD
AAB-001 ( Bapineuzumab) Wyeth/Elan humanized Aβ specific monoclonal antibody phase 2
tramiprostate(Alzhemed) Neurochem inhibits formation of amyloid plaques phase 3
R-flurbiprofen (Flurizan) Myriad Genetics nonsteroidal anti-inflammatory, lowers β-amyloid levels phase 3
leuprolide acetate (Memryte) Voyager Pharm. implantable leuprolide, modulates β-amyloid deposition phase 3
neramexane Merz NMDA receptor antagonist phase 3
xaliproden Sanofi-Aventis serotonin 1a agonist phase 3
lecozotan Wyeth serotonin 1a agonist phase 3
ispronicline AstraZeneca nicotinic acetylcholine receptor agonist phase 2
Table 1.2: Treatment of Alzheimer’s Disease - currently available drugs and potential drug candidates. Table adopted from [71].
16

1.1 Alzheimer’s Disease (AD)
1.1.8 Diagnosis
As mentioned previously, the definite AD diagnosis can still only be given post-mortem by
neuropathological histological staining of the brain for pathological hallmarks of AD, namely
amyloid deposition and neurofibrillary tangles. However clinicians can fairly accurately
predict whether a patient with memory problems has “possible AD” or “probable AD”. If
“possible AD” is diagnosed, the symptoms may be due to another cause like brain tumors,
blood-vessel disease, chronic intoxication, vitamine deficiencies, depression, thyroid prob-
lems, infections or so on. If “probable AD” is diagnosed and no other explanation for the
patients symtoms could be found, treatment of AD will start. Regular health check-ups help
to follow up the patients memory performance and efficiency of the treatment. The typi-
cally used test battery for potential AD patients diagnosis in our days includes clinical signs
of slowly progressive dementia, detected by behavioural test batteries like the “Mini-Mental
State Exam” (MMSE) [29] and potentially gross brain atrophy found by means of neuroimag-
ing.
Eventhough current medication is only symptomatic, the big efforts invested into find-
ing a cure for AD ask for synchronous efforts in diagnostic technology development. Early
disease recognition, developing sensitive and specific biomarkers possibly even specific for a
particular trait underlying AD pathology such as amyloid deposition or NFT formation are
highly desirable. Such clinical diagnostic tools will not only help to diagnose AD in an early
stage when treatment is still more efficient and pathology might be stopped but also to mon-
itor treatment effects in the individual and therefore help to find the appropriate treatment
strategy.
1.1.9 Potential of imaging in diagnosis of AD
Various approaches to establish early clinical diagnosis using not only behavioural readouts
but also in-vivo imaging devices are pursued [67]. Translation from preclinical to human
research and later into clinics is a great plus of most in-vivo imaging techniques.
Structural imaging techniques such as MRI or CT are mainly used in our days to exclude
other reasons for AD symptoms, namely dementia. Brain atrophy is a general sign of aging
and neurodegenerative disease but there have been studies that correlate atrophy in certain
brain regions with the cognitive impairments found in AD [21]. One drawback of this ap-
proach is the fact that detected “no brain atrophy” is not sufficient to exclude AD and that by
the time that brain atrophy is visible, substantial neuronal loss has already occured. There-
fore refinement and further development of possibly quantitative imaging techniques are
17

Chapter 1: Introduction
ongoing [81], [67]. Imaging modalities such as functional MRI (fMRI), PET, SPECT, diffusion
weighted MRI or MR spectroscopy (MRS) have great potential for AD diagnostics as they
may detect pathological changes in the brain before symptoms occur.
Metabolic changes in brain regions of AD patients can be detected using MRS - this tech-
nique was already used to monitor the cholinergic aspect of AD during treatment with a
cholinergic agonist [94]. Other MR techniques were found to show changes in diffusion in
various region of AD patients brains [54] [92].
One, though not exclusive, aspect of AD is hypoperfusion found in certain brain regions
like tempoparietal cortex. This reduction in cerebral blood flow and volume has been shown
using fMRI [14] and SPECT [18].
SPECT as well as PET are frequently used in AD research development. Not only neu-
rotransmitter/neuroreceptor systems can be investigated (see ([67]) for review) but also glu-
cose consumption differences between healthy and AD subjects have been found using FDG-
PET [101]. In 2004 a new PET tracer, Pittsburgh compound B (PiB) has been presented that
binds specifically to amyloid depositions [57]. Imaging Aβ has the potential to be a surro-
gate biomarker for AD with the effect of directly monitoring changes in amyloid deposition
during clinical trials of new potential anti Aβ drugs.
All these results show the importance of neuroimaging in AD research and diagnosis but
also the difficulty in finding markers that are disease-specific enough to be used in differential
diagnosis.
18

1.2 Imaging the brain in AD
1.2 Imaging the brain in AD pathology
In-vivo imaging has opened a whole new branch of tools for diagnosis and biomedical re-
search. Some of the imaging modalities are already decades old and still there is an enormous
potential for these techniques to be further developed and applied for biomedical investiga-
tion and finally diagnosis of different diseases. By definition “in-vivo” and “non-invasive”
comprises that the patient can be in a conscious state, no surgically manipulation is neces-
sary, except injection of contrast agents or tracers eventually, and information from inside
of the organism is obtained without having to open the subject. Alternative perspectives [2]
also include invasive imaging modaltities such as two-photon-microscopy into the group of
in-vivo imaging but here mainly non-invasive methods are described.
A huge variety of imaging modalities are available each with its “pros” and “contras” - a
complete overview is hard to give. Therefore only the imaging modalities used here, namely
MR and NIRF, will be described in detail.
The earliest biomedical imaging approach is certainly X-ray imaging, which was further
developed to obtain 3D information into X-ray computerized tomography (CT). The good
spatial resolution, tissue contrast and the relatively cheap infrastructure still makes it one
of the most frequently used imaging techniques in clinics despite the restriction it has due
to partially harmful radiation. Positron Emission Tomography (PET) on the other hand has
poor spatial resolution but due to the PET tracers that bind specifically to their target, the
sensitivity is very high. PET tracers are normally molecules that are attached to radioac-
tive elements like 18F or 11C which emit positrons. After travelling up to a few millimeters,
the positron encounters an electron which leads to annihilation of both, producing a pair of
annhiliation-γ-photons that travel in opposite direction and that can be detected using scin-
tillation detectors. PET imaging has a big potential in AD diagnosis since the development of
the PET tracer PiB [57] and related tracers. Combination of CT and PET is a way to combine
the positive features of two imaging techniques exploiting the good spatial resolution of CT
with the high sensitivity of PET.
1.2.1 Magnetic Resonance Imaging (MRI)
Magnetic Resonance (MR) can not only be used to obtain anatomical and structural informa-
tion from inside of the body. Various techniques can be performed in these scanners, from
spectroscopy to angiography, blood oxygenation measurements, high spatial resolution im-
ages and many more. MR is one of the most commonly applied in-vivo techniques in the
clinics and in preclinical research. Patients are exposed to a static magnetic field (B0) ranging
19

Chapter 1: Introduction
from 1 Tesla up to 3 Tesla for clinical applications and even higher for research in humans and
small animals. In MR imaging, radiofrequency pulses are applied in addition to B0. These
pulses excite protons which have magnetic properties and behave as atomic magnets. In the
excited (non-equilibrium) state, protons generate a signal that is detected as MRI signal. The
excited state has a finite lifetime. Relaxation back to equilibrium can be described by the
relaxation rate R1, which is the inverse of the the relaxation time T1. In addition, the MRI
signal is influenced by stochastic interactions with the environment which leads to a signal
decay characterized by a rate R2, and by static magnetic field uniformity characterized by R2*
(which accounts for both aspects). R1 and R2 (and R2*) differ between protons in different
environments, which is the origin of the excellent soft tissue contrast provided by MRI.
Short introduction to MRI [96]
Protons in a static magnetic field The nucelus of an atom consists, amongst others, of pro-
tons, which are positively charged particles that possess a certain spin, meaning they move
around an axis. Moving charge can be defined as electrical current and electrical current in-
duces a magnetic field. Therefore protons (also called spins) have their own small magnetic
field and can be seen as little bar magnets. When these little bar magnets are brought into a
static magnetic field (B0) like the one in an MR scanner, they allign parallel to the magnetic
field lines of B0. Two different alignments with different energy levels are possible: parallel
or anti-parallel to the magnetic field. Protons in the two alignment orientations cancel each
other out so that no magnetic field results if the ratio of parallel to anti-parallel is equal. Some
more protons will align in the lower energy level, the parallel one, as compared to the anti-
parallel alignment. These few protons (about 10 000 007 to 10 000 000) create the so called
longitudinal magnetic field that lays parallel to the field lines of B0. All protons in the paral-
lel or anti-parallel state exhibit a precession, a movement around the longitudinal axis which
has a certain frequency, the precession frequency. This frequency depends on the magnetic
field in which the protons are placed, the higher the magnetic field strength, the higher the
precession frequency. The precession frequency can be calculated using the Larmor equation:
ω0 = γ · B0 (1.1)
ω0 is the precession frequency in Hz or MHz, B0 is the strength of the static magnetic
field in Tesla and γ is the gyromagnetic ratio. The gyromagentic ratio is different for different
materials, for protons it is 42.5MHz/T.
The longitudinal magnetization that is caused by the small ratio of more protons aligning
20

1.2 Imaging the brain in AD
parallel can not be measured as it lays parallel to B0 in z-direction. In order to obtain an
image, the protons first have to be excited using a radio frequency pulse.
Applying a Radio Frequency (RF) pulse When a radio frequency (RF) pulse, an electro-
magnetic wave with the same frequency as the precession frequency of the protons, is applied
to protons in a B0 field two events occur:
i) the protons pick up energy from the RF pulse and some protons change their energy
state from parallel to antiparallel alignment. The consequence of this energy switch is a re-
duction of the longitudinal magnetization because protons in the opposite alignments cancel
out each others magnetic effects.
ii) The protons get in synchrony and start to precess in phase. As a consequece of this
phase coherence, a new magnetization, the transversal magnetization, laying orthogonal to
the main magnetic field, appears.
Switching off the RF pulse When the RF pulse is switched off, relaxation of the system
starts. Again two different independent processes occur:
i) T1 relaxation: after switching off the RF pulse, longitudinal magnetization increases
again as protons fall back from the higher energy level (anti-parallel) into the lower energy
level (parallel). The energy that is released by the protons (spins) by this process is transferred
to the surrounding lattice of the system. The time it takes for longitudinal relaxation, or spin-
lattice relaxation, is characterized by the longitudinal relaxation time T1. T1 is defined as the
time it takes until about 63% of the original longitudinal magnetization has recovered.
T1 varies with the magnetic field strength - it is longer in higher magnetic fields. This is
because in high B0, protons precess faster and energy transfer to the lattice is slower, therefore
T1 increases with increasing B0. When the precession frequency of the protons is similar to
the precession frequency of the lattice molecules, energy transfer to lattice is fast and T1
therefore short. Energy transfer to medium sized molecules is faster as compared to liquids
therefore liquids have long T1 and solid tissues short T1.
T1 depends on tissue composition, structure and surroundings and can also be described
by R1= 1/T1, longitudinal relaxation rate R1.
ii) T2 relaxation: transversal magentization decreases and disappears due to dephasing of
the precessing protons. Dephasing occurs due to two different properties: i)inhomogeneities
of the external magnetic field and ii) inhomogeneities of the local magnetic field within the
tissue.
In liquid tissues, water molecules move around very fast, thus their local magnetic fields
21

Chapter 1: Introduction
fluctuate very fast and average each other out, resulting in minor differences of the internal
magnetic field. Therefore spins stay in phase for longer in liquids which leads to longer T2
times in liquids as compared to solid tissues. In more solid tissues there are bigger variation
in the local magnetic fields within the tissue which leads to bigger local inhomogeneities and
therefore faster dephasing of protons resulting in shorter T2 times.
T2 is defined as the time it takes until the transversal magnetization has decreased to 37%
of it original value. The inversion of T2, 1/T2 is called tranversal relaxation rate R2.
The MR signal which can be measured originates in the transversal magnetic vector. The
protons that precess in phase induce a electric current that can be detected with an “an-
tenna”/receiver. The signal recorded by this receiver is called free induction decay (FID)
signal. The FID signal has a constant frequency and decreasing amplitude over time.
T1 relaxation takes longer than T2 relaxation. Both, T1 and T2 can be changed using
contrast agents (CA). CA are substances that are injected into subjects in order to enhance
signal contrast between different tissues. Normally contrast agents mainly affect a certain
type of tissue (blood pool, tumoreous tissue etc.) and change the T1 or T2 values of that very
tissue. Most CA have an influence on T1 and T2 and depending on the sequence used, either
the one or the other are exploited in order to enhance the contrast between tissues.
Repetition time (or time to repeat) TR The time between applying two 90 ◦ RF pulses is
called repetition time (TR). TR is chosen to be short or long depending on what type of image
should be obtained. If TR is chosen to be short (TR≤500ms), only few longitudinal magenti-
zation has recovered and the signal is weak but the resulting picture shows signal intensity
differences between tissues. This tissue contrast is mainly due to the different T1 times of the
tissues and the results are T1-weighted pictures.
After a long TR (TR≥1500ms) much of the longitudinal magnetization has recovered in
most tissues and we can receive a lot of signal but tissue contrast is low. In figure 1.7 the
difference between T1 relaxation in liquids and fatty tissue shows that with short TR good
tissue contrast is obtained whereas with long TR, differences in signal intensity are smaller.
When TR is chosen to be very long proton-weighted images can be obtained.
Echo time (or time to echo) TE Echo time is defined as the time span between collecting
the MR signal and its echos. Echos are created by rephasing the spins and thereby increasing
transverse magnetization.
Tissues have different T2 values. By chosing long or short TEs the difference in T2 be-
tween tissues can be exploited more or less. Liquids have long T2 therefore transverse mag-
22

1.2 Imaging the brain in AD
Z
X
Y
Z
X
Y
RadioFrequency (RF) pulse switched onZ
X
Y
RadioFrequency (RF) pulse switched offZ
X
Y
long. mag.
time
transv. mag.
time
T1-curve
T2-curve
B0
Protons in static magnetic field (B0)
RF-pulse
signal intensity
time
- protons align in static mag. field longitudinal magnetization appears
- protons switch from parallel to antiparallel long. mag, disappears- protons get in phase transversal magnetization appears
- protons go back from antiparallel to parallel long. mag, reappears- protons dephase transversal mag. decreases
antenna
1
12
23
3
Figure 1.6: Schematic illustration of the very basic events happening to protons in a
MR experiment. Adopted from [96].
23

Chapter 1: Introduction
time
signal
fatty tissue
liquid
short TR long TR
liquid
fatty tissueshort TE long TE
signal
time
a b
Figure 1.7: T1 and T2 curves for two different tissues (liquid and fatty tissue). Adopted
from [96].
netization disappears slower in liquid tissues than in tissues with short T2 (like fat) (see
figure 1.7). With short TE (≤30ms), differences in T2 do not influence tissue contrast very
much wherease with long TE (≥80ms), the tissue contrast is more pronounced which leads
to T2 weighted images.
TE/2 is the time span between the 90 ◦ RF pulse and a subsequent 180 ◦ RF pulse in spin
echo sequences or application of the magnetic field gradient in a gradient echo sequence. The
task of the 180 ◦ pulse is to invert the precession direction of the dephasing spins. The protons
which after the first 90 ◦ pulse are in phase and form the transverse magnetization dephase
when the RF pulse is switched off. Dephasing leads to a drop in transverse magnetization
and therefore in signal intensity. A 180 ◦ RF pulse causes the spins to precess in the opposite
direction and rephase. After another TE/2, the transverse magnetization will have recovered
and the signal intensity is strong again. The resulting signal is called echo or spin echo. The
same effect is obtained by applying a magnetic field gradient in gradient echo imaging. The
total time between 90 ◦ pulse and the echo is called TE, time to echo.
Signal intensity of the echos will be smaller than the original signal as protons do not
rephase completely. This T2 effect occurs because only the static inhomogeneities of the ex-
ternal magnetic field that cause dephasing can be recovered. Internal magnetic field inhomo-
geneities that are not constant within TE can not be rephased by a 180 ◦ pulse or a gradient
inversion . So for each echo the signal intensity decays and forms the T2 curve. In addition to
the T2 effect the T2* effect can be seen in figure 1.8 which describes the transverse magnetic
decay caused by dephasing of the protons. The T2* effect can be observed if a sequence is
used that does not rephase in order to obtain echo signals or between two echos and is used
for fast imaging for example in fMRI.
24

1.2 Imaging the brain in AD
time
T2*
T2
signal echo 1 echo 2
Figure 1.8: Relationship of signal decay with T2 and T2*. Adopted from [96].
Spin Echo (SE) sequences Spin echo sequences consist of two pulses, a 90 ◦ pulse to es-
tablish transversal magnetization and a 180 ◦ pulse to rephase protons after they dephase
when the 90 ◦ pulse is switched off. After the time TE from the 90 ◦ pulse we can record the
echo or often several echos after several rephasing pulses. By combining different TRs and
TEs, different MR pictures containing different types of information are generated using a
SE sequence. A big advantage of SE based sequences is that the sequences compensate for
field inhomogeneities and thus the signal decays with T2. The image quality in SE based
sequences is good but acquisition time rather long.
Gradient Echo (GE) sequences In gradient echo imaging, magnetization is flipped into the
transverse plane by applying a 90 ◦ pulse or a pulse at lower flip angle. After this excita-
tion, spins get out of phase due to spatial variations of their precession frequency caused by
differences in the magnetic field. The varying field consists of small field inhomogeneities
and field gradients applied for spatial encoding. A magnetic field gradient makes the spins
dephase faster and transversal magnetization decays quickly. By switching off the gradient
and replacing it with a gradient of the opposite direction, the frequency offset of the pre-
cessing spins is inverted at each spatial position. Spins that were moving fast under the
influence of the first gradient move slowly now and vice versa. Therefore protons rephase
and signal builds up again in a so called gradient echo. At the time point where the second
gradient exactly compensates for the dephasing effect of the first applied gradient, the signal
reaches maximum strength. The time between the first RF pulse and the time of maximum
signal strength of the echo is called echo time TE. The gradients generating the echo do not
25

Chapter 1: Introduction
time
signal
short TRshortTE
long TR long TE
long TR short TR
Figure 1.9: Combination of long and short TR and TE in spin echo sequences. The
table indicates the type of images obtained with combination of the two
parameters. Adopted from [96].
compensate for the dephasing effect of local field inhomogeneities. Thus signal is lost by
incomplete refocussing at the echo time. The signal decays with T2* instead of T2. The big
advantage of GE based sequences is the fast acquisition time but images might be distorted
due to susceptibility artifacts.
Spatial Encoding In order to obtain MR images it is necessary to know from where within
a sample the MR signal originates. This is achieved by three different steps.
i)A slice selection gradient is used in order to select imaging slices along the B0 field
(in z-direction). A magnetic gradient is superimposed onto the external magnetic field so
that protons within the sample are exposed to different magnetic field strengths and hence
possess different precession frequencies. A RF pulse is then able to excite only those protons
within a certain slice by using the appropriate precession frequency. Slice thickness can be
defined either by band width of the RF pulse or by the steepness of the gradient field.
ii) Within a slice a second magnetic field gradient, the frequency encoding gradient is
applied after the slice selection gradient in x-direction. This results in protons with different
precession frequencies along the x-axis. In y-direction all protons with the same position
on the x-axis still have the same precession frequency, therefore leading to “rows”of protons
with identical precession frequency.
iii) Protons within one frequency “row” along the x-axis are distinguished by applying a
very short phase encoding gradient in y-direction. During exposure time, protons along the
26

1.2 Imaging the brain in AD
y-axis precess with different frequencies. After switching off the phase encoding gradient,
these protons go back to their precession frequency defined by i) and ii) but are out of phase,
thus leading to spatial encoding along the y-axis.
Assessing structural changes in AD brains
In MRI acquistion there is always a tradeoff between temporal resolution, spatial resolution
and signal to noise ratio (SNR). One of the most challenging issues in small animal brain
imaging is the size of the sample - a mouse brain is about 1000 times smaller than a human
brain. Different techniques are being developed to tackle the fact that such small structures
demand high sensitivity. One of them is the use of cryogenic radiofrequency (RF) probes
to get a good spatial resolution or high SNR that allows detailed investigation of the mouse
brain in a reasonable time period [89] [3].
The importance of amyloid depositions in the pathology of AD is generally accepted.
Therefore one major approach of MRI in AD research is to visualize Aβ deposits in-vivo in
the human and murine brain. This approach would not only allow to assess the total plaque
load of patients brains as a diagnostic tool - monitoring of changes in plaque load upon treat-
ment and correlation with behavioural symptoms could be a long term goal for this applica-
tion. Different studies have been published that show localisation of Aβ ex-vivo in human
[6] or murine brain samples after exogeneous contrast agents application [83]. Correlation of
high resolution MR images with histological stainings revealed colocalisation of hypointense
spots in T2 weighted MR images [48]. Amyloid plaques with a diameter of approxiamtely
50µm were shown to be detectable in in-vivo MR images. Whether these hypointense spots
really represent pure amyloid plaques, whether some signal-loss may occur due to iron orig-
inating from blood in microhemorrhages or if other factors such as major blood vessels may
contribute, still remains to be investigated.
Amyloid deposition may not only occur in the brain parenchyma but also around cerebral
blood vessels forming cerebral amyloid angiopathy (CAA). It has been shown that CAA has
an influence on proper blood vessel function (see chapter 2.2). Blood flow disturbances, mi-
crohemorrhages and vessel occlusion may be a consequence of CAA. It has been shown that
aged transgenic APP23 mice modeling AD show cerebrovascular abnormalities and blood
flow disturbances [5]. Further development of MR sequences that do not only display dis-
turbances in major blood vessels but also in microvessels where CAA is supposed to start
earlier in life may elucidate the consequences of CAA on cerebral vasculature anatomy in
even more detail.
27

Chapter 1: Introduction
Assessing functional changes in AD brains
Neuronal activity within the brain is processed as electrical signal transmission by action
potentials and as chemical signal transmission between neurons by neurotransmitter action
at the synapses. Neurons are highly specialized cells that do not have the capability to store
energy. Therefore neuronal activity depends on energy supply by the blood system. The close
coupling between neurons and the cerebral vasculature is called neurovascular coupling and
states the basis for imaging neuronal activity non-invasively.
Upon neuronal activity, local cerebral glucose and oxygen consumption is increased [31].
Increasing those parameters is accomplished by changes in blood perfusion and blood oxy-
genation. Therefore the changes in hemodynamic response can be used to indirectly measure
neuronal activity. But, hemodynamic changes do not only occur as a consequence of neuronal
activtiy and can also be altered by physiological changes such as vasodilation.
Functional MRI (fMRI) can be used to assess changes of hemodynamic properties such
as cerebral blood flow (CBF), cerebral blood volume (CBV) and blood oxygenation (blood
oxygenation level dependent (BOLD) effect).
Cerebral blood flow (CBF) can be analysed using either arterial spin labeling (ASL) or by
examination of the first-pass bolus of a contrast agent (CA) injection.
With ASL, protons in the inflowing blood are labeled by saturation or inversion, which
leads to changes in longitudinal magnetization at the labeling slice. At some distance down-
stream the main blood flow direction, a slice of interest (imaging slice) is positioned where
the magnetization is assessed. The inflowing inverted spins within the blood reduce the total
tissue magnetization and consequently the MR signal intensity. Repetition of the experiment
without labeling the blood allows calculation of a difference image reflecting the amount of
arterial blood delivered. The reduction of the MR signal intensity is proportional to the blood
flow, since the faster the blood flow, the stronger the reduction of the MR signal.
Another option to assess perfusion is by tracking the bolus of a CA injection. Analysis of
the first passage of the contrast agent bolus through the vasculature reveals information on
local blood flow values. When CA concentrations level off in steady-state conditions tissue
CA concentration provides no information on the local flow but provides a direct measure-
ment of the local volume.
Changes in cerebral blood volume (CBV) are normally assessed using exogeneous con-
trast agents. The blood pool contrast agent (CA) Endorem R© for example consists of super-
paramagnetic iron oxide particles that increase R2 and R2* rates and therefore lead to a drop
in signal intensity in T2/T2*-weighted sequences. The blood volume can be increased by
28

1.2 Imaging the brain in AD
either neuronal activity or by physiological changes leads to vasodilation. As blood volume
increases the amount of CA increases and this leads to a drop in MR signal intensity in the
respective regions of the brain.
The basis of BOLD imaging lays in the local imbalance between oxyhemoglobin (Hb)
and deoxyhemoglobin (dHb) upon neuronal activity. As local blood flow increases the oxy-
gen extraction fraction decreases; as a result the ratio of Hb/dHb increases. As the ratio of
Hb/dHb changes, the signal within blood and surrounding tissue changes. The MR signal is
affected by this ratio, as dHb is paramagnetic and leads to intra-voxel dephasing of the MR
signal. In the presence of much dHb, the transverse relaxation time T2 in a voxel containing
blood vessels will be shorter as spins dephase faster. This leads to a faster signal decay in
voxels where there is more dHb than in voxels with less dHb. If the Hb/dHb ratio increases,
proportionally less dHb is present which accordingly leads to an increase of the MR signal in
T2* weighted BOLD imaging.
Testing the vascular function in AD with fMRI In AD research it is especially interest-
ing to assess the function of cerebral vasculature in consideration of the vascular aspect of
amyloid deposition. Vascular aspects in AD pathology comprise not only cerebral amyloid
angiopathy (CAA) but also related consequences thereof such as disturbances of hemody-
namic responsiveness, hypoperfusion with microinfarcts as well as microhemorrhages due
to ruptures [51], [38].
Two strategies for assessing the hemodynamic status of affected vessels can be pursued:
i) analysis of potential effects of CAA on resting state perfusion [84], [49] or ii) probing the
functionality of the cerebral vasculature by analyzing its response to a vascular challenge
[73], [74].
Dynamic measurements of vascular responsiveness are attractive as they reflect the capa-
bility of the vasculature to respond to the demands elicited by neuronal activity and hence
constitute a relevant functional readout. CAA has been shown to limit the capability of blood
vessels to dynamically adapt to altered physiological conditions and to increase CBV and
CBF upon demand [73], [72] . Possibly pathological changes in microvascular response to
a vasodilatory stimulus may even precede vascular complications such as the occurrence of
small hemorrhages [36] or the ability of affected blood vessels to supply dependent brain
tissues with blood in an activity-dependent fashion.
29

Chapter 1: Introduction
1.2.2 Near Infrared Fluoresence (NIRF) Imaging
Optical imaging summarizes different types of in-vivo imaging where either intrinsic opti-
cal properties of tissues or optical properties of a bioluminescent or fluorescent source are
expolited. The signal in fluorescent imaging originates from excitation of a fluorophor that
is located within the sample. Commercially available NIRF imaging systems work in the
fluorescence reflectance imaging (FRI) mode, where the light intensity distribution at the
surface of a sample is measured. The sample is placed under a light source which may be
a halogen light source for multi-spectral excitation or a near infrared (NIR) laser. Excitation
filters or beam wideneres respectively allow homogeneous irradiation of the sample at a cer-
tain wavelength. Irradiation of the sample leads to activation of the fluorescent light source
which emits light that can be filtered to the proper wavelenghth and detected using a sen-
sitive optical detector system. In addition a reference image of the surface of the sample is
taken with a different system which can be used for overlaying. In bioluminescent imaging
the light emitted by the bioluminsecent source is produced by a chemical reaction rather than
by excitation through light.
Figure 1.10: Schematic design of a fluorescent reflectance imaging system [93].
Information derived from planar optical reflectance imaging is qualitative or at best semi-
quantitative as localisation of the fluorescent source and local dye distribution are not pos-
sible in depth. Nevertheless comparison of different animals can be made if the same geo-
30

1.2 Imaging the brain in AD
metrical and scanning parameters are used. Spatial resolution of NIRF imaging lays in the
dimension of several millimeters, especially as the fluorescent signal is detecetd from the
surface of the sample only and no in-depth information is available.
Quantitative assessment requires information of the distribution of the fluoresenct source
in three dimensions which can be achieved using fluorescent molecular tomography (FMT).
Figure 1.11: Fluorescent Reflectance Imaging (FRI) compared to Fluorescent Molecu-
lar Tomography (FMT) of a mouse with two regions of fluorescent inten-
sity. In FRI the location of the fluorescent source can not be discriminated
whereas with FMT 3D information is available [93].
Principles of fluorescence [93] The basis of fluorescence is transition of the electrons in
molecular orbitals between discrete energy levels. Absorption of a photon by a fluorescent
molecule induces the transition of an electron from the ground state into the excited state.
When the electron returns to the ground state it emits a photon and this emission is called
fluoresence. Fluorescence always occurs at a longer wavelength than excitation.
For molecular imaging applications, low tissue absorption, efficiency expressed by the
extinction coefficient ε, good fluorescent quantum yield η and long fluorescent lifetime τ are
desireable.
In order to apply fluorescent imaging in living tissue the wavelength of choice should
lay between 650 and 900 nm, in the so-called NIR “window”. The three most prominent ab-
sorbers in living tissue are deoxyhemoglobin (dHb), oxyhemoglobin (Hb) and water (H2O).
Extinction coefficients ε of those three molecules are relatively low between 650nm and
900nm and absorption of photons therefore quite low (see figure 1.12). These characteris-
tics make this domain of the light spectrum well suited for in-vivo imaging in preclinical
biomedical research. Various fluorescent probes have been developed that work in the NIRF
31

Chapter 1: Introduction
domain and absorb and emit light between 650 and 900 nm at best.
Wavelength (nm)
0 .001
0 .01
0 .1
1
10
100
400 500 600 700 800 900 1000
H O2
Ext
inct
ion
coef
ficie
nt (
cm )-1
dHb
Hb
Figure 1.12: Absorption spectra of water (H20), hemoglobin (Hb) and deoxyhe-
moglobin (dHb). Adopted from [93].
Fluorescent probes Different fluorescent probes have been developed in order to image
biological processes in-vivo in the NIRF range.
Fluorescent proteins can be used as reporter gene products to monitor gene expression.
These reporter genes may replace the gene of interest or may be fused to it, resulting in ex-
pression of a fluorescent protein within a certain tissue, organ or general biological situation.
The most commonly used fluorescent proteins are green fluorescent protein (GFP) and red
fluorescent protein (dRFP). The latter one is better suited for NIRF imaging as its excitation
and emission maxima lay closer to the NIR spectrum and several mutations have been made
in order to shift it into the NIRF range.
Alternatively fluorescent signals can be generated following the administration of fluores-
cent dyes. These organic compounds are characterized by delocalized systems of π-electrons.
The longer the π-system, the longer the excitation and emission wavelength - this principle
allows the design of fluorescent dyes (theoretically at least) adaptable to the optical proper-
ties needed. However issues like lipophilicity, toxicity for the organism and photobleaching
makes translation from chemical synthesis to biological application rather demanding.
AOI987 [43] For research in the field of AD, a fluorescent dye has been developed that has
been shown to bind to β-amyloid depositions in the brain of APP23 mice [43]. AOI987 has
been derived from oxazine, shows low/no toxicity and, due to good lipophilicity, was shown
to cross the blood brain barrier easily (see figure 1.13). The dye has good spectral properties
32

1.2 Imaging the brain in AD
for optical imaging with maximum absorbance at 650nm and maximum emission at 670nm
and with a fluorescence quantum yield of 40%, indicating a good emission efficiency. Upon
intraveneous administration, the compound is rapidly distributed throughout the organism.
Kinetics show that the fluorescent signal is strongest right upon injection, followed by a de-
crease in both APP23 and control wildtype littermates. Signal decrease was shown to be
faster in the brains of control animals as compared to APP23 mice where AOI987 can bind
to amyloid depositions leading to a retention of the dye. Hence AOI987 in combination with
NIRF imaging states a attractive tool for an in-vivo semiquantitative readout of the amyloid
plaque load.
O
O
O
N
N
N+
Figure 1.13: Chemical structure of the fluorescent dye AOI987, binding to β-amyloid
depositions in the brains of mouse models of AD.
33

Chapter 1: Introduction
1.3 Aim of the thesis
This PhD thesis was part of a larger project with the aim of developing, establishing and
applying different imaging modalities for preclinical research in the field of Alzheimer’s Dis-
ease (AD). My contribution was embedded in the setup and application of structural and
functional Magnetic Resonance Imaging (MRI) as well as Near InfraRed Fluoresence (NIRF)
imaging experiments in mouse models of AD. My special focus was set on the vascular aspect
of amyloid deposition in these animal models that develop high cerebral amyloid angiopathy
(CAA) and the impact thereof on the different applications in MR. In the NIRF subproject,
establishment of the technique and application into two mouse models of AD was included.
Both techniques were used as part of treatment studies where the effects of amyloid plaque
modulating antibodies were investigated.
Experiments using a physiological stimulation paradigm in fMRI were performed in two
mouse models of AD in collaboration with AD research groups in Zurich and Tuebingen
respectively. The observation that fMRI techniques were sensitive enough to detect com-
promised vascular response in APP23 transgenic mice constituted the starting point of the
project focused on investigating vascular amyloid deposition in mouse models and thereby
the impact of CAA on vascular responsiveness. The fMRI experiments described in this thesis
showed that in a region of the arcAβ mouse brain where the CAA load increases with increas-
ing age, two different vascular parameters upon vasodilatory stimulation, namely vascular
reactivity and maximal vasodilation, show deficits in old arcAβ mice compared to control
littermates. No such genotype specific effect was found for a brain region displaying low
CAA load but a general aging effect. Young animals did not differ between the two groups.
The fMRI approach that assesses cerebral blood volume (CBV) changes using the clinically
approved contrast agent Endorem R© and the vasodilatory substance acetazolamide is per se
translatable into humans. We found good diagnostic accuracy, as far as this is possible with
such a small sample of animals. Therefore we think that the method would have good poten-
tial to be included into diagnostic test batteries for AD. The same type of experiments were
performed in very old APPDutch animals developing exclusive vascular amyloid pathology.
In this collaboration CAA load in different brain regions has been determined, fast and late
response of cerebral blood vessels have been assessed in CBV fMRI and an inversed correla-
tion of increasing CAA with decreasing fast response to acetazolamide in the frontal cortex
has been found.
The second subproject addressed the question whether NIRF imaging could be used to
assess the efficacy of therapeutic interventions that are known to modulate the plaque burden
34

1.3 Aim of the thesis
in mice. NIRF pilot experiments were performed in arcAβ and APP/PS1 animals. In both
types of animals AOI987, a fluoresenct dye binding specifically to amyloid plaques has been
shown to cross the blood brain barrier and clear from the brain of control animals faster than
from brains of AD mouse models. A longitudinal study was carried out in the arcAβ mouse
model in order to investigate the effects of amyloid plaque modulating antibody therapy on
the amyloid plaque load. We found that NIRF imaging in combination with AOI987 consti-
tutes a promising tool for preclinical research that is sensitive enough to semiquantitatively
detect changes in amyloid plaque load modulated by passive immunization trial. 4 weeks of
immunization lead to increases of NIRF signal that decreased after 8 weeks of immunization.
Data has been tentatively interpreted such that immunization therapy lead to fragmentation
of amyloid plaques thereby offering multiple binding sites for AOI987 and increase in NIRF
signal after 4 weeks. 8 weeks of immunization may lead to i) either further fragmentation,
with fragments being too small for AOI987 binding, ii) drainage of Aβ fragments to the vas-
culature where they form a mechanical barrier and thereby constrict passage of AOI987 into
the brain parenchyma or iii) removal of Aβ from the brain. Which of the potential expla-
nations is true or what other mechanisms may explain the observed phenomena has to be
illuminated by histological analysis which is part of this collaboration project.
The third project focused on the structural aspect of vascular amyloid deposition. High
resolution images recorded at 9.4 Tesla using a cryogenic coil showed that it is possible to
achieve a spatial resolution of 60µm isotropic. Various hypointense spots could be detected
in arcAβ mouse brains, indicating either amyloid deposition, microhemorrhages or blood
vessels. To further elucidate this issue, a special sequence in combination with a exogeneous
contrast agent was applied to old arcAβ mice with high CAA load with which blood flow
disturbances in the microvasculature should be detected. Results show that aged arcAβ mice
with high CAA load have less big intact brain vessels of the microvasculature as compared
to age-matched wildtype control littermates. As baseline perfusion deficits might be another
aspect of CAA in AD mouse models, this approach complimented the functional vascular
impairment of arcAβ mice seen in CBV fMRI.
35

Chapter 1: Introduction
36

Chapter 2
Development of in-vivo imaging
techniques
Different imaging approaches to assess the impact of vascular amyloid deposits in mouse
model of AD were developed and applied in this thesis. In a first attempt, structural changes
of cerebral vasculature assigned to cerebral amyloid angiopathy (CAA), the deposition of
β-amyloid along blood vessels, was investigated using Magnetic Resonance Angiography
(MRA). A functional Magnetic Resonance Imaging (fMRI) protocol, assessing changes of
cerebral blood volume (CBV) upon vasodilatory stimulation was applied on two different
mouse models of AD, arcAβ and APPDutch, both displaying a high vascular amyloid plaque
load. In chapter 3 this experimental setup was used in a treatment study in arcAβ animals.
Near InfraRed Fluoresence Imaging (NIRF) in combination with the β-amyloid binding dye
AOI987 was used in pilot experiments in arcAβ and APP/PS1 mice in order to establish
binding of AOI987 to vascular as well as parenchymal plaques. For a treatment study, arcAβ
mice were passively immunized and longitudinal changes of the NIRF signal were assessed
as shown in chapter 3.
2.1 In-vivo visualisation of anatomical and vascular changes due to
amyloid deposition in AD mouse models
Micro MRI stands for MRI with very high spatial resolution. At a field strength of 9.4T
an isotropic spatial resolution of 60µm can be achieved using a special cryogenic RF probe
[3]. The size of amyloid depositions varies greatly among different mouse models and also
human AD patients - diameters of 10µm [16] [68] up to 200µm are reported [48]. Readouts
to assess structural changes in brains of mice modeling AD were applied. Experiments were
performed in collaboration with Dr. Christof Baltes on a 9.4T MR system.
37

Chapter 2: Development of in-vivo imaging techniques
Introduction
As a basis for the MR Angiography (MRA) study, structural MR images with a very high
resolution were acquired in APP23 mice. These animals develop parenchymal as well as
vascular amyloid plaques in an age dependent manner. Various spots of hypointensive MR
signal could be detected in T2 weighted high resolution scans. These observations were the
basis for the subsequent study that investigated the effects of CAA on cerebral vasculature
using MR Angiography (MRA) in arcAβ mice. A high resolution MR sequence was used to
assess differences in cerebral vasculature between arcAβ mice and control littermates. Com-
parison of the high structural images before and after contrast agent (CA) administration
allowed the computation of difference images that depict those blood vessels in the brain
where CA is present and hence blood flow is intact. As the used sequence allows a spatial
resolution of approximately 60µm3, focus is set on investigating small brain vessels.
Methods and Materials
Animals arcAβ mice expressing human APP containing both the Swedish (K670N + M671L)
and the Arctic mutation (E693G) under the control of the prion protein promoter (PrP) were
generated as described previously [59]. Animals were kept at standard housing conditions
with a 12h dark/light cycle and free access to food and water. Experiments were performed
in arcAβ (tg; n=6; 25.2±1.5months) and wildtype control littermates (wt; n=6; 24.6±0.5months)
animals. Due to the homogeneous amyloid deposition pattern in this mouse model all trans-
genic (tg) mice display a high vascular amyloid plaque deposition (cerebral amyloid angiopa-
thy, CAA) whereas wildtype control littermates (wt) do not. All experiments were performed
in strict adherence to the Swiss Law for Animal Protection.
Animal preparation Mice were anesthetized with an initial dose of 3% isoflurane in an
air/oxygen (2:1) mixture, endotracheally intubated with a tube made from polyethylene (PE)
(inner/outer diameter: 0.58/0.96 mm, Portex, Smith Medical International Ltd., Kent, UK),
and actively ventilated at a rate of 90 breaths per minute (bpm) using a small animal ven-
tilator (MRI ventilator, CWE incorp., USA). The animals were positioned on a water heated
cradle made from Plexiglas to keep core body temperature at 37± 0.5 ◦C and isoflurane level
was reduced to 1.75% in air/oxygen (3:1). For subsequent intravenous (i.v.) infusions, the tail
vein was cannulated with a 30G needle (0.3 mm x 13 mm, BD Microlance, Drogheda, Ireland).
The penultimate 3D FLASH scan was followed by injection of 50µl Endorem R© (Guerbet SA,
Roissy, France) and after 1 minute the last scan using the same parameters was performed.
38

2.1 Structural consequences of cerebral amyloid angiopathy (CAA)
Scanning was performed on a Biospec MR system (94/30) (Bruker BioSpin MRI, Ettlingen,
Germany) using a cryogenic transmit-receive RF-coil [3].
MR acquistion High resolution scans before and after injection of 50µl exogeneous con-
trast(CA) agent were aquired in aged transgenic arcAβ and control littermates. The high
resolution 3D FLASH scan comprised the following parameters: repetition time (TR): 150ms,
echo time (TE): 2.91 ms, field of view (FOV): 15 x 12 x 2.2 mm2, matrix dimensions: 248 x 199
x 36, voxel dimension/spatial resolution: 60 x 60 x 61µm3, slice thickness: 2.2 mm, number
of slices: 1, number of averages: 2, scan time: 36 min.
Data processing Microangiography data was analysed using a in-house software (AIC-
viewer) that was programmed to count vessels on the difference images “after” as compared
to “before” contrast agent (CA) injection. Different parameters can be determined that influ-
ence the outcome of the vessel count:
i)“Noise threshold” is a threshold that can be set manually. It determines the threshold
that seperates signal from noise by using the following formula:
threshold(vesselvoxel) = mean(noise) + “noisethreshold′′ · stdv(noise) (2.1)
Mean and stdv (standard deviation) of the noise are defined in the noise ROI drawn on
the most dorsal slice of the VOI (see figure 2.1). Increasing “noise threshold” leads to a
reduction of the number of vesselvoxels (voxels containing a vessel) by more conservative
quantification of which voxels are considered vesselvoxels.
After defining which voxels are considered vesselvoxels by applying the noise threshold,
the second step consists of determining how many voxels have to be connected in order to
be counted as vessel by applying the “minimum number of connected voxels” threshold.
ii)“Minimum number of connected voxels” is the second threshold that can be adjusted
manually. “Minimum number of connected voxels” names the amount of consecutive voxels
that have to be adjacent to each other in order to be rated as a vessel. If the “minimum
number of connected voxels” increases, more voxels have to be in line in order to be counted
as a vessel.
Both parameters, “noise threshold” and “minimum number of connected voxels” are de-
fined per volume of interest in order to account for possible differences in brain size or other
variations. Volumes of interest (VOI) consists of summing up adjacent regions of interest
(ROIs) that are drawn manually on each of the 61µm thick coronal imaging slice of the 3D
data set. A VOI with a total thickness of 430µm covering exclusively the two neocortical
hemispheres (see figure 2.1) was defined for each animal seperately.
39

Chapter 2: Development of in-vivo imaging techniques
A total of three readouts: “number of vessels”, “number of vesselvoxels” and the ratio
“number of vesselvoxels/number of vessels” was calculated out of the data obtained for
varying “noise threshold” and “minimum number of connected voxels” for each animal.
Statistical analysis was performed by comparing data of arcAβ and control littermates in each
of the three readouts per “noise threshold” and “minimum number of connected voxels”,
seperately using independent two sample t-tests with p-values ≤0.05 considered significant.
noise
Figure 2.1: Volume of interest (VOIs) defined for the Magnetic Resonance Angiogra-
phy (MRA) analysis. In each animal, regions of interest (ROIs) were drawn
on 61µm thick slices of the 3D MR data set including both hemispheres.
“Number of vessels”, “number of vesselsvoxels” and the ratio “number of
vesselvoxels/vessel” were calculated for the resulting VOIs for each ani-
mal with varying “noise threshold” and “minimum number of connected
voxels”.
Results
MR images In figure 2.2, MR images before and after contrast agent (CA) administration as
well as the difference image between the two are shown for one control animal (wt) and one
arcAβ mouse (tg). In the wt mouse no hypointense spots are visible before CA administra-
tion. After CA administration various regions of low signal intensity are representing intact
blood vessels where CA is present. The difference image shows white spots at those places
were blood flow is undisturbed. In the tg mouse, hypointense spots are present already be-
fore CA administration. These spots may represent different anatomical alterations in the tg
mouse, β-amyloid deposition or microhemorrhages possibly caused by CAA being the most
probable ones. After CA administration more hypointense spots are visible in the brains of
tg mice as compared to the wt brain, as in this state CA in intact blood vessels add up to
the hypointense spots already present before CA administration. In the difference image no
clearly focused signal, indicating vessels which filled with CA, are visible in the tg brain even
though some differences between the two CA-states appear.
40

2.1 Structural consequences of cerebral amyloid angiopathy (CAA)
after contrast agent
difference image
before contrast agent
control wildtype arcAβ
Figure 2.2: High resolution MR images of one control (wt, left) and one arcAβ (tg,
right) mouse approximately 25 months old. The top row shows the MR
data acquired before contrast agent (CA) delivery, the middle row the same
image after CA delivery and the bottom row the difference image.
41

Chapter 2: Development of in-vivo imaging techniques
Vessel count Processing the high resolution MR data before and after contrast agent (CA)
administration led to three different readouts that give information about the number of
intact blood vessels in the brain of arcAβ (tg) and control wildtype (wt) animals.
a) “number of vessels” indicates how many vessels were detected using the manually
adjustable parameters “noise threshold” and “minimum number of connected voxels”. In
figure 2.3 a, the average number of vessels for wt and tg mice ± standard error of mean
(sem) with varying noise threshold are shown. The higher the noise threshold, the bigger
the difference between wt and tg animals, indicating that wt animals possess bigger blood
vessels than tg. In figure 2.4 a, the number of vessels is depicted depending on the vessel
threshold. With increasing “minimum number of connected voxels” more vesselvoxels have
to lay adjacent in order to be accepted as a vessel. Increasing the “minimum number of
connected voxels” threshold leads to a reduced number of vessels in both wt and tg with
significantly more vessels in wt as compared to tg mice.
b) “number of vesselvoxels” gives an estimate of how many voxels are considered to be
part of a vessel. Raising the noise threshold obviously reduces the number of vesselvoxels
as seen in figure 2.3 b and figure 2.4 b. Again while a high noise threshold represents a
more conservative and strict threshold of what is considered part of a vessel, the difference
between wt and tg becomes significant, indicating that less volume of the brain in tg mice is
vasculature tissue whereas in wt animals a higher ratio of tissue is vasculature as compared
to other brain tissue. Increasing the “minimum number of connected voxels” threshold leads
to reduced numbers of vesselvoxels in both wt and tg mice with constantly higher values for
wt animals (see figure 2.4 b).
c) the ratio of “number of vesselvoxels/number of vessels” is shown as a measure of how
big the vessels in the brain of animals are. Increasing the noise threshold leads to a significant
difference between wt and tg mice with arcAβ mice displaying smaller brain vessels as wt
animals (see figure 2.3 c). Increasing the “minimum number of connected voxels” threshold
to determine the length of blood vessels shows that tg have shorter blood vessels compared
to wt as already foreseeable from the two readouts “number of vessels” and “number of
vesselvoxels”.
Discussion
Deposition of β-amyloid along the cerebral vasculature (CAA) was shown to compromise mi-
crovascular compliance resulting in brain hypoperfusion, impaired neurovascular coupling
and neuronal dysfunction increasing the risk for dementia [116], [38]. CAA predominan-
tely occurs in small and medium sized brain vessels and can affect resting state perfusion,
42

2.1 Structural consequences of cerebral amyloid angiopathy (CAA)
a
b
c
**
0 2 4 6 8 10 12
0
50
100
150
200
250nu
mbe
r of v
esse
ls [a
.u.]
noise threshold [a.u.]
wt (n=5) tg (n=6)
**
6 8 10 12
0
50
100
150
200
250
num
ber o
f ves
sels
[a.u
.]
noise threshold [a.u.]
wt (n=5) tg (n=6)
* **
0 2 4 6 8 10 120
5000
10000
15000
20000
25000
num
ber o
f ves
selv
oxel
[a.u
.]
noise threshold [a.u.]
wt (n=5) tg (n=6)
*
*
*
6 8 10 120
200
400
600
800
1000
1200
1400
1600
1800
num
ber o
f ves
selv
oxel
[a.u
.]
noise threshold [a.u.]
wt (n=5) tg (n=6)
****
0 2 4 6 8 10 120
500
1000
1500
2000
2500
3000
3500
4000
num
ber o
f ves
selv
oxel
/ves
sel [
a.u.
]
noise threshold [a.u.]
wt (n=5) tg (n=6)
****
6 8 10 12-5
0
5
10
15
20
num
ber o
f ves
selv
oxel
/ves
sel [
a.u.
]
noise threshold [a.u.]
wt (n=5) tg (n=6)
Figure 2.3: High resolution MRA readouts “number of vessels” (a), “number of ves-
selvoxels” (b) and ratio of “number of vesselvoxels/vessel” (c). In the x-axis
the “noise threshold” increases therefore leading to a more conservative
vessel counting depicting mainly “bigger” blood vessels. Aged transgenic
arcAβ mice displaying a high vascular amyloid plaque load have less “big”
blood vessels compared to control wildtype animals (wt). The right column
shows a “zoom” of the left column for the high “noise threshold” values.
Data represent average±sem; asterisks indicate p-values ≤0.05.
43

Chapter 2: Development of in-vivo imaging techniques
a b c
*
*
*
3 4 5 6 7 8 90
5
10
15
20
25
num
ber o
f ves
selv
oxel
s/ve
ssel
[a.u
.]
min. number of connected voxels [a.u.]
wt (n=5) tg (n=6)
*
**
3 4 5 6 7 8 90
100
200
300
400
500
600
700
800
num
ber o
f ves
sevo
xel [
a.u.
]
min. number of connected voxels [a.u.]
wt (n=5) tg (n=6)
*
*
3 4 5 6 7 8 90
5
10
15
20
25
30
35
40
45
50
55
60
65
70nu
mbe
r of v
esse
ls [a
.u.]
min. number of connected voxels [a.u.]
wt (n=5) tg (n=6)
Figure 2.4: High resolution MRA readouts “number of vessels” (a), “number of ves-
selvoxels” (b) and ratio of “number of vesselvoxels/vessel” (c). Higher
“minimum number of connected voxels” threshold values indicate the ne-
cessity of more voxels containing vessel tissue that need to lay adjacent.
Increasing “minimum number of connected voxels” threshold leads to de-
creasing “number of vessels” and “number of vesselvoxels” for control (wt)
and arcAβ (tg) mice, with tg mice having significantly lower values. Data
represent average±sem, asterisks indicate p-values ≤0.05.
as shown in this chapter here, or the functionality of cerebral vasculature in an activated
state (see below in the section “functional consequences of CAA” ). Another clinical mani-
festation of vasculopathy is the occurrence of microhemorrhages which also underlines the
importance of the vascular aspect in cerebral amyloidosis and AD.
Differences between control animals and mice modeling AD in the aspect of resting state
perfusion and strutural change of vasculature have been found previously, for example in
APP23 where age-dependent cerebrovascular abnormalities and blood flow disturbances
have been found [5]. Whether deposition of β-amyloid along the cerebral vasculature (CAA),
soluble β-amyloid or a combination of both are responsible for the deficits found in cerebral
perfusion is still a matter of debate.
In the study presented here we found that aged tansgenic arcAβ mice displaying a high
vascular amyloid angiopathy load show a significantly lower number of big blood vessels
of the microvasculature. The actual diameter of the different vessels sizes in the microvas-
culature can not be determined absolutely at the current state. Comparison with histologi-
cal findings and advanced computational processing of the data may lead to more absolute
determination of the vessel diameters. The spatial resolution of the images is 60µm, but im-
portantly it has to be mentioned that a voxel, defined as a vesselvoxel, does not represent the
presence of a blood vessel with a diameter of 60µm. The blood pool contrast agent causes
local field inhomogeneities that cause the signal drop-out to appear bigger than the actual
44

2.1 Structural consequences of cerebral amyloid angiopathy (CAA)
blood vessel size. Hence the diameter of the vessels can not be determined in absolute values
at this point - by increasing the “minimum number of connected voxels” however, the length
of the vessels can be approximatively estimated by multiplying the “minimum number of
connected voxels” with 60,√
2· 60,√
3 · 60µm or an average value thereof.
Additionally, the number of vesselvoxels which is a measure for the amount of brain vol-
ume consisting of vascular lumen compared to other brain tissues, is reduced in arcAβ mice.
Hence the ratio of the two above mentioned parameters, the ratio of vesselvoxels/vessels
which indicates how many voxels a vessel consists of in the respective groups, is higher
in control as compared to arcAβ mice. This indicates that blood vessels in the brains of
aged arcAβ mice are either shorter or thinner in diameter. In line with this observation, AD
mouse models with severe vascular amyloid pathology have been reported to show changes
in the anatomy of cerebral blood vessels like replacement of vascular smooth muscle cells Aβ
leading to weakening of artery walls and increased risk of vessel rupture and intracerebral
hemorrhage [116].
45

Chapter 2: Development of in-vivo imaging techniques
2.2 Functional consequences of vascular amyloid deposition on blood
vessel function in AD mouse models
It has been reported previously that vascular amyloid deposition (CAA) can cause impair-
ment of vascular functions (see chapter 1.1.5, vascular aspect of amyloid pathology in AD).
In the experiments presented here, changes of cerebral blood volume (CBV) upon injection of
acetazolamide, a vasodilatory substance, have been assessed in arcAβ and APPDutch mice
modeling AD. The results of the study in arcAβ animals have been summarized in a man-
sucript and submitted for publication. The results in APPDutch animals are currently being
summarized for publication in combination with other aspects of this collaboration study.
2.2.1 Vascular response to acetazolamide decreases as a function of age in the
arcAβ mouse model of cerebral amyloidosis
The results of this study have been summarized as a manuscript and submitted for peer-
reviewed publication with the following authors: F.L. Princz-Kranz, T. Mueggler, M. Knobloch,
R.M. Nitsch, M. Rudin.
Abstract
Deposition of β-amyloid along cerebral vessels is found in most patients suffering from
Alzheimer’s Disease (AD). The effects of cerebral amyloid angiopathy (CAA) on the function
of cerebral blood vessels were analysed applying cerebral blood volume (CBV)-based-fMRI
to transgenic arcAβ mice. In parietal cortex, a brain region displaying high CAA, arcAβ mice
older than 16months showed reduced response to the vasodilatory substance acetazolamide
compared to age-matched wildtype animals, both with regard to rate (vascular reactivity)
and extent of vasodilation (maximal vasodilation). In striatum, displaying little CAA, no
genotype-specific decrease was observed but maximal vasodilation decreased with age in
arcAβ and wildtype animals. These findings indicate that vascular β-amyloid deposits re-
duce the capacity of cerebral blood vessels to dilate upon demand, supporting the hypothe-
sis that vascular β-amyloid contributes to hypoperfusion and neurological deficits observed
in AD and CAA. High diagnostic accuracy of the combined readouts in detecting vascular
dysfunction in arcAβ mice was found.
46

2.2 Functional consequences of CAA
Introduction
The function of cerebral vessels is subject to alterations during normal brain aging and in
particular in the case of neurodegenerative disorders including Alzheimer’s disease (AD)
[53]. β-amyloid deposition along cerebral blood vessels (cerebral amyloid angiopathy, CAA)
has been observed in most AD-patients, even though the extent of the angiopathy may vary
significantly among patients with comparable burden of parenchymal β-amyloid plaque de-
position [28]. Aβ-CAA affects predominantly small and medium sized brain vessels includ-
ing meningeal and cerebral arteries, arterioles, and, less frequently, capillaries and veins of
cerebral cortex and subcortical structures [51], [37], [38], [115]. In addition to clinical man-
ifestations of vasculopathy related to the occurrence of microhemorrhages in normal aging
and AD, vascular β-amyloid can compromise microvascular compliance resulting in brain
hypoperfusion, impaired neurovascular coupling and neuronal dysfunction increasing the
risk for dementia [116], [117], [38].
A variety of genetically engineered mouse models mimicking aspects of brain β-amyloi-
dosis in AD and CAA have been generated which develop both parenchymal Aβ pathology
and to a varying degree Aβ-CAA. Aβ-CAA has been shown to affect endothelium-dependent
vasoactivity in a global manner associated with compromised cerebral circulation [46], [47],
[100]. To what extent vascular dysfunction is a consequence of soluble Aβ or solid CAA is
matter of debate.
Given the progressive nature of CAA, non-invasive methods for quantitative assessment
of vascular Aβ deposition or functional consequences thereof, suitable for longitudinal stud-
ies are highly desirable. It has been shown that functional MRI (fMRI) probing the vascular
adaptation to altered brain function in response to a defined neuronal or vascular stimulus
might serve as biomarker for vascular dysfunction [73], [72]. In contrast to established tech-
niques for assessing cerebral blood flow (CBF) in animals such as laser speckle flowmetry,
which require cranial window or skull thinning, fMRI is non-invasive and hence translat-
able into clinics. Reversible hypercapnia induced by acetazolamide, a compound approved
for clinical use, might qualify as stimulus for probing the vascular response. Intravenously
administered, it selectively inhibits carbonic anhydrase leading to immediate and dose de-
pendent retention of CO2 [103] prompting vasodilation of blood vessels and correspondingly
increases in CBF [111], [32], [123] blood oxygenation levels [74] and cerebral blood volume
(CBV). Measurement of dynamic CBV changes caused by acetazolamide revealed a com-
promised hemodynamic response in aged APP23 mice as compared to age-matched litter-
mates [73]. In this study, CBV-changes upon acetazolamide administration were assessed in
47

Chapter 2: Development of in-vivo imaging techniques
arcAβ mice, which develop pronounced parenchymal and vascular Aβ pathology in an age-
dependent manner [59]. In particular we were interested in the question whether the rate of
onset and the maximal amplitude of the fMRI response to acetazolamide stimulation might
serve as diagnostic biomarker for the occurrence of Aβ-CAA in these animals.
Methods and materials
Animals arcAβ mice expressing human APP containing both the Swedish (K670N + M671L)
and the Arctic mutation (E693G) under the control of the prion protein promoter (PrP) were
generated as described previously [59]. Animals were kept at standard housing conditions
with a 12h dark/light cycle and free access to food and water. For the fMRI experiments
three different age groups of arcAβ (tg) and age matched control littermates (wildtype: wt)
have been used: young animals (10 tg: 2.5±0.1months and 9 wt: 2.5±0.1months), middle-
aged animals (9 tg: 15.5±0.1months and 10 wt: 15.7±0.2months) and aged animals (6 tg
23.1±0.7months and 8 wt: 23.2±0.3months).
Measurements of partial CO2 (pCO2) have been carried out in young animals (6 tg: 3.8±-
0.04months and 6 wt: 3.8±0.04months), middle-aged animals (6 tg: 16.5±0.03months and 4
wt: 16.6±0.02months) and aged animals (4 tg: 23.7±0.5months and 4 wt: 23.9±0.1months).
In the remainder of the text we will use ’3months’, ’16months’ and ’23months’ for identifica-
tion of the three age groups. All experiments were performed in strict adherence to the Swiss
Law for Animal Protection.
Animal preparation for MR and pCO2 experiments Mice were anesthetized with an initial
dose of 3% isoflurane in an air/oxygen (2:1) mixture, endo-tracheally intubated with a tube
made from polyethylene (PE) (inner/outer diameter: 0.58/0.96 mm, Portex, Smith Medical
International Ltd. Kent UK), and actively ventilated at a rate of 90 breaths per minute (bpm)
and a tidal volume of approximately 0.3ml/breath using a small animal ventilator (Alfos
Electronic, Biel-Benken, Switzerland) under operator supervision. For fMRI measurements
the animals were placed in prone position on a water heated cradle made from Plexiglas R©)
to keep core body temperature at 37± 0.5 ◦C and the isoflurane level was reduced to 1.75%
in air/oxygen (3:1). The head was fixed in a stereotaxic fixation. For subsequent intra-
venous (i.v.) infusions, the tail vein was cannulated with a 30G needle (0.3mm x 13mm,
BD Microlance, Drogheda, Ireland). A single dose of 15mg/kg of the non-depolarizing neu-
romuscular blocking agent gallamine (gallamine triethiode, Sigma-Aldrich Chemie GmbH,
Steinheim, Germany) was administered intravenously. For CO2 measurements, animals were
shaved and depilated (veet, Reckit Benckiser, UK) on their flank at the level of the pelvis un-
48

2.2 Functional consequences of CAA
der isoflurane anaethesia. The transcutaneous CO2 measuring electrode (Radiometer Med-
ical ApS, Denmark) was attached to the skin, the tail vein cannulated and the animal posi-
tioned on a heating pad in prone position.
MRI anatomical reference scans Experiments were performed using a Pharmascan MR
system 47/16 (Bruker BioSpin GmbH, Karlsruhe, Germany) operating at a magnetic field
strength of 4.7T (corresponding to 200MHz proton frequency). A cryogenic transmit-receive
RF-coil [89] has been used. Anatomical images were acquired using a multi-slice RARE
(rapid acquisition with relaxation enhancement) spin echo sequence [41] with an effective
echo time (TEeff): 10.41ms, repetition time (TR): 900ms and RARE-factor: 5. Further parame-
ters were field-of-view (FOV): 20 x 13mm2, matrix dimensions (MD): 200 x 130, slice thickness
(SLTH): 0.7mm, interslice distance (ISD): 1.2mm, number of slices (Nslices): 5 and number of
averages (NA): 1. This translates into voxel dimensions of 100 x 100 x 700µm3. Positioning of
the coronal imaging slices was carried out operator-interactively using a mid-sagittal slice as
a reference: the midline of the most posterior coronal slice was placed centered into the cen-
tral fissure between cortex and cerebellum. In atlas coordinates [80] the 5 slices corresponded
to approximately 0.62, -0.58, -1.82 (instead of -1.78mm relative to bregma as calculated the-
oretically with ISD 1.2mm), -3.08 (-2.98), -4.24 (-4.18)mm relative to bregma. Those sections
in the mouse brain atlas [80] have been selected that corresponded closest to the normalized
value of the fMRI experiment, bearing in mind that the fMRI slice thickness is 0.7mm.
fMRI protocol and stimulation paradigm To ensure reproducible conditions, fMRI exper-
iments were started approximately 30min after switching to reduced isoflurane levels. The
functional imaging protocol consisted of a RARE sequence with the following parameters:
temporal resolution: 40s, TR: 2500ms, TEeff: 80.2ms, RARE-factor: 32, FOV: 20 x 13mm2,
MD: 128 x 128, SLTH: 0.7mm, ISD: 1.2mm, Nslices: 5 and NA: 4. The corresponding voxel di-
mensions were 156 x 102 x 700µm3. The experiment for the assessment of the relative changes
in cerebral blood volume (CBV) consisted of three parts. First, eight sequential images have
been recorded yielding the baseline signal intensity Spre followed by the injection of a bolus
of Endorem R© (Guerbet SA, Roissy, France) at a dose of 60mg Fe/kg. After a waiting pe-
riod of 15min allowing the contrast agent concentration to reach a steady-state, 35 sequential
baseline images were acquired yielding the signal intensity S0. At image 35, acetazolamide
(30mg/kg, Diamox parenteral, Goldshield Pharmaceuticals Ltd, Croydon, UK) was adminis-
tered i.v. as a bolus using a spectrometer-controlled infusion pump and additional 51 images
were collected yielding the image series S(t).
49
Chapter 2: Development of in-vivo imaging techniques
Image analysis and data processing: relative changes of CBV in percent of pre-stimulation
CBV values were computed on a pixel-by-pixel basis according to [65]
∆CBV%(t) =∆CBV(t)
CBV0· 100 =
ln(S(t)/ln(S0)
ln(S0)/ln(Spre)CBV0· 100 (2.2)
Image analysis was carried out using Biomap (Novartis Institute for Biomedical Research,
Basel, Switzerland). Regions of interest (ROIs) for parietal cortex (pc) and striatum (str) were
defined on the appropriate image slice (see figure 2.5) approximately at the level of -0.58mm
relative to bregma using the mouse atlas by Paxinos and Watson [80]. Anatomical references
images for each age group were coregistered in an operator-interactive manner based on
visually defined landmarks using affine transformations. ∆CBV%(t) values were calculated
for all ROIs for each animal (figure 2.5b, parietal cortex and striatum). Values for left and
right side of the brain were found to be identical within error limits and therefore averaged
for further analysis. Statistical analysis was performed on ∆CBV%(t) profiles versus time
(figure 2.6) using repetitive measurement ANOVA.
Comparisons between groups have been performed assessing
i) the initial slope of the CBV response elicited by acetazolamide injection (t=0) applying
curve fitting using a biexponential model function
∆CBV%(t) = c · (exp(−b(t−t0))− exp(−a(t−t0))) (2.3)
t0 being the time of onset of the fMRI signal change in the brain, yielding
d∆CBV%(t)dt
= c · (a− b) (2.4)
ii) the maximum ∆CBV%(t) change derived from the average values in the interval 24
≤ t ≤ 34min (∆CBV%,max). Two-group comparisons were analysed using the two-sample
independent t-test, group comparisons using one-way ANOVA. All data are given as mean±
standard error of mean (sem), p-values ≤ 0.05 are considered statistically significant. Linear
regression analysis shown in figure 2.8 were performed according to formula
y = age · a + b (2.5)
with y being the initial slope or maximal CBV change respectively, a the slope of the
regression line and b the y-intercept.
Generation of vascular parameter maps In order to visualize changes in vascular param-
eters across different brain regions, three types of functional maps have been generated: i)
50

2.2 Functional consequences of CAA
Figure 1b
*
pcstr
a
*
c
dd
Figure 2.5: Structural MR images of the mouse brain. a) Sagittal MR image of a
mouse brain. b) Coronal slice showing regions of interest (ROIs) in parietal
cortex (pc) and striatum (str). c) and d) Horizontal high-resolution MRI
section through the brain of a 18months old arcAβ mouse displaying mi-
crohemorrhages (indicated by arrows). The scale bar represents 2mm.
baseline CBV% maps obtained by averaging CBV%(t) values (computed according to for-
mula 2.2 for each voxel for the period -13.3min ≤ t ≤ -6.7min), ii) maps of the initial CBV%
response to administration of acetazolamide by averaging CBV%(t) values over the period
0 ≤ t ≤ 3.3min, and iii) the maximum CBV% response by averaging CBV%(t) values over
the period 24 ≤ t ≤ 33.3min. For representation purposes the vascular parameter maps have
been first-order low-pass filtered and color-coded.
Transcutaneous measurements of pCO2 (ptcCO2) values It has been shown previously that
ptcCO2 measurements were proportional to arterial pCO2 values [88]. Transcutaneous mea-
surement of ptcCO2 offers the advantage that no blood samples have to be taken thereby
avoiding potential interference with the CBV-fMRI measurements. Measurements were per-
formed using a transcutaneously operating blood gas analysing device TCM4 (Radiometer
Medical ApS, Denmark, see [73]). The measuring electrode of TCM4 was stuck to the shaved
back of the animal, lateral to the spine at the level of the pelvis. A 20min time window was
used for equilibration. During that interval, isofluorane was reduced from 2.5% to 1.75%
(immediately after canulation of the tail vein). Baseline ptcCO2 values were recorded ev-
ery 2 seconds for 20min followed by injection of 30mg/kg acetazolamide. Recordings were
51

Chapter 2: Development of in-vivo imaging techniques
continued for another 40min, corresponding to the duration of the fMRI experiment.
Histology Mice were perfused with 0.9% Saline followed by 4% Paraformaldehyde (PFA),
post-fixed in 4% PFA overnight and brains were then kept in 30% sucrose at 4 ◦C. Free-
floating 40µm thick sections were stained using standard staining protocols. Briefly, sections
were washed with TBS, blocked in TBS containing 3% donkey serum and 0.25% Triton X-100,
incubated overnight at 4 ◦C with blocking solution containing an anti-Aβ antibody (6E10,
1:500, Signet Laboratories, USA) followed by DAB staining (Vectastain ABC Kit, Vector Lab-
oratories, USA) according to the manufacturers protocol.
Results
Vascular β-amyloid pathology reduces hypercapnia-induced CBV changes For analysis
of CBV changes induced by infusion of acetazolamide, five coronal sections of 0.7mm thick-
ness with an inter-slice distance of 1.2mm, (center-to-center) covering a large part of the fore-
brain have been recorded. The center of the most caudal slice was positioned at the fissure
between cerebellum and cortex (see figure 2.5). Regions of interest (ROIs) for the quantitative
analysis wer indicated on a coronal brain slice located approximately -0.6mm caudal to the
bregma. Those comprised: (i) the parietal cortex (pc), a brain region characterized by a high
load of vascular β-amyloid deposits in the arcAβ mouse line and (ii) the striatum (str), which
is less affected by β-amyloid deposition. According to the mouse brain atlas, the ROI pari-
etal cortex contains different functional cortical regions, mainly secondary somatosensory
cortex and insular cortex. The ROI named striatum comprises mainly the caudate putamen
part of striatum and possibly minor portions of the lateral globus pallidus might be included
as well. As one of the complications associated with CAA is the occurrence of microhem-
orrhages we also recorded high-resolution structural images of aged (18months old) arcAβ
mice using a gradient-recalled echo pulse sequence with a nominal resolution of 52 x 52 x
170mm3. A representative horizontal section (approximately 4mm ventral to bregma) in fact
displayed multiple abnormalities of low signal intensity in cerebral cortex (see figure 2.5c
and d, arrows), indicative for hemorrhagic lesions [56].
For the two ROIs described, the temporal characteristics of the CBV response to aceta-
zolamide stimulation at time t=0 has been determined in 3months (n=10), 16months (n=9)
and 23months (n=6) old arcAβ mice (see figure 2.6a, filled symbols) and corresponding age-
matched wt littermates (n=9, 10 and 8 for 3, 16 and 23months of age, respectively, 2.6a, open
symbols). For all age groups, fluctuations of baseline CBV values over time were of the order
of less than 4% of the respective mean value. Injection of acetazolamide led to a rapid in-
52

2.2 Functional consequences of CAA
crease of relative CBV values levelling off 5 to 10min following drug administration. For wt
animals the maximal CBV increase in parietal cortex reached values of 25≤ CBV%max ≤ 30%
irrespective of the age of the animals (see 2.6 top row). Analysis of the complete CBV curve
after acetazolamide injection using repeated measurement ANOVA revealed no difference
between arcAβ and control animals (p=0.55, repeated measurement ANOVA). However, in
16 and 23months old arcAβ mice the CBV response was significantly decreased (p=0.009
for 16 and 23months old combined, repeated measurement ANOVA). In striatum, no such
genotype difference regarding the CBV response could be detected at any age (see figure 2.6
middle row). However, there was a general decrease in the maximal striatal CBV values with
increasing age of both wt and arcAβ animals (see table 2.1 upper panel).
Representative histological sections are shown for an arcAβ and a wt animal of each age
group (see figure 2.6, top row). As previously published [59], 3months old arcAβ mice
showed no visible deposits, whereas 16 and 23months old transgenic mice showed high
amounts of β-amyloid plaques in cortical brain areas. The striatum, however, was largely
unaffected. In addition, lateral ventricles tend to increase in volume in arcAβ but not in wt
mice with age of the animals. This is also reflected in anatomical MR images, which indicate
enlarged lateral ventricles in 16 and 23months old arcAβ animals in agreement with studies
focusing on changes of ventricular size in different mouse models of amyloidosis [110]. In
histological sections this is apparent only at the age of 23months (2.7 top row). This discrep-
ancy is most likely due to the different thicknesses of the respective sections (in histology:
40µm, MRI: 700µm) which in MRI may lead to partial volume effects.
Maps of the vascular parameters of a representative animal of each group depict the
region-specific responses (baseline, initial and maximal CBV change) to the administration
of acetazolamide (see figure 2.7). The functional maps confirmed the findings derived from
the intensity profiles of individual ROIs (see figure 2.6): during the baseline interval, all ani-
mals showed stable ∆CBV% values throughout the brain within a range of ∆CBV% 0±4%. In
wt mice a pronounced CBV% response to acetazolamide administration has been observed
both with regard to the initial rate and the maximal increase in ∆CBV%. No obvious age-
related changes have been found, whereas in 23months old mice, the initial ∆CBV% change
was slightly diminished when compared to 3months old animals (2.7 fourth row). While a
normal pattern was observed in 3months old arcAβ animals, initial and maximal ∆CBV%
responses exhibited a significant decline as a function of age in arcAβ mice in particular in
cortical structures.
53

Chapter
2:D
evelopmentofin-vivo
imaging
techniques
3months 16months 23months
3months 16months 23monthsb
Figure 2
a
arcAβ (tg)wildtype (wt)
3months 16months 23monthsc
-20 -10 0 10 20 30
0
10
20
30
chan
ge o
f ptcCO
2 [m
mHg
]
time [min]-20 -10 0 10 20 30
0
10
20
30
chan
ge o
f ptcCO
2 [m
mHg
]
time [min]-20 -10 0 10 20 30
0
10
20
30
chan
ge o
f ptcCO
2 [m
mHg
]
time [min]
wildtype (wt)arcAβ (tg)
Figure 2.6: Injection of acetazolamide leads to increase of CBV and pCO2 values. Temporal profile of changes in regional CBV in parietal
cortex (a), striatum (b) and pCO2 values on back muscle (c) in response to acetazolamide administration (at t=0) in 3, 16 and
23months old arcAβ (filled/dark symbols) and control (open/light symbols) animals. Data represent mean±sem.
54

2.2 Functional consequences of CAA
Figure 3
histology
anatomy
baseline
early CBV change
late CBV change
38%-38% 0%
∆CBV%
control 3months control 16months control 23months arcAβ 3months arcAβ16months arcAβ 23months
Figure 2.7: Colour-coded CBV maps. Images for a representative arcAβ (tg) and con-
trol littermate (wt) of each age group. Histological sections stained for β-
amyloid, anatomical MR reference images and colour coded CBV maps
superimposed on the anatomical scans of baseline ∆CBV% values, early
changes in ∆CBV% and maximum CBV% values (∆CBV%max). Scale bar
represents 2mm.
Vascular reactivity versus maximal vasodilation as readouts for vascular β-amyloid pathol-
ogy To further characterize the hemodynamic responses to acetazolamide in arcAβ and
control littermates, two parameters have been derived from the profile CBV%(t) versus time(t):
the vascular reactivity, which is estimated from the initial slope of the CBV response, i.e.
d(∆CBV% (t))/dt)(t=0) (see figure 2.8 top row) , and the maximal vasodilation for the aceta-
zolamide dose used which was derived from the maximal CBV increase (average CBV%(t)
values for the interval 24min≤t≤34min (figure 2.8 bottom row). All values for the arcAβ
animals are expressed in percent relative to the values of the age-matched control littermates
in figure 2.8. In parietal cortex, the vascular reactivity decreased significantly with age with
a slope of -6.4%min/month (see table 2.1 lower panel, p=0.002). In contrast, in the striatum,
no age dependent change in vascular reactivity of arcAβ mice has been observed (see table
2.1 lower panel, p=0.89).
Similarly, the maximal vasodilation in the parietal cortex of arcAβ mice decreased signif-
icantly in an age dependent manner when compared to age-matched wt littermates with a
slope of -3.2%/month (see table 2.1 lower panel, p=0.01) but not in the striatum (see table
2.1 lower panel, p=0.77). However, in the striatum, a general age-dependent decrease in the
55

Chapter 2: Development of in-vivo imaging techniques
maximum vasodilation has been observed both in wt and arcAβ mice (slopes identical within
error limits: -5.3%/month for wt (see table 2.1 upper panel) and -6.3%/month for arcAβ). No
such aging effect in wt littermates was found for the striatal vascular reactivity or for any of
the two readouts in the ROI in parietal cortex (see table 2.1 upper panel).
parietal cortex striatum
Figure 4
a
b
Figure 2.8: Age-dependent reduction of vascular responsiveness in arcAβ mice. Lin-
ear regression analysis of the two parameters vascular reactivity and max-
imal vasodilation data in parietal cortex and striatum. Values represent
individual animals and mean±sem of arcAβ relative to respective controls.
Transcutaneous partial CO2 pressure (ptcCO2) change following acetazolamide injection
shows no genotype or age-specific difference In order to rule out the possibility that the
reduced CBV-fMRI response in arcAβ animals merely reflects a reduced sensitivity to the ac-
etazolamide challenge, i.e. to reduced plasma CO2 values, we measured ptcCO2 values in
drug naive wildtype and arcAβ mice of the three age groups. Injection of 30mg/kg aceta-
zolamide at time point 0min led to a significant increase of ptcCO2 in all groups of animals
(figure 2.6c). Statistical analysis per one-way ANOVA tests revealed no significant differences
between the six groups (3months wt, 3months tg, 16months wt, 16months tg, 23months wt,
23month tg) regarding (i) average baseline, (ii) absolute ptcCO2 values at time point of injec-
tion, (iii) absolute peak values, as well as (iv) the difference between baseline and peak (see
table 2.2). Additionally a two-way repetitive measurement ANOVA was performed on the
56

2.2 Functional consequences of CAA
absolute time profiles where no difference between age groups nor between genotypes was
found for baseline values (p=0.26 for age, p=0.19 for genotype, p=0.90 for age * genotype
interaction) nor after acetazolamide injection (p=0.37 for age, p=0.22 for genotype, 0.90 for
age * genotype interaction).
Discussion
Several genetically engineered mouse lines of cerebral amyloidosis such as APP23 [102], AP-
PDutch [42] arcAβ [59] display significant CAA and constitute attractive models to study
mechanistic aspects associated with the vascular pathology and to evaluate potential biomark-
ers of CAA. Two strategies for assessing the hemodynamic status of affected vessels can be
pursued: i) analysis of potential effects of CAA on resting state perfusion [84], [49] or ii)
probing the functionality of the cerebral vasculature by analyzing its response to a vascular
challenge [73], [74], [100]. Dynamic measurements of cerebrovascular responsiveness are at-
tractive as they reflect the capability of the vasculature to respond to the demands elicited by
neuronal activity and hence constitute a relevant functional readout. Moreover, the measure-
ment of changes relative to a baseline condition is in general more robust than the assessment
of absolute values of physiological parameters. Systemic inhibition of carbonic anhydrase
with acetazolamide has been shown to induce rapid increases in pCO2 values and concomi-
tant increases in CBV. A potential confound in this measurement are changes in systemic
hemodynamics, i.e. in heart rate and blood pressure (BP). Various studies report that injection
of acetazolamide does not significantly alter heart rate and blood pressure (see [32] and refer-
ence therein). The i.v. injection of 100mg/kg acetazolamide for example led to a doubling of
CBF in rat cerebral cortex without altering heart beat or blood pressure [32]. It appears that in
the dose range used, acetazolamide has no or little effects on BP which are within the range of
cerebral autoregulation. We therefore did not measure BP during our study, as cannulating a
major artery may lead to confounding effects in the dynamic CBV measurement. In addition
it may prevent longitudinal studies of the same animal. In non-transgenic wt mice, robust
increases in drug-induced CBV responses have been observed. Interestingly, brain regions
displayed distinct behaviors as the animals aged: while for parietal cortex both the initial
rate and the maximum extent of CBV changes were independent of the age of the animals (3,
16, and 23 months), the maximum CBV value (maximum vasodilation) significantly declined
in striatum as the mice became older at a rate of -5.3%/month (p=0.02, see table 2.1 upper
panel). The coefficients of variation of the maximal CBV response in wt mice were 50±19%
for parietal cortex and 54±19% for striatum. Large parts of this variability can be attributed
to variation in pCO2 values, the respective coefficient of variation being 36±5%, indicating
57

Chapter 2: Development of in-vivo imaging techniques
that the CBV measurement as such is highly reproducible. In 3 months old arcAβ mice, for
which CAA could not be detected, normal CBV responses have been observed indicating
that expression of the human familial AD mutations-carrying APP-transgene as such did not
alter vascular function. In both 16 and 23months old arcAβ mice however, the CBV response
to acetazolamide decreased to 75±11% and 54±22% of the values determined in respective
wt littermate controls, indicating that the CAA present in these age groups was associated
with reduced ability of cortical blood vessels to regulate CBV (and correspondingly CBF).
This clearly hints at CAA limiting the capacity of blood vessels to dynamically adapt to al-
tered physiological conditions and to increase CBV and CBF upon demand. As there were
no differences in ptcCO2 values between arcAβ and wt animals, neither before nor after the
acetazolamide challenge, the reduced cerebrovascular response of aged arcAβ compared to
wt animals cannot be associated to alterations in systemic carbonic anhydrase inhibition,
hinting at CAA deposition being the cause of the compromised vascular compliance. This
interpretation is corroborated by two observations: i) the CBV response declines as a func-
tion of age i.e. with progressive CAA, and ii) it reflects the spatial distribution pattern of the
vasculopathy with parietal cortex being severely affected in contrast to the striatum. Both
readouts of functional impairment, the vascular reactivity and maximal vasodilation, reflect
the severity of CAA. Displacement of smooth muscle cells by vascular amyloid leads to re-
modeling of the vascular wall [42] which is likely to increase the stiffness of the vasculature:
this would explain both the reduced initial slope and maximum vessel dilatation observed
in the transgenic mice. The reduced elasticity of the vessel walls may also be causally linked
to the occurrence of microhemorrhages (figure 2.5c and d) and the blood flow disturbances
observed in aged animals [5], both of which increase the risk for ischemic insults [37]. The
findings reported here are in line with data obtained in APP23 animals which also displayed
region-specific CBV changes in response to different types of stimuli [73]. The cerebrovas-
cular impairments in cortical regions with high β-amyloid plaque load however, were larger
in arcAβ (reduction of maximal CBV response of approximately 45%) as compared to APP23
mice (reduction of maximal CBV response of approximately 25%) of similar age, presum-
ably reflecting the higher CAA burden in the arcAβ mouse model. To evaluate the potential
of fMRI based assessment of a cerebrovascular challenge as a non-invasive in-vivo tool for
diagnosis of CAA, we estimated the sensitivity (ratio true positive/all positives) and speci-
ficity (ratio true negative/all negative) of the approach. We have chosen a ROI in parietal
cortex, which is known to display amyloid vasculopathy in 100% of old arcAβ animals. For
the vascular reactivity sensitivities of 75% and 67% and specificities of 70% and 63% have
been obtained for 16 and 23month old animals respectively, considering vascular reactivity
58

2.2 Functional consequences of CAA
values of less than 70% of the respective mean values for wt mice as indicator of pathology.
For the maximal vasodilation, the respective values were 56% and 67% for sensitivity and
90% and 63% for specificity using an identical threshold of 70%. The statistical relevance of
the test could be enhanced by combining the two readouts: using a threshold of 70% of wt
values for vascular reactivity and 53% of wt values for maximal vasodilation (values below
these thresholds being considered pathologic), we obtained sensitivities of 75% (6 out of 8
animals) and 83% (5/6) for 16 and 23months old animals and specificities of 90% (9/10) and
100% (8/8) respectively. In the combined test, animals were classified positive when scoring
positive in one of the two criteria.
This combined assay for CAA might complement a diagnostic test battery for AD that
should include independent information about AD pathology as provided for example by as-
sessing the Aβ burden using PET in combination with the plaque-specific tracer 11C-PIB [52].
It is likely that pathological changes in microvascular response to a vasodilatory stimulus
may precede vascular complications such as the occurrence of small hemorrhages frequently
observed in AD patients as a consequence of CAA, which may be visualized with MRI [36].
The importance of developing non-invasive readouts of Aβ-CAA severity or its functional
consequences respectively is also highlighted by the findings that the degree of treatment
related side effects such as microhemorrhages probably vary depending on the severity of
CAA in AD models [82]. The outcome in preclinical immunization trials targeting parenchy-
mal Aβ deposits with regard to CAA is discussed controversially. Observations range from
prevention of CAA development [98], decrease of CAA load [98] to exacerbated formation
of vascular amyloid [82], [119], [86] in response to immunotherapeutic interventions. The
underlying causes for the latter, e.g. a structural destabilization due to a redistribution of
Aβ deposits from the parenchyma to the vasculature or an antibody-dependent perivascular
immune-reaction are currently under investigation [15] for a review [115]. Our data are in
line with many reports highlighting the importance of the vascular component in AD, which
might translate into novel therapeutic strategies. Non-invasive readouts of the vascular β-
amyloid pathology may play an important role in this context. In conclusion, our results
show that Aβ-CAA in transgenic arcAβ mice impairs the elasticity of blood vessels leading
to decreased vascular reactivity and maximal vasodilation. These deficits are likely to com-
promise neurovascular coupling and hence the ability of affected blood vessels to cope with
increased CBF demands during neuronal activation. The results also indicate that neuronal
and glial production of Aβ caused by expression of an APP transgene under the control of the
murine PrP is sufficient to cause functionally relevant vascular pathology. Finally, dynamic
measurements of the vascular response to a vasodilatory stimulus constitute a sensitive assay
59

Chapter 2: Development of in-vivo imaging techniques
to assess vasculopathy in murine models of cerebral amyloidosis with good sensitivity and
specificity. It might be attractive to include the approach in the diagnostic testing for CAA in
patients with suspected brain β-amyloidosis.
60

2.2Functionalconsequences
ofCA
A
Statistical tables
ROI 3months 16months 23months slope (unit/months) R2 p-value
control animals
vasc. reactivity pc 4.0±0.8 12.6±2.3 6.9±1.8 0.2 0.08 0.17
str 7.3±1.8 10.4±2.3 4.6±1.0 -0.1 0.01 0.63
max. vasodilation pc 23.1±4.5 27.4±2.4 28.8±605 3.0 0.03 0.35
str 22.7±3.4 17.0±2.3 11.7±3.4 -5.3 0.22 0.02
arcAβ
vasc. reactivity pc 180±34.3 69.9±15.9 56.0±21.1 -6.4 0.38 0.002
str 124.5±25.5 57.3±18.5 165.6±70.6 0.4 0.001 0.89
max. vasodilation pc 120.3±22.0 74.5±10.9 53.6±14.8 -3.2 0.25 0.01
str 107.0±9.5 92.6±24.4 102.2±30.7 -0.4 0.004 0.77
Table 2.1: Statistical table summarizing vascular reactivity and maximal vasodilation of control and arcAβ animals. Summary of values
for vascular reactivity and maximal vasodilation for control and arcAβ mice of all age groups. For control animals, absolute values
are given in order to assess general aging effects in mice. For arcAβ mice, values are given in % relative to the average value of the
respective age-controlled littermate group. Values are given in avg±sem. Linear regression was calculated for each readout in each
region of interest separately and slope, R2 and p-values of the linear regression are given in the table. Unit of vascular reactivity:
%/min; unit of maximal vasodilation: %. Abbreviations: region of interest: ROI; parietal cortex: pc; striatum: str. p-values ≤0.05
are considered significant.
61

Chapter
2:D
evelopmentofin-vivo
imaging
techniques
3months,wt 3months, tg 16months, wt 16months, tg 23months, wt 23months, tg
baseline ptcCO2 26.3±40 29.1±1.9 23.5±4.2 26.3±1.2 27.6±1.5 32.6±3.3
ptcCO2 at 0min 26.5±4.6 29.0±2.4 23.5±3.9 25.8±1.3 28.7±2.1 31.8±2.2
peak ptcCO2 42.2±6.2 48.9±4.9 37.0±5.7 40.6±2.6 41.7±3.5 45.3±3.7
∆ptcCO2 (peak - baseline) 15.9±7.4 19.8±5.3 13.5±7.1 14.3±2.8 14.1±3.8 12.7±5.0
Table 2.2: Statistical table summarizing transcutaneous measurements of pCO2 values. pCO2 values (ptcCO2 in [mmHg]) in arcAβ and
control mice of all age groups (see figure 2.6). Different parameters of ptcCO2 time series have been assessed. Values are calculated
on group averages of relative change of ptcCO2. Values are given in mean±sem and no significant differences between the groups
were found.
62

2.2 Functional consequences of CAA
2.2.2 Correlation of CAA and impairment of vascular responsiveness in aged
APPDutch mice
In collaboration with Dr. Martin Herzig and Dr. Bettina Wegenast-Braun from the group
of Prof. M. Jucker (University of Tuebingen, Germany) and collaborators from other insti-
tutions, a study was performed investigating the spatial distribution of CAA and its effect
on vascular responsiveness and cognitive performance in APPDutch mice and control litter-
mates. Functional MRI (fMRI) assessing changes in cerebral blood volumen (CBV) upon va-
sodilatory stimulation with acetazolamide was our part of the contribution to the manuscript
that is currently in preparation in Tuebingen. The figures shown here are also part of this
manuscript as well as of the PhD thesis of Bettina Wegenast-Braun [112]. Results found in
behavioural and histological parts of this study were performed by other partners of this col-
laboration but are mentioned in order to show the fMRI results in their complete context of
the entire study.
Introduction
As mentioned previously, the vascular aspect of amyloid pathology in AD is thought to be of
great importance for neuronal dysfuntion in the disease, as neurons energy supply depends
strongly on the supply from the flowing blood. When neurons are active, blood oxygena-
tion, blood flow and hence blood volume increase locally. If this vasodilation is disturbed
for a long timespan, for example by deposition of amyloid plaques around the cerebral vas-
culature, the neurons that require energy may degenerate and various intermediary steps
may finally lead to dementia as seen in AD. The vascular aspect of amyloid deposition of
Alzheimer’s Disease (AD) can be investigated in different mouse models. One mouse model
that has strong age-dependent cerebral amyloid angiopathy (CAA) is the APPDutch mouse
model [42]. Old APPDutch and their respective control littermates have been used for this
study where local distribution of CAA in the mouse brain as well as functional consequences
thereof have been investigated. After undergoing the behavioural test battery assessing cog-
nitive performance, vascular responsiveness was examined by observing the vasodilation of
cerebral vessels upon acetazolamide stimulation using CBV fMRI. Animals were euthanized
after fMRI experiments and brains prepared for histological analysis, especially for CAA
quantification.
63

Chapter 2: Development of in-vivo imaging techniques
Methods and Materials
Animals APPDutch mice overexpressing the human APP sequence bearing the E693Q “Dutch”
mutation have been generated as described previously [42]. For water-maze/open field,
fMRI experiments and CAA quantification aged male and female hemizygous APPDutch
mice (tg) and age-matched controls wildtype littermates (wt) were used at the age of 25 to 31
months (behavior analyses (wt and tg, n=12 for water-maze / wt n=12 and tg n=11 for place
navigation [112]), CAA quantification [112] and fMRI (wt n=10; tg n=7). Mice were kept at
a 12 h light/dark cycle with free access to food and water and were moved from group to
single housing before the experiments. All procedures with animals were performed in com-
pliance with protocols approved by the respective local animal use committee and university
regulations.
fMRI experiments Mice were anesthetized with an initial dose of 3% isoflurane in an air/-
oxygen (2:1) mixture, endotracheally intubated with a tube made from polyethylene (PE) (in-
ner/outer diameter: 0.58/0.96 mm, Portex, Smith Medical International Ltd., Kent, UK) and
actively ventilated at a rate of 90 breaths per minute (bpm) using a small animal ventilator
(Alfos Electronic, Biel-Benken, Switzerland). The animals were positioned on a water heated
cradle made from Plexiglas to keep core body temperature at 37± 0.5 ◦C and isoflurane level
was reduced to 1.75% in air/oxygen (3:1). For subsequent intravenous (i.v.) infusions, the tail
vein was cannulated with a 30G needle (0.3 mm x 13 mm, BD Microlance, Drogheda, Ireland).
A single dose of 15 mg/kg of the non-depolarizing neuromuscular blocking agent gallamine
(gallamine triethiode, Sigma-Aldrich) was administered intravenously. Scanning was per-
formed on a Pharmascan MR system (47/15) (Bruker BioSpin GmbH, Karlsruhe, Germany)
using a cryogenic transmit-receive RF-coil [89]. Anatomical images were acquired using a
multi-slice RARE (rapid acquisition with relaxation enhancement) spin echo sequence [41]
with an effective echo time (TEeff): 10.41 ms, repetition time (TR): 900 ms and RARE-factor:
5. Further parameters were field-of-view (FOV): 20 x 13 mm2, matrix dimensions (MD): 200
x 130, slice thickness (SLTH): 0.7 mm, interslice distance (ISD): 1.2 mm, number of slices
(Nslices): 5 and number of averages (NA): 1. This translates into a voxel dimension/spatial
resolution of 100 x 100 x 700µm3. Identical localization of the acquired slices was controlled
visually by positioning the most posterior slice in the central fissure between cortex and cere-
bellum yielding images slices approximately at the level of +0.62, -0.58, -1.82, -3.08, -4.24 mm
relative to bregma respectively [80].
The functional imaging protocol consisted of a RARE sequence with the following pa-
rameters: temporal resolution: 40 s, TR: 2500 ms, TEeff: 80.2 ms, RARE-factor: 32, FOV: 20 x
64

2.2 Functional consequences of CAA
13 mm2, matrix dimensions: 128 x 128 , slice thickness: 0.7 mm, interslice distance: 1.2 mm,
number of slices: 5, voxel dimension: 156 x 156 x 700m3, number of averages: 4. For the
assessment of the relative change in CBV measurements comprised three parts. First, eight
pre-contrast images were acquired followed by a bolus injection of 55 mg/kg Endorem R©
(Guerbet SA, Roissy, France). After 15min the contrast agent reached steady-state conditions.
35 baseline images were acquired followed by i.v. injection of acetazolamide (30mg/kg, Di-
amox parenteral, Goldshield Pharmaceuticals Ltd, Croydon, UK) as a bolus followed by ad-
ditional 51 image repetitions. Image analysis and data processing: relative changes of CBV
in percentage of prestimulation values (∆CBV%) were computed on a pixel-by-pixel basis ac-
cording to [65] (see formula 2.2). Spre being the signal intensity before injection of contrast
agent, S0 the baseline signal intensity before functional challenge and S(t) the signal inten-
sity after injection of acetazolamide. Image analysis was carried out using Biomap (Novartis
Institute for Biomedical Research, Basel, Switzerland). Cortical ∆CBV% values were derived
from ROIs defined on all image slices (see figure 2.9). Statistical analysis was performed for
different integration time frames (i) one to four minutes (0-4min), representing the fast and
early response of the vasculature and (ii) 26 to 36 minutes (26-36min) representing the max-
imal vasodilation of the blood vessels to acetazolamide injection. Regions of interest (ROI)
used for fMRI analysis are shown in figure 2.9.
mou
se b
rain
atla
s
medial ROIsmedio-lateral ROIslateral ROIs
anat
omic
al M
R im
age
indi
catin
g R
OIs
0.62mm -0.58mm -1.82mm -3.08mm -4.24mmrel. Bregma
Figure 2.9: Regions of interest (ROIs) defined for the APPDutch animals and control
littermates. ROIs are superimposed on axial MR scans and the respective
section from the mouse brain atlas indicating the location relative to bregma
are shown [80].
65

Chapter 2: Development of in-vivo imaging techniques
Results
CAA distribution in APPDutch mouse brains [112] Histological analysis of APPDutch
mouse brains was performed in order to assess CAA load and distribution. There was an
overall increase in CAA in (i) the magnitude of affected smaller branches, in (ii) affected de-
scending cerebral arterioles, and in (iii) the occupied area within affected vessels in strongly
affected CAA animals. In summary, CAA progression in aged APPDutch mice therefore im-
plies a frontal (rostral) to posterior (caudal) gradient of CAA expression ( see figure 2.10), a
sequential involvement of main cerebral arteries towards smaller branches, a progressive en-
gagement of descending, parenchymal arterioles and an increase in the percentage of CAA-
covered area within affected vessels (for details see [112]).
Figure 2.10: Immunohistological staining for CAA. 25µm thick sagittal section of the
brain of a 29months old APPDutch mouse. Deposition of CAA is more
pronounced in frontal as compared to posterior regions of the neocortex.
CAA (dark spots) is stained by polyclonal anti-Aβ antibody DW6, gen-
erously provided by D. Walsh, Dublin, Ireland. Figure provided by our
collaborators from the Laboratory of Prof. M. Jucker.
Behavioural experiments [112] To further address the impact of CAA on cognitive func-
tion, aged APPDutch mice and controls were tested in behavioral assessment addressing
hippocampal-dependent spatial memory with the Morris water-maze and anxiety with the
open field test. Both behavioural readouts did not show significant differences between old
APPDutch and their control littermates. No correlation of behavioural readouts and CAA
66

2.2 Functional consequences of CAA
load was found.
fMRI Normal brain function requires the ability of cerebral vessels to respond to neu-
ronal activity with changes in blood oxgenation, cerebral blood flow (CBF) and blood vol-
ume (CBV). This ability of cerebral blood vessels to react to neuronal needs is called cerebral
vasoreactivity. Cerebral vasoreactivity can be experimentally assessed by intravenous injec-
tion of acetazolamide [73]. Acetazolamide reversibly blockes the carbonic anhydrase thereby
leading to retention of CO2 causing vasodilatation. In this study, dynamic changes of CBV
(CBVrel) following an acetazolamide injection (at timepoint t=0min) were analysed in aged
APPDutch (tg) and control wildtype littermates (wt) mice. Analysis were assessed in differ-
ent cortical subregions (medial, medio-lateral, lateral) in different coronal planes (see figure
2.9). Results are reported for the average of medial, mediolateral and lateral ROIs of both
hemispheres. Data from all cortical regions over the five imaging slices and for the most
frontal and most posterior slices of the brain area covered by MR imaging seperately are
displayed in figure 2.11.
Both wt and tg mice showed a rapid increase of CBV right upon acetazolamide injection
in cortical brain areas, with a persistent increase over the next 20 minutes translating into a
more stable plateau phase (see figure 2.11 d). Relative CBV changes were analysed for two
time frames: 0-4 min after acetazolamide injection, representing the early phase of vascular
reactivity, and 26-36 min after acetazolamide injection, when CBV changes were near maxi-
mum levels in the wt animals and the maximal vasodilation for this acetazolamide dose was
achieved (see figure 2.11 left column). Data are shown for the sum of all ROIs in the cortex
(2.11a) and for the frontal (2.11b) and posterior (2.11c) cortex seperately. Statistical analysis
revealed no significant differences between wt and tg mice in the integration time windows
0-4 minutes after acetazolamide injection (independent two sample t-test; cortex: p=0.30;
frontal cortex: p=0.19, posterior cortex: p=0.71) nor for the integration time windows 26-36
minutes after acetazolamide injection (independent two sample t-test; cortex: p=0.79; frontal
cortex: p=0.99, posterior cortex: p=0.84).
CAA distribution was found to display an anterior to posterior gradient with most CAA
detected in frontal to medial cortical planes [112]. Therefore only the frontal plane and its
ROIs were used for further analysis between wt and tg mice. Additionally APPDutch mice
were grouped into subgroups referring to their cortical CAA load which had been quantified
following histological examination. Thereby two subgroups were defined with a relative
low (<1) or high (>1) cortical CAA load. While the temporal profile of relative CBV changes
appeared similar when wt mice were compared with the overall tg group (see figure 2.11d)
67

Chapter 2: Development of in-vivo imaging techniques
-20 -10 0 10 20 30
0
20
40
60
rela
tive
chan
ge o
f CBV
[%]
time [min]
wt (n=10) tg (n=7)
-20 -10 0 10 20 30
0
20
40
60
rela
tive
chan
ge o
f CBV
[%]
time [min]
wt tg CAA<1 tg CAA>1
0.0 0.5 1.0 1.5 2.0 2.5 3.0
10
20
30
40
50
∆C
BV
(0-4
min
) [%
]
CAA load cortex [a.u.]
0
20
40
60
80
100
120
140
160
inte
grat
ed C
BV
cha
nge
[%]
wt (n=10) 0-4min tg (n=7) 0-4min wt (n=10) 26-36min tg (n=7) 26-36min
cortexa
0.62mm
0
20
40
60
80
100
120
140
160 wt (n=10) 0-4min tg (n=7) 0-4min wt (n=10) 26-36min tg (n=7) 26-36min
inte
grat
ed C
BV
cha
nge
[%]
posterior cortex
c
d
e
f
-4.24mm
b
frontal cortex
0
20
40
60
80
100
120
140
160 wt (n=10) 0-4min tg (n=7) 0-4min wt (n=10) 26-36min tg (n=7) 26-36min
inte
grat
ed C
BV
cha
nge
[%]
Figure 2.11: fMRI results in APPDutch and control mice. Injection of acetazolamide
leads to increase in CBV in APPDutch and control littermates. Integration
of the CBV profiles for the time windows 0-4min and 26-36min after injec-
tion are shown for all cortical ROIs (a), only frontal ROIs (b) and posterior
ROIs (c). CBV profiles of wt and tg mice (d) and tg subgroups with high
and low CAA load (e). Correlation of early integration window results
with CAA load in (f).
68

2.2 Functional consequences of CAA
, the subgroup of tg mice with the high(er) CAA load indicated a delayed CBV increase
with lower values until it reached wildtype levels in the very last minutes (see figure 2.11e).
In addition, a significant inverse correlation was observed for the initial CBV changes (0-
4 min) and the cortical CAA load of the respective mice for the frontal plane (+0.62 mm
relative to bregma; simple regression, ANOVA: R2=0.707; ANOVA: F(1,5)=12.1, p=0.018, see
figure 2.11f), but not for the posterior plane (-4.24 mm relative to bregma; simple regression,
ANOVA: R2=0.320; ANOVA: F(1,5)=2.4, p=0.19).
All together, these data reflect an impairment of vasoreactivity in frontal cortical regions
which are known to be primarily affected by vascular amyloid deposition. Furthermore,
the inverse correlation of initial CBV changes with cortical CAA load directly links CAA to
cerebral vessel dysfunction.
Discussion
Precise CAA distribution within old APPDutch brains was analysed in great detail for this
study [112]. It was shown that those brain regions heavily affected with CAA show deficits in
vascular reactivity. As no behavioural deficits in memory tasks were found in old APPDutch
animals [112], it can be assumed that physiological changes probably preceed behavioural
deficits. These results in combination with the fMRI results shown in arcAβ mice indicate,
that CBV fMRI in combination with the clinically approved substance acetazolamide testing
vascular responsiveness, could have potential as a diagnostic tool in AD diagnosis even in
humans. Revealing vascular deficits due to CAA in patients before onset of symptoms would
increase the lifespan and life-quality of affected individuals.
69

Chapter 2: Development of in-vivo imaging techniques
2.3 Semiquantitative assessment of amyloid plaque load in AD mouse
models using molecular imaging
Introduction
Near InfraRed Fluoresence Imaging (NIRF) in combination with the fluoresencent dye AOI987,
shown to bind specifically to amyloid depositions in APP23 mice is a suitable tool for semi-
quantitative amyloid plaque detection in-vivo in preclinical mouse models of AD [43]. As the
only reports so far have been in APP23 mice, we established a protocol in arcAβ mice and ap-
plied it subsequently to APP/PS1 mice in order to investigate binding of AOI987 to vascular
and parenchymal plaques respectively. An additional aim of these preparatory studies was
finding a suited timepoint for distinguishing clearance of AOI987 from the brain of transgenic
and wildtype animals. The incentive therefore was not only to establish a protocol for this
setup but also for a treatment study that is described in chapter 3.2, ’changes in β-amyloid
load upon anti-Aβ treatment’. AOI987 was provided by our collaborators from the group of
Prof. K.-H. Altmann (ETH Zurich).
Methods and Materials
Animals Animals were kept at standard housing conditions with a 12h dark/light cycle
and free access to food and water. All experiments were performed in strict adherence to
the Swiss Law for Animal Protection. arcAβ [59], APP/PS1 [42] and their respective control
littermates have been used for pilot studies. One day prior to NIRF experiments, mice were
shaved on their head and on the lower back using a commercially available hair shaver for
human use (Wella, Contura) under isofluorane anaesthesia. For NIRF experiments mice were
anesthetized with an initial dose of 3% isoflurane in an air/oxygen (2:1) mixture, placed
in prone position on the heated platform inside the eXplore Optix system (ART, Advanced
Research Technologies Inc. and General Electric, Montreal, Canada) preparation chamber
to keep core body temperature stable and the isoflurane level was reduced to 1.75 to 2 %
in air/oxygen. The head was situated between two black plastic cubes in order to prevent
it from moving during experiments. Ears, hind paws as well as the tail were slightly fixed
using transparent adhesive tape. For subsequent intravenous (i.v.) infusion, the tail vein was
cannulated with a 30G needle (0.3mm x 13mm, BD Microlance, Drogheda, Ireland). After
baseline measurements, AOI987 (0.1mg/kg, 0.01mg/ml) was administered intravenously as
a bolus within 20 seconds. A reference tube containing a 1x10⁻⁵mg/ml concentration of
AOI987 was placed next to the right hind limb of the animal.
70
2.3 Assessment of AD plaque load by NIRF imaging
ArcAβ animals (tg, n=4, age 17.05±0.3 months) and the respective control littermates (wt,
n=3, age 17.03±0.2 months) as well as APP/PS1 (tg (++), n=3, age 14.13±0.3months) and the
control animals (wt (-+), n=6, 15.23±0.7months) were included in the studies.
Fluorescent probe AOI987 has been shown to bind to Aβ deposits in the brain of APP23
mice [43]. This oxazine derivative has emission and excitation peaks at 650nm and 670nm
respectively and allows for non-invasive in-vivo optical imaging in the near infrared range of
the electromagnetic spectrum where absorption and scattering of living tissue are minimal.
AOI987 was synthesized by our collaborators (Laboratory of Prof. K.-H. Altmann, Institute
of Pharmaceutical Sciences, ETH Zurich, Switzerland) according to previously established
protocols [43]. A stock solution of 0.1mg/ml AOI987 in destilled water was kept in a cold
and dark place and portions of AOI987 were diluted in saline to receive 0.01mg/ml solutions.
Data acquistion NIRF experiments were performed on the fluorescence reflectance small
animal molecular imager eXplore Optix (ART Advanced Research Technologies Inc. and
General Electric, Montreal, Canada) in the time-domain imaging mode. This imaging de-
vice emits light at 666nm using a pulsed laser diode and detects the fluorescent signal after
filtering with a 700nm filter using a photomultiplier tube.
Three regions of interest (ROI) were defined: i) on the head of the animal covering the
brain ii) on the back of the animal lateral to the spinal cord, possibly sparing the kidney and
iii) on the reference tube. Once the ROIs were defined they could be imported into each an-
imal to control for ROI size and positioned accordingly. Scan parameters were: laser power:
130 µW, integration time: 2 seconds, scan step: 1mm, total scan duration: approximately 8
minutes.
Schematic drawing of the experimental setup in the NIRF device (a) as well as the theo-
retical excitation and detection of the signal in the mouse brain (b) are shown in figure 2.12.
Experimental timing After canulation and ROI definition, a baseline scan was performed
followed by AOI987 injection. After the 20 second bolus injection, the next scan was started
and for a total duration of 4 hours a scan, covering all three ROIs, was performed every 15
minutes (see figure 2.13).
Data analysis and processing NIRF data was acquired using the eXplore Optix scanner in
the time domain mode and evaluated using the analog eXplore Optix OptiView software,
version 1.00. Average photon count values were determined from each ROI and for each
scan and animal. ROIs were defined sparing spots of signal dropout due to dark hair on the
71

Chapter 2: Development of in-vivo imaging techniques
excitation pulse detected signal
b
Laser @ 666nm Photo Multiplier Tube (PMT)
fluorescenceemitter AOI987
anesthesia
AOI987
fluorescence emitter (AOI987)
anesthesia
a
Figure 2.12: Experimental setup of NIRF imaging device and schematic behaviour of
light in the NIRF spectrum in brain tissue.
arcA β
control
-15 30150 45 60 75 90 105 120 135 150 165 180 195 210time [min]
AOI987
Figure 2.13: Experimental setup of NIRF imaging. Positioning of the animal and lo-
calisation of the three regions of interest (ROI) brain, body and reference
tube, can be seen on the whole mouse whitelight image. Every 15 minutes
a scan was taken, the sequence for the brain ROI is displayed for one con-
trol mouse (wt, upper row) and one arcAβ mouse (tg, lower row). AOI987
was injected i.v. at timepoint t=0min. Clearance of AOI987 is faster from
the brain of the wt compared to tg mouse.
72

2.3 Assessment of AD plaque load by NIRF imaging
margins of the ROI when necessary and to have an area of interest for data calculation of
60mm2 for the brain, 80mm2 and 25mm2 for the reference tube ROI.
Two important parameters were calculated from the data: relative intensity (RI) and spe-
cific binding (SB). Relative intensity is a measure of the ratio of AOI987 present in the body
of each animal at different timepoints relative to peak values and can be calculated according
to formula 2.6:
RI = (S(t)− S(bg))/(S(t0)− S(bg)) (2.6)
Another important parameter, specific binding, can be derived from the data. Specific
binding (SB) shows how much signal comes from the brain of transgenic mice relative to
control animals and therefore how much AOI987 is bound specifically to amyloid plaques in
brains of arcAβ or APPPS1 mice, whereas binding in control animals is unspecific or at least
less pronounced due to the lower numbers of amyloid depositions.
SB = (S(tg)− S(wt))/(S(tg) (2.7)
Results in arcAβ mice
Data from the study with 17months old arcAβ and control animals are shown.
Raw data in figure 2.14 shows that autofluoresence in the NIRF range is higher in the
ROI covering the brain compared to the ROI covering the back torso, mainly muscle, of the
animals. Injection of AOI987 leads to an immediate increase of signal intensity in both ROIs
and groups. In both ROIs, values of wt and tg mice were comparable before injection of
the fluorescent dye (independent two sample t-test; average PhotonCount±sem: brain(wt)
= 940333±213838; brain(tg) = 819000±41848, p=0.54; body(wt) = 247333±36671; body(tg) =
242250±38276, p=0.93). Injection of AOI987 leads to an immmediate increase of signal in-
tensity in both ROIs and groups. 180 minutes after AOI987 injection, clearance of the dye
from the brain is more advanced in control compared to transgenic animals, even though
no significant difference was obtained when comparing absolute photon counts (indepen-
dent two sample t-test; average PhotonCount± sem: brain(wt) = 255000±18358; brain(tg) =
305750±30211, p=0.25; body(wt) = 109467±20566; body(tg) = 114500±14299, p=0.84). One
potential reason beeing the slightly higher initial photon counts in the brain ROI of controls.
Calculation of relative intensity as a measure of the ratio of AOI987 present in the body of
each animal at different timepoints relative to peak values according to formula 2.6 is shown
for the brain as well as for the control body ROI (see figure 2.15).
73

Chapter 2: Development of in-vivo imaging techniques
0 5 0 1 0 0 1 5 0 2 0 0 2 5 00 . 0
2 . 0 x 1 0 5
4 . 0 x 1 0 5
6 . 0 x 1 0 5
8 . 0 x 1 0 5
1 . 0 x 1 0 6
1 . 2 x 1 0 6
Photo
n Cou
nt [a.
u.]
t i m e [ m i n ]
B R A I N w t ( n = 3 ) B O D Y w t B R A I N t g ( n = 4 ) B O D Y t g
Figure 2.14: Raw data from the pilot study in arcAβ mice showing the kinetics of the
fluorescent signal upon AOI987 injection in NIRF imaging. Average pho-
ton count for the region of interest (ROI) brain and body in transgenic and
control animals are shown for background autofluoresence (t=-15min),
timepoint of AOI987 injection (t=0min) and subsequently for 240 minutes
after dye injection. Data are shown as average±sem.
0 50 100 150 200 2500.0
0.2
0.4
0.6
0.8
1.0
rela
tive
inte
nsity
(RI)
[a.u
.]
time [min]
Brain wt (n=3) Brain tg (n=4)
0 50 100 150 200 2500.0
0.2
0.4
0.6
0.8
1.0
rela
tive
inte
nsity
(RI)
[a.u
.]
time [min]
Body wt (n=3) Body tg (n=4)
Figure 2.15: Relative intensity (RI) of AOI987 signal in arcAβ (tg) and control wild-
type animals (wt) in brain and body ROI. Data are shown as average±sem.
74

2.3 Assessment of AD plaque load by NIRF imaging
Statistical analysis of the relative intensities (RI) for both groups 180min after AOI987
injection revealed an almost significant difference between controls and transgenics in the
brain, with values of arcAβ animals being higher compared to those of control (independent
two sample t-test; average relative intensity (RI)± sem: brain(wt)=0.12±0.02; brain(tg)=0.22±0.04,
p=0.067; body(wt)=0.36±0.05; body(tg)=0.37±0.02, p=0.84).
For specific binding (SB) of AOI987, data is shown comparing SB in the brain to SB in
the body of the two groups. According to formula 2.7, values for the brain ROI have been
calculated for all timepoints following AOI987 injection and results are shown in figure 2.16.
0 5 0 1 0 0 1 5 0 2 0 0 2 5 0- 0 . 2
0 . 0
0 . 2
0 . 4
0 . 6
spec
ific bi
nding
(SB)
[a.u.]
t i m e [ m i n ]
B r a i n B o d y
Figure 2.16: Specific binding (SB) of AOI987 in arcAβ relative to control wildtype ani-
mals (wt) in brain and body ROI. AOI987 binds specifically in the brain of
arcAβ animals as compared to the body. Data are shown as average±sem.
Data from the brain increase with increasing time whereas those of the body stay more or
less constant, indicating that specific binding occurs in the brain but not in the body of arcAβ
compared to control mice. 180 minutes after AOI987 injection, SB in the brain is significantly
higher in the brain as in the body (independent two sample t-test; average specific binding
(SB)± sem: brain=0.42±0.08; body=0.03± 0.04, p=0.016).
Results in APP/PS1 animals
Data from APP/PS1 mice were difficult to analyse and interpret. As these animals were bred
on different backgrounds of mouse lines, they differ in fur color. Black as well as white mice
can carry either no muation in genes encoding for APP or PS1 (-/-), carry a mutation in only
one of the genes (-/+ or +/-) or be double transgenic and carry mutations in both genes (+/+).
75

Chapter 2: Development of in-vivo imaging techniques
Only few animals were available and the difference in fur colour stated a serious problem:
eventhough mice were carefully shaved and no hair was left on the ROI, the colour of the
hair roots or the very short portion of hair inside the skin was different enough that the same
scan power could not be used for black and white mice. Signal oversaturation occured in
white mice when they were scanned with the same scan power as black ones. Data analysis
included a parameter that should account for the difference in scan power but despite this
effort, data remained very noisy. One missing datapoint in one animal led to a disturbance
of the data curves, specially in relative intensity (RI) and specific binding (SB) analysis seen
in figure 2.18 and figure 2.19. Another problem was the fact that the animals did not support
the stress of the experiment very well. Therefore we decided not to use this APP/PS1 double
transgenic animals for longitudinal studies. The principle of signal kinetics, slight difference
between ++ and -+ mice could be observed and is shown in figure 2.17.
0 5 0 1 0 0 1 5 0 2 0 0 2 5 00 . 0
2 . 0 x 1 0 5
4 . 0 x 1 0 5
6 . 0 x 1 0 5
8 . 0 x 1 0 5
1 . 0 x 1 0 6
1 . 2 x 1 0 6
Photo
n Cou
nt [a.
u.]
t i m e [ m i n ]
B R A I N - + ( n = 6 ) B O D Y - + B R A I N + + ( n = 3 ) B O D Y + +
Figure 2.17: Raw data from the pilot study in APP/PS1 mice showing the kinetics of
fluorescent signal upon AOI987 injection in NIRF imaging. Average pho-
ton count for the region of interest (ROI) brain and body in transgenic (++)
and control (-+) animals are shown.
76

2.3 Assessment of AD plaque load by NIRF imaging
0 50 100 150 200 2500.0
0.2
0.4
0.6
0.8
1.0re
lativ
e in
tens
ity (R
I) [a
.u.]
time [min]
Brain -+ (n=6) Brain ++ (n=3)
0 50 100 150 200 2500.0
0.2
0.4
0.6
0.8
1.0
rela
tive
inte
nsity
(RI)
[a.u
.]
time [min]
Body -+ (n=6) Body ++ (n=3)
Figure 2.18: Relative intensity (RI) of AOI987 signal in APP/PS1 (++) and control
wildtype animals (-+) in brain and body ROI. Lack of one datapoint leads
to a disturbance of profiles at t=135min. Data are shown as average±sem.
0 5 0 1 0 0 1 5 0 2 0 0 2 5 0
- 0 . 4
- 0 . 2
0 . 0
0 . 2
0 . 4
0 . 6
spec
ific bi
nding
(SB)
[a.u.]
t i m e [ m i n ]
B r a i n B o d y
Figure 2.19: Specific binding (SB) of AOI987 in APP/PS1 (++) relative to control wild-
type animals (-+) in brain and body ROI. AOI987 binds specifically in
the brain of arcAβ animals as compared to the body. Lack of one data-
point leads to a disturbance of profiles at t=135min. Data are shown as
average±sem.
77

Chapter 2: Development of in-vivo imaging techniques
Discussion
Combining near infrared fluoresence (NIRF) imaging with the fluorescent dye AOI987 bind-
ing specifically to Aβ was shown to be a suitable preclinical imaging tool for Alzheimer’s
Disease (AD) research [43].
Due to tissue absorption, the maximum achievable penetration depth of even NIR light
is estimated to be in the order of 5-10cm [113]. However, strong tissue scattering degrades
the achievable spatial resolution such that, when localization of a fluorescent structure is the
goal, applications are limited to samples with much smaller thickness, most typically mice.
In contrast to X-rays, light in tissue is does not follow a direct path due to scattering.
The longer the path light has to travel, the more scattering events it faces. Therefore, the
fluorescent signal on each point of the sample surface can have its source on points within
the animal not directly underlying this point. This in turn means that on planar NIRF imag-
ing systems, it is not possible to distinguish between a strong source lying deep in tissue
and a weak one close to its surface. In other words, the real depth of a fluorescent source
is not known. A method called Fluorescence Molecular Tomography (FMT) addresses this
problem using multiple laser measurements on a grid and modified computed tomography
algorithms special for scattering tissue. As a result, a 3D fluorescent distribution can be com-
puted with accuracy of 1-2mm (see figure 1.11).
NIRF imaging can also applied in clinical research under special conditions - some re-
searchers use the technique to assess blood flow in the brains of neonates or for detecting
breast tumors or examples. Both applications take advantange of the fact that the light does
not have to travel through too much tissue - the skull of neonates is much thinner that the
skull of adults and breast can be positioned to minimise the distance between source and
detector. A review by Wolf and colleagues summarizes the current state of NIR techniques
in clinical applications [121].
Spatial resolution of NIRF imaging is quite poor but as we are aiming at assessing semi-
quantitative amyloid plaque load of the total murine brain in order to compare different
groups of animals, the user and animal friendly device is convenient.
As reported in the original publication [43], clearance of AOI987 is faster from the brain of
control animals compared to the brain of transgenic APP23 mice modeling AD, where the dye
is bound to amyloid plaques. Similar results were obtained in arcAβ and APP/PS1 mice to a
certain extent. Important to mention here is that AOI987 seems to bind to vascular amyloid
depositis as well as to parenchymal amyloid deposits as the two mouse models arcAβ and
APP/PS1 display mainly vascular or parenchymal amyloid pathology respectively, whereas
78

2.3 Assessment of AD plaque load by NIRF imaging
APP23 mice display both. Several advantages of arcAβ over APP/PS1 mice made this mouse
model the choice for the longitudinal treatment study presented in chapter 3.2.
79

Chapter 2: Development of in-vivo imaging techniques
80

Chapter 3
Application of imaging to assess
effects of immunotherapy in murine
models of AD
The concept of immunization has been well known for centuries for prevention of different
types of disease such as pox, measles or tetanus. With regard to AD, active as well as pas-
sive immunization have been tested in various mouse models and even human patients. In
1999, the concept of Aβ immunotherapy was introduced [95] and demonstrated: injection of
synthetic Aβ into young transgenic APP mice. Immunotherapy showed to prevent amyloid
plaque formation and removed Aβ from the brains of older transgenic mice. Many additional
active immunization studies in different species have followed since then. Passive immu-
nization, namely injection of antibodies against β-amyloid into AD mouse models showed to
reduce β-amyloid pathology. Different results have been obtained from passive immuniza-
tion trials depending on the struture of the antibody, the mechanism of action and other fac-
tors. Currently different mechanisms of action for immunotherapy in the amyloid pathology
field of AD have been proposed, ranging from clearance of β-amyloid by phagocytosis, neu-
tralization of toxic Aβ-oligomers in favour of Aβ-momomers, facilitating Aβ clearance and
others [16] [76] [10]. Of course there is strong need for improvement of Aβ-immunotherapy
in various aspects such as tolerability and toxicity as well as pharmacokinetics and effective
application routes.
Short introduction to Immunoglobulins [35]
Antibodies are also called immunoglobulins (Ig) and are proteins which are part of the adap-
tive immune system that constitutes the specific component of immunity. Together with the
81

Chapter 3: Application of imaging in immunotherapy studies
nonspecific component of the immune system, the innate immunity, the adaptive immune
system protects the body against invading pathogens. The general structure of Ig can be seen
in figure 3.1.
S S
S S
SSS
S
heavy chain(µ, γ, α, δ or ε)
light chain(κ or λ)
cons
tant
regi
on
(bio
logi
cal a
ctiv
ity)
varia
ble re
gion
(ant
igen
bindin
g)
Fc- f
ragm
ent
Fab
- fra
gmen
t
N
C C
N
C
Figure 3.1: Schematic diagram of the structure of a immunoglobulin (Ig). Adapted
from [35].
Igs consist of two identical heavy (h) and two identical light (l) chains. Heavy and light
chains as well as the two dimers are connected by disulfid bonds. About 100 aminoacids at
the N-terminus of the Ig represent the variable region (Vh and Vl) which is responsible for
antigen binding. The rest of the Ig is the constant (Ch or Cl) region that executes the biological
activity of the Ig and is therefore the effector region of the Ig. Another way to describe the
Ig structure is by dividing the Fab (“fragments, antigen binding”) part, which consists of one
light chain and part of the connected heavy chain and the Fc-part (“fragment crystallizable”)
which consists of the C-terminal part of the two heavy chains and is responsible for execution
the biological action of the Ig.
Five different types of Ig exist, named after their heavy chains which distinguish them:
IgA, IgD, IgE, IgG and IgM. All of them may display one type of light chain, κ or λ. All of
them have in common: i) a variable region which is responsible for binding of the antigen
that they are specialized for and ii) a constant region that has effector functions.
82

Ig-mediated effector functions The different Ig classes or isotypes have different Ig-mediated
effector functions including opsonization, activation of complement, antibody-dependent
cell-mediated cytotoxicity (ADCC) and transcytosis.
Opsonization is the promotion of phagocytosis of an antigen by macrophages and neu-
trophils. When an antigen is bound by its specific IgG, the Fc-region of the IgG can bind to
the Fc-receptor on the surface of macorphages and neutrophils which results in phagocytosis
of the antigen-antibody-complex.
Activation of complement is the ability of certain IgM and IgGs to activate serum glyco-
proteins which promote the transport of antigens to the liver or spleen where they can be
eliminated by resident macrophages.
Antibody-dependent cell-mediated cytotoxicity (ADCC) is important in the destruction
of virus infected cells by natural killer (NK) cells.
Transcytosis is the movement of IgMs and IgAs through epithelial layers for example
through mucosal surfaces or into breast milk.
Normally a combination of immunoglobulins reacts to the presence of a pathogen, as
those generally consists of various antigens. The most abundant type of Ig in blood serum is
IgG, which normally also consitutes the main portion in passive immunization samples.
Passive immunization The first milestone for the nowadays commonly applied passive
immunization strategy was layed in 1890 when Behring and Kitasato first discovered passive
immunization of mice with tetanus-infected rabbit serum. Today many pathogens, such as
hepatitis, measles, pox etc are affronted with passive imumnization. Passively administered
antibodies exert their protective action in different ways - recruitment of the complementary
pathway, opsonization of bacterial and viral pathogens and initiation of the ADCC, all mainly
mediated through a high fraction of immunoglobulinG in the vaccine.
Passive immunization normally does not exert its protective effect in a lifelong manner.
Repetition of passive immunization is normally necessary in regular time intervals.
83

Chapter 3: Application of imaging in immunotherapy studies
3.1 No effect of anti-amyloid-antibody treatment on cerebrovascu-
lar responsiveness
Introduction
Various studies have addressed the impact of passive immunization in AD mouse models.
Depending on the mouse model, the type of antibody used, the treatment scheme and many
other factors, results can vary greatly.
Here we wanted to investigate the effect of passive immunization on cerebrovascular
responsiveness in arcAβ mice with an antibody (Ax) against Aβ that was cloned from pools
of B-cells, obtained from cognitively stable human donour populations.
Different aspects of vasodilation upon acetazolamide injection were investigated using
functional Magnetic Resonance Imgaging (fMRI). The fMRI experiments presented here were
part of a larger study in collaboration with Dr. Marlen Knobloch from the laboratory of Prof.
R. Nitsch (University of Zurich) and included histological and behavioural consequences of
passive immunization in arcAβ mice. 2 months of Ax treatment reduced β-amyloid load
and improved cognitive deficits in arcAβ mice but did not lead to an increased number of
microhemorrhages in transgenic animals. Results of these aspects are published in the PhD
thesis of Dr. Marlen Knobloch [58].
Changes in cerebral blood volume (CBV) were assessed using fMRI in four different
groups of mice that received either anti-amyloid antibody or control antibody over a 2months
time period. Weekly i.p. injection were shown not to alter vascular responsiveness in these
animals. A previously observed impairment of vasodilation in highly CAA affected brain
regions in arcAβ mice compared to control littermates was present (see chapter 2.2).
Methods and Materials
Animals arcAβ mice expressing human APP containing both the Swedish (K670N + M671L)
and the Arctic mutation (E693G) under the control of the prion protein promoter (PrP) were
generated as described previously [59]. Animals were kept at standard housing conditions
with a 12h dark/light cycle and free access to food and water. The fMRI experiments were
performed in approximatley 2 years old arcAβ (tg) and wildtype control littermate (wt) an-
imals (wt-ctrl: 25.9±0.1months; wt-Ax: 25.8±0.1months; tg-ctrl: 25.6±0.1months; tg-Ax:
26.1±0.8months). All experiments were performed in strict adherence to the Swiss Law for
Animal Protection.
84

3.1 No changes of fMRI response in arcAβ mice upon passive immunization
Antibody (Ax) treatment The amyloid plaque specific antibody was developed by our col-
laborators (Laboratory of Prof. R Nitsch, Division of Psychiatry Research, UZH and Neurim-
mune, Zurich, Switzerland). The antibody (Ax) against Aβ was cloned from pools of B-cells,
obtained from cognitively stable human donour populations. A control condition was set by
injecting arcAβ and wildtype mice with a commercially available human antibody against
human TNFα (ctrl) in order to control for general immune response effects. Purified Ax or
ctrl was injected weekly into old arcAβ mice and control littermates at a concentration of 3µg
antibody/g body weight by our collaborators. Mice were transfered to the imaging center
for fMRI experiments after immunization was completed.
fMRI experiments Animal preparation: Mice were anesthetized with an initial dose of 3%
isoflurane in an air/oxygen (2:1) mixture, endo-tracheally intubated with a tube made from
polyethylene (PE) (inner/outer diameter: 0.58/0.96 mm, Portex, Smith Medical International
Ltd. Kent UK), and actively ventilated at a rate of 90 breaths per minute (bpm) and a tidal
volume of approximately 0.3ml/breath using a small animal ventilator (Alfos Electronic,
Biel-Benken, Switzerland) under operator supervision. For fMRI measurements, the animals
were placed in prone position on a water heated cradle made from Plexiglas to keep core
body temperature at 37± 0.5 ◦C and the isoflurane level was reduced to 1.75% in air/oxygen
(3:1). The head was fixed in a stereotaxic fixation. For subsequent intravenous (i.v.) infusions,
the tail vein was cannulated with a 30G needle (0.3mm x 13mm, BD Microlance, Drogheda,
Ireland). A single dose of 15mg/kg of the non-depolarizing neuromuscular blocking agent
gallamine (gallamine triethiode, Sigma-Aldrich Chemie GmbH, Steinheim, Germany) was
administered intravenously.
MRI anatomical reference scans: Experiments were performed using a Pharmascan MR
system 47/16 (Bruker BioSpin GmbH, Karlsruhe, Germany) operating at a magnetic field
strength 4.7T (corresponding to 200MHz proton frequency). A cryogenic transmit-receive
RF-coil [89] has been used. Anatomical images were acquired using a multi-slice RARE
(rapid acquisition with relaxation enhancement) spin echo sequence (Hennig et al., 1986)
with an effective echo time (TEeff): 10.41ms, repetition time (TR): 900ms and RARE-factor:
5. Further parameters were field-of-view (FOV): 20 x 13mm2, matrix dimensions (MD):
200 x 130, slice thickness (SLTH): 0.7mm, interslice distance (ISD): 1.2mm, number of slices
(Nslices): 5 and number of averages (NA): 1. This translates into voxel dimensions of 100 x
100 x 700µm3. Positioning of the coronal imaging slices was carried out operator-interactively
using a mid-sagittal slice as a reference: the midline of the most posterior coronal slice was
placed centered into the central fissure between cortex and cerebellum. In atlas coordinates
85

Chapter 3: Application of imaging in immunotherapy studies
[80] the 5 slices corresponded approximately 0.62, -0.58, -1.82, -3.08, -4.24mm relative to
bregma. Those sections in the mouse brain atlas [80] were selected that corresponded closest
to the normalized value of the fMRI experiment, baring in mind that the fMRI slice thickness
is 0.7mm.
fMRI protocol and stimulation paradigm: to ensure reproducible conditions, fMRI exper-
iments were started approximately 30min after switching to reduced isoflurane levels. The
functional imaging protocol consisted of a RARE sequence with the following parameters:
temporal resolution: 40s, TR: 2500ms, TEeff: 80.2ms, RARE-factor: 32, FOV: 20 x 13mm2,
MD: 128 x 128, SLTH: 0.7mm, ISD: 1.2mm, Nslices: 5 and NA: 4. The corresponding voxel di-
mensions were 156 x 102 x 700µm3. The experiment for the assessment of the relative changes
in cerebral blood volume (CBV) consisted of three parts. First, eight sequential images have
been recorded yielding the baseline signal intensity Spre followed by the injection of a bolus
of Endorem R© (Guerbet SA, Roissy, France) at a dose of 60mg Fe/kg. After a waiting pe-
riod of 15min allowing the contrast agent concentration to reach a steady-state, 35 sequential
baseline images were acquired yielding the signal intensity S0. At image 35 acetazolamide
(30mg/kg, Diamox parenteral, Goldshield Pharmaceuticals Ltd, Croydon, UK) was adminis-
tered i.v. as a bolus using a spectrometer-controlled infusion pump and additional 51 images
were collected yielding the image series S(t).
Image analysis and data processing: Relative changes of CBV in percent of pre-stimulation
CBV values were computed on a pixel-by-pixel basis according to formula 2.2 [65]. Image
analysis was carried out using Biomap (Novartis Institute for Biomedical Research, Basel,
Switzerland). Regions of interest (ROIs) were defined on the appropriate image slices. Anatom-
ical reference images for each age group were coregistered in an operator-interactive manner
based on visually defined landmarks using affine transformations. CBV%(t) values were cal-
culated for all ROIs for each animal. Values for left and right side of the brain were found to
be identical within error limits and therefore averaged for further analysis. Statistical analy-
sis was performed on CBV%(t) profiles versus time using repetitive measurement ANOVA.
Comparisons between groups have been performed assessing the CBV change over 35 min-
utes by integrating CBV profiles from timepoint of injection on (see figure 3.2). For two
ROIs, more detailed analysis have been performed (see figures (3.3 and 3.4 a, b and d), i)
parietal cortex showing high amyloid deposition in aged arcAβ mice and differences in CBV
response between transgenic and control animals and ii) amygdala showing no difference in
amyloid plaque deposition between arcAβ and control littermate wildtypes and compara-
ble CBV profiles for all animal groups. Those two ROIs were analysed in order to assess a)
immediate vascular response integrating CBV profiles over approximately 1 minute, b) early
86
3.1 No changes of fMRI response in arcAβ mice upon passive immunization
vascular response integrating CBV profiles for 4 minutes from acetazolamide injection on and
d) maximal vasodilation by integrating over a 10 minutes time window during the CBV pro-
file plateau phase from 23 minutes after acetazolamide injection on. Two-group comparisons
were analysed using the independent two sample t-test, group comparisons using one-way
ANOVA. All data are given as average±standard error of mean (sem), p-values ≤0.05 are
considered statistically significant.
Results
4 groups of approximately 2 year old mice were used for assessing changes in cerebral blood
volumen (CBV) upon vasodilatory stimulation with acetazolamide using CBV fMRI. arcAβ
(tg) and control wildtype littermates (wt) were subdivided into two groups according to
treatment they had received previously: 8 weeks of weekly i.p. injection with either anti-
amyloid antibody (Ax) (wt-Ax, tg-Ax) or with a control antibody (ctrl)(wt-ctrl, tg-ctrl).
Acetazolamide injection leads to a global increase of cerebral blood volumes (CBV) in the
brain of transgenic and control wildtype mice. CBV profiles in 7 regions of interest (ROI)
showed a rapid increase of CBV upon acetazolamide injection followed by a slowly increase
CBV change.
Apparently CBV increases were more pronounced in dorsal cortical regions compared to
the rest of the brain. Some ROIs depict the previously found impairment in CBV increase
of arcAβ mice in brain regions displaying high vascular amyloid pathology (sensory cortex,
parietal cortex). No differences between the same genotype receiving Ax or ctrl treatment
were observed in any ROI. In order to quantify changes in cerebral blood volumne, CBV
profiles of each animal were integrated from timepoint of acetazolamide injection for ap-
proximately 35 minutes. Average values for each group are shown in figure 3.2 right column.
Two ROIs were analysed in more detail - one region of the arcAβ brain showing high vas-
cular amyloid deposition in the rostral parietal cortex and one brain region where vascular
amyloid deposition is neglegible, the amygdala. In the ROI parietal cortex, CBV increase is
impaired in arcAβ mice compared to control wildtype littermates. No such genotype differ-
ence exists in the amygdala ROI. In total, three additional CBV change quantifications have
been assessed i) immediate response to acetazolamide estimating vascular reactivity of cere-
bral blood vessels by integrating CBV profiles from injection over 2 minutes time period.
ii) the second quantification reveals early CBV changes of cerebral vasculature over a time
period of approximately 4 minutes. iii) In order to assess maximal vasodilation that can be
achieved with the acetazolamide concentration, applied CBV were integrated over a time
span of 10 minutes approxiamtely 23 minutes after injection. These three quantifications
87

Chapter 3: Application of imaging in immunotherapy studies
-20 -10 0 10 20 30
0
10
20
30
40
rela
tive
chan
ge in
CB
V [%
]
time [min]
wt ctrl (n=6) wt Ax (n=6) tg ctrl (n=4) tg Ax (n=5)
-20 -10 0 10 20 30
0
10
20
30
40
rela
tive
chan
ge in
CB
V [%
]
time [min]
wt ctrl (n=6) wt Ax (n=6) tg ctrl (n=4) tg Ax (n=5)
-20 -10 0 10 20 30
0
10
20
30
40
rela
tive
chan
ge in
CB
V [%
]
time [min]
wt ctrl (n=6) wt Ax (n=6) tg ctrl (n=4) tg Ax (n=5)
-20 -10 0 10 20 30
0
10
20
30
40
rela
tive
chan
ge in
CB
V [%
]
time [min]
wt ctrl (n=6) wt Ax (n=6) tg ctrl (n=4) tg Ax (n=5)
-20 -10 0 10 20 30
0
10
20
30
40
rela
tive
chan
ge in
CB
V [%
]
time [min]
wt ctrl (n=6) wt Ax (n=6) tg ctrl (n=4) tg Ax (n=5)
-20 -10 0 10 20 30
0
10
20
30
40
rela
tive
chan
ge in
CB
V [%
]
time [min]
wt ctrl (n=6) wt Ax (n=6) tg ctrl (n=4) tg Ax (n=5)
-20 -10 0 10 20 30
0
10
20
30
40
rela
tive
chan
ge in
CB
V [%
]
time [min]
wt ctrl (n=6) wt Ax (n=6) tg ctrl (n=4) tg Ax (n=5)
rostral Parietal Cortex
caudal Parietal Cortex
Motor Cortex
Sensory Cortex
Piriform Cortex
Hippocampus
Amygdala
0
100
200
300
400
500
600
700
800
900
1000
Motor Cortex
inte
grat
ed C
BV
cha
nge
[%]
wt ctrl (n=6) wt Ax (n=6) tg ctrl (n=4) tg Ax (n=5)
0
100
200
300
400
500
600
700
800
900
1000
Sensory Cortex
inte
grat
ed C
BV
cha
nge
[%]
wt ctrl (n=6) wt Ax (n=6) tg ctrl (n=4) tg Ax (n=5)
0
100
200
300
400
500
600
700
800
900
1000
Piriform Cortex
inte
grat
ed C
BV
cha
nge
[%]
wt ctrl (n=6) wt Ax (n=6) tg ctrl (n=4) tg Ax (n=5)
0
100
200
300
400
500
600
700
800
900
1000
Hippocampus
inte
grat
ed C
BV
cha
nge
[%]
wt ctrl (n=6) wt Ax (n=6) tg ctrl (n=4) tg Ax (n=5)
0
100
200
300
400
500
600
700
800
900
1000
Amygdala
inte
grat
ed C
BV
cha
nge
[%]
wt ctrl (n=6) wt Ax (n=6) tg ctrl (n=4) tg Ax (n=5)
0
100
200
300
400
500
600
700
800
900
1000
cd. Parietal Cortex
inte
grat
ed C
BV
cha
nge
[%]
wt ctrl (n=6) wt Ax (n=6) tg ctrl (n=4) tg Ax (n=5)
0
100
200
300
400
500
600
700
800
900
1000
rs. Parietal Cortex
inte
grat
ed C
BV
cha
nge
[%]
wt ctrl (n=6) wt Ax (n=6) tg ctrl (n=4) tg Ax (n=5)
0.62mm rel to Bregma
0.62mm rel to Bregma
-0.58mm rel to Bregma
-0.58mm rel to Bregma
-0.58mm rel to Bregma
-1.82mm rel to Bregma
-1.82mm rel to Bregma
p=0.03
p=0.01
p=0.13
p=0.33
p=0.52
p=0.41
p=0.74
*
*
Figure 3.2: Results the anti-amyloid antibody treatment study using fMRI: ROI loca-
tions, CBV profiles and integration over 34min after acetazolamide injec-
tion.
88

3.1 No changes of fMRI response in arcAβ mice upon passive immunization
give an estimate of how fast cerebral blood vessels react to vasodilatory stimulation within
i) a very short and ii) a more prolonged time span as well as to what extent blood vessels
can open maximally. These three measures in addition to the general quantification of CBV
changes over nearly 35 minutes are shown in figure 3.3 for the non-CAA affected ROI in
amygdala and in figure 3.4 for the highly CAA-affected ROI in parietal cortex.
In the ROI “amygdala” no significant differences in immediate (a) or early (b) vascular
reactivity, in general CBV response (c) or in maximal vasodilation (d) was found. As already
visible in the CBV profiles of this ROI, none of the above mentioned readouts reveals differ-
ences between the two genotypes or between treatment groups (see table 3.1).
In the ROI “parietal cortex” arcAβ (tg-ctrl) mice show impaired vascular response to ac-
etazolamide compared to control littermates (wt-ctrl). Quantification of the profiles for all 4
parameters show reduced values for wt-ctrl compared to tg-ctrl in all parameters except the
late max. vasodilation in parietal cortex (wt-ctrl vs tg-ctrl; independent two sample t-tests:
(a)p=0.01; (b) p=0.003; (c) p=0.03; (d) p=0.16). Both genotypes that received anti-amyloid
antibody (Ax) did not differ significantly (wt-Ax vs tg-Ax).
Comparison of treatment subgroups within each genotype seperately revealed no signif-
icant differences at any integration period in the parietal cortex ROI (wt-ctrl vs wt-Ax, or
tg-ctrl vs tg-Ax respectively).
Control littermates in the control groups (wt-ctrl) showed higher values in both the fast
responses (a and b) when compared to Ax treated transgenic animals (tg-Ax), but not in the
late or general CBV response, whereas comparison of the vice-versa situation (wt-Ax vs tg-
ctrl) revealed no significant differences in any quantitative readout. All statistical results are
summarized in table 3.1.
In summary: In brain regions displaying high CAA, vascular response to acetazolamide
is reduced in aged arcAβ mice compared to control wildtype littermates, in line with our
previous findings (2.2). Immediate, early, general and late CBV response to acetazolamide
injection is not influenced by anti-amyloid antibody treatment neither in highly affected CAA
brain regions nor in brain regions displaying low CAA load.
89

Chapter 3: Application of imaging in immunotherapy studies
Amygdala
a
b
cd
b
d
a
c
-20 -10 0 10 20 30
0
10
20
30
40
rela
tive
chan
ge in
CB
V [%
]
time [min]
wt ctrl (n=6) wt Ax (n=6) tg ctrl (n=4) tg Ax (n=5)
0
100
200
300
400
500
600
700
800
900
1000
Amygdala
inte
grat
ed C
BV
cha
nge
[%]
wt ctrl (n=6) wt Ax (n=6) tg ctrl (n=4) tg Ax (n=5)
0
5
10
15
Amygdala
inte
g. C
BV
cha
nge
0 to
2m
in [%
]
wt ctrl (n=6) wt Ax (n=6) tg ctrl (n=4) tg Ax (n=5)
0
5
10
15
20
25
30
35
Amygdala
inte
g. C
BV
cha
nge
0 to
4m
in [%
]
wt ctrl (n=6) wt Ax (n=6) tg ctrl (n=4) tg Ax (n=5)
0
100
200
300
Amygdala
inte
g. C
BV
cha
nge
23 to
33m
in[%
]
wt ctrl (n=6) wt Ax (n=6) tg ctrl (n=4) tg Ax (n=5)
Figure 3.3: Vascular response to acetazolamide in the amygdala. Different integration
periods of the CBV profiles of arcAβ (tg) and wildtype (w) animals after
anti-amyloid antibody (Ax) and control treatment (ctrl). Early vascular re-
sponse to acetazolamide in a (2min) and b (4min). Integration of the whole
timeperiod after acetazolamide injection in c. Maximal vasodilation 25 min-
utes after acetazolamide injection in d. No significant differences. Graphs
respresent average±sem.
90

3.1 No changes of fMRI response in arcAβ mice upon passive immunization
rostral Parietal Cortex
0
100
200
300
400
500
600
700
800
900
1000
rs. Parietal Cortex
inte
grat
ed C
BV
cha
nge
[%]
wt ctrl (n=6) wt Ax (n=6) tg ctrl (n=4) tg Ax (n=5)
0
5
10
15
rs. Parietal Cortex
inte
g. C
BV
cha
nge
0 to
2m
in [%
]
wt ctrl (n=6) wt Ax (n=6) tg ctrl (n=4) tg Ax (n=5)
0
5
10
15
20
25
30
35
rs. Parietal Cortex
inte
g. C
BV
cha
nge
0 to
4m
in [%
]
wt ctrl (n=6) wt Ax (n=6) tg ctrl (n=4) tg Ax (n=5)
0
100
200
300
rs. Parietal Cortex
inte
g. C
BV
cha
nge
23 to
33m
in[%
]
wt ctrl (n=6) wt Ax (n=6) tg ctrl (n=4) tg Ax (n=5)
-20 -10 0 10 20 30
0
10
20
30
40
rela
tive
chan
ge in
CB
V [%
]
time [min]
wt ctrl (n=6) wt Ax (n=6) tg ctrl (n=4) tg Ax (n=5)
a
b
cd
b
d
a
c
**
**
*
Figure 3.4: Vascular response to acetazolamide in the parietal cortex. Different inte-
gration periods of the CBV profiles of arcAβ (tg) and wildtype (w) animals
after anti-amyloid antibody (Ax) and control treatment (ctrl). Early vascu-
lar response to acetazolamide in a (2min) and b (4min). Integration of the
whole timeperiod after acetazolamide injection in c. Maximal vasodilation
25 minutes after acetazolamide injection in d. Significant differences are
indicated by asterix. Graphs respresent average±sem.
91

Chapter 3: Application of imaging in immunotherapy studies
Discussion
The present study assessed the effect of passive immunization on vascular properties in
arcAβ mice modeling AD. These mice develop a pronounced vascular amyloid deposition
that was shown to lead to reduced vascular reactivity and maximal vasodilation in highly
CAA affected brain regions of aged transgenic animals (see chapter 2.2.1). 2months of treat-
ment with anti-amyloid antibody did not lead to changes in the various aspects of vasodila-
tion upon acetazolamide injection in arcAβ or control wildtype littermates.
Various passive immunization trials have been performed in different AD mouse models
previously. It has been reported that antibody treatment may lead to melioration of cognitive
deficits, decrease of parenchymal amyloid plaque load and increase of CAA accompanied
by microhemorrhages [119]. Different studies in AD mouse models as well as in human
AD patients investigated the aspect of microhemorrhage increase - some report increased
occurence of microhemorrhage and CAA whereas others do not.
Keeping in mind the already strong CAA load in the arcAβ mouse model, both changes
of vasodilatory response might have been imaginable: convergence of Ax treated arcAβ to-
wards wildtype performance or even further impairment of vascular properties. The fact
that none of the observed changes reached a significant level may have different reasons.
Quantitative histological analysis revealed a reduction of β-amyloid plaque load in cortex
and hippocampus of approximatively 50% in Ax compared to ctrl treated arcAβ mice [58].
This indicates that Ax treatment does have an effect on amyloid plaque load. Possibly the
distinction of parenchymal versus vascular amyloid deposition may have further elucidated
the reasons why CBV fMRI did not show differences in vascular responsiveness between the
two groups. If the reduction of amyloid plaque load observed by histological analysis was
purely due to reduction of parenchymal amyloid deposition, vascular responsiveness could
not have changed between Ax and ctrl treated arcAβ mice.
Another possible explanation for the results may lay in the applied method to assess dif-
ferences in vascular responsiveness - possibly the CBV fMRI method is not sensitive enough
to assess the minor changes that are caused by anti-amlyoid antibody treatment.
Out of the data presented here, no conclusion can be drawn whatsoever especially in
view of the large variation within individual groups. Probably special focus has to be set on
cerebrovascular integrity during treatment of AD with active or passive immunization as it
has been shown by more significant studies in both AD models and humans [16] [76].
92

3.1N
ochanges
offMR
Iresponsein
arcAβ
mice
uponpassive
imm
unization
Statistical table
immediate vasc. reac. (a) early vasc. response (b) general vasc. response (c) max. vasodilation (d)
AMYGDALA
wt: ctrl vs Ax p=0.49 p=0.37 p=0.57 p=0.89
tg: ctrl vs Ax p=0.88 p=0.67 p=0.83 p=0.88
ctrl: wt vs tg p=0.52 p=0.69 p=0.85 p=0.58
Ax: wt vs tg p=0.78 p=0.79 p=0.70 p=0.79
wt-ctrl vs tg-Ax p=0.43 p=0.33 p=0.94 p=0.74
wt-Ax vs tg-ctrl p=0.89 p=0.63 p=0.41 p=0.53
PARIETAL CORTEX
wt: ctrl vs Ax p=0.43 p=0.58 p=0.78 p=0.62
tg: ctrl vs Ax p=0.58 p=0.99 p=0.49 p=0.55
ctrl: wt vs tg p=0.01 p=0.003 p=0.03 p=0.16
Ax: wt vs tg p=0.21 p=0.14 p=0.30 p=0.74
wt-ctrl vs tg-Ax p=0.004 p=0.002 p=0.11 p=0.47
wt-Ax vs tg-ctrl p=0.39 p=0.18 p=0.15 p=0.27
Table 3.1: Statistical table summarizing results of NIRF anti-amyloid-treatment study. Data from 4 groups in the brain regions of interest
(ROIs) amgydala and parietal cortex. p-values ≤0.05 are considered as statistically significant.
93

Chapter 3: Application of imaging in immunotherapy studies
3.2 Changes of amyloid deposition by passive immunization in arcAβ
mice revealed by NIRF imaging
Introduction
Near Infra Red Fluoresence (NIRF) imaging is a suitable tool for preclinical in-vivo imag-
ing. Pilot studies in different transgenic mouse models of Alzheimer’s Disease (AD) have
revealed a faster clearance of the amyloid binding fluorescent dye AOI987 from the brain
of wildtype compared to transgenic animals [43] (see chapter 2.3, Assesment of AD plaque
load by NIRF imaging). As one of the most promising treatment approaches for AD amyloid
plaque modulating immunization, active as well as passive is discussed.
Here, the effect of passive immunization of arcAβ mice on the amyloid plaque load has
been assessed using AOI987-NIRF imaging. The passive immunization study reported, com-
prised weekly i.p. injection of a chimeric monoclonal antibody against Aβ comprising human
variable and murine constant regions. This antibody binds with high affinity to fibrillar forms
of Aβ. Histological analysis are performed by our collaborator Lisa Strobel in the laboratory
of Prof. R. Nitsch.
The semiquantitative NIRF readout allows to monitor changes in amyloid plaque load in
the brain of mice in a longitudinal manner.
Methods and Materials
Animals Animals were kept at standard housing conditions with a 12h dark/light cycle
and free access to food and water. All experiments were performed in strict adherence to
the Swiss Law for Animal Protection. After checking the suitability of arcAβ mice and their
control wildtype littermates in pilot studies, a total of 28 arcAβ (tg, 16.3±0.3 months) and 14
wildtypes (wt, 16.5±0.7 months) were used for this treatment study. As illustrated in figure
3.5, transgenic animals were subdivided into 3 groups. Animals received weekly i.p. injec-
tions of either amyloid plaque modulating antibody (Ab) or phosphate buffered saline (PBS)
and were imaged three times in the NIRF system: before the first, one day after the fourth
and one day after the eight i.p. injection. One day prior to NIRF experiments, mice were
shaved on their head and on the lower back using a commercially available hair shaver for
human use (Wella, Contura) under isofluorane anaesthesia. For NIRF experiments mice were
anesthetized with an initial dose of 3% isoflurane in an air/oxygen (7:3) mixture, placed in
prone position on the heated platform inside the eXplore Optix ((ART, Advanced Research
Technologies Inc. and General Electric, Montreal, Canada) preparation chamber to keep core
94

3.2 Changes in β-amyloid load upon passive immunization revealed by NIRF
body temperature stable and the isoflurane level was reduced to 1.75 to 2% in air/oxygen.
The head was situated between two black plastic cubes in order to prevent it from moving
during experiments. Ears, hind paws as well as the tail have been slightly fixed using trans-
parent adhesive tape. For subsequent intravenous (i.v.) infusion, the tail vein was cannu-
lated with a 30G needle (0.3mm x 13mm, BD Microlance, Drogheda, Ireland). After baseline
measurements AOI987 (0.1mg/kg, 0.01 mg/ml) was administered intravenously as a bolus
within 20 seconds. A reference tube containing a 1x10⁻⁵mg/ml concentration of AOI987
was placed next to the right hind limb of the animal. After the last scan of the 8 week longi-
tudinal study each animal was euthanized using Ketamin/Xylaxin, perfused with PBS and
brains were prepared, processed and transported to the lab of our collaborators for histolog-
ical analysis (Laboratory of Prof. R. Nitsch, Division of Psychiatry Research, University of
Zurich, Zurich, Switzerland).
Fluorescent probe AOI987 has been shown to bind to Aβ deposits in the brain of APP23
mice [43]. This oxazine derivative has emission and excitation peaks at 650nm and 670nm
respectively and allows for non-invasive in-vivo optical imaging in the near-infrared range of
the electromagnetic spectrum where absorption and scattering in living tissue are minimal.
AOI987 was synthesized by our collaborators (Laboratory of Prof. K.-H. Altmann, Institute
of Pharmaceutical Sciences, ETH Zurich, Switzerland) according to previously established
protocols [43]. A stock solution of 0.1mg/ml AOI987 in destilled water was kept in a cold
and dark place and portions of AOI987 were diluted in saline to receive 0.01mg/ml solutions
for i.v. injection.
Antibody (Ab) The amyloid plaque specific antibody was developed by our collaborators
(Laboratory of Prof. R Nitsch, Division of Psychiatry Research, UZH and Neurimmune,
Zurich, Switzerland). The antibody solution was diluted in sterile PBS (pH 7.4, 1M, Invitro-
gen) and injected at a concentration of 3µg antibody/g body weight (0.9µg antibody per µl
solution). Antibody (Ab) (group B and C) or pure PBS as a control (group A and D), were
injected intraperiotoneally (i.p.) on a weekly basis in awake animals for a total time of 8
weeks.
Experimental timing After canulation and ROI definition, a baseline scan to assess back-
ground (bg) fluorescent signal was performed followed by AOI987 injection. After the 20
second bolus injection, the scan was started (t=0min) and followed by another scan 15min
after AOI987 injection. The animal was allowed to wake up and recover during a 2 hours pe-
95

Chapter 3: Application of imaging in immunotherapy studies
riod and was subjected to scanning 165min, 180min and 195min after AOI987 injection again.
For data analysis the timepoints before (t=-15min, (bg)), timepoint of injection (t=0min) and
180min after AOI87 injection (t=180min) were used. An interleaved scanning design allowed
scanning of three animals within one day over an approximately 5 months period.
Treatment paradigm Weekly i.p. injection with either amyloid-plaque modulation anti-
body (Ab) (group B and C) or phosphate buffered saline (PBS) (group A and D) occured each
morning for the respective awake animals. Each animal underwent a NIRF scan before treat-
ment started, one day after the fourth i.p. injection and one day after the last i.p.injection.
After NIRF experiments, all animals that had undergone NIRF scans within the present week
were euthanized and brains processed. A schematical summary of the treatment paradigm
is presented in figure 3.5.
Group A
Group D
Group C
Group B
arcAβ
arcAβ
arcAβ
controls
(n=9)
(n=9)
(n=10)
(n=14)
PBS
antibody
PBS
PBSantibody
antibody
PBS
PBS
NIR
F im
agin
g
NIR
F im
agin
g
NIR
F im
agin
g
group genotype week 0 - 4 week 4 - 8
time
AO
I987
AO
I987
Ab/
PB
S
Ab/
PB
S
Ab/
PB
S
Ab/
PB
S
Ab/
PB
S
Ab/
PB
S
Ab/
PB
S
Ab/
PB
S
AO
I987
Figure 3.5: Schematical representation of the treatment paradigm in the longitudinal
antibody treatment study using AOI987 NIRF imaging. Animals were sub-
divided into four groups. Each animal received weekly i.p. injetion with
either amyloid plaque modulating antibody (Ab) or PBS. Before treatment
onset, 4 weeks after and 8 weeks after onset, AOI987 was injected for NIRF
experiments.
96

3.2 Changes in β-amyloid load upon passive immunization revealed by NIRF
Data acquisition NIRF experiments were performed on the fluorescence reflectance small
animal molecular imager eXplore Optix (ART Advanced Research Technologies Inc. and
General Electric, Montreal, Canada) in the time-domain imaging mode. This imaging de-
vice emits light at 666nm using a pulsed laser diode and detects the fluorescent signal after
filtering with a 700nm filter using a photomultiplier tube.
Three regions of interest (ROI) were defined: i) on the head of the animal covering the
brain ii) on the back of the animal lateral to the spinal cord, possibly sparing the kidney and
iii) on the reference tube. Once the ROIs were defined they could be imported into each an-
imal to control for ROI size and positioned accordingly. Scan parameters were: laser power:
130 µW, integration time: 2 seconds, scan step: 1mm, total scan duration: approximately 8
minutes.
Data analysis and processing NIRF data was acquired using the eXplore Optix scanner in
the time domain mode and evaluated using the analogue eXplore Optix OptiView software,
version 1.00. Average photon count values were determined from each ROI and for each
scan and animal. ROIs were defined sparing spots of signal dropout due to dark hair on the
margins of the ROI when necessary and to have an area of interest for data calculation of
60mm2 for the brain, 80mm2 and 25mm2 for the reference tube ROI.
Two important parameters were calculated from the data as presented in chapter 2.3 (As-
sesment of AD plaque load by NIRF imaging): relative intensity (RI, see formula 2.6) and
specific binding (SB, see formula 2.7). Relative intensity is a measure of the ratio of AOI987
present in the body of each animal at different timepoints relative to peak values. Specific
binding (SB) shows how much signal comes from the brain of transgenic mice relative to
control animals and therefore how much AOI987 is bound specifically to amyloid plaques in
brains of arcAβ whereas binding in control animals is unspecific or at least less pronounced
due to the lower numbers of amyloid depositions.
Histology Paraffin embedded brains were cut in 5µm slices (Leica RM2155 Microtome) and
mounted on glass slides (Thermo Scientific Superfrost Plus Microscope Slides). Slides were
baked at 60 ◦C for 2 hours before deparaffinization of tissue in histoclear and rehydration in
graded ethanol to water. Slices were further rinsed in distilled water three times for 3 min-
utes. Before each use, 1% aqueous Thioflavin-S was prepared and filtered freshly (Thioflavin
S, Sigma, Sigma-Aldrich Chemie GmbH Steinheim, Germany, Lot 67H0273). Slides were
incubated in Thioflavin-S solution for exactly 8 minutes at room temperature. Thioflavin-S
was descarted and slides washed for 3 minutes in 80% ethanol. Ethanol was descarted and
97

Chapter 3: Application of imaging in immunotherapy studies
slides were washed again in fresh 80% ethanol for 3 minutes. Slides were then washed in
95% ethanol for 3 minutes. After washing with 3 exchanges of distilled water for 3 minutes
slides were coverslipped (50x24mm coverslips) in aqueous mounting media (Hydromount,
National diagnostics Lot No. 03-08-05) and kept in the dark at 4 ◦C over night. Slides were
scanned the following morning with a 10xObjective dotSlide Scanner (Olympus).
Results
As established in pilot studies, data was analysed using the OptiView software provided by
GE. Each animal was scanned before, right after and 180min after injection of AOI987 in total
three times, once before treatment starded (0 weeks) after 4 weeks of weekly antibody (Ab)
or PBS injections (4 weeks) and 8 weeks after treatment begin (8 weeks). Avergage photon
count of the regions of interest (ROI) brain and body were exported and the two parameters
relative intensity (RI) as well as specific binding (SB) 180 minutes after AOI987 injection were
calculated according to formula 2.6 and 2.7 for 0, 4 and 8 weeks timepoints.
Relative Intensities Relative intensity (RI) values for all 4 groups over the 8 weeks time
period are displayed for ROIs representing brain and body in figures 3.7 and 3.6 seperately.
The body ROI shown in figure 3.6 shows that at no timepoint there are significant differ-
ences between the 4 groups of animals (ANOVA; 0 weeks, p=0.17; 4 weeks, p=0.28; 8 weeks,
p=0.08). The tendency observed after 8 weeks reflects the slight decrease of RI over the 8
week time period in group A. Except this difference in group A over the three data time-
points, no other group showed significant changes of RI in the body ROI over the 8 weeks
time period (ANOVA; group A p=0.04; group B p=0.72; group C p=0.94; group D p=0.78).
In the brain ROI, changes of RI over time within one group as well as between groups at
a certain timepoint could be observed. Profiles of RI over the 8 weeks time window show
that the signal from the brain stays rather constant for control wildtypes (group D) (see figure
3.7). These values were lower compared to RI in the brain of transgenic animals. RI in the
brain of the arcAβ control group (group A) slightly increases over time, possibly reflecting
increasing amyloid deposition in these 16 months old transgenic animals. Both transgenic
groups receiving Ab show an increase in RI in their brains after 4 weeks of treatment. Fol-
lowing discontinuation of Ab treatment, RI brain values remained constant between 4 and 8
weeks whereas continuation of Ab treatment for another 4 weeks leads to a drop of RI sig-
nal in group C. The four groups differ significantly at all three timepoints (ANOVA; 0 weeks
p=0.01; 8 weeks p=0.00002; 8 weeks p=0.0004). This difference is mainly due to the lower
RI values of control animals (group D). Before treatment started all transgenic groups were
98

3.2 Changes in β-amyloid load upon passive immunization revealed by NIRF
0 2 4 6 80.10
0.15
0.20
0.25
0.30
0.35
Rel
ativ
e In
tens
ity (R
I) [a
.u.]
time [weeks]
group A (arcAβ, n=9) group B (arcAβ, n=9, 4weeks Ab) group C (arcAβ, n=10, 8weeks Ab) group D (controls, n=14)
Figure 3.6: Relative intensity (RI) of the fluorescent signal from AOI987 in the body
of arcAβ and control littermates. Data of all four groups are shown for 0, 4
and 8 weeks of the longitudinal treatment study. No significant difference
was found at any timepoint between the four groups. Detailed description
of results are to be found in the text and in tables 3.2 and 3.3. Data represent
average±sem.
significantly different from the control animals (independent two sample t-tests; group A vs
D p=0.001; group B vs D p=0.04; group C vs D p=0.05). Original data of each group seper-
ately over time revealed significant changes of RI for the two groups treated with Ab (group
B and C) whereas no significant change of RI raw values were observed for the two con-
trol groups, arcAβ and control wildtype littermates without Ab injections (ANOVA; group A
p=0.14; group B p=0.005; group C p=0.006; group D p=0.37). Both Ab-treated groups showed
a significant increase of brain RI after 4 weeks of Ab treatment (independent two sample t-
test; group B p=0.004; group C p=0.001). When Ab treatment was stopped after 4 weeks
(group B) the brain RI values remained constant between 4 and 8 weeks (independent two
sample t-test; p=0.90) and consequentely the 8 weeks value differed significantly from the
value before treatment onset (independent two sample t-test; p=0.003). When Ab treatment
was continued for another 4 weeks group C showed a significant drop of brain RI between
week 4 and 8 (independent two sample t-test; p=0.03) and the final brain RI value was not
significantly different from the value before treatment onset (independent two sample t-test;
p=0.71).
It is important to mention that after 8 weeks of Ab treatment, RI values in the brains of
99

Chapter 3: Application of imaging in immunotherapy studies
group C arcAβ mice did not differ significantly from those of wt anymore (independent two
sample t-test; group C vs D 8 weeks p=0.08) whereas before, these animal groups did differ
significantly from each other (independent two sample t-tests; group C vs D, 0 weeks p=0.05,
4 weeks p=0.00000). Both other groups of transgenic animals differed from control wildtype
animals at all timepoints (independent two sample t-tests; group A vs D, p=0.001, p=0.0001,
p=0.00005; group B vs D, p=0.04, p=0.00002, p=0.00001, for 0, 4 and 8 weeks respectively).
All statistical analysis are summarized in tables 3.2 and 3.3
0 2 4 6 80.10
0.15
0.20
0.25
0.30
0.35
Rel
ativ
e In
tens
ity (R
I) [a
.u.]
time [weeks]
group A (arcAβ, n=9) group B (arcAβ, n=9, 4weeks Ab) group C (arcAβ, n=10, 8weeks Ab) group D (controls, n=14)
Figure 3.7: Relative intensity (RI) of the fluorescent signal from AOI987 in the brain
of arcAβ and control littermates. Data of all four groups are shown for 0,
4 and 8 weeks of the longitudinal treatment study. Detailed description of
results are to be found in the text and in tables 3.2 and 3.3. Data represent
average±sem.
Normalized Relative Intensities Further processesing of relative intensity data reveales
that normalization of each animal to its respective RI value prior to treatment start (0 weeks)
support conclusions derived from the absolute RI data.
The normalized RI of the body ROI reveal no significant differences between the 4 groups
at any timepoint (ANOVA; 4 weeks p=0.72, 8 weeks p=0.42; , see table 3.3) or within a certain
group over time (ANOVA; group A p=0.29; group B p=0.58; group C p=0.57; group D p=0.79;
see table 3.2).
The normalized relative intensity (RI) values are illustrated in figure 3.8. No change of
normalized RI over the 8 weeks time frame could be observed in group D (control animals,
ANOVA p=0.20). Group A, transgenic arcAβ that did not receive antibody (Ab) treatment,
100

3.2 Changes in β-amyloid load upon passive immunization revealed by NIRF
showed a tendency to increase their RI values over the 8 weeks period (ANOVA p=0.5).
Group B and C, both consisting of transgenic animals receiving Ab treatment, showed a sig-
nificant change of normalized brain RI over the 8 weeks period (ANOVA; group B p=0.01;
group C p=0.002). Increase of normalized RI after 4 weeks of antibody treatment (group B,
p=0.0005, group C, p=0.0002) was observed. Discontinuation of Ab treatment lead to lev-
elling off in group B where no further change in normalized RI value could be observed
between week 4 and week 8 (p=0.78). Continuation of Ab treatment for another 4 weeks,
hence a total of 8 weeks, lead to a significant decrease of normalized RI between week 4 and
week 8 (p=0.02).
Another important observation can be reported when looking at the normalized RI data
from the brains of the different groups A, B, C and D at the different timepoints 4 and 8 weeks.
At 4 weeks, the Ab treated transgenic groups B and C had higher normalized RI values
compared to control (independent two sample t-test at 4 weeks; group B vs D p=0.03; group
C vs D p=0.008). Important to mention is that after 8 weeks of Ab treatment, arcAβ animals
did not differ significantly from control wildtypes anymore (independent two sample t-test,
group C vs D p=0.80) whereas both other arcAβ groups showed at least a tendency to have
higher normalized RI values compared to wildtypes (independent two sample t-test; group
A vs D p=0.10; group B vs D p=0.02).
All statistical analysis are summarized in tables 3.2 and 3.3
Specific binding (SB) Similar to results described for RI, SB reveals that AOI987 is bound
specifically in brains of these animals compared to control wildtype littermates and that this
SB increased over the 8 week observation period indicating increases in amyloid plaque de-
position. Four weeks of Ab treatment led to a significant increase of specific binding in both
group B and C (independent two sample t-test between week 0 and 4, group B p=0.01; group
C p=0.009). When Ab treatment was stopped after week 4, SB levels remained constant (in-
dependent two sample t-test, group B p=0.28). Continuation of Ab treatment tended to lead
to a drop in the SB signal between week 4 and 8 (independent two sample t-test; group C
p=0.14). At no timepoint significant differences between the three groups could be observed
(see table 3.4).
101

Chapter 3: Application of imaging in immunotherapy studies
0 2 4 6 80.5
1.0
1.5
2.0
norm
. Rel
ativ
e In
tens
ity (R
I) [a
.u.]
time [weeks]
group A (arcAβ, n=9) group B (arcAβ, n=9, 4weeks Ab) group C (arcAβ, n=10, 8weeks Ab) group D (controls, n=14)
Figure 3.8: Normalized relative intensity (RI) of the fluorescent signal from AOI987
in the brain of arcAβ and control littermates. Each individual animal has
been normalized to its respective RI value before treatment onset. Detailed
description of results are to be found in the text and tables 3.2 and 3.3. Data
represent average±sem.
0 2 4 6 80.0
0.2
0.4
0.6
Spe
cific
Bin
ding
(SB
) [a.
u.]
time [weeks]
group A (arcAβ, n=9) group B (arcAβ, n=9, 4weeks Ab) group C (arcAβ, n=10, 8weeks Ab)
Figure 3.9: Specific binding (SB) of AOI987 in the brain of transgenic compared to
wildtpye animals. SB data from all three arcAβ groups are shown for 0, 4
and 8 weeks of longitudinal study. Detailed description of results are to be
found in the text and table 3.4. Data represent average±sem.
102

3.2 Changes in β-amyloid load upon passive immunization revealed by NIRF
Preliminary histological results After NIRF experiments all mice were perfused and brains
processed for histological analysis. Currently these brains are examined in the laboratory of
our collaboration partner (Lisa Strobel, Laboratory of Prof. R. Nitsch, University of Zurich).
These preliminary results do not show significant differences in total plaque load in neocortex
and hippocampus, neither in vascular nor parenchymal fraction thereof. More detailed anal-
ysis shall contain quantification of vascular plaque deposition, reveal changes in the structure
of amyloid deposits in order to answer open questions and explain results observed in the
NIRF experiments.
Illustrative preliminary results are shown in figure 3.10 with ThioflavinS, staining β-
amyloid. In a purely descriptive manner, an accumulation of positively stained β-amyloid
can be observed around the cerebral vasculature in arcAβ that received 4 or 8 weeks of Ab
treatment. One might speculate that fragmentation of parenchymal amyloid deposits might
occur in the groups B and C receiving Ab treatment compared to the transgenic control group
A.
Group Atg, 8 weeks PBS
Group Btg, 4 weeks Ab
Group Ctg, 8 weeks Ab
Group Dwt, 8 weeks PBS
pare
nchy
mal
Aβ
vasc
ular
Aβ
Aβ
Figure 3.10: Preliminary histological findings. Staining of brain sections with
ThioflavinS, staining β-amyloid in green. Upper row shows parenchy-
mal amyloid deposits of one representative mouse per group, lower row
vascular amyloid deposits. Figure provided by our collaborators from the
Laboratory of Prof. R.Nitsch, Zurich.
103

Chapter 3: Application of imaging in immunotherapy studies
Discussion
Amyloid plaque modulating Ab treatment was performed in transgenic mice modeling AD.
Two control groups were included, one arcAβ group and a wildtype control littermate group
receiving weekly saline injections. Various passive immunization studies have been per-
formed previously in different mouse models for AD (for review see [76]). The results dif-
fered depending on the study design and technology used. Reduction of amyloid plaques,
shifting the parenchymal/vascular amyloid deposit ratio and other findings have been re-
ported.
The passive immunization study reported here comprises weekly i.p. injection of a chimeric
monoclonal antibody against Aβ, comprising human variable and murine constant regions,
that binds with high affinity to fibrillar forms of Aβ. Passive immunization can have sev-
eral mechanisms of action that are summarizingly discussed in [76]. Negative side effects
such as microhemorrhages, autoimmune disease and others have been observed in differ-
ent studies and are currently approached in various ways. No extreme toxic side effect has
been observed in our study, yet no special toxicity test was applied. This would have to be
addressed in a seperate study not necessarily including NIRF imaging.
NIRF imaging is well suited for longitudinal observations as procedures are completely
non-invasive and combination with the amyloid specific fluorescent and non-toxic dye AOI987,
gives a sensitive semiquantitative readout of amyloid deposition in the brains of AD mouse
models.
It was observed that 16 months old arcAβ animals (group A) receiving weekly control
PBS injections showed a slight increase of RI over the 8 weeks period, possibly reflecting the
increase of amyloid deposition in their brains during this period in life. Both groups that re-
ceived weekly Ab injections showed increased NIRF signal after 4 weeks of treatment. These
data may indicate that amyloid depositions may be fragmented by the antibody. Fragmenta-
tion would lead to an increased number of binding sites for AOI987 which would be reflected
by higher fluorescent signal. The exact binding mechanism of AOI987 to β-amyloid is not
known but it has been hypothesized that the AOI987 molecule may intercalate between the
β-sheets of the secondary structure of Aβ found in amyloid depositions, possibly in a similar
way as the histological dye congo red [43]. The signal emitted by AOI987 is probably limited
by the number and accessibility of available binding sites on amyloid deposits, hence frag-
mentation of the plaques may increase AOI987 binding sites and lead to the observed higher
NIRF signal.
Stopping Ab treatment after 4 weeks led to no significant changes of relative intensity
104

3.2 Changes in β-amyloid load upon passive immunization revealed by NIRF
(RI) between week 4 and 8 indicating that no further changes in amyloid plaque structure or
amount occured within that time. Continuation of Ab treatment between week 4 and 8 after
treatment onset led to a significant decrease of NIRF signal (see figure 3.8). After 8 weeks of
Ab treatment, the relative intensity of treated arcAβ animals was not significantly different
from the one of wildtype control littermates anymore, whereas both other transgenic groups
still were significantly different. These results indicate that 8 weeks of Ab treatment led to
strong changes in amyloid deposition of 18months old arcAβ animals compared to arcAβ
animals that were not treated. Possible explanations include i) further fragmentation of Aβ
plaques to such an extent that AOI987 can not bind anymore (see figure 3.11(a)) ii) possibly
partial removal of amyloid deposition (figure 3.11(b)) and/or iii) drainage of Aβ fragments
towards the cerebral vasculature. The last meachanism would not only increase cerebral
amyloid angiopathy as observed by other studies [118] but could lead to the formation of a
mechanical barrier around the blood vessels that may impair penetration of AOI987 into the
brain and hence binding to amyloid depositions still present in the brain parenchyma (figure
3.11(c)). The different hypotheses of how the NIRF signal may be explained at different
timepoints in different groups is illustrated in figure 3.11.
Which one of these hypotheses could explain the experimental results shown here, still
has to be revealed by quantitative histological analysis of the brains. First preliminary histo-
logical stainings are shown in figure 3.10.
Keeping in mind the large number of immunzation trials currently going on, NIRF imag-
ing is certainly a well suited tool for preclinical screening of potential candidates, not only
reducing numbers of animals but mainly reinforcing statistical power by longitudinal analy-
sis.
105

Chapter 3: Application of imaging in immunotherapy studies
PBS
Ab
0 weeks 4 weeks 8 weeks
group AarcAβ
group BarcAβ
group CarcAβ
group Dcontrols
a
c
b
Figure 3.11: Hypothetical explanation of the results found for relative intensity (RI)
and specific binding (SB) in the longitudinal treatment study in the arcAβ
mouse model of AD using NIRF imaging. Data for four groups of ani-
mals at three timepoints of treatment are shown. Amyloid plaque load is
indicated by red stars.
106

3.2C
hangesin
β-amyloid
loadupon
passiveim
munization
revealedby
NIR
F
Statistical tables
BODY BRAIN
group A group B group C group D group A group B group C group D
raw data
ANOVA p=0.04 p=0.72 p=0.94 p=0.78 p=0.14 p=0.005 p=0.006 p=0.37
t-test: 0:4weeks p=0.45 p=0.50 p=0.91 p=0.69 p=0.06 p=0.004 p=0.001 p=0.33
t-test: 0:8weeks p=0.02 p=0.69 p=0.76 p=0.46 p=0.13 p=0.003 p=0.71 p=0.65
t-test: 4:8weeks p=0.05 p=0.54 p=0.82 p=0.78 p=0.59 p=0.90 p=0.03 p=0.17
normalized data
ANOVA p=0.29 p=0.58 p=0.57 p=0.79 p=0.05 p=0.01 p=0.002 p=0.20
t-test: 0:4weeks p=0.89 p=0.39 p=0.43 p=0.52 p=0.02 p=0.0005 p=0.0002 p=0.03
t-test: 0:8weeks p=0.03 p=0.60 p=0.63 p=0.84 p=0.02 p=0.01 p=0.86 p=0.84
t-test: 4:8weeks p=0.29 p=0.41 p=0.41 p=0.60 p=0.63 p=0.78 p=002 p=0.25
Table 3.2: Summary of statistical analysis of the relative intensity (RI) results in the brain and body of all four animal groups at the three
timepoints of the longitudinal treatment study. Comparison within each group between different timepoints were performed by
one-way ANOVAs and independent two-sample t-tests for both, original as well as normalized data. p-values≤0.05 are considered
significant.
107
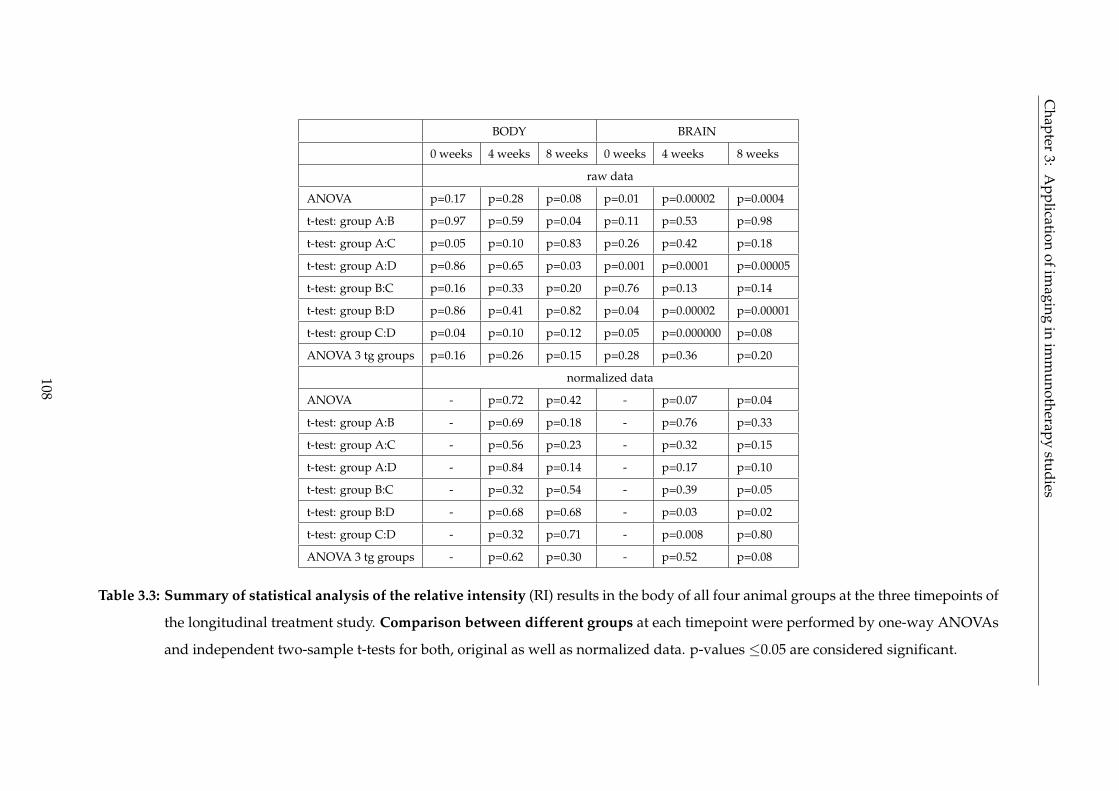
Chapter
3:A
pplicationofim
agingin
imm
unotherapystudies
BODY BRAIN
0 weeks 4 weeks 8 weeks 0 weeks 4 weeks 8 weeks
raw data
ANOVA p=0.17 p=0.28 p=0.08 p=0.01 p=0.00002 p=0.0004
t-test: group A:B p=0.97 p=0.59 p=0.04 p=0.11 p=0.53 p=0.98
t-test: group A:C p=0.05 p=0.10 p=0.83 p=0.26 p=0.42 p=0.18
t-test: group A:D p=0.86 p=0.65 p=0.03 p=0.001 p=0.0001 p=0.00005
t-test: group B:C p=0.16 p=0.33 p=0.20 p=0.76 p=0.13 p=0.14
t-test: group B:D p=0.86 p=0.41 p=0.82 p=0.04 p=0.00002 p=0.00001
t-test: group C:D p=0.04 p=0.10 p=0.12 p=0.05 p=0.000000 p=0.08
ANOVA 3 tg groups p=0.16 p=0.26 p=0.15 p=0.28 p=0.36 p=0.20
normalized data
ANOVA - p=0.72 p=0.42 - p=0.07 p=0.04
t-test: group A:B - p=0.69 p=0.18 - p=0.76 p=0.33
t-test: group A:C - p=0.56 p=0.23 - p=0.32 p=0.15
t-test: group A:D - p=0.84 p=0.14 - p=0.17 p=0.10
t-test: group B:C - p=0.32 p=0.54 - p=0.39 p=0.05
t-test: group B:D - p=0.68 p=0.68 - p=0.03 p=0.02
t-test: group C:D - p=0.32 p=0.71 - p=0.008 p=0.80
ANOVA 3 tg groups - p=0.62 p=0.30 - p=0.52 p=0.08
Table 3.3: Summary of statistical analysis of the relative intensity (RI) results in the body of all four animal groups at the three timepoints of
the longitudinal treatment study. Comparison between different groups at each timepoint were performed by one-way ANOVAs
and independent two-sample t-tests for both, original as well as normalized data. p-values ≤0.05 are considered significant.
108

3.2 Changes in β-amyloid load upon passive immunization revealed by NIRF
comparison within groups
group A group B group C
ANOVA p=0.27 p=0.001 p=0.17
t-test 0:4 weeks p=0.30 p=0.01 p=0.009
t-test 0:8 weeks p=0.08 p=0.0006 p=0.76
t-test 4:8 weeks p=0.64 p=0.28 p=0.14
comparison between groups
0 weeks 4 weeks 8 weeks
ANOVA p=0.37 p=0.39 p=0.14
t-test groupA:B p=0.14 p=0.86 p=0.88
t-test group A:C p=0.25 p=0.30 p=0.18
t-test group B:C p=0.87 p=0.09 p=0.14
Table 3.4: Summary of statistical analysis of the specific binding (SB) of AOI987 in the
brain of the three transgenic animal groups (groups A, B, C) relative to the
control wildtype littermate group (group D) during the course of the lon-
gitudinal treatment study. Comparison between different groups at each
timepoint as well as within each group between different timepoints were
performed by one-way ANOVAs and independent two-samples t-tests for
specific binding data. p-values ≤0.05 are considered significant.
109

Chapter 3: Application of imaging in immunotherapy studies
110

Chapter 4
Conclusions and outlook
This PhD thesis was part of a larger project with the aim of developing, establishing and
applying different imaging modalities for preclinical research in the field of Alzheimer’s Dis-
ease (AD). My contribution was embedded in the setup and application of structural and
functional Magnetic Resonance Imaging (MRI) as well as Near InfraRed Fluoresence (NIRF)
imaging experiments in mouse models of AD.
One focus was set on the vascular aspect of amyloid deposition in these animal models
that develop high cerebral amyloid angiopathy (CAA) and the impact thereof on the different
applications in MR.
The second focus was set on establishing an imaging protocol using NIRF and application
into two mouse models of AD.
Both techniques were used as part of treatment studies where the effects of amyloid
plaque modulating antibodies were investigated.
4.1 Vascular aspect of amyloid pathology in AD
One of the main aspects of this thesis was investigating the impact of vascular amyloid de-
position (cerebral amyloid angiopathy, CAA). Many studies in humans and animal models
show that the vascular pathology plays an important role in the disease progression.
During the experiments for this thesis it was found that CAA led to changes in both the
structure and the function of the murine vasculature.
Magnetic Resonance Angiography (MRA) A high resolution MR Angiography study showed
that in transgenic mice displaying high CAA the amount as well as the size of major blood
vessels of the cerebral microvasulature was reduced.
This shows that CAA leading to anatomical changes in the architecture of small cortical
111

Chapter 4: Conclusions and outlook
vessels can be visualised and quantitatively assessed non-invasively.
One possible confounder may be that not only the deposition of vascular amyloid plaques
but also other vasculopathies such as arteriosclerosis may lead to structural changes of the
microvasculature. This is relevant as carriers of the ApoEε4 allel with increased risk of de-
veloping atherosclerotic plaques carry also an increased risk of developing mild cognitive
impairment (MCI) or AD. These factors may also influence the vessel structure and should if
possible be diagnosed in advance.
For the future it will be necessary to correlate the findings from the high resolution MRA
images in arcAβ and control littermates with the respective histological sections of each in-
dividual mouse. This will not only allow proof of the technique and allow the longitudinal
follow-up of individual animals but possibly also reduce numbers of animals in future stud-
ies by sparing the necessary histological analysis.
Functional MRI (fMRI) Major effort has been put into investigating the consequences of
CAA on the functionality of blood vessels. In order not to be confounded by differences that
may be due to altered neuronal function between transgenic and control animals, a physio-
logical paradigm was used that allows assessing the vascular responsiveness in mice. It was
found that deposition of amyloid along the cerebral vasculature leads to altered response to
vasodilatory stimulation in transgenic animals. “Vascular reactivity” as a measure of how
fast blood vessels can dilate on demand and “maximum vasodilation”, indicating reduced
extent to which vasodilation is possible were found to be impaired in transgenic compared to
control animals. Both, arcAβ and APPDutch animals display a high vascular amyloid plaque
load and in both studies high CAA load correlated with impaired vascular function.
These results show that CAA does not only lead to changes in the structure of cerebral
blood vessels but also in the function of the cerebral vasculature. Integrity of cerebral blood
supply is of major importance for proper neuronal functioning. When neurons are active
they have an increased need for energy supply which is immediately satisfied by increasing
blood flow, volume and oxygenation. If the hemodynamic response upon neuronal need is
disturbed, this certainly has major effects on proper brain functioning. We may speculate that
the impaired vascular responsiveness may in a long term lead to neuronal death or at least
neuronal dysfunction which might lead to the clincial symptoms observed in AD. CAA alone
may not be sufficient as a cause of these symptoms but in combination with parenchymal
amyloid deposition and eventually even neurofibrillary tangles the sum of these pathological
events may lead to the fatal clinical picture in AD patients.
Two months of amyloid plaque modulating antibody treatment in arcAβ mice did not
112

4.1 Vascular aspect of amyloid pathology in AD
reveal differences in vascular response to vasodilatory stimulation between treated and un-
treated animals. Two major reasons may explain these negative findings:
i) The antibody used was a human antibody that was not murinized. What type of effects
it may cause when a human antibody is injected into the mouse organism may be explained
by immunologists - but possibly the antibody may have been detected by the murine immune
system as a foreign invader and simply get eliminated from the body. In the study presented
here, injection of the ctrl antibody created an appropriate control condition as both human
antibodies would probably have lead to comparable side effects.
ii) Different studies of treating AD mice with anti-amyloid antibodies showed a shift of
amyloid deposition from the brain parenchyma towards the vascular site. Increased Aβ de-
position would, if at all, negatively affect the vascular response to a vasodilatory stimulus. If
this displacment occurs as a interim step before amyloid is cleared from the brain or if it is
the final result obtainable from antibody treatment, is still matter of an ongoing discussion in
the field. Certainly further experiments are needed to elucidate this matter in more detail.
MRI techniques A big advantage of the MR methods used here is translatability into clin-
ics. MRI is a non-invasive technique that is nowadays commonly applied in human patients.
All substances and contrast agents used in the MR studies presented here are approved by
authorities for clinical use and available on the market even though Endorem R© is not regis-
tered for the current application.
To translate the MR Angiography approach into human applications may be rather chal-
lenging due to technical reasons such as the spatial resolution obtainable in human MR scan-
ners, movement artefacts, imaging duration etc. Possibly the acquistion of an indicative brain
region displaying CAA using high resolution MR imaging before and after injection of a con-
trast agent may constitute an approach to evaluate if a patient displays a high CAA load. If
certain future treatments of AD lead to a burden on the vasculature, these patients could be
excluded from this type of treatment.
The fMRI approach was shown to have high specificity and sensitivity of the diagnostic
accuracy. This fact and the good tolerance of acetazolamide in humans makes the readout of
functional vascular responsiveness theoretically a potential tool for clinical use.
For preclinical research, the advantages of MRI are obviously the non-invasiveness which
not only would reduce the number of animals but also allow the longitudinal characterization
of single animals.
113

Chapter 4: Conclusions and outlook
Outlook
For the MRA project it will ceratinly be of interest to investigate young animals before CAA
deposition and possibly track changes in CAA deposition along cerebral microvasculature in
these animals over a certain phase of their life. At the moment, several amyloid-modulating
antibody studies indicate that relocation of amyloid deposits from the parenchymal to the
vascular site may occur during therapy. This aspect could be investigated using the MRA
technique developed here once the correlation between MR signal changes in MRA and his-
tological alterations due to CAA are established.
The fMRI experiments performed in arcAβ and APPDutch animals could in the future be
pursued in different ways. Assessing the vascular responsiveness in a mouse model of AD
that does not display CAA but mainly parenchymal amyloid deposition could strengthen
the hypothesis that impaired vascular responsiveness is due to CAA. A neuronal stimula-
tion paradigm in combination with fMRI assessing changes in cerebral blood volume could
reveal if blood vessels in AD mouse models are capable of dilating upon neuronal demand.
Probably mouse models with strong CAA would show a similar or elevated degree of impair-
ment in neuronal stimulation as in physiological stimulation with acetazolamide. If AD mice
displaying a strong parenchymal amyloid deposition would show impaired CBV increases
upon neuronal but not vasodilatory stimulation, it could be hypothesized that parenchymal
Aβ deposition alone leads to changes in neuronal activity or neurovascular coupling. Both
approaches would certainly widen the knowledge about the influence of amyloid pathology
in AD.
For preclinical evaluation of antibody therapy both MR methods may be evaluated espe-
cially with a focus on vascular structural and functional integrity.
Both MR methods described here could also be applied to other imaging studies that do
not necessarily focus on CAA but possibly also on other type of vasculopathies.
Translation into clinics may be an aspect that is rather far fetched but could theoretically
be achieved. If the methods ever would be applied in a clinical setting, patients with a strong
vascular amyloid burden could be identified and possibly excluded if the therapy had strong
vascular side effects. Observation of possible vascular side effects could be another applica-
tion of the approaches.
4.2 Molecular imaging of amyloid plaque load using NIRF
Combining near infrared fluorescent (NIRF) imaging and the amyloid-specific fluorescent
dye AOI987 showed to be a reliable tool for preclinical in-vivo imaging of mouse models of
114

4.2 Molecular imaging of amyloid plaque load using NIRF
AD. It was shown that clearance of the dye occurs faster from the brain of control animals
than from the brain of transgenic mouse models of AD. Using two different mouse models,
one displaying mainly vascular amyloid deposits and one displaying mainly parenchymal
amyloid deposits, revealed that AOI987 binds to both types of amyloid deposition, which
makes the method applicable to a wide range of AD mouse models.
Semiquantitative determination of amyloid plaque load can not only be used to pheno-
type animal models but is certainly of major interest for the in-vivo observations of amyloid-
modifying treatment approaches. Amyloid deposition is commonly accepted to play a major
role in the development of the clinical symptons in AD, hence the approach to change the
amyloid plaque load, at best reducing it, is pursued by several therapy approaches. The
amyloid plaque load changing aspect of therapy could be validated using the NIRF/AOI987
method.
One important point in this context is that only total plaque load and not shifts of lo-
calisation of the amyloid deposits between parenchymal and vascular site can be detected.
Another drawback of the technique is that absolute determination of amyloid load is not
possible. Merely relative plaque load, providing comparison between groups or within one
animal over time would be achievable.
Outlook
Combination of detailed histological analysis and the NIRF results obtained is certainly the
next step for this project. Determination of a more microscopic view of what anti-amyloid-
antibody therapy causes in the brain can only be determiend by means of histology.
The method established in this thesis using NIRF and AOI987 paved the way for investi-
gating other amyloid plaque modulating therapies which of course always have to go hand
in hand with histological analysis. Compared to purely histological studies, non-invasive
in-vivo imaging allows longitudinal observation of treatment effects. Effects observed with
the NIRF imaging technique might not be explained on a microscopic level but rather reveal
changes of total plaque load in the intact murine brain.
One important point when talking about the translation into clinics is comparison of PET
and NIRF imaging. In the last years substantial progress has been made developing the
amyloid specific tracer PiB for PET imaging in the AD field [57]. This technique has high
potential not only for clinical use but also for preclinical research in small animal PET. Nev-
ertheless, NIRF imaging in combination with AOI987 or similar amyloid-specific dyes cer-
tainly deserves its place in preclinical research for several reasons: PET imaging requires a
large infrastructure e.g. for generation of radioactive tracers, whereas setup of commercially
115

Chapter 4: Conclusions and outlook
available NIRF imaging systems is rather straightforward and less cost-intensive. Another
advantage of NIRF imaging is the possibility to combine it with other non-invasive imaging
techniques such as MRI. These hybrid-systems would allow us to benefit from the high spa-
tial resolution and excellent soft-tissue contrast of MRI and the good sensitivity and specific
labelling of biological processes with NIRF imaging, not only in the field of AD.
116

Bibliography
[1] A. Alzheimer, R. A. Stelzmann, H. N. Schnitzlein, and F. R. Murtagh. An english trans-
lation of Alzheimer’s 1907 paper, Über eine eigenartige Erkankung der Hirnrinde".
Clin Anat, 8(6):429–431, 1995.
[2] Brian J Bacskai, William E Klunk, Chester A Mathis, and Bradley T Hyman. Imaging
amyloid-β deposits in vivo. J Cereb Blood Flow Metab, 22(9):1035–1041, Sep 2002.
[3] Christof Baltes, Nicole Radzwill, Simone Bosshard, Daniel Marek, and Markus Rudin.
Micro MRI of the mouse brain using a novel 400 MHz cryogenic quadrature RF probe.
NMR Biomed, 22(8):834–842, Oct 2009.
[4] J. Baudier and R. D. Cole. Phosphorylation of tau proteins to a state like that in
Alzheimer’s brain is catalyzed by a calcium/calmodulin-dependent kinase and mod-
ulated by phospholipids. J Biol Chem, 262(36):17577–17583, Dec 1987.
[5] Nicolau Beckmann, Alexandra Schuler, Thomas Mueggler, Eric P Meyer, Karl-Heinz
Wiederhold, Matthias Staufenbiel, and Thomas Krucker. Age-dependent cerebrovas-
cular abnormalities and blood flow disturbances in APP23 mice modeling Alzheimer’s
disease. J Neurosci, 23(24):8453–8459, Sep 2003.
[6] H. Benveniste, G. Einstein, K. R. Kim, C. Hulette, and G. A. Johnson. Detection of
neuritic plaques in Alzheimer’s disease by Magnetic Resonance Microscopy. Proc Natl
Acad Sci U S A, 96(24):14079–14084, Nov 1999.
[7] Lester I Binder, Angela L Guillozet-Bongaarts, Francisco Garcia-Sierra, and Robert W
Berry. Tau, tangles, and Alzheimer’s disease. Biochim Biophys Acta, 1739(2-3):216–223,
Jan 2005.
[8] Mathew Blurton-Jones and Frank M Laferla. Pathways by which Aβ facilitates tau
pathology. Curr Alzheimer Res, 3(5):437–448, Dec 2006.
117

BIBLIOGRAPHY
[9] D. Boche, E. Zotova, R. O. Weller, S. Love, J. W. Neal, R. M. Pickering, D. Wilkinson,
C. Holmes, and J. A R Nicoll. Consequence of Aβ immunization on the vasculature of
human Alzheimer’s disease brain. Brain, 131(Pt 12):3299–3310, Dec 2008.
[10] Delphine Boche and James A R Nicoll. The role of the immune system in clearance of
Aβ from the brain. Brain Pathol, 18(2):267–278, Apr 2008.
[11] Ursula Bodendorf, Simone Danner, Frauke Fischer, Muriel Stefani, Christine Sturchler-
Pierrat, Karl-Heinz Wiederhold, Matthias Staufenbiel, and Paolo Paganetti. Expression
of human β-secretase in the mouse brain increases the steady-state level of β-amyloid.
J Neurochem, 80(5):799–806, Mar 2002.
[12] D. R. Borchelt, T. Ratovitski, J. van Lare, M. K. Lee, V. Gonzales, N. A. Jenkins, N. G.
Copeland, D. L. Price, and S. S. Sisodia. Accelerated amyloid deposition in the brains
of transgenic mice coexpressing mutant presenilin 1 and amyloid precursor proteins.
Neuron, 19(4):939–945, Oct 1997.
[13] D. R. Borchelt, G. Thinakaran, C. B. Eckman, M. K. Lee, F. Davenport, T. Ratovitsky,
C. M. Prada, G. Kim, S. Seekins, D. Yager, H. H. Slunt, R. Wang, M. Seeger, A. I. Levey,
S. E. Gandy, N. G. Copeland, N. A. Jenkins, D. L. Price, S. G. Younkin, and S. S. Sisodia.
Familial Alzheimer’s disease-linked presenilin 1 variants elevate Aβ1-42/1-40 ratio in
vitro and in vivo. Neuron, 17(5):1005–1013, Nov 1996.
[14] A. Bozzao, R. Floris, M. E. Baviera, A. Apruzzese, and G. Simonetti. Diffusion and per-
fusion MR imaging in cases of Alzheimer’s disease: correlations with cortical atrophy
and lesion load. AJNR Am J Neuroradiol, 22(6):1030–1036, 2001.
[15] Guido J Burbach, Andreas Vlachos, Estifanos Ghebremedhin, Domenico Del Turco,
Janaky Coomaraswamy, Matthias Staufenbiel, Mathias Jucker, and Thomas Deller. Ves-
sel ultrastructure in APP23 transgenic mice after passive anti-Aβ immunotherapy and
subsequent intracerebral hemorrhage. Neurobiol Aging, 28(2):202–212, Feb 2007.
[16] Thierry Bussière, Frédérique Bard, Robin Barbour, Henry Grajeda, Terry Guido, Karen
Khan, Dale Schenk, Dora Games, Peter Seubert, and Manuel Buttini. Morphological
characterization of thioflavin-s-positive amyloid plaques in transgenic Alzheimer mice
and effect of passive Aβ immunotherapy on their clearance. Am J Pathol, 165(3):987–
995, Sep 2004.
[17] H. Cai, Y. Wang, D. McCarthy, H. Wen, D. R. Borchelt, D. L. Price, and P. C. Wong.
118

BIBLIOGRAPHY
BACE1 is the major β-secretase for generation of Abeta peptides by neurons. Nat Neu-
rosci, 4(3):233–234, Mar 2001.
[18] E. E. Camargo. Brain spect in neurology and psychiatry. J Nucl Med, 42(4):611–623, Apr
2001.
[19] Rudy J Castellani, Mark A Smith, George Perry, and Robert P Friedland. Cerebral
amyloid angiopathy: major contributor or decorative response to Alzheimer’s disease
pathogenesis. Neurobiol Aging, 25(5):599–602; discussion 603–4, 2004.
[20] Irene H Cheng, Jorge J Palop, Luke A Esposito, Nga Bien-Ly, Fengrong Yan, and
Lennart Mucke. Aggressive amyloidosis in mice expressing human amyloid peptides
with the arctic mutation. Nat Med, 10(11):1190–1192, Nov 2004.
[21] Gaël Chetelat and Jean-Claude Baron. Early diagnosis of Alzheimer’s disease: contri-
bution of structural neuroimaging. Neuroimage, 18(2):525–541, Feb 2003.
[22] M. A. Chishti, D. S. Yang, C. Janus, A. L. Phinney, P. Horne, J. Pearson, R. Strome,
N. Zuker, J. Loukides, J. French, S. Turner, G. Lozza, M. Grilli, S. Kunicki, C. Morissette,
J. Paquette, F. Gervais, C. Bergeron, P. E. Fraser, G. A. Carlson, P. S. George-Hyslop,
and D. Westaway. Early-onset amyloid deposition and cognitive deficits in transgenic
mice expressing a double mutant form of amyloid precursor protein 695. J Biol Chem,
276(24):21562–21570, Jun 2001.
[23] R. Christie, M. Yamada, M. Moskowitz, and B. Hyman. Structural and functional dis-
ruption of vascular smooth muscle cells in a transgenic mouse model of amyloid an-
giopathy. Am J Pathol, 158(3):1065–1071, Mar 2001.
[24] Jeffrey L Cummings, Joan Mackell, and Daniel Kaufer. Behavioral effects of current
Alzheimer’s disease treatments: a descriptive review. Alzheimers Dement, 4(1):49–60,
Jan 2008.
[25] Judianne Davis, Feng Xu, Rashid Deane, Galina Romanov, Mary Lou Previti, Kelly Zei-
gler, Berislav V Zlokovic, and William E Van Nostrand. Early-onset and robust cerebral
microvascular accumulation of amyloid β-protein in transgenic mice expressing low
levels of a vasculotropic Dutch/Iowa mutant form of amyloid β-protein precursor. J
Biol Chem, 279(19):20296–20306, May 2004.
[26] R. B. DeMattos, K. R. Bales, D. J. Cummins, J. C. Dodart, S. M. Paul, and D. M. Holtz-
man. Peripheral anti-Aβ antibody alters CNS and plasma Aβ clearance and decreases
119

BIBLIOGRAPHY
brain Aβ burden in a mouse model of Alzheimer’s disease. Proc Natl Acad Sci U S A,
98(15):8850–8855, Jul 2001.
[27] K. Duff, C. Eckman, C. Zehr, X. Yu, C. M. Prada, J. Perez-tur, M. Hutton, L. Buee,
Y. Harigaya, D. Yager, D. Morgan, M. N. Gordon, L. Holcomb, L. Refolo, B. Zenk,
J. Hardy, and S. Younkin. Increased amyloid-β42(43) in brains of mice expressing mu-
tant presenilin 1. Nature, 383(6602):710–713, Oct 1996.
[28] R. J. Ellis, J. M. Olichney, L. J. Thal, S. S. Mirra, J. C. Morris, D. Beekly, and A. Heyman.
Cerebral amyloid angiopathy in the brains of patients with Alzheimer’s disease: the
CERAD experience, Part XV. Neurology, 46(6):1592–1596, Jun 1996.
[29] M. F. Folstein, S. E. Folstein, and P. R. McHugh. t’t’Mini-mental state”. A practical
method for grading the cognitive state of patients for the clinician. J Psychiatr Res,
12(3):189–198, Nov 1975.
[30] AD Forum. http://www.alzforum.org/. online.
[31] P. T. Fox and M. E. Raichle. Focal physiological uncoupling of cerebral blood flow and
oxidative metabolism during somatosensory stimulation in human subjects. Proc Natl
Acad Sci U S A, 83(4):1140–1144, Feb 1986.
[32] H. M. Frankel, E. Garcia, F. Malik, J. K. Weiss, and H. R. Weiss. Effect of acetazolamide
on cerebral blood flow and capillary patency. J Appl Physiol, 73(5):1756–1761, Nov 1992.
[33] Monica Garcia-Alloza and Brian J Bacskai. Techniques for brain imaging in vivo. Neu-
romolecular Med, 6(1):65–78, 2004.
[34] G. G. Glenner and C. W. Wong. Alzheimer’s disease and Down’s syndrome: shar-
ing of a unique cerebrovascular amyloid fibril protein. Biochem Biophys Res Commun,
122(3):1131–1135, Aug 1984.
[35] Osborne Goldsby, Kindt. Kuby Immunology. W. H. Freeman and Company, 2000.
[36] S. M. Greenberg and J. Rosand. Outcome markers for clinical trials in cerebral amyloid
angiopathy. Amyloid, 8 Suppl 1:56–60, Jul 2001.
[37] Steven M Greenberg. Cerebral amyloid angiopathy and vessel dysfunction. Cerebrovasc
Dis, 13 Suppl 2:42–47, 2002.
[38] Steven M Greenberg, M. Edip Gurol, Jonathan Rosand, and Eric E Smith. Amyloid
angiopathy-related vascular cognitive impairment. Stroke, 35(11 Suppl 1):2616–2619,
Nov 2004.
120

BIBLIOGRAPHY
[39] J. A. Hardy and G. A. Higgins. Alzheimer’s disease: the amyloid cascade hypothesis.
Science, 256(5054):184–185, Apr 1992.
[40] John Hardy and Dennis J Selkoe. The amyloid hypothesis of Alzheimer’s disease:
progress and problems on the road to therapeutics. Science, 297(5580):353–356, Jul 2002.
[41] J. Hennig, A. Nauerth, and H. Friedburg. RARE imaging: a fast imaging method for
clinical MR. Magn Reson Med, 3(6):823–833, Dec 1986.
[42] Martin C Herzig, David T Winkler, Patrick Burgermeister, Michelle Pfeifer, Es-
ther Kohler, Stephen D Schmidt, Simone Danner, Dorothee Abramowski, Christine
Stürchler-Pierrat, Kurt Bürki, Sjoerd G van Duinen, Marion L C Maat-Schieman,
Matthias Staufenbiel, Paul M Mathews, and Mathias Jucker. Aβ is targeted to the vas-
culature in a mouse model of hereditary cerebral hemorrhage with amyloidosis. Nat
Neurosci, 7(9):954–960, Sep 2004.
[43] Martin Hintersteiner, Albert Enz, Peter Frey, Anne-Lise Jaton, Willy Kinzy, Rainer
Kneuer, Ulf Neumann, Markus Rudin, Matthias Staufenbiel, Markus Stoeckli, Karl-
Heinz Wiederhold, and Hans-Ulrich Gremlich. In vivo detection of amyloid-β deposits
by near-infrared imaging using an oxazine-derivative probe. Nat Biotechnol, 23(5):577–
583, May 2005.
[44] Christoph Hock, Uwe Konietzko, Johannes R Streffer, Jay Tracy, Andri Signorell, Britta
Müller-Tillmanns, Ulrike Lemke, Katharina Henke, Eva Moritz, Esmeralda Garcia,
M. Axel Wollmer, Daniel Umbricht, Dominique J F de Quervain, Marc Hofmann,
Alessia Maddalena, Andreas Papassotiropoulos, and Roger M Nitsch. Antibodies
against β-amyloid slow cognitive decline in Alzheimer’s disease. Neuron, 38(4):547–
554, May 2003.
[45] K. Hsiao, P. Chapman, S. Nilsen, C. Eckman, Y. Harigaya, S. Younkin, F. Yang, and
G. Cole. Correlative memory deficits, abeta elevation, and amyloid plaques in trans-
genic mice. Science, 274(5284):99–102, Oct 1996.
[46] C. Iadecola, F. Zhang, K. Niwa, C. Eckman, S. K. Turner, E. Fischer, S. Younkin, D. R.
Borchelt, K. K. Hsiao, and G. A. Carlson. SOD1 rescues cerebral endothelial dysfunc-
tion in mice overexpressing amyloid precursor protein. Nat Neurosci, 2(2):157–161, Feb
1999.
[47] Costantino Iadecola. Cerebrovascular effects of amyloid-β peptides: mechanisms and
implications for Alzheimer’s dementia. Cell Mol Neurobiol, 23(4-5):681–689, Oct 2003.
121

BIBLIOGRAPHY
[48] Clifford R Jack, Michael Garwood, Thomas M Wengenack, Bret Borowski, Geoffrey L
Curran, Joseph Lin, Gregor Adriany, Olli H J Gröhn, Roger Grimm, and Joseph F Po-
duslo. In vivo visualization of Alzheimer’s amyloid plaques by Magnetic Resonance
Imaging in transgenic mice without a contrast agent. Magn Reson Med, 52(6):1263–1271,
Dec 2004.
[49] W. J. Jagust, J. L. Eberling, B. R. Reed, C. A. Mathis, and T. F. Budinger. Clinical studies
of cerebral blood flow in Alzheimer’s disease. Ann N Y Acad Sci, 826:254–262, Sep 1997.
[50] Joanna L Jankowsky, Hilda H Slunt, Victoria Gonzales, Alena V Savonenko, Jason C
Wen, Nancy A Jenkins, Neal G Copeland, Linda H Younkin, Henry A Lester, Steven G
Younkin, and David R Borchelt. Persistent amyloidosis following suppression of Aβ
production in a transgenic model of Alzheimer disease. PLoS Med, 2(12):e355, Dec 2005.
[51] K. A. Jellinger. Alzheimer disease and cerebrovascular pathology: an update. J Neural
Transm, 109(5-6):813–836, May 2002.
[52] Keith A Johnson, Matt Gregas, John A Becker, Catherine Kinnecom, David H Salat,
Erin K Moran, Erin E Smith, Jonathan Rosand, Dorene M Rentz, William E Klunk,
Chester A Mathis, Julie C Price, Steven T Dekosky, Alan J Fischman, and Steven M
Greenberg. Imaging of amyloid burden and distribution in cerebral amyloid angiopa-
thy. Ann Neurol, 62(3):229–234, Sep 2007.
[53] R. N. Kalaria. Cerebral vessels in ageing and alzheimer’s disease. Pharmacol Ther,
72(3):193–214, 1996.
[54] K. Kantarci, C. R. Jack, Y. C. Xu, N. G. Campeau, P. C. O’Brien, G. E. Smith, R. J. Ivnik,
B. F. Boeve, E. Kokmen, E. G. Tangalos, and R. C. Petersen. Mild cognitive impairment
and Alzheimer disease: regional diffusivity of water. Radiology, 219(1):101–107, Apr
2001.
[55] M. Kawai, R. N. Kalaria, P. Cras, S. L. Siedlak, M. E. Velasco, E. R. Shelton, H. W.
Chan, B. D. Greenberg, and G. Perry. Degeneration of vascular muscle cells in cerebral
amyloid angiopathy of Alzheimer disease. Brain Res, 623(1):142–146, Sep 1993.
[56] Chelsea S Kidwell and Max Wintermark. Imaging of intracranial haemorrhage. Lancet
Neurol, 7(3):256–267, Mar 2008.
[57] William E Klunk, Henry Engler, Agneta Nordberg, Yanming Wang, Gunnar Blomqvist,
Daniel P Holt, Mats Bergström, Irina Savitcheva, Guo feng Huang, Sergio Estrada, Bir-
gitta Ausén, Manik L Debnath, Julien Barletta, Julie C Price, Johan Sandell, Brian J
122

BIBLIOGRAPHY
Lopresti, Anders Wall, Pernilla Koivisto, Gunnar Antoni, Chester A Mathis, and
Bengt Långström. Imaging brain amyloid in Alzheimer’s disease with Pittsburgh
Compound-B. Ann Neurol, 55(3):306–319, Mar 2004.
[58] Marlen Knobloch. The ArcAβ Mouse: a Novel Transgenic APP Mouse Model of Alzheimer
Disease. PhD thesis, University of Zurich, 2007.
[59] Marlen Knobloch, Uwe Konietzko, Danielle C Krebs, and Roger M Nitsch. Intracellular
Aβ and cognitive deficits precede beta-amyloid deposition in transgenic arcAβ mice.
Neurobiol Aging, 28(9):1297–1306, Sep 2007.
[60] B. T. Lamb, L. M. Call, H. H. Slunt, K. A. Bardel, A. M. Lawler, C. B. Eckman, S. G.
Younkin, G. Holtz, S. L. Wagner, D. L. Price, S. S. Sisodia, and J. D. Gearhart. Altered
metabolism of familial Alzheimer’s disease-linked amyloid precursor protein variants
in yeast artificial chromosome transgenic mice. Hum Mol Genet, 6(9):1535–1541, Sep
1997.
[61] J. Lewis, D. W. Dickson, W. L. Lin, L. Chisholm, A. Corral, G. Jones, S. H. Yen, N. Sa-
hara, L. Skipper, D. Yager, C. Eckman, J. Hardy, M. Hutton, and E. McGowan. En-
hanced neurofibrillary degeneration in transgenic mice expressing mutant tau and
APP. Science, 293(5534):1487–1491, Aug 2001.
[62] J. Lewis, E. McGowan, J. Rockwood, H. Melrose, P. Nacharaju, M. Van Slegtenhorst,
K. Gwinn-Hardy, M. Paul Murphy, M. Baker, X. Yu, K. Duff, J. Hardy, A. Corral, W. L.
Lin, S. H. Yen, D. W. Dickson, P. Davies, and M. Hutton. Neurofibrillary tangles, amy-
otrophy and progressive motor disturbance in mice expressing mutant (P301L) tau pro-
tein. Nat Genet, 25(4):402–405, Aug 2000.
[63] Anna Lord, Hannu Kalimo, Chris Eckman, Xiao-Qun Zhang, Lars Lannfelt, and Lars
N G Nilsson. The Arctic Alzheimer mutation facilitates early intraneuronal Aβ aggre-
gation and senile plaque formation in transgenic mice. Neurobiol Aging, 27(1):67–77,
Jan 2006.
[64] Apoorva Mandavilli. The amyloid code. Nat Med, 12(7):747–751, Jul 2006.
[65] J. B. Mandeville, J. J. Marota, B. E. Kosofsky, J. R. Keltner, R. Weissleder, B. R. Rosen,
and R. M. Weisskoff. Dynamic functional imaging of relative cerebral blood volume
during rat forepaw stimulation. Magn Reson Med, 39(4):615–624, Apr 1998.
123

BIBLIOGRAPHY
[66] C. L. Masters, G. Simms, N. A. Weinman, G. Multhaup, B. L. McDonald, and
K. Beyreuther. Amyloid plaque core protein in alzheimer disease and down syndrome.
Proc Natl Acad Sci U S A, 82(12):4245–4249, Jun 1985.
[67] Colin L Masters, Roberto Cappai, Kevin J Barnham, and Victor L Villemagne. Molecu-
lar mechanisms for Alzheimer’s disease: implications for neuroimaging and therapeu-
tics. J Neurochem, 97(6):1700–1725, Jun 2006.
[68] Mark D Meadowcroft, James R Connor, Michael B Smith, and Qing X Yang. MRI and
histological analysis of beta-amyloid plaques in both human Alzheimer’s disease and
APP/PS1 transgenic mice. J Magn Reson Imaging, 29(5):997–1007, May 2009.
[69] D. Moechars, I. Dewachter, K. Lorent, D. Reversé, V. Baekelandt, A. Naidu, I. Tesseur,
K. Spittaels, C. V. Haute, F. Checler, E. Godaux, B. Cordell, and F. Van Leuven. Early
phenotypic changes in transgenic mice that overexpress different mutants of amyloid
precursor protein in brain. J Biol Chem, 274(10):6483–6492, Mar 1999.
[70] Ryan T Mott and Christine M Hulette. Neuropathology of Alzheimer’s disease. Neu-
roimaging Clin N Am, 15(4):755–65, ix, Nov 2005.
[71] Claire Mount and Christian Downton. Alzheimer disease: progress or profit? Nat Med,
12(7):780–784, Jul 2006.
[72] Thomas Mueggler, Diana Baumann, Martin Rausch, Matthias Staufenbiel, and Markus
Rudin. Age-dependent impairment of somatosensory response in the amyloid precur-
sor protein 23 transgenic mouse model of Alzheimer’s disease. J Neurosci, 23(23):8231–
8236, Sep 2003.
[73] Thomas Mueggler, Christine Sturchler-Pierrat, Diana Baumann, Martin Rausch,
Matthias Staufenbiel, and Markus Rudin. Compromised hemodynamic response in
amyloid precursor protein transgenic mice. J Neurosci, 22(16):7218–7224, Aug 2002.
[74] Bhashkar Mukherjee, Mark Preece, Gavin C Houston, Nikolas G Papadakis, T. Adrian
Carpenter, Laurance D Hall, and Christopher L-H Huang. Mapping of the cerebral re-
sponse to acetazolamide using graded asymmetric spin echo EPI. Magn Reson Imaging,
23(9):907–920, Nov 2005.
[75] James A R Nicoll, David Wilkinson, Clive Holmes, Phil Steart, Hannah Markham, and
Roy O Weller. Neuropathology of human Alzheimer disease after immunization with
amyloid-β peptide: a case report. Nat Med, 9(4):448–452, Apr 2003.
124

BIBLIOGRAPHY
[76] Roger M Nitsch and Christoph Hock. Targeting β-amyloid pathology in alzheimer’s
disease with abβ immunotherapy. Neurotherapeutics, 5(3):415–420, Jul 2008.
[77] J. Näslund, V. Haroutunian, R. Mohs, K. L. Davis, P. Davies, P. Greengard, and J. D.
Buxbaum. Correlation between elevated levels of amyloid β-peptide in the brain and
cognitive decline. JAMA, 283(12):1571–1577, 2000.
[78] Salvatore Oddo, Antonella Caccamo, Jason D Shepherd, M. Paul Murphy, Todd E
Golde, Rakez Kayed, Raju Metherate, Mark P Mattson, Yama Akbari, and Frank M
LaFerla. Triple-transgenic model of Alzheimer’s disease with plaques and tangles: in-
tracellular Aβ and synaptic dysfunction. Neuron, 39(3):409–421, Jul 2003.
[79] National Institute of Health/National Institute of Aging.
http://www.nia.nih.gov/alzheimers/alzheimersinformation/generalinfo/. online.
[80] Paxinos. The mouse brain in stereotactic coordinates. ACADEMIC PRESS, 2001.
[81] Jeffrey R Petrella, R. Edward Coleman, and P. Murali Doraiswamy. Neuroimaging and
early diagnosis of Alzheimer disease: a look to the future. Radiology, 226(2):315–336,
Feb 2003.
[82] M. Pfeifer, S. Boncristiano, L. Bondolfi, A. Stalder, T. Deller, M. Staufenbiel, P. M. Math-
ews, and M. Jucker. Cerebral hemorrhage after passive anti-aβ immunotherapy. Sci-
ence, 298(5597):1379, Nov 2002.
[83] Joseph F Poduslo, Thomas M Wengenack, Geoffry L Curran, Thomas Wisniewski,
Einar M Sigurdsson, Slobodon I Macura, Bret J Borowski, and Clifford R Jack. Molec-
ular targeting of Alzheimer’s amyloid plaques for contrast-enhanced magnetic reso-
nance imaging. Neurobiol Dis, 11(2):315–329, Nov 2002.
[84] I. Prohovnik, R. Mayeux, H. A. Sackeim, G. Smith, Y. Stern, and P. O. Alderson.
Cerebral perfusion as a diagnostic marker of early Alzheimer’s disease. Neurology,
38(6):931–937, Jun 1988.
[85] Jacob Raber, Yadong Huang, and J. Wesson Ashford. ApoE genotype accounts for the
vast majority of AD risk and AD pathology. Neurobiol Aging, 25(5):641–650, 2004.
[86] Margaret M Racke, Laura I Boone, Deena L Hepburn, Maia Parsadainian, Matthew T
Bryan, Daniel K Ness, Kathy S Piroozi, William H Jordan, Donna D Brown, Wherly P
Hoffman, David M Holtzman, Kelly R Bales, Bruce D Gitter, Patrick C May, Steven M
Paul, and Ronald B DeMattos. Exacerbation of cerebral amyloid angiopathy-associated
125

BIBLIOGRAPHY
microhemorrhage in amyloid precursor protein transgenic mice by immunotherapy
is dependent on antibody recognition of deposited forms of amyloid β. J Neurosci,
25(3):629–636, Jan 2005.
[87] Rebecca Radde, Tristan Bolmont, Stephan A Kaeser, Janaky Coomaraswamy, Den-
nis Lindau, Lars Stoltze, Michael E Calhoun, Fabienne Jäggi, Hartwig Wolburg, Si-
mon Gengler, Christian Haass, Bernardino Ghetti, Christian Czech, Christian Hölscher,
Paul M Mathews, and Mathias Jucker. Aβ42-driven cerebral amyloidosis in transgenic
mice reveals early and robust pathology. EMBO Rep, 7(9):940–946, Sep 2006.
[88] Pedro Ramos-Cabrer, Ralph Weber, Dirk Wiedermann, and Mathias Hoehn. Continu-
ous noninvasive monitoring of transcutaneous blood gases for a stable and persistent
BOLD contrast in fMRI studies in the rat. NMR Biomed, 18(7):440–446, Nov 2005.
[89] David Ratering, Christof Baltes, Jurek Nordmeyer-Massner, Daniel Marek, and Markus
Rudin. Performance of a 200-MHz cryogenic RF probe designed for MRI and MRS of
the murine brain. Magn Reson Med, 59(6):1440–1447, Jun 2008.
[90] A. G. Reaume, D. S. Howland, S. P. Trusko, M. J. Savage, D. M. Lang, B. D. Greenberg,
R. Siman, and R. W. Scott. Enhanced amyloidogenic processing of the β-amyloid pre-
cursor protein in gene-targeted mice bearing the Swedish familial Alzheimer’s disease
mutations and a "humanized" Abeta sequence. J Biol Chem, 271(38):23380–23388, Sep
1996.
[91] J. Grayson Richards, Guy A Higgins, Abdel-Mouttalib Ouagazzal, Laurence Ozmen,
James N C Kew, Bernd Bohrmann, Pari Malherbe, Manfred Brockhaus, Hansruedi
Loetscher, Christian Czech, Gerda Huber, Horst Bluethmann, Helmut Jacobsen, and
John A Kemp. PS2APP transgenic mice, coexpressing hPS2mut and hAPPswe, show
age-related cognitive deficits associated with discrete brain amyloid deposition and
inflammation. J Neurosci, 23(26):8989–9003, Oct 2003.
[92] S. E. Rose, F. Chen, J. B. Chalk, F. O. Zelaya, W. E. Strugnell, M. Benson, J. Semple,
and D. M. Doddrell. Loss of connectivity in Alzheimer’s disease: an evaluation of
white matter tract integrity with colour coded MR diffusion tensor imaging. J Neurol
Neurosurg Psychiatry, 69(4):528–530, Oct 2000.
[93] Markus Rudin. Molecular Imaging: Basic Principles and Applications in Biomedical Re-
search. Imperial College Press, 2005.
126

BIBLIOGRAPHY
[94] A. Satlin, N. Bodick, W. W. Offen, and P. F. Renshaw. Brain proton magnetic resonance
spectroscopy (1H-MRS) in Alzheimer’s disease: changes after treatment with xanome-
line, an M1 selective cholinergic agonist. Am J Psychiatry, 154(10):1459–1461, Oct 1997.
[95] D. Schenk, R. Barbour, W. Dunn, G. Gordon, H. Grajeda, T. Guido, K. Hu, J. Huang,
K. Johnson-Wood, K. Khan, D. Kholodenko, M. Lee, Z. Liao, I. Lieberburg, R. Mot-
ter, L. Mutter, F. Soriano, G. Shopp, N. Vasquez, C. Vandevert, S. Walker, M. Wogulis,
T. Yednock, D. Games, and P. Seubert. Immunization with amyloid-β attenuates
Alzheimer-disease-like pathology in the PDAPP mouse. Nature, 400(6740):173–177, Jul
1999.
[96] Prof. Dr. Hans H. Schild. MRI made easy (... well almost). Schering AG
Berlin/Bergkamen, 1990.
[97] Anja Schroeder, Falk Fahrenholz, and Ulrich Schmitt. Effect of a dominant-negative
form of ADAM10 in a mouse model of Alzheimer’s disease. J Alzheimers Dis, 16(2):309–
314, Feb 2009.
[98] Sally Schroeter, Karen Khan, Robin Barbour, Minhtam Doan, Ming Chen, Terry Guido,
Davinder Gill, Guriqbal Basi, Dale Schenk, Peter Seubert, and Dora Games. Im-
munotherapy reduces vascular amyloid-β in PDAPP mice. J Neurosci, 28(27):6787–6793,
Jul 2008.
[99] Dennis J Selkoe and Dale Schenk. Alzheimer’s disease: molecular understanding pre-
dicts amyloid-based therapeutics. Annu Rev Pharmacol Toxicol, 43:545–584, 2003.
[100] Hwa Kyoung Shin, Phillip B Jones, Monica Garcia-Alloza, Laura Borrelli, Steven M
Greenberg, Brian J Bacskai, Matthew P Frosch, Bradley T Hyman, Michael A
Moskowitz, and Cenk Ayata. Age-dependent cerebrovascular dysfunction in a trans-
genic mouse model of cerebral amyloid angiopathy. Brain, 130(Pt 9):2310–2319, Sep
2007.
[101] D. H. Silverman and M. E. Phelps. Application of positron emission tomography for
evaluation of metabolism and blood flow in human brain: normal development, aging,
dementia, and stroke. Mol Genet Metab, 74(1-2):128–138, 2001.
[102] C. Sturchler-Pierrat, D. Abramowski, M. Duke, K. H. Wiederhold, C. Mistl,
S. Rothacher, B. Ledermann, K. Bürki, P. Frey, P. A. Paganetti, C. Waridel, M. E. Cal-
houn, M. Jucker, A. Probst, M. Staufenbiel, and B. Sommer. Two amyloid precursor
127

BIBLIOGRAPHY
protein transgenic mouse models with alzheimer disease-like pathology. Proc Natl Acad
Sci U S A, 94(24):13287–13292, Nov 1997.
[103] K. Taki, K. Hirahara, T. Totoki, and N. Takahashi. Retention of carbon dioxide in tissue
following carbonic anhydrase inhibition in dogs. Clin Ther, 15(5):884–889, 1993.
[104] Kentaro Tanemura, Miyuki Murayama, Takumi Akagi, Tsutomu Hashikawa, Takashi
Tominaga, Michinori Ichikawa, Haruyasu Yamaguchi, and Akihiko Takashima. Neu-
rodegeneration with tau accumulation in a transgenic mouse expressing V337M hu-
man tau. J Neurosci, 22(1):133–141, Jan 2002.
[105] Yoshitaka Tatebayashi, Tomohiro Miyasaka, De-Hua Chui, Takumi Akagi, Ken ichi
Mishima, Katsunori Iwasaki, Michihiro Fujiwara, Kentaro Tanemura, Miyuki Mu-
rayama, Koichi Ishiguro, Emmanuel Planel, Shinji Sato, Tsutomu Hashikawa, and Ak-
ihiko Takashima. Tau filament formation and associative memory deficit in aged mice
expressing mutant (R406W) human tau. Proc Natl Acad Sci U S A, 99(21):13896–13901,
Oct 2002.
[106] Dietmar Rudolf Thal, Estibaliz Capetillo-Zarate, Sergey Larionov, Matthias Staufen-
biel, Stefan Zurbruegg, and Nicolau Beckmann. Capillary cerebral amyloid angiopa-
thy is associated with vessel occlusion and cerebral blood flow disturbances. Neurobiol
Aging, 30(12):1936–1948, Dec 2009.
[107] Dietmar Rudolf Thal, W. Sue T Griffin, and Heiko Braak. Parenchymal and vascu-
lar Abeta-deposition and its effects on the degeneration of neurons and cognition in
Alzheimer’s disease. J Cell Mol Med, 12(5B):1848–1862, Oct 2008.
[108] Dietmar Rudolf Thal, W. Sue T Griffin, Rob A I de Vos, and Estifanos Ghebremedhin.
Cerebral amyloid angiopathy and its relationship to Alzheimer’s disease. Acta Neu-
ropathol, 115(6):599–609, Jun 2008.
[109] Yoshio Tsuboi. Neuropathology of familial tauopathy. Neuropathology, 26(5):471–474,
Oct 2006.
[110] Markus von Kienlin, Basil Künnecke, Friedrich Metzger, Guido Steiner, J. Grayson
Richards, Laurence Ozmen, Helmut Jacobsen, and Hansruedi Loetscher. Altered
metabolic profile in the frontal cortex of PS2APP transgenic mice, monitored through-
out their life span. Neurobiol Dis, 18(1):32–39, Feb 2005.
[111] S. Vorstrup, L. Henriksen, and O. B. Paulson. Effect of acetazolamide on cerebral blood
flow and cerebral metabolic rate for oxygen. J Clin Invest, 74(5):1634–1639, Nov 1984.
128

BIBLIOGRAPHY
[112] Bettina M. Wegenast-Braun. Alzheimers Disease Lesions: Impact on Cognitive Function in
Transgenic Mice. PhD thesis, Eberhard-Karls-Universität Tübingen, 2009.
[113] Ralph Weissleder and Vasilis Ntziachristos. Shedding light onto live molecular targets.
Nat Med, 9(1):123–128, Jan 2003.
[114] R. O. Weller, A. Massey, T. A. Newman, M. Hutchings, Y. M. Kuo, and A. E. Roher. Cere-
bral amyloid angiopathy: amyloid β accumulates in putative interstitial fluid drainage
pathways in Alzheimer’s disease. Am J Pathol, 153(3):725–733, Sep 1998.
[115] Roy O Weller, Delphine Boche, and James A R Nicoll. Microvasculature changes and
cerebral amyloid angiopathy in Alzheimer’s disease and their potential impact on ther-
apy. Acta Neuropathol, 118(1):87–102, Jul 2009.
[116] Roy O Weller and James A Nicoll. Cerebral amyloid angiopathy: pathogenesis and
effects on the ageing and Alzheimer brain. Neurol Res, 25(6):611–616, Sep 2003.
[117] Roy O Weller, Malavika Subash, Stephen D Preston, Ingrid Mazanti, and Roxana O
Carare. Perivascular drainage of amyloid-β peptides from the brain and its failure in
cerebral amyloid angiopathy and Alzheimer’s disease. Brain Pathol, 18(2):253–266, Apr
2008.
[118] D. M. Wilcock, P. T. Jantzen, Q. Li, D. Morgan, and M. N. Gordon. Amyloid-β vaccina-
tion, but not nitro-nonsteroidal anti-inflammatory drug treatment, increases vascular
amyloid and microhemorrhage while both reduce parenchymal amyloid. Neuroscience,
144(3):950–960, Feb 2007.
[119] Donna M Wilcock, Amyn Rojiani, Arnon Rosenthal, Sangeetha Subbarao, Melissa J
Freeman, Marcia N Gordon, and Dave Morgan. Passive immunotherapy against Aβ in
aged APP-transgenic mice reverses cognitive deficits and depletes parenchymal amy-
loid deposits in spite of increased vascular amyloid and microhemorrhage. J Neuroin-
flammation, 1(1):24, Dec 2004.
[120] H. M. Wisniewski, J. Frackowiak, and B. Mazur-Kolecka. In vitro production of β-
amyloid in smooth muscle cells isolated from amyloid angiopathy-affected vessels.
Neurosci Lett, 183(1-2):120–123, Jan 1995.
[121] Martin Wolf, Marco Ferrari, and Valentina Quaresima. Progress of near-infrared spec-
troscopy and topography for brain and muscle clinical applications. J Biomed Opt,
12(6):062104, 2007.
129

BIBLIOGRAPHY
[122] H. Yamaguchi, T. Yamazaki, C. A. Lemere, M. P. Frosch, and D. J. Selkoe. β amyloid is
focally deposited within the outer basement membrane in the amyloid angiopathy of
Alzheimer’s disease. An immunoelectron microscopic study. Am J Pathol, 141(1):249–
259, Jul 1992.
[123] Quan Zhou, Yang Dong, Li Huang, Shihua Yang, and Wenli Chen. Study of cere-
brovascular reserve capacity by Magnetic Resonance perfusion weighted imaging and
photoacoustic imaging. Magn Reson Imaging, 27(2):155–162, Feb 2009.
130

Acknowledgement
Now that my time as a PhD student is about to finish, I would like to take the opportunity
and thank those people that contributed in some way or the other to this PhD thesis and
supported me during the last years.
On the “professional” side
• My first “thank you” goes to my supervisor Prof. Markus Rudin. Markus, sharing
your impressive knowledge, your encouraging curiosity for research, the generosity
of sending me to international conferences and giving me all financial, technical and
administrative support, are just some of the things I am very grateful for. For me, the
most important thing was that you always had an open door for discussing scientific
questions and problems and the way you made me feel welcome in your (in 2006 still
very small) group. And of course, thank you for ’my’ two Oberassistenten: Dr. Thomas
Mueggler as direct advisor and Dr. Christof Baltes.
• Thomas, I learned so much from you! You were always there to help me, teach me
and listen to me in scientific, technical and philosophic situations and we laughed a lot
together. All I can say is “Thank you, for being my OA!”.
• Christof, thank you for teaching me, confronting me with things I didn’t want to (but
had to) hear and being there with an open ear, helpful comment and humor.
• To my former office-mates in G305, Florence, Rudolf and Katerina: I enjoyed our time
up there “amongs the chemists” very much and I am lucky to have found you, as well
as Esther, Divya, Ivana and Florian as colleagues and friends.
• Another thanks goes to the whole Rudin-group - all the other PhD students (David,
Steffi, Simone, Marco, Qiong, Sandra, Aline, Joanes), our technicians (Ruth and Diana),
Post-Docs (Josiane, Conny, Jan, Aileen), our secretary Esther and all the students over
the past 4 years.
131

Acknowledgement
• Supervising Siddhartha and Bertram as semester and master students was a new and
interesting experience for me and I appreciate their respective contribution to my project.
• My PhD steering comittee Prof. Jean-Marc Fritschy and Prof. Roger Nitsch I would like
to thank for their scientific input and encouragement. Both of them as well as members
of their groups, especially Dr. Marlen Knobloch, Lisa Strobel, Mario Merlini and Dr.
Irene Knuesel helped me with practical tips, ideas and scientific knowledge.
• Our collaborators in the Division of Psychiatry Research, University of Zurich (Prof. R.
Nitsch, Dr. M. Knobloch, L. Strobel), in the Department of Chemistry and Applied Bio-
sciences, Institute of Pharmaceutical Sciences, ETH Zurich (Prof. K.-H. Altmann) and
in the Department of Cellular Neurology, Hertie-Institute for Clinical Brain Research,
Tuebingen (Prof. M. Jucker, Dr. M. Herzig, Dr. B. Wegenast-Braun) I would like to
thank for the fruitful collaborations.
• This project was supported by the Swiss National Science Foundation (310000-112835
and 310030-126029)
On the “private” side
• Csilla, danke, dass Du das “wahre Leben” zu mir auf den Hönggerberg gebracht hast,
danke für all die Aufmunterungen, Hilfe & Unterstützung und Deine Freundschaft.
• Mis “chicas” Sabine, Nadia, Julia y Cris: gracias por ser mis amigas - no se que hubisse
hecho sin ustedes en todos esos años.
• Danke, Dirk, für 10 Jahre gemeinsames “ETH-Leben”.
• Migui, que suerte haberte encontrado como mi esposo y amigo! Gracias por apoyarme
siempre y quererme tanto.
• Meinen Eltern Marianne und Otto und meiner Schwester Franziska verdanke ich mehr
als ich hier auflisten kann: seit 30 Jahre seid Ihr immer für mich da und unterstützt
mich, egal was kommt. Ohne Euch wäre ich nicht wer ich bin und wo ich bin und
dafür sowie für Eure bedingungslose Liebe werde ich Euch immer dankbar sein!
132