investigating the impact of naplan on student, parent and
TRANSCRIPT

Edith Cowan University Edith Cowan University
Research Online Research Online
ECU Publications Post 2013
2016
Investigating the impact of NAPLAN on student, parent and Investigating the impact of NAPLAN on student, parent and
teacher emotional distress in independent schools teacher emotional distress in independent schools
Shane Rogers Edith Cowan University
Lennie Barblett Edith Cowan University
Ken Robinson Edith Cowan University
Follow this and additional works at: https://ro.ecu.edu.au/ecuworkspost2013
Part of the Curriculum and Social Inquiry Commons
10.1007/s13384-016-0203-x This is an Author's Accepted Manuscript of: Rogers, S. L., Barblett, L., & Robinson, K. (2016). Investigating the impact of NAPLAN on student, parent and teacher emotional distress in independent schools. The Australian Educational Researcher, 43(3), 327-343. The final publication is Available at link.springer.com here This Journal Article is posted at Research Online. https://ro.ecu.edu.au/ecuworkspost2013/2070

1
***For the official published version of this manuscript see:
Rogers, S. L., Barblett, L., & Robinson, K. (2016). Investigating the impact of NAPLAN on student, parent and
teacher emotional distress in independent schools, The Australian Education Researcher. DOI 10.1007/s13384-
016-0203-x
Title:
Investigating the impact of NAPLAN on student, parent and teacher emotional distress in
independent schools
Author 1 (corresponding author):
Dr. S. L. Rogers
School of Arts and Humanities
Edith Cowan University, 270 Joondalup Drive, Joondalup, WA 6027, Australia
Email: [email protected]
Phone: +61 8 53045728
Author 2:
Dr. L. Barblett
School of Education
Edith Cowan University, 270 Joondalup Drive, Joondalup, WA 6027, Australia
Author 3:
Dr. K. Robinson
School of Arts and Humanities
Edith Cowan University, 270 Joondalup Drive, Joondalup, WA 6027, Australia
Abstract:
Concerns have been raised about the impact Australia’s national standardised testing, the National Assessment
Program – Literacy and Numeracy (NAPLAN), has upon the well-being of students, parents, and teachers. To
date, research evidence is unclear as to the level and extent of emotional distress experienced by stakeholders
during testing. Despite an unclear evidence base, the prevailing view is that NAPLAN has a general negative
impact upon stakeholder well-being. In a pilot study that surveyed all stakeholder groups across 11 independent
schools in Western Australia, we found evidence of a minimal impact from the testing. We also found evidence
for a small positive association between student and parent distress during testing, and a moderate positive
association between parent and teacher distress during testing and their estimations regarding how NAPLAN
impacts other people. Our results are not consistent with the prevailing view that NAPLAN has a broad negative
impact on well-being, and highlights the need for further research to inform debates about the usefulness and
impact of NAPLAN testing.
Keywords:
NAPLAN, wellbeing, emotional distress, standardised testing, stakeholder perspectives
Acknowledgments:
This research was funded by The Association of Independent Schools of Western Australia (AISWA). The
authors would like to acknowledge the participation of all the principals, teachers, parents, and students that
made this research possible.

2
Introduction
The Australian Curriculum, Assessment and Reporting Authority (ACARA) is the independent
statutory authority responsible for development, implementation and analysis of Australia’s school National
Assessment Program – Literacy and Numeracy (NAPLAN) which covers Years 3, 5, 7 and 9. NAPLAN
provides comparative data between and within schools over years to allow tracking of student and school
development (ACARA, 2015), and these comparative data can be of use for policy makers, school
administrators, teachers, and parents. A focal point of the NAPLAN program is the publication of school results
on the MySchool website (http://www.myschool.edu.au/). The purpose of the website is to provide school results
in an accessible form to the Australian public to foster transparency and accountability of the Australian school
system (ACARA, 2015).
Since inception in 2008, NAPLAN and MySchool have received ongoing criticism from Australian
scholars (For reviews see: Harris et al., 2013; Klenowski & Wyatt-Smith, 2012; Polesel, Dulfer, & Turnbull,
2012). Criticisms mirror those that have been raised by scholars investigating standardised testing regimes in
other countries (Au, 2011; Brockmeier, Green, Pate, Tsemunhu, & Bockenko, 2014; Herman & Golan, 1993;
Segool, Carlson, Goforth, Von Der Embse, & Barterian, 2013). Specifically, NAPLAN has been suggested to
foster an unhelpful competitive culture between schools that results in narrowing of the curriculum (Hardy,
2015; Klenowski & Wyatt-Smith, 2012; Polesel, Rice, & Dulfer, 2014; Thompson & Harbaugh, 2013), and
having a negative impact upon teacher, parent, and student well-being (Dulfer, Polesel, & Rice, 2012; Polesel et
al., 2012; Wyn, Turnbull, & Grimshaw, 2014). We have been unable to find any studies that have specifically
measured the level and extent of potential distress associated with NAPLAN, and the study reported in this
paper was therefore designed to examine self-reported distress in a volunteer sample of teachers, parents, and
students associated with the independent schools sector in response to NAPLAN testing in Years 3 and 5.
NAPLAN and teacher well-being
The stakeholders that have received the most research attention regarding experiences of NAPLAN are
teachers. A number of surveys and qualitative investigations have investigated teacher and principal
perspectives regarding the impact of NAPLAN on pedagogy and any potential negative impact on their students
(APPA, 2013; Dulfer et al., 2012; IEUA, 2010; Polesel et al., 2014; Thompson, 2013; Thompson & Harbaugh,
2013; Ward, 2012; Wyn et al., 2014). In a survey of over 8000 Australian teachers (primary, secondary, and
principals), the majority of respondents reported an impact on teaching practices similar to those reported
overseas (Dulfer et al., 2012; Polesel et al., 2014). NAPLAN has influenced curriculum to become more
NAPLAN-oriented (i.e., literacy and numeracy focused) at the expense of other subject areas (e.g., Society and
Environment, The Arts, and Physical Education). Additionally, NAPLAN has influenced how literacy and
numeracy are taught (APPA, 2013; Ward, 2012). That is, in order to maximise NAPLAN performance, literacy
and numeracy is taught in a structured way that closely aligns with the test, that has been referred to as “teaching
to the test” (Polesel et al., 2014, p. 643; Thompson & Harbaugh, 2013, p. 303). It has been argued that
constraining the creativity and flexibility of teachers in this way may have a negative impact on their job
satisfaction (Berliner, 2011; Thompson & Cook, 2014).
Additionally, increased pressure on teachers to produce strong NAPLAN results may negatively impact
their own well-being. The increased pressure has been argued to largely stem from the publication of school

3
results on the MySchool website (Dulfer et al., 2012; Harris et al., 2013; Klenowski & Wyatt-Smith, 2012;
Polesel et al., 2014; Ragusa & Bousfield, 2015; Thompson, 2013). In their large scale survey, Dulfer et al.
(2012) reported that around 90% of educators believed weaker than expected NAPLAN results would have a
negative impact upon the school’s reputation, parental perception of the school, ability to attract and retain
students, and staff morale. From a survey of over 800 educators from Western and South Australia, Thompson
(2013) reported that in response to an open-ended question asking about the perceived negative impacts of
NAPLAN, 44% of the educators mentioned increased stress and pressure across teachers, parents, and students
as an issue. Similarly, a survey of over 1000 primary school principals found that many respondents indicated
that NAPLAN can raise teacher stress levels in the lead up to the tests (APPA, 2013). Prior research has
therefore identified that NAPLAN testing has the potential to be a demoralising and stressful experience for
teachers. However, no studies have studied the level and extent of distress experienced by teachers during
NAPLAN testing compared with non-testing periods. An unanswered question is: Does the stress experienced
by teachers during NAPLAN surpass the usual stressors associated with being a teacher? The present research
aims to address this gap in the literature by examining teacher self-reported emotional distress during and after
NAPLAN testing.
NAPLAN and parent well-being
The stakeholders that have received the least attention are parents. Existing research investigating
parent perceptions consists of Australian Senate enquiries inviting submissions in 2010 and 2013 (Bousfield &
Ragusa, 2014), a survey by Australian market research company Newspoll commissioned by the Whitlam
Institute (Newspoll, 2013), and interviews with 26 parents by the Whitlam institute (Wyn et al., 2014). This
research has been primarily focused upon parent perceptions regarding the usefulness of NAPLAN and
perceived impact upon student well-being. Overall, this research suggests that two out of three have a relatively
positive attitude towards the testing, and half of the parents report perceiving their child experiencing some level
of stress associated with the testing. No research has directly investigated the level and extent of the impact
testing might have upon parent well-being. From transcript quotes provided by Wyn et al. (2014), there is
evidence to suggest that some parents may experience elevated stress due to concern about their child’s
performance and/or how their child will react to the testing. The present research aims to address this gap in the
literature by examining parent self-reported emotional distress during and after NAPLAN testing.
NAPLAN and student well-being
As reviewed earlier, a few studies have asked teachers their impressions of the impact NAPLAN has on
students (APPA, 2013; Dulfer et al., 2012; Thompson, 2013). From these studies the precise extent of the
impact of NAPLAN upon students is very unclear. For example, the Dulfer et al. (2012) survey found that 90%
of teachers reported at least some students feeling stressed, but also that 40% reported some students looking
forward to the testing. As another example, the primary principal survey found that two-thirds of respondents
reported a belief that NAPLAN has a slightly negative impact upon students (APPA, 2013).
To date, there are three studies that have examined actual student perceptions of NAPLAN (Belcastro
& Boon, 2012; Howell, 2012; Wyn et al., 2014). Belcastro and Boon’s (2012) study focused on student
motivation rather than well-being, so will not be discussed in any detail here. Howell (2012) asked 100 students
4
across Years 3, 5, and 7 in two schools to draw a picture about their NAPLAN experience, and then
qualitatively evaluated the themes present in the drawings. The authors reported that drawings were
“overwhelmingly negative” (Howell, 2012, p. 9). However a closer inspection of Howell’s (2012, p. 10) results
indicates that this pattern was only evident for one of the two schools, with the second school containing more
balanced experiences.
Wyn et al. (2014) conducted interviews with 70 students evenly split across Years 5, 7 and 9, that were
sampled across 16 schools. Most of the student interviews were carried out in groups. The section of the Wyn et
al. (2014) report dedicated to student perceptions of well-being consisted entirely of negative student anecdotes,
but then stated in the final paragraph of the section that “The majority of students reported that they did not like
NAPLAN, but advised that they generally got through it without too many issues…” (Wyn et al., 2014, p. 27).
In their executive summary, a conclusion made was that “…NAPLAN is a significant pedagogical intervention
which has some positive uses, but is plagued by negative impacts on learning and on student well-being” (Wyn
et al., 2014, p. 6). Therefore both Howell (2012) and Wyn et al. (2014) appear to make strong negative
conclusions based on mixed negative, neutral and positive findings.
In the Australian literature to date, the prevailing view appears to be that NAPLAN has a negative
impact upon student well-being despite little evidence regarding the precise level and extent of distress
experienced by students during testing (For example: Harris et al., 2013; Howell, 2012; O'Keefe, 2011; Polesel
et al., 2012; Thompson, 2013; Wyn et al., 2014). A further aim of the present study is to examine self-reported
emotional distress of students during and after testing in order to contribute to the research literature.
The present study
As mentioned above, there is reason to believe that NAPLAN testing may have a negative impact
across multiple stakeholders (i.e., educators, parents, and students). However no prior studies have quantified
any impact. The primary aim of the present research is to explore this by examining teacher, parent, and student
self-reported emotional distress, in Years 3 and 5, across eleven independent schools in Western Australia.
Based on prior research, we expected some negative impact to be experienced by all stakeholders; however the
size of effect was uncertain. NAPLAN is a test of performance (e.g. Australian Senate Committee Report,
2013), and like any test of performance (e.g., other school tests, ballet recital, job interview, first date etc.) a
slight increase in stress is an expected and a functional response. A long-standing psychological principle is the
Yerkes-Dodson law that describes the inverted U shaped relationship between stress and performance (Cassady
& Johnson, 2002; Lowe et al., 2008; Salehi, Cordero, & Sandi, 2010; Yerkes & Dodson, 1908). That is, a slight
elevation in stress is deemed adaptive in contexts of evaluation as a slight increase in arousal can facilitate
concentration for the task at hand. However after a certain optimal point, that is determined by both
dispositional and situational factors, further stress can impair concentration and therefore diminish performance.
Stress that is maintained at a high level for a prolonged period can exhaust physical and mental energy resulting
in diminished well-being of the individual. We therefore approach interpretation of our results with this in mind.
In our study we use the same measure of distress across all stakeholders in order to enable direct
comparisons among the groups. We therefore are able to directly investigate the previously unexplored
questions: Who is the most affected by the NAPLAN testing - students, parents, or teachers? And, what is the
level and extent of distress associated with NAPLAN testing for each group? Respondents of the primary

5
principals survey generally believed that Year 3 students were more negatively affected by testing compared
with Year 5 students (APPA, 2013). However, Howell (2012) found that Year 7 students produced a higher
proportion of negative drawings compared to Year 3 and 5 students. Therefore we were also interested in
comparing across Years 3 and 5, in addition to the overall comparison across students, parents, and teachers.
Surveys of teachers have revealed an existing belief that students may become more stressed as they
are affected by their parents stress level, if the parent places a great deal of importance in performance and
communicates (either verbally or non-verbally) their anxiety to their child (Thompson, 2013; Wyn et al., 2014).
Due to the way distress was measured in our study we are able to explore if any positive association exists
between parent distress and that of their child. We are also able to explore whether there is any positive
association between teacher distress during testing and the overall distress experienced in their class of students.
Additionally, we also asked parents and teachers to provide estimates of the level of impact NAPLAN
testing has upon the well-being of all stakeholder groups of interest for this study (i.e., students, parents and
teachers). It has previously been found that parents with a more negative attitude towards NAPLAN typically
reported perceiving their child as experiencing higher levels of stress during testing (Newspoll, 2013). Therefore
we expected to find a positive relationship between self-reported self-distress and perceived distress in others.
Method
Participants
Eighteen member schools of the Association of Independent Schools of Western Australia were
contacted by the research team to request participation in our study approximately two months prior to
NAPLAN testing. Eleven school principals agreed to participate. Most of the schools declining participation
were from rural areas. We acknowledge that our results are limited by a potential self-selection bias of schools
that all hold student wellbeing as a high priority, and are likely not to be representative of schools generally, nor
for all independent schools. As may be expected, all participating schools were above the median level (1000) of
socio-educational advantage as determined by the Index of Community Socio-educational Advantage (ICSEA)
that is published on the MySchool website, values ranging from 1051 – 1182 (Mean = 1148).
Participants consisted of 196 Year 3 students (aged 7-8 years old; 58.2% female), 269 Year 5 students
(aged 9-10 years old; 58.7% female), 346 parents (Mean age = 43 years; 92.2% female), and 40 teachers (Mean
age = 37 years; 82.5% female; 45% year 3 and 55% year 5) across 11 independent metropolitan schools in
Western Australia. A specific break down of participants across schools is provided in Table 1. Prior to
commencement of the study institutional ethics approval was obtained from the Edith Cowan University ethics
committee.
Table 1. The number of participants from different stakeholder groups across all schools involved in the study,
split by gender.
School: 1. 2. 3. 4. 5. 6. 7. 8. 9.* 10.* 11.**
Year 3
students
18f/
19m
14f/
8m
12f/
8m
11f/
11m
6f/
12m
10f/
4m
7f/
7m
4f/
1m
18f/
0m
14f/
0m
0f/
12m
Year 5
students
28f/
33m
17f/
14m
10f/
8m
17f/
9m
11f/
13m
7f/
5m
11f/
6m
1f/
0m
32f/
0m
24f/
0m
0f/
23m
Parents
62f/
1m
32f/
3m
34f/
3m
35f/
5m
26f/
3m
20f/
2m
18f/
2m
9f/
0m
32f/
4m
27f/
3m
26f/
1m
Teachers
4f/
0m
2f/
1m
3f/
1m
4f/
0m
2f/
1m
2f/
1m
4f/
0m
2f/
0m
4f/
1m
3f/
1m
3f/
1m
*All-girls school **All-boys school

6
Procedure
There are a number of established measures that have been designed to assess student test anxiety (See:
Lowe, Grumbein, & Raad, 2011; Lowe et al., 2008; Sarason, Davidson, Lighthall, & Waite, 1958; Wren &
Benson, 2004). However, these measures could not be used to directly compare responses across different
stakeholders, or were sufficiently brief enough to minimise inconvenience upon participating schools. We
therefore devised a new simple brief measure of emotional distress in order to achieve our purposes. This
measure assessed emotional distress by asking the participant to rate their experience of six adjectives listed in
the following order: Happy, worried, calm, sad, confident, and afraid; on a 4-point scale (not at all, a little bit,
quite a bit, a lot). The response scale for students had accompanying basic cartoon faces to increase engagement
and clarity. For a copy of the survey instrument please contact the first author.
Prior to commencement of the study, a lengthy pre-testing process was conducted trialling different
versions of the measure with university students, parents, children, and teachers in order to finalise the specific
adjectives and response scale used. We examined the validity of this final measure by administering our brief
measure to 126 first year university students from Edith Cowan University, (33% 18-25 years, 16% 26-30 years,
51% over 30 years old; 84% female) in addition to a well-established measure – The 21-item version of the
Depression Anxiety Stress Scales (DASS-21) (Lovibond & Lovibond, 1995). The DASS-21 is a commonly used
measure of psychological distress with adults containing three 7-item subscales (depression, anxiety, and stress)
that is often summed to provide an overall distress score. When providing responses for both measures the
students reflected on their life during the month prior to the start of the university semester. The reliability and
validity of the DASS-21 has been well established (Crawford, Cayley, Lovibond, Wilson, & Hartley, 2011;
Crawford & Henry, 2003). We therefore wished to compare our new brief scale of emotional distress with the
well-established DASS-21. Inter-correlations and scale reliability coefficients are presented in Table 2. Our brief
emotional distress scale achieved good internal consistency (α = .84), and good convergent validity with the
overall DASS-21 (r = .78, p < .01). We acknowledge, however, that this validation of the final measure is
limited, in that it was not performed on primary school-aged children.
Table 2. Inter-correlations between DASS-21 and the new brief emotional distress scale designed for this
particular study. Cronbach’s alpha values are also included. Acock (2014, p. 368) provides guidelines that
Cronbach’s alpha above .70 is ‘adequate’, and above .80 is ‘good’.
Brief
distress
measure
DASS-21
Overall
DASS-21
Depression
DASS-21
Anxiety
DASS-21
Stress
Cronbach’s
alpha
Brief distress
measure
1 .84
DASS-21
Overall
.78* 1 .94
DASS-21
Depression
.79* .90* 1 .91
DASS-21
Anxiety
.63* .89* .69* 1 .87
DASS-21
Stress
.66* .91* .73* .72* 1 .86
*p < .01
Students with parental consent were surveyed during normal classroom time within a 3-week period
after NAPLAN testing. Members of our research team visited each school at an organised time, and

7
administered paper surveys to students by reading each statement aloud in an orderly fashion. Any student
misunderstandings that arose were dealt with immediately before progressing further with the survey. Students
filled out our brief well-being measure three times. Students completed the scale when asked “When doing
NAPLAN maths testing I felt”, then “When doing NAPLAN reading testing I felt…”, and finally “Since the
NAPLAN testing week I have felt”. Additionally students were asked an open-ended question by providing a
large box on the page with the instruction “In the box below please write or draw anything you think about
NAPLAN”.
Consenting parents and teachers could elect to fill out a paper (with reply paid envelope), be telephoned, or
complete an online version of the survey at their convenience after NAPLAN testing. Responses were collected
over a 6 week period after NAPLAN testing finished. Adult participants completed the brief emotional distress
scale twice, asked “During the time my child/students participated in NAPLAN testing this year I felt”, and
“Since the NAPLAN testing week I have felt”. In Table 3 we provide the Cronbach’s alpha statistics for the
measure as it was used in our study to provide evidence to support adequate reliability of the measure in the
school context. Additionally, adult participants were asked “Do you believe that the pressure to do well on
NAPLAN tests has a negative impact upon the well-being of: (students, parents, and teachers).” Participants
rated their belief for each judgement on a 6-point scale (not at all, slightly, somewhat, moderately, very much,
extremely).
Table 3. Cronbach’s alpha values for the brief emotional distress scale used in the present study. Acock (2014,
p. 368) provides guidelines that Cronbach’s alpha above .70 is ‘adequate’, and above .80 is ‘good’.
During NAPLAN
(maths)
During NAPLAN
(reading)
During NAPLAN
(overall)
After NAPLAN
Year 3 students .83 .85 .891 .77
Year 5 students .83 .87 .891 .82
Teachers N/A N/A .77 .77
Parents N/A N/A .84 .82
1The overall statistic for students is a combination of all 12 items for maths and reading. All other values are
calculated from the 6 item emotional distress scale.
Results
Self-reported student, parent, and teacher emotional distress during and after NAPLAN
Students reported more distress during NAPLAN maths (M = 1.87, SD = .62), compared to NAPLAN
reading (M = 1.77, SD = .67), however this effect was very small, t(464) = 3.91, p < .01, r2 = .03, and therefore
for further analysis student reading and maths distress was averaged to produce a single measure. Furthermore, a
moderate positive correlation was found between maths and reading distress (r = .63, p < .01).
Of primary interest was the difference between emotional distress during and after NAPLAN across
different stakeholders, see Table 4. First, we checked if there was any large variation amongst schools for self-
reported distress during NAPLAN by conducting a series of one-way ANOVAs that revealed no significant
effect of school for year 3 students, year 5 students, parents, or teachers (all Fs ≤ 1.27, ps > .05). Considering
the fairly homogenous nature of our sample (i.e., relatively wealthy independent schools all willing to take part
in a study focused on NAPLAN testing) the consistency across schools was not surprising. To examine
emotional distress during and after NAPLAN across different stakeholders a 4x2 mixed design factorial

8
ANOVA was conducted treating group (year 3 students, year 5 students, parents, and teachers) as a between-
participants factor and time (during, and after) as a within-participants factor. Both the main effect of group
(F(3, 847) = 5.54, p < .05, ηp2 = .02) and time (F(1, 847) = 164.13, p < .05, ηp
2 = .02) were found to be
statistically significant, in addition to the interaction between group and time (F(3, 847) = 11.80, p < . 05, ηp2 =
.04). To further understand the overall interaction effect, we conducted follow-up Bonferroni adjusted t-tests
selectively based on questions of most interest. Following Field’s (2009) instructions we applied the Bonferroni
adjustment to the accepted p-value for statistical significance by dividing by the number of comparisons carried
out (.05/10 = .005). This post-hoc procedure is a conservative approach that reduces family-wise error.
As expected, compared to non-testing time, distress was found to be significantly higher during
NAPLAN for all stakeholders: Year 3 students (t(195) = 6.90, p < .005, r2 = .20), Year 5 students (t(268) =
13.26, p < .005, r2 = .40), parents (t(345) = 7.30, p < .005, r2 = .13), and teachers (t(39) = 4.08, p < .005, r2 =
.30). Follow up comparisons across all stakeholder groups for emotional distress during NAPLAN only revealed
that Year 3 students reported a lower level of distress compared with Year 5s (t(463) = 4.41, p < .005, r2 = .04)
and teachers (t(234) = 3.14, p < .005, r2 = .04), with the other comparisons failing to reach significance. Note
that although there are significant differences between groups, effect sizes are very small indicating that despite
some slight differences, emotional distress during NAPLAN was fairly similar across the stakeholder groups.
An important finding was that despite increased distress during NAPLAN testing, no mean value for
any of the stakeholder groups was higher than “a little bit” on our brief emotional distress scale. Furthermore,
the percentage of participants across all stakeholder groups that scored in the “quite a bit” to “a lot” range was
small, both during and after NAPLAN, see Table 4. When compensating for typical distress levels as indicated
by ‘after NAPLAN’ responses, results suggest NAPLAN produced a severe negative reaction in approximately
3% of students, parents, and teachers in our sample. Although this remains concerning for those 3%, the results
show that in the present sample, 97% did not report a severe negative reaction to NAPLAN. The results
therefore confirmed that NAPLAN elevates distress. The level of distress reported during NAPLAN by the
present sample, however, did not appear to be severe for many of the respondents. In fact, levels of distress
appeared less than what one might reasonably expect to be associated with a high stakes testing experience.
In addition to quantifying distress levels, we were interested in exploring if parent and teacher distress
were associated with distress reported by students. A significant correlation was found between parent and
student self-reported emotional distress during NAPLAN, although the association was small (r = .18, p < .01, n
= 297). This relationship remained nearly identical when splitting by year group (Year 3 r = .19 & Year 5 r =
.20). Each teacher was allocated a ‘classroom distress’ score by averaging across student emotional distress
during NAPLAN scores for each teacher. No relationship was observed between classroom distress scores and
teacher self-reported emotional distress during testing (r = .06, p = .72, n = 38).

9
Table 4. Mean emotional distress for different stakeholder groups during and after NAPLAN, with percentage
of responses falling within different score brackets for the measure. By subtracting ‘after NAPLAN’ from
‘during NAPLAN’ responses data suggests NAPLAN severely impacts only 3% of individuals across all
surveyed stakeholder groups
Mean (SD) Not at all – A little bit
(1 – 2)
A little bit – Quite a bit
(>2 – 3)
Quite a bit – A lot
(>3 – 4)
Year 3 students (N = 196) During NAPLAN 1.69 (.55) 77% 20% 3% After NAPLAN 1.44 (.48) 91% 8% 1% Year 5 students (N = 269) During NAPLAN 1.92 (.58) 67% 28% 5% After NAPLAN 1.51 (.54) 88% 10% 2% Parents (N = 346) During NAPLAN 1.80 (.58) 74% 22% 4% After NAPLAN 1.62 (.51) 84% 15% 1% Teachers (N = 40) During NAPLAN 1.98 (.46) 65% 32% 3% After NAPLAN 1.62 (.46) 87% 13% 0%
Student open-ended responses
As part of our survey, students were asked to write or draw in an open-ended fashion their feelings
towards NAPLAN. An open-ended response was provided by 82% of the student sample. Some example student
responses are presented in Figure 1.
a) b) c)
Fig. 1 Examples of a) positive, b) neutral, and c) negative open ended responses from year 3 students
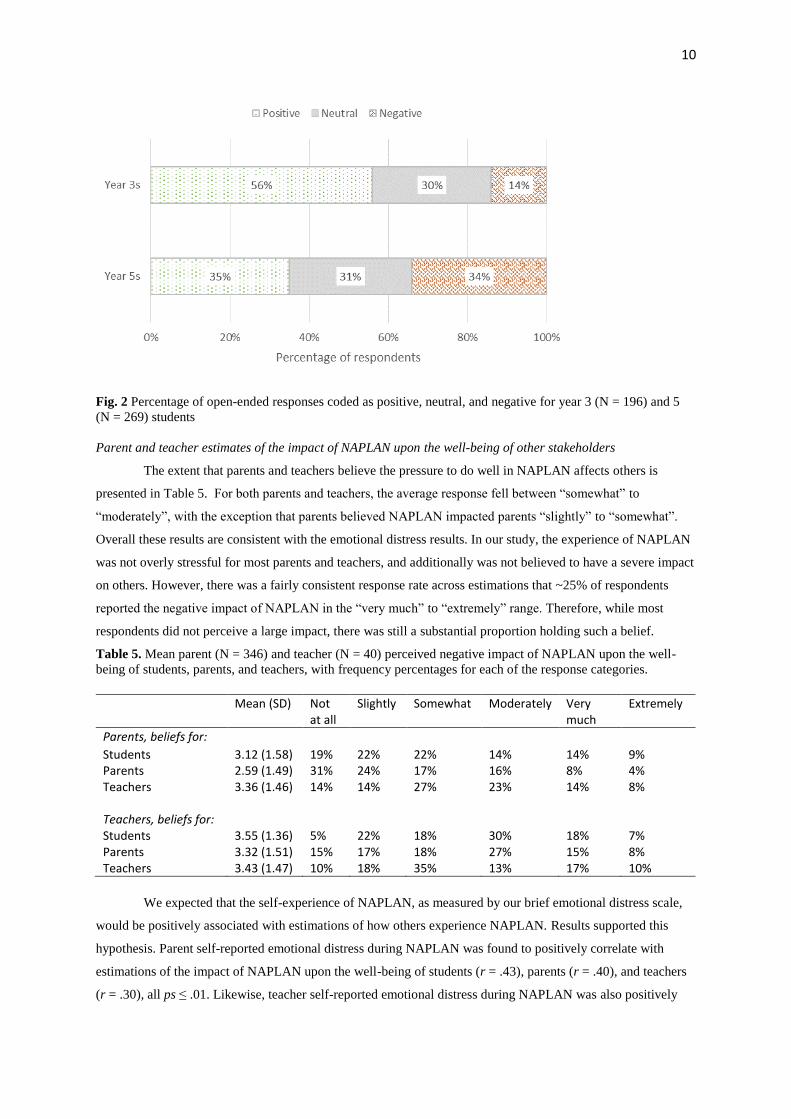
Student open-ended responses were coded as positive, neutral, or negative by the first author and a
research assistant. Inter-rater agreement was high (Cohen’s Kappa = .84). Any disagreements were discussed
and resolved to produce the percentages presented in Figure 2. A significant difference was found between the
Year 3 and Year 5 pattern of responses (χ2(2) = 24.61, p < .01, Cramer’s V = .25). A higher proportion of Year 3
students produced positive responses compared to Year 5s. The majority of Year 3 responses were positive, and
Year 5 student responses were fairly evenly distributed across positive, neutral, and negative categories.
Consistent with our emotional distress findings, student responses to the open-ended question did not reveal any
prevailing negativity towards NAPLAN testing. This consistency affords greater confidence in our findings
obtained with the brief emotional distress measure reported earlier.
10
Fig. 2 Percentage of open-ended responses coded as positive, neutral, and negative for year 3 (N = 196) and 5
(N = 269) students
Parent and teacher estimates of the impact of NAPLAN upon the well-being of other stakeholders
The extent that parents and teachers believe the pressure to do well in NAPLAN affects others is
presented in Table 5. For both parents and teachers, the average response fell between “somewhat” to
“moderately”, with the exception that parents believed NAPLAN impacted parents “slightly” to “somewhat”.
Overall these results are consistent with the emotional distress results. In our study, the experience of NAPLAN
was not overly stressful for most parents and teachers, and additionally was not believed to have a severe impact
on others. However, there was a fairly consistent response rate across estimations that ~25% of respondents
reported the negative impact of NAPLAN in the “very much” to “extremely” range. Therefore, while most
respondents did not perceive a large impact, there was still a substantial proportion holding such a belief.
Table 5. Mean parent (N = 346) and teacher (N = 40) perceived negative impact of NAPLAN upon the well-
being of students, parents, and teachers, with frequency percentages for each of the response categories.
Mean (SD) Not at all
Slightly Somewhat Moderately Very much
Extremely
Parents, beliefs for: Students 3.12 (1.58) 19% 22% 22% 14% 14% 9% Parents 2.59 (1.49) 31% 24% 17% 16% 8% 4% Teachers 3.36 (1.46) 14% 14% 27% 23% 14% 8% Teachers, beliefs for: Students 3.55 (1.36) 5% 22% 18% 30% 18% 7% Parents 3.32 (1.51) 15% 17% 18% 27% 15% 8% Teachers 3.43 (1.47) 10% 18% 35% 13% 17% 10%
We expected that the self-experience of NAPLAN, as measured by our brief emotional distress scale,
would be positively associated with estimations of how others experience NAPLAN. Results supported this
hypothesis. Parent self-reported emotional distress during NAPLAN was found to positively correlate with
estimations of the impact of NAPLAN upon the well-being of students (r = .43), parents (r = .40), and teachers
(r = .30), all ps ≤ .01. Likewise, teacher self-reported emotional distress during NAPLAN was also positively

11
correlated with their estimations of the impact of NAPLAN upon the well-being of students (r = .50), parents (r
= .34), and teachers (r = .53), all ps ≤ .01. Therefore results suggest that a teacher or parent experiencing higher
levels of distress during NAPLAN typically assumes NAPLAN causes more distress in others.
Discussion
The present research examined student, parent, and teacher self-reported emotional distress during and
after NAPLAN in a sample of 11 independent schools in Western Australia. Across students, parents, and
teachers, we found an increase in distress levels during NAPLAN compared with after the testing, however the
average level of distress during testing did not exceed “a little bit” for all groups on our self-report distress
measure. It is also important to recognise that our data suggests NAPLAN produces a severe negative reaction
(i.e., “quite a bit” to “a lot” of distress) in approximately 3% of the sampled students, parents, and teachers, after
accounting for some individuals having pre-existing levels of high distress. We caution that the sample of
schools were atypical of the general sector, and furthermore may be atypical of the independent schools sector
due to potential response bias effects (the survey may have been completed by participants who were not
affected negatively by the NAPLAN testing experience). These limitations suggest that the percentage of
students, parents and teachers reporting distress may be higher, and it is important that further studies be
undertaken to estimate the prevalence in the Australian population. It is important that the percentage of those
who report high distress be managed, and that schools enact strategies to minimise any severe reaction to the
testing. There is an opportunity for schools to monitor reactions of students during NAPLAN for early
identification and intervention with test anxiety problems.
Overwhelming negativity in student drawings or statements was not observed in open-ended responses
from students. Year 3 students provided a higher proportion of positive responses, and Year 5 students were
evenly split across negative, neutral, and positive responses. Year 5 students also reported more distress during
the testing compared to Year 3 students. This finding is inconsistent with beliefs reported in a survey of primary
school principals that Year 3 students are more impacted by the testing than older children (APPA, 2013), and
this inconsistency in our own findings may be an artefact of negative publicity in West Australia surrounding
NAPLAN and MySchool when the Year 5 children were younger. We thank one of our anonymous reviewers
for this suggestion, as this may be evidence for an earlier negative public attitude toward NAPLAN, especially
in West Australia. It is beyond the scope of our present study to determine the precise reasons behind why the
year 5s reported a more negative experience of NAPLAN compared to the year 3s. Perhaps it is simply a result
of being in the school system for longer and developing a more nuanced appreciation of what testing means for
the student. This is however only speculation and understanding the longitudinal relationship between a child
and repeated testing like NAPLAN is an avenue for future research.
In our review of the literature we noted that a lack of research studies investigating the effect of
NAPLAN on stakeholders currently limits arguments about NAPLAN’s impact. Prior studies consist of
educator impressions regarding the impact upon students (APPA, 2013; Dulfer et al., 2012; Thompson, 2013),
and two qualitative investigations of actual student experiences (Howell, 2012; Wyn et al., 2014).
Our findings add to the existing literature by providing a more direct assessment of the level and extent
of emotional distress during testing compared with what has previously been examined, across all stakeholders.
Interpretation of our findings are, however, limited to the context of our sample which comprised of
independent schools with above average socio-educational advantage (ICSEA) scores. Principals of these

12
schools all reported that enrichment of socio-emotional well-being was a school priority, and citation of specific
well-being programs to achieve this aim was common. NAPLAN was largely considered just another test within
a battery of school assessments that does not hold any special consequences for the students, teachers, or school
as a whole. It may be that this ‘principal’ effect which prioritises student social-emotional well-being is
something that is important for the whole sector, and / or it may be that the data reported here are limited in
terms of socio-economic status. There is some evidence to support the latter interpretation, because a survey of
West and South Australian teachers (Thompson & Harbaugh, 2013) suggested that the (negative) impact of
NAPLAN upon pedagogy may be more prevalent in state schools and schools situated in lower socio-economic
status (SES) areas. More research is required to ascertain whether our findings can be replicated in government
schools, and whether the ‘principal’ effect generalises to that sector. It may also be the case that greater
importance is placed upon NAPLAN achievement by principals, and this may produce a different school climate
during testing, and therefore different impact of the testing upon students.
On the other hand, research has reported that Australian children from higher SES backgrounds may
have greater expectations placed upon them for academic success by their parents (Dandy & Nettelbeck, 2002).
Therefore it could be reasoned that more pressure to perform in higher SES contexts may place some students at
greater risk for experiencing distress during testing. Despite these potential directions for the literature, the
present study is the first time as far as we are aware that the level and extent of distress associated with
NAPLAN has actually been measured, and the disparity between our results and those found in the extant
literature is quite marked.
A methodological limitation of our research was how participants were asked to retrospectively think
back upon their NAPLAN experience some time after the testing (it varied from 1-3 weeks after testing). We
concede that relying upon the memory of the experience instead of asking at the time of testing introduces a
level of inaccuracy into our data. Furthermore, by asking participants to reflect upon their memory of their
emotional experience during testing, and then subsequently asking about their emotional experience since the
testing, may have led participants to contrast the two situations that could act to potentially amplify differences.
For example, a participant may believe that they should have been feeling more distressed during NAPLAN
compared to afterwards, and answered in a way consistent with that belief. For the present research, we took a
cautious approach, as we were concerned about surveying students during the testing time as we did not want to
risk elevating their distress levels. Additionally, we did not wish to impose upon the schools during a time (i.e.,
during NAPLAN) they were already experiencing a disruption to their usual routines. All of these issues need to
be taken under consideration for future studies that aim to measure distress associated with testing.
A further limitation is the convergent validation of the scale using university students and a measure of
anxiety. It will be important to further validate the scale with a child-oriented measure of anxiety and distress in
the future. We argue, however, that the results reported in this present paper attest to the discriminant validity
of the scale.
In our sample, no relationship was found between teacher distress during NAPLAN, and the distress of
children from their class. A small significant relationship (r = .18) was found between parent distress and child
distress during NAPLAN. It is beyond the scope of our study to determine if this relationship is more indicative
of students responding to parent distress, or parents responding to distress of their child. The overall low levels
of distress observed in our study may be masking a stronger association, and future research is required to

13
investigate the interplay between parent and child emotional response during periods of evaluation for the child.
We found stronger positive (moderate) relationships between parent and teacher emotional distress during
testing with their perceptions regarding how much NAPLAN was negatively impacting the well-being of others.
Our findings indicate that parents and teachers reporting more distress during testing tended to also perceive
more distress in others. This is consistent with a long-standing psychological principle known as the false
consensus effect that refers to a tendency to over-estimate the extent that others share our attitudes, beliefs, and
emotional experiences (Ross, Greene, & House, 1977; Van Boven & Loewenstein, 2003). A similar finding to
our own is that parents with a more negative attitude towards NAPLAN have been reported to report more
distress experienced by their child (Newspoll, 2013).
NAPLAN testing as a high stakes national testing program has had many harsh critics. One major
criticism has been to question the impact NAPLAN has upon stakeholder well-being. Our research provides
evidence to demonstrate that NAPLAN does not have any major impact upon well-being for the majority of
stakeholders in certain contexts. More evidence is required to fully understand the experience of NAPLAN
across states and territories, urban and rural, and low/high SES contexts.
14
References
ACARA. (2015). Measurement Framework for Schooling in Australia 2015. Retrieved from Acock, A. C. (2014). A Gentle Introduction to Stata (4th ed.). Texas, U.S.A.: Stata Press. APPA. (2013). Primary Principals: Perspectives on NAPLAN testing and assessment. Retrieved from
Report conducted by CANVASS strategic opinion research: Au, W. (2011). Teaching under the new Taylorism: high-stakes testing and the standardization of the
21st century curriculum. Journal of Currculum Studies, 43(1), 25-45. Belcastro, L., & Boon, H. (2012). Student motivation for NAPLAN tests. Australian and International
Journal of Rural Education, 22(2), 1. Berliner, D. (2011). Rational responses to high stakes testing: the case of curriculum narrowing and
the harm that follows. Cambridge Journal of Education, 41(3), 287-302. Bousfield, K., & Ragusa, A. T. (2014). A sociological analysis of Australia's NAPLAN and My School
senate inquiry submissions: the adultification of childhood? Critical Studies in Education, 55(2), 170-185.
Brockmeier, L. L., Green, R. B., Pate, J. L., Tsemunhu, R., & Bockenko, M. J. (2014). Teachers' beliefs about the effects of high stakes testing. Journal of Education and Human Development, 3(4), 91-104.
Cassady, J. C., & Johnson, R. E. (2002). Cognitive test anxiety and academic performance. Contemporary Educational Psychology, 27(2), 270-295.
Crawford, J. R., Cayley, C., Lovibond, P. F., Wilson, P. H., & Hartley, C. (2011). Percentile norms and accompanying interval estimates from an Australian general adult population sample for self-report mood scales (BAI, BDI, CRSD, CES-D, DASS, DASS-21, STAI-X, STAI-Y, SRDS, and SRAS). Australian Psychologist, 46, 3-14.
Crawford, J. R., & Henry, J. D. (2003). The Depression Anxiety Stress Scales: Normative data and latent structure in a larger non-clinical sample. British Journal of Clinical Psychology, 42(111-131).
Dandy, J., & Nettelbeck, T. (2002). A cross-cultural study of parents' academic standards and educational aspirations for their children. Educational Psychology, 22(5), 621-627.
Dulfer, N., Polesel, J., & Rice, S. (2012). The experience of education: The impacts of high stakes testing on school students and their families: An educator's perspective. Retrieved from
Hardy, I. (2015). A logic of enumeration: the nature and effects of national literacy and numeracy testing in Australia. Journal of Education Policy, 30(3), 335-362.
Harris, P., Chinnappan, M., Castleton, G., Carter, J., De Courcey, M., & Barnett, J. (2013). Impact and consequence of Australia's national assessment program - literacy and numeracy (NAPLAN) - using research evidence to inform improvement. TESOL in context, 23(1/2), 30-52.
Herman, J. L., & Golan, S. (1993). The effects of standardized testing on teaching and schools. Educational Measurement: Issues and Practice, 12(4), 20-25.
Howell, A. (2012). The silent voice in the NAPLAN debate: exploring children's lived experiences of the tests. Paper presented at the Joint AARE APERA International Conference, Sydney.
IEUA. (2010). A response from the Indepenent Education Union of Australia to the Senate Standing References Committee on Education, Employment and Workplace Relations: Inquiry into the administration and reporting of NAPLAN testing. Retrieved from
Klenowski, V., & Wyatt-Smith, C. (2012). The impact of high stakes testing: The Australian story. Assessment in education: Principles, policy & practice, 19(1), 65-79.
Lovibond, S. H., & Lovibond, P. F. (1995). Manual for the depression anxiety stress scales. Sydney: Psychology Foundation Monograph.
Lowe, P. A., Grumbein, M. J., & Raad, J. M. (2011). Examination of the psychometric properties of the test anxiety scale for elementary students (TAS-E) scores. Journal of Psychoeducational Assessment, 29(6), 503-514.
Lowe, P. A., Lee, S. W., Witteborg, K. M., Prichard, K. W., Luhr, M. E., Cullinan, C. M., . . . Janik, M. (2008). The test anxiety inventory for children and adolescents (TAICA): Examination of the

15
psychometric properties of a new multidimensional measure of test anxiety among elementary and secondary school students. Journal of Psychoeducational Assessment, 26(3), 215-230.
Newspoll. (2013). The experience of education: The impacts of high stakes testing on school students and their families. Parental attitudes and perceptions concerning NAPLAN.
O'Keefe, D. (2011). NAPLAN nightmares. Education Review. Polesel, J., Dulfer, N., & Turnbull, M. (2012). The experience of education: The impacts of high stakes
testing on school students and their families: Literature review. Retrieved from Polesel, J., Rice, S., & Dulfer, N. (2014). The impact of high-stakes testing on curriculum and
pedagogy: a teacher perspective from Australia. Journal of Education Policy, 29(5), 640-657. Ragusa, A. T., & Bousfield, K. (2015). 'It's not the test, it's how it's used!' Critical analysis of public
response to NAPLAN and MySchool Senate Inquiry. British Journal of Sociology of Education, 1-22.
Ross, L., Greene, D., & House, P. (1977). The "false consensus effect": An egocentric bias in social perception and attribution processes. Journal of Experimental Social Psychology, 13(3), 279-301.
Salehi, B., Cordero, M. I., & Sandi, C. (2010). Learning under stress: The inverted-U-shape function revisted. Learning and Memory, 17(10), 522-530.
Sarason, S. B., Davidson, K., Lighthall, F., & Waite, R. (1958). A test anxiety scale for children. Child Development, 29(1), 105-113.
Segool, N. K., Carlson, J. S., Goforth, A. N., Von Der Embse, N., & Barterian, J. A. (2013). Heightened test anxiety among young children: elementary school students' anxious responses to high-stakes testing. Psychology in the Schools, 50(5), 489-499.
Thompson, G. (2013). NAPLAN, MySchool and accountability: Teacher perceptions of the effects of testing. The International Education Journal: Comparative Perspectives, 12(2), 62-84.
Thompson, G., & Cook, I. (2014). Manipulating the data: teaching and NAPLAN in the control society. Discourse: Studies in the Cultural Policies of Education, 35(1), 129-142.
Thompson, G., & Harbaugh, A. G. (2013). A preliminary analysis of teacher perceptions of the effects of NAPLAN on pedagogy and curriculum. The Australian Educational Researcher, 40, 299-314.
Van Boven, L., & Loewenstein, G. (2003). Social projection of transient drive states. Personality and Social Psychology Bulletin, 29(9), 1159-1168.
Ward, D. M. (2012). The effects of standardised assessment (NAPLAN) on teacher pedagogy at two Queensland schools. (Doctor of Philosophy), Queendland University of Technology.
Wren, D. G., & Benson, J. (2004). Measuring test anxiety in children: Scale development and internal construct validation. Anxiety, Stress, & Coping: An International Journal, 17(3), 227-240.
Wyn, J., Turnbull, M., & Grimshaw, L. (2014). The experience of education: the impacts of high stakes testing on school students and their families. A qualitative study. Retrieved from Sydney, NSW:
Yerkes, R. M., & Dodson, J. D. (1908). The relation of strength of stimulus to rapidity of habit-formation. Journal of Comparative Neurology and Psychology, 18, 459-482.