investigating the effect of ethanol on wnt7a and its
TRANSCRIPT

University of Central Florida University of Central Florida
STARS STARS
Honors Undergraduate Theses UCF Theses and Dissertations
2020
Investigating the Effect of Ethanol on Wnt7a and its Potential Investigating the Effect of Ethanol on Wnt7a and its Potential
Implications in Fetal Alcohol Spectrum Disorder Implications in Fetal Alcohol Spectrum Disorder
Erika Lytle University of Central Florida
Part of the Genetics and Genomics Commons
Find similar works at: https://stars.library.ucf.edu/honorstheses
University of Central Florida Libraries http://library.ucf.edu
This Open Access is brought to you for free and open access by the UCF Theses and Dissertations at STARS. It has
been accepted for inclusion in Honors Undergraduate Theses by an authorized administrator of STARS. For more
information, please contact [email protected].
Recommended Citation Recommended Citation Lytle, Erika, "Investigating the Effect of Ethanol on Wnt7a and its Potential Implications in Fetal Alcohol Spectrum Disorder" (2020). Honors Undergraduate Theses. 730. https://stars.library.ucf.edu/honorstheses/730

i
INVESTIGATING THE EFFECT OF ETHANOL ON WNT7A AND ITS
POTENTIAL IMPLICATIONS IN FETAL ALCOHOL SPECTRUM DISORDER
by
ERIKA LYTLE
A thesis submitted in fulfillment of the requirements for the Honors in the Major Program in Biomedical Sciences
in the Burnett School of Biomedical Sciences and in the Burnett Honors College at the University of Central Florida
Orlando, Florida
Spring Term, 2020
Thesis Chair: Steven Ebert, PhD

ii
ABSTRACT
Fetal Alcohol Spectrum Disorders (FASDs), are caused by maternal alcohol consumption
during pregnancy [3]. FASD encompasses a wide variety of cardiac and neural anomalies, while
also associated with improper limb development, abnormal craniofacial features, problems
within the central nervous system (CNS), and disabilities in learning and communication. Gene-
regulating FASDs have not been well studied during the crucial phases of early embryonic
development. Genes within the Wnt/Beta-catenin pathway control a vast amount of embryonic
developmental processes. Among them is the Wnt7a gene, a significant downstream gene
regulator which positively controls neural stem cell proliferation and cardiomyocyte
differentiation on a large scale during early embryonic development. This project will serve to
provide potential insight into the genes involved in FASD. We hypothesize that ethanol
administration to early embryonic mice will suppress Wnt7a expression in the heart and brain,
leading to FASD development. RNA-sequencing (RNA-Seq) and real-time quantitative PCR
(qPCR) were used to measure Wnt7a gene expression within the early embryonic mouse heart
and brain. After evaluation of RNA-Seq data and a comparative analysis using the 2-ΔΔCT
method, it is evident Wnt7a is present in embryonic mouse age E10.5 heart and brain samples,
and Wnt7a is suppressed at age E10.5 in embryonic mouse heart, but not brain, when induced
with ethanol.

iii
TABLE OF CONTENTS
LIST OF FIGURES ....................................................................................................................... v
LIST OF TABLES ........................................................................................................................ vi
LIST OF ABBREVIATIONS .................................................................................................... vii
BACKGROUND ............................................................................................................................ 1
Fetal Alcohol Spectrum Disorder ..................................................................................... 1
Clinical Diagnosis of FASD .................................................................................... 2
Effects of FASD on the Embryonic Heart ................................................................ 3
Wnt7a .................................................................................................................................. 3
Wnt7a in the Embryonic Brain ................................................................................ 5
Wnt7a in the Embryonic Heart ................................................................................ 6
Effects of Ethanol on Wnt7a .................................................................................... 7
Significance ........................................................................................................................ 8
METHODS ................................................................................................................................... 10
Ethanol Administration to Wild-Type C57/BL6J Mice ............................................... 10
Testing for Wnt7a Presence in Early Embryonic Heart and Brain ........................... 10
Determining Wnt7a Suppression in Early Embryonic Mouse Heart and Brain Post-Ethanol Administration .................................................................................................. 11
RESULTS ..................................................................................................................................... 14
A Review of Preliminary Studies ................................................................................... 14
Wnt7a Presence in Early Embryonic Heart and Brain ............................................... 16
Determining Wnt7a Suppression ................................................................................... 17
Wnt7a in the Embryonic Heart .............................................................................. 18
Wnt7a in the Embryonic Brain .............................................................................. 20

iv
DISCUSSION ............................................................................................................................... 23
APPENDIX A WNT7A CT VALUES AND EXPRESSION FOLD CHANGE IN HEART AND BRAIN E10.5 SAMPLES .................................................................................................. 25
WORKS CITED .......................................................................................................................... 28

v
LIST OF FIGURES Figure 1: An overview of Wnt signaling pathway activation. ......................................................... 5 Figure 2: Experimental protocol for control vs. ethanol administration in wild-type C57/BL6J mice [32]. ....................................................................................................................................... 10 Figure 3: Diagram of experimental method. ................................................................................. 13 Figure 4: RNA-Seq analysis of gene expression in E10.5 mouse hearts, control vs. ethanol treated at E9.5 [32]. ....................................................................................................................... 15 Figure 5: 2% agarose gel highlighting Wnt7a gene in control E10.5 embryonic mouse heart samples at proper band size 307 bp [35]. ...................................................................................... 17 Figure 6: CT Values for Beta-actin and GAPDH of embryonic heart samples age E10.5, where error bars represent standard deviation from the mean.. ............................................................... 19 Figure 7: Expression fold change (2-ΔΔCT) for control and ethanol-treated samples with Wnt7a and housekeeping gene, Beta-actin, in embryonic mouse heart age E10.5, where error bars represent standard deviation from the mean. ................................................................................. 20 Figure 8: CT Values for Beta-actin and GAPDH of embryonic brain samples age E10.5, where error bars represent standard deviation from the mean.. ............................................................... 21 Figure 9: Expression fold change (2-ΔΔCT) for control and ethanol-treated samples with Wnt7a and housekeeping gene, Beta-actin, in embryonic mouse brain age E10.5, where error bars represent standard deviation from the mean. ................................................................................. 22

vi
LIST OF TABLES Table 1: RNA-Seq data collection from Preliminary Studies. ...................................................... 16 Table 2: CT Values for Beta-actin and GAPDH of embryonic heart samples age E10.5. ............ 26 Table 3: CT Values for Beta-actin and GAPDH of embryonic brain samples age E10.5. ............ 27

vii
LIST OF ABBREVIATIONS EtOH- Ethanol
FASD- Fetal Alcohol Spectrum Disorder
FAS- Fetal Alcohol Syndrome
ARND- Alcohol-Related Neurodevelopmental Disorder
ARBD- Alcohol-Related Birth Defects
CNS- Central Nervous System
CHDs- Congenital Heart Defects
TOF- Tetralogy of Fallot
PKC- Protein Kinase C
E3.5- Embryonic Day 3.5
E5- Embryonic Day 5
ADH- Alcohol Dehydrogenase
ALDH- Aldehyde Dehydrogenase
E9.5- Embryonic Day 9.5
E10.5- Embryonic Day 10.5
E11.5- Embryonic Day 11.5
E12.5- Embryonic Day 12.5
RT-PCR- Reverse-Transcription Polymerase Chain Reaction
qPCR- Real-Time Quantitative Polymerase Chain Reaction
cDNA- Complimentary DNA
RNA-Seq- Genomic RNA-Sequence

viii
bp- Base Pair (size)
GAPDH- Glyceraldehyde 3-phosphate dehydrogenase
E15- Embryonic Day 15
IQR- Interquartile Range

1
BACKGROUND Fetal Alcohol Spectrum Disorder
Maternal consumption of ethanol (EtOH) during pregnancy has been found detrimental to
proper fetus development on a systemic scale [1]. Typical teratogenic effects due to alcohol
consumption have been implicated in the medical diagnosis Fetal Alcohol Spectrum Disorder
(FASD), a term adopted to describe a wide range of effects due to fetal alcohol-related incidences
that occur due to maternal consumption of alcohol during pregnancy [2]. FASD presents itself
with a variety of symptoms and systemic defects, including abnormal facial features, thin upper
lip, microcephaly, learning disabilities, vision or hearing problems, and improper limb, kidney,
and heart development [1, 2]. With further understanding of FASDs, scientists and medical
professionals have agreed that the act of binge drinking (consuming 3-5 drinks or more in one
occasion) has shown to be most detrimental to fetal development, where one drink is considered
one 12 oz. beer, one 5 oz. glass of wine, or one 1.5 oz. shot of distilled spirits [3, 4]. In recent
studies, it has been recognized that FASDs are the leading cause of preventable developmental
disabilities in the world, where it has also been found that the prevalence of FASDs in the United
States is much higher than previously believed [3]. Although it is difficult to determine the exact
number of children born with FASD, researchers have estimated that approximately 40,000
babies may be born with FASD in the United States each year [5]. A recent study by Philip et al.
created current estimates of FASD based on large, diverse United States population samples
which showed estimated prevalence of FASD ranged from 1.1% to 5.0%, or 1 to 5 per 100
school children [6].

2
Clinical Diagnosis of FASD
The adverse effects of alcohol on a fetus present a spectrum of abnormalities ranging
from behavioral and neurocognitive disabilities, to physical abnormalities of the limbs,
craniofacial region, heart, and kidneys, symptoms that when in conjunction, can be most
accurately termed Fetal Alcohol Spectrum Disorder (FASD) [1, 2, 7]. To aid in diagnosis and
treatment, medical professionals have further differentiated FASD into three separate diagnoses,
each with a more specific evaluation of symptoms, allowing medical practitioners a better
understanding and development of treatment plan for patients affected by FASD. The three
distinct diagnoses of FASD include Fetal Alcohol Syndrome (FAS), Alcohol-Related
Neurodevelopmental Disorder (ARND), and Alcohol-Related Birth Defects (ARBD) [8]. It has
been established that children at the severe end of the spectrum (meaning the child exhibits the
complete phenotype) are defined to have Fetal Alcohol Syndrome (FAS) [7, 8]. FAS presents
with abnormal craniofacial features, growth problems, central nervous system (CNS) problems,
and potential inadequacy in learning, communication, vision, and hearing problems, with the
most extreme outcome of FAS being fetal death. In the lesser extreme cases of FASD are
ARND, which presents most commonly with intellectual, behavioral, and learning disabilities,
and ARBD, which mostly comprises of physical abnormalities or problems within the heart,
kidneys, bones, and potentially hearing [8]. With medical professionals having a clearer
understanding of the distinct forms of FASD, it is easier to diagnose and create a treatment plan,
however, there is no cure for fetal alcohol-related abnormalities as they are present during the
developmental stages of embryonic life, where these effects cannot be reversed and the fetus thus
suffers lifetime consequences [2, 8].

3
Effects of FASD on the Embryonic Heart
FASD presents itself with a wide range of symptoms and can be further specified into
three categories for diagnostic procedures. The subset FASD that most commonly effects the
heart is Fetal Alcohol Syndrome (FAS), where it has been found prenatal exposure to alcohol has
a direct impact on embryo cardiogenesis, seeing that alcohol engenders a higher risk of cardiac
anomalies and most commonly leads to congenital heart defects (CHDs) [9, 10]. More
specifically, prenatal alcohol exposure has been found to cause a wide variety of CHDs such as
cardiac transposition of great vessels, coarctation of the aorta, Tetralogy of Fallot (TOF), and
pulmonary valve stenosis. Quite commonly discovered in newborns affected by maternal
consumption of alcohol is the incidence of ventricular and atrial septal defects, otherwise known
as hole in the heart, where a hole develops and does not properly close between the left and right
ventricles or atria [9, 11]. Furthermore, the assortment of cardiological developmental
complications due to prenatal alcohol exposure is known to contribute to heart disease later in
adulthood [9, 10]. These severe heart defects are detrimental to a developing embryonic heart.
Considering that the precursor cardiac progenitor cells develop and differentiate in the third
week of gestation, giving rise to three embryonic germ layers: ectoderm, endoderm, and
mesoderm, contribute to explaining why alcohol consumption during pregnancy prompts fetal
damage [1, 9-11].
Wnt7a
The Wnt gene family consists of structurally related genes that encode secreted signaling
proteins involved in oncogenesis and various developmental processes, especially during

4
embryogenesis [12]. One specific member of this gene family is Wnt7a, which in humans, is a
gene found on chromosome 3, specifically at the cytogenic location 3p25.1 [13]. Wnt7a is a gene
commonly known to play a large role in embryonic development, assisting in dorsal versus
ventral patterning of limb, skeletal, and urogenital tract development of the embryo, while also
showing as pertinent to CNS angiogenesis, blood-brain barrier regulation, and a required gene
for normal neural stem cell proliferation [12, 14]. Additionally, the Wnt7a gene is a known
ligand for members of the frizzled family of seven transmembrane receptors working within the
Wnt/Beta-catenin pathway, where Beta-catenin is a dual function protein, known to be involved
in cell to cell adhesion and gene transcription [12]. The Wnt family of genes has been
determined as a group of evolutionarily conserved, secreted Cys-rich proteins, where there are 19
total Wnt genes within humans that couple to a number of receptors, thereby activating various
downstream pathways [12, 15]. Definitively, early studies have established said pathways as
either canonical (Beta-catenin-dependent) or noncanonical (Beta-catenin-independent) [14, 15].
In the canonical pathway, Beta-catenin has been recognized as the key effector responsible for
signal transduction to the nucleus while triggering transcription of Wnt-specific genes that work
on a cellular level. In the noncanonical pathway, it is noted that Wnt signaling is independent of
Beta-catenin signaling function, contributing mostly protein kinase C (PKC) dependent pathways
[14]. Amongst the two methods of Wnt signaling, the canonical, Beta-catenin-dependent
pathway has been distinguished as following a signal transduction cascade, where highly
transforming members of this cascade include Wnt1, Wnt3, Wnt3a, and Wnt7a [15, 16]. Due to
Wnt genes primarily driving tissue stem cells and working closely within the canonical pathway,
the Wnt signal transduction cascade has been established as a main regulator of development.
5
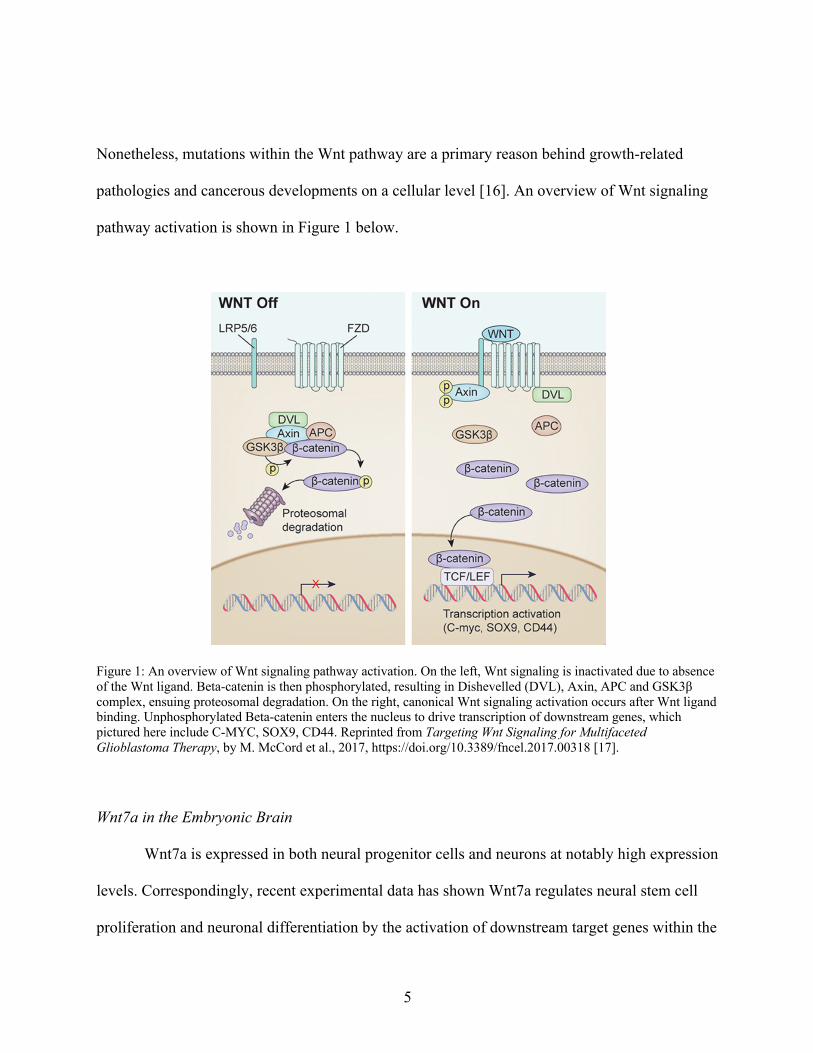
Nonetheless, mutations within the Wnt pathway are a primary reason behind growth-related
pathologies and cancerous developments on a cellular level [16]. An overview of Wnt signaling
pathway activation is shown in Figure 1 below.
Figure 1: An overview of Wnt signaling pathway activation. On the left, Wnt signaling is inactivated due to absence of the Wnt ligand. Beta-catenin is then phosphorylated, resulting in Dishevelled (DVL), Axin, APC and GSK3β complex, ensuing proteosomal degradation. On the right, canonical Wnt signaling activation occurs after Wnt ligand binding. Unphosphorylated Beta-catenin enters the nucleus to drive transcription of downstream genes, which pictured here include C-MYC, SOX9, CD44. Reprinted from Targeting Wnt Signaling for Multifaceted Glioblastoma Therapy, by M. McCord et al., 2017, https://doi.org/10.3389/fncel.2017.00318 [17].
Wnt7a in the Embryonic Brain
Wnt7a is expressed in both neural progenitor cells and neurons at notably high expression
levels. Correspondingly, recent experimental data has shown Wnt7a regulates neural stem cell
proliferation and neuronal differentiation by the activation of downstream target genes within the

6
canonical Beta-catenin pathway, indicating Wnt7a specifically stimulates neural stem cell
proliferation by activation of the canonical cascade. Equally important, studies have identified
that knockdown of Wnt7a, and thus Wnt7a expression, resulted in cell proliferation inhibition,
where reduced neural stem cell renewal and inhibition of hippocampal dentate neuron production
and maturation was observed [18].
Wnt7a in the Embryonic Heart
Soon after fertilization in utero, vertebrate embryos grow quite rapidly, with the heart
forming as the first functional organ [19]. Developmental processes begin as the heart forms
from mesodermal regions of the anterior region of the heart [9-11, 19]. Specifically, the Wnt7a
and Wnt7b genes work canonically in the Wnt pathway in formation of cerebral vascular and
pulmonary vascular smooth muscle development, both by use of the canonical pathway and both
regulating cardiomyocyte differentiation depending on the stage of development [20-23].
Explicitly, studies have shown that in the early stages of development, Wnt signals specifically
promote cardiogenesis while inhibiting hematopoiesis, whereas in the late stages of
development, Wnt signals inhibit cardiomyocyte differentiation [20-23]. Even so, it is quite
evident that activation of the canonical Wnt pathway is required for the induction of cardiac
transcription factors and cardiomyocyte differentiation during the crucial stages of embryo
development [19-23]. Specifically, in the early stages of cardiological development in mice
embryo, Wnt7a is first detectable in the myocardium of the outflow tract and ventricles by
embryonic day 3.5 (E3.5) and makes a vast appearance throughout the entirety of the heart by
embryonic day 5 (E5), whereby after E5, Wnt7a was primarily found only in the ventricular

7
endocardium and interventricular septum [24, 25]. Concerning the variety of Wnt family genes
within the canonical pathway, Wnt11 shows transient and prominent expression in the cardiac
conduction system, while Wnt7a expression was found chiefly in areas of peripheral conduction
cells, with both genes up-regulated consistently with conduction cell development in vitro [25].
Equally important, studies have established that ectopic Wnt signals can repress cardiac
formation from anterior mesoderm in vitro and in vivo, where inhibition of Wnt signaling would
promote anterior lateral mesoderm formation, and Wnt signaling in the posterior lateral
mesoderm will promote blood cell development and differentiation [26].
Effects of Ethanol on Wnt7a
As previously stated, Wnt7a is a pivotal gene within the Beta-catenin canonical pathway,
important for neural stem cell proliferation and required for the induction of cardiac transcription
factors and cardiomyocyte differentiation in the fetus [18, 21-23]. With much experimentation in
neurodevelopmental studies, it has been found that ethanol decreases Wnt7a expression [27-30].
Looking closely at the breakdown of ethanol in bodily metabolic processes may help in
distinguishing how ethanol is determined as being harmful in various aspects. The body
processes and eliminates ethanol in a series of steps using enzymes and producing intermediate
metabolites found to be harmful to the body. Most ethanol that is ingested is broken down by the
liver enzyme alcohol dehydrogenase (ADH), which transforms ethanol to acetylaldehyde, a
known carcinogen. Next, acetylaldehyde is further broken down by the enzyme aldehyde
dehydrogenase (ALDH) to form acetate, a less toxic compound that is metabolized into water
and carbon dioxide for easy elimination [31].

8
With better understanding of the breakdown of ethanol and how the metabolic reaction
yields harmful intermediates, it will become more apparent how maternal binge alcohol
consumption can induce a cascade effect on embryonic development. In particular, it has been
found that expression of Wnt7a is decreased by acute alcohol exposure in the developing
embryonic mouse, where Wnt7a was expressed at low levels during the first week of life and
rose several-fold higher in the following week [27]. With this idea, researchers investigated
ethanol exposure to Wnt7a in developmental processes and found that maternal consumption of
ethanol had a direct effect on regulation of neural stem cell proliferation due to inhibition of the
Wnt signaling pathway [27-29]. It was found ethanol significantly altered neural differentiation
in pathway-related gene expression and Wnt signaling proteins were discovered as suppressed
after ethanol exposure, specifically the Wnt7a gene [27-30].
Significance
Wnt7a has shown to play a significant role within the Beta-catenin canonical pathway as
a downstream gene regulator, while also proving to be an imperative gene in the regulation of
neural stem cell proliferation and cardiomyocyte differentiation during early embryonic
development. Previous studies have shown the Wnt7a gene is suppressed with ethanol exposure,
causing a canonical knockdown of downstream genes during neural, and potentially cardiac,
development. In testing the effects of ethanol on Wnt7a expression in the early embryonic heart
and brain, one can further investigate the relationship between maternal alcohol consumption and
the canonical genes present and affected by ethanol addition during early embryonic
development in both the heart and brain. Specifically, testing the effects of ethanol on Wnt7a

9
within the early embryonic heart, then testing if these effects happen simultaneously within the
embryonic brain, can possibly assist in better understanding cardiac and neural anomalies present
in Fetal Alcohol Spectrum Disorder.

10
METHODS Ethanol Administration to Wild-Type C57/BL6J Mice
The binge alcohol animal model established by Webster et al. exemplified congenital
heart defects (CHDs), which commonly occur in FASD after maternal alcohol administration
[32, 33]. Thus, this model was used throughout experimentation in order to standardize ethanol
administration. In this model, wild-type C57/BL6J mice (age 8-10 weeks) were mated at age
E9.5 and administered orally with a single dose of alcohol (5g/kg) or saline as control [32, 33].
The embryonic hearts and brains were then isolated and flash-frozen in liquid nitrogen, allowing
for future RNA extraction. A summary of this experimental protocol is shown below in Figure 2.
Figure 2: Experimental protocol for control vs. ethanol administration in wild-type C57/BL6J mice [32].
Testing for Wnt7a Presence in Early Embryonic Heart and Brain
Wnt7a presence in early embryonic heart and brain was tested using wild-type C57/BL6J
mice at embryonic age E10.5. This age was chosen to better conclude any changes in Wnt7a
expression between ethanol and control samples at an early embryonic developmental stage,

11
which per the binge alcohol animal model, would be synonymous to a human embryo aged about
4 weeks [32]. In doing so, one can potentially better understand how Wnt7a expression tested
with and without ethanol in the early embryonic heart and brain may contribute to cardiac and
neural anomalies present in Fetal Alcohol Spectrum Disorder.
Using Qiagen RNeasy kits, RNA extraction and cleanup were performed on unaffected,
control embryonic mouse heart and brain tissue samples age E10.5. A reverse-transcription
polymerase chain reaction (RT-PCR) was then performed to amplify the mouse RNA samples,
where the RNA was thereby reverse transcribed to complimentary DNA, or cDNA, in a reaction
also termed RT-reaction [34]. The embryonic mouse heart and brain samples were purified by
use of Qiagen PCR purification kits and the samples were nanodropped to ensure a baseline
DNA concentration of 20-nanograms per microliter. This procedure was followed by a real-time
quantitative polymerase chain reaction (qPCR) with the newly transcribed mouse cDNA,
coupled with the Wnt7a gene primer. This process allowed for the detection of Wnt7a presence
in embryonic mouse heart and brain samples at age E10.5. A 2% agarose gel was then prepared
and completed to confirm possible findings of the Wnt7a gene, which appeared as bands of 307
bp [35].
Determining Wnt7a Suppression in Early Embryonic Mouse Heart and Brain Post-Ethanol Administration
Once it was established that Wnt7a is normally present in embryonic mouse heart and
brain samples age E10.5, ethanol and control samples, both coupled with Wnt7a, were to be
tested. Similar to finding Wnt7a presence in early embryonic heart and brain, RNA was extracted
and cleaned by use of Qiagen RNeasy kits, however, from experimental (ethanol) and control

12
(saline) samples age E10.5. A RT-PCR was then performed to reverse transcribe the mouse
samples from RNA to cDNA, then concurrently, Qiagen PCR purification kits were used to
purify the embryonic mouse heart and brain samples. Once the samples were purified, a
nanodrop was performed to establish a baseline DNA concentration of 20-nanograms per
microliter. qPCR was performed using the mouse cDNA, coupled with the Wnt7a gene, which
provided CT values. Comparative analysis using the 2-ΔΔCT method normalized to same-sample
housekeeping genes, Glyceraldehyde 3-phosphate dehydrogenase (GAPDH) and Beta-actin,
facilitated in dissecting potential differences between the experimental and control samples of
embryonic mouse heart and brain samples at age E10.5. A 2% agarose gel was then prepared and
completed to confirm possible findings.
By completing qPCR and a comparative analysis using the 2-ΔΔCT method, it was possible
to determine if Wnt7a expression was suppressed in embryonic mouse heart and brain samples
age E10.5. This was possible because qPCR assays work to detect the accumulation of a
fluorescent signal, where the given CT value is defined as the number of cycles required for the
fluorescent signal to cross threshold and exceeds background level of expression. Moreover, CT
values are inversely proportional to the amount of target nucleic acid (Wnt7a) in the sample,
where the lower the CT value, the greater the amount of target nucleic acid in the sample [36]. A
summary of this experimental protocol is shown in Figure 3.

13
Figure 3: Diagram of experimental method.

14
RESULTS A Review of Preliminary Studies For the development of this study, preliminary data from previous undergraduate and
graduate researchers within Dr. Steven Ebert’s lab at the Lake Nona (UCF) campus was acquired
and further analyzed. Prior research within Dr. Steven Ebert’s lab developed genomic RNA-
Sequence (RNA-Seq) data analysis that showed Wnt7a, as well as other genes within the Beta-
catenin pathway, to downregulate with the addition of ethanol at embryonic day 10.5 (E10.5). To
acquire this data, RNA was isolated from E10.5, E11.5, and E12.5 embryonic hearts and RNA-
Seq data was analyzed to identify at least 14 genes that were substantially (2-fold or greater) and
significantly (P<0.05) decreased in the embryonic heart within 24 hours of maternal alcohol
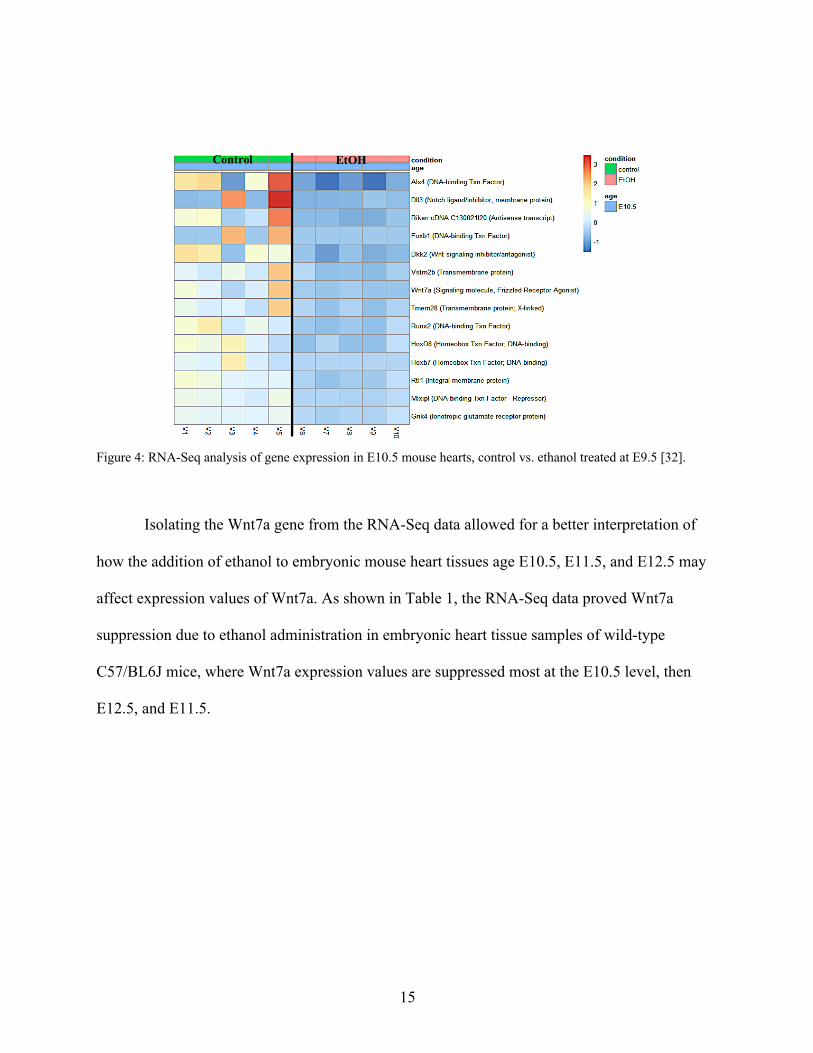
administration. These results are displayed in Figure 4, where use of the log2 scale allowed for
the representation of the relative expression for each gene tested, shown as a heat map. In this
figure, each square represents one heart sample, while each row represents the relative
expression for each gene. These results suggest that gene expression changes in the heart occur
primarily within the first 24 hours after a single binge administration of ethanol at E9.5 [32].
When analyzing this set of data, one can conclude that Wnt7a expression drastically decreased
24 hours after ethanol addition, suggesting it as an important gene to consider for further
analysis.
15
Figure 4: RNA-Seq analysis of gene expression in E10.5 mouse hearts, control vs. ethanol treated at E9.5 [32].
Isolating the Wnt7a gene from the RNA-Seq data allowed for a better interpretation of
how the addition of ethanol to embryonic mouse heart tissues age E10.5, E11.5, and E12.5 may
affect expression values of Wnt7a. As shown in Table 1, the RNA-Seq data proved Wnt7a
suppression due to ethanol administration in embryonic heart tissue samples of wild-type
C57/BL6J mice, where Wnt7a expression values are suppressed most at the E10.5 level, then
E12.5, and E11.5.
E10.5 Control EtOH

16
Age Expression Value
(control)
Expression Value
(ethanol)
Average difference (control-ethanol)
84 6
E10.5 42 3 9 5 29 3 AVG: 10.25 AVG: 4.25 6 6 8
E11.5 20 14 10 7 11 11
AVG: 11.75 AVG: 10 1.75 11 10
E12.5 5 10 20 10 10 5 AVG: 11.5 AVG: 8.75 2.75
Table 1: RNA-Seq data collection from Preliminary Studies. Data shows the expression values of embryonic mouse heart tissue samples ages E10.5, E11.5, and E12.5, control vs. ethanol, with average difference to elucidate the differences in control vs. ethanol at specific ages with Wnt7a.
Wnt7a Presence in Early Embryonic Heart and Brain
After analyzing the preliminary studies data and findings, it became evident that the
Wnt7a gene is present in the embryonic mouse heart at age E10.5. To ensure the gene primer
properly worked, a test-run was completed. The experimental procedure was the same as
previously described, where RNA was isolated from E10.5 embryonic mouse heart tissues which
had not been administered with ethanol, followed by RT-PCR and qPCR, to test if the expression
of Wnt7a was found to be present within the mouse embryonic heart at age E10.5. After analysis
of a 2% agarose gel that was loaded with the completed qPCR samples, Wnt7a showed on the
gel at proper band size (307 bp) when amplified with E10.5 cDNA at 20-nanograms per
microliter concentration, meaning Wnt7a was present in embryonic mouse hearts age E10.5 [35].

17
Figure 5 shows the 2% agarose gel, highlighting bands of E10.5 embryonic mouse heart samples
coupled with the Wnt7a gene at 307 bp.
Figure 5: 2% agarose gel highlighting Wnt7a gene in control E10.5 embryonic mouse heart samples at proper band size 307 bp [35].
The Wnt7a gene was then tested for presence and expression within E10.5 embryonic
mouse brain samples following the same experimental procedure. After RT-PCR and qPCR, a
2% agarose gel was performed and showed bands once again for the Wnt7a gene at proper band
size, exemplifying Wnt7a was present within the embryonic mouse brain tissue at age E10.5.
Determining Wnt7a Suppression
By completing qPCR and a comparative analysis using the 2-ΔΔCT method, it is possible to
determine if Wnt7a expression is suppressed in embryonic mouse heart and brain samples age
E10.5. Concurrently, this age was chosen to better conclude any changes in Wnt7a expression
between ethanol and control samples at early embryonic developmental stages [32]. In doing so,
one can potentially better understand how Wnt7a expression tested with and without ethanol in
18
the early embryonic heart and brain may contribute to cardiac and neural anomalies present in
Fetal Alcohol Spectrum Disorder.
Wnt7a in the Embryonic Heart
Following the same experimental method, embryonic heart samples of both control and
ethanol-administered wild-type C57/BL6J mice were isolated at age E10.5, where RT-PCR and
qPCR were performed. The housekeeping genes, Beta-actin and GAPDH, were analyzed for
consistency, where fluctuations between control and ethanol samples in the individual
housekeeping genes were evaluated, as the individual genes should show a similar CT value
throughout the test samples. If fluctuations between the control and ethanol samples occurred,
the data was viewed as inconsistent as fluctuations signify potential interactions between the
housekeeping genes and the ethanol, providing conflicting data for comparison of the embryonic
samples. The CT values for control and ethanol in Beta-actin and GAPDH of embryonic heart
samples age E10.5 are shown in Figure 6.

19
A B
Figure 6: CT Values for Beta-actin and GAPDH of embryonic heart samples age E10.5, where error bars represent standard deviation from the mean. (A) CT Values for Beta-actin control and ethanol-treated samples embryonic heart age E10.5. (B) CT Values for GAPDH control and ethanol-treated samples embryonic heart age E10.5.
From the data above, it was evident the more consistent housekeeping gene for
comparison of the embryonic heart samples age E10.5 was Beta-actin, as the CT values between
the control and ethanol samples were more consistent than those of the GAPDH, having less
standard deviation between samples. Beta-actin was then used to compare embryonic heart
samples age E10.5. Comparative analysis using the 2-ΔΔCT method normalized to same-sample
Beta-actin control facilitated in examining any differences between the experimental and control
samples to determine if Wnt7a was suppressed in embryonic heart samples age E10.5. The
expression fold change (2-ΔΔCT) of the samples is displayed in Figure 7.
Control Ethanol20
25
30
(p=0.08)
CT
Valu
e
Beta-actin Heart E10.5 CT Values
Control
Ethanol
Control Ethanol20
25
30
(p=0.71)
CT V
alue
GAPDH Heart E10.5 CT Values
Control
Ethanol

20
Figure 7: Expression fold change (2-ΔΔCT) for control and ethanol-treated samples with Wnt7a and housekeeping gene, Beta-actin, in embryonic mouse heart age E10.5, where error bars represent standard deviation from the mean.
As displayed in Figure 7, Wnt7a expression was downregulated when interacted with
ethanol in embryonic mouse heart age E10.5, where the average expression fold change between
control and ethanol samples decreased 2-fold, a substantial decrease in expression [32]. A two-
tailed test was then completed to further statistical analysis of the samples with p-values. Wnt7a
normalized to same-sample Beta-actin control in E10.5 heart samples proved significant
(P=0.002).
Wnt7a in the Embryonic Brain
The same experimental method was applied to embryonic brain tissue samples of both
control and ethanol-administered wild-type C57/BL6J mice isolated at age E10.5, where RT-
PCR and qPCR were performed. The housekeeping genes, Beta-actin and GAPDH, were
analyzed once more for consistency, where fluctuations between control and ethanol samples in
the individual housekeeping genes were evaluated, as the individual genes should show a similar
Control Ethanol0.0
0.5
1.0
1.5
2.0
(p=0.002)
Expr
essi
on F
old
Cha
nge
Expression Fold Change of Heart E10.5
Control
Ethanol

21
CT value throughout the test samples. The CT values for control and ethanol in Beta-actin and
GAPDH of embryonic brain samples age E10.5 are shown in Figure 8 below.
A B
Figure 8: CT Values for Beta-actin and GAPDH of embryonic brain samples age E10.5, where error bars represent standard deviation from the mean. (A) CT Values for Beta-actin control and ethanol-treated samples embryonic brain age E10.5. (B) CT Values for GAPDH control and ethanol-treated samples embryonic brain age E10.5.
From the data above, it was evident the more consistent housekeeping gene for
comparison of the embryonic brain samples age E10.5 was Beta-actin, as the CT values between
the control and ethanol samples were more consistent than those of the GAPDH, having less
standard deviation between samples, similar to the embryonic heart samples examined prior.
Beta-actin was then used to compare embryonic brain samples age E10.5. Comparative analysis
using the 2-ΔΔCT method normalized to same-sample Beta-actin control facilitated in examining
any differences between the experimental and control samples to determine if Wnt7a was
suppressed in embryonic brain samples age E10.5. The expression fold change (2-ΔΔCT) of the
samples is displayed in Figure 9 below.
Control Ethanol
20
25
30
(p=0.10)
CT
Valu
e
Beta-actin Brain E10.5 CT Values
Control
Ethanol
Control Ethanol
20
25
30
(p=0.06)
CT V
alue
GAPDH Brain E10.5 CT Values
Control
Ethanol
22
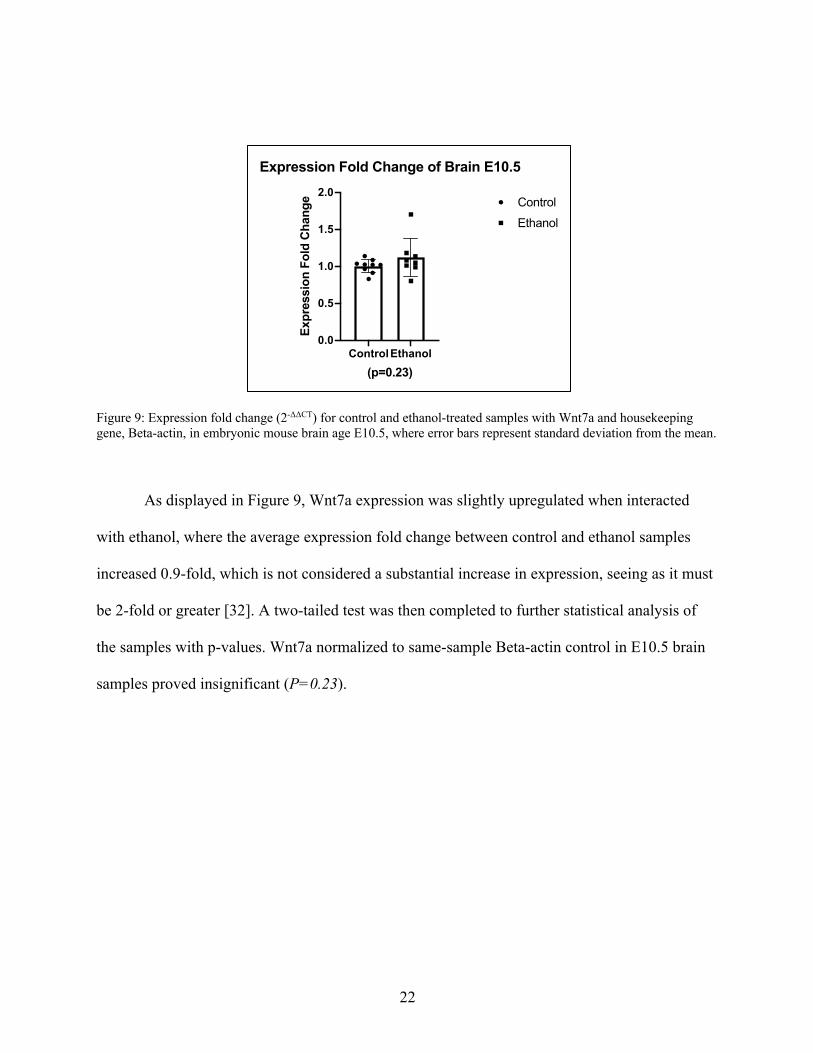
Figure 9: Expression fold change (2-ΔΔCT) for control and ethanol-treated samples with Wnt7a and housekeeping gene, Beta-actin, in embryonic mouse brain age E10.5, where error bars represent standard deviation from the mean.
As displayed in Figure 9, Wnt7a expression was slightly upregulated when interacted
with ethanol, where the average expression fold change between control and ethanol samples
increased 0.9-fold, which is not considered a substantial increase in expression, seeing as it must
be 2-fold or greater [32]. A two-tailed test was then completed to further statistical analysis of
the samples with p-values. Wnt7a normalized to same-sample Beta-actin control in E10.5 brain
samples proved insignificant (P=0.23).
ControlEthanol0.0
0.5
1.0
1.5
2.0
Expression Fold Change of Brain E10.5
(p=0.23)
Exp
ress
ion
Fold
Cha
nge Control
Ethanol

23
DISCUSSION After evaluation of RNA-Seq data and a comparative analysis using the 2-ΔΔCT method, it
is evident Wnt7a is present in embryonic mouse age E10.5 heart and brain samples, and Wnt7a is
suppressed at age E10.5 in embryonic mouse heart, but not brain, when induced with ethanol.
The RNA-Seq data in Figure 4 provided evidence that Wnt7a expression was
substantially and significantly suppressed 24 hours after ethanol addition, where the gene was
downregulated significantly and displayed an average expression fold change greater than 6-fold
at age E10.5, as shown in Table 1. Thereafter, Wnt7a was found to be present in the embryonic
mouse heart age E10.5, as expected, but also found in embryonic brain, both at the correct band
size when run on 2% agarose gels. Wnt7a expression with ethanol was then tested to determine if
gene suppression occurred simultaneously in embryonic heart and brain at embryonic age E10.5.
Overall gene expression was calculated by comparing average expression fold change, using the
2-ΔΔCT method, normalized to same-sample housekeeping gene Beta-actin. Beta-actin was used
throughout the study as it was found to have more consistent CT values with less standard
deviation between control and ethanol samples than GAPDH in both embryonic heart and brain.
Wnt7a was normalized to same-sample housekeeping gene Beta-actin, allowing for the
comparison of CT values and calculation of expression fold change of embryonic mouse heart at
age E10.5. As shown in Figure 7, Wnt7a expression in embryonic heart at age E10.5 was
downregulated when interacted with ethanol, where the average expression fold change between
control and ethanol samples decreased 2-fold, a substantial (2-fold or greater) and significant
(P=0.002) decrease in expression. The same protocol was followed for testing Wnt7a expression
in embryonic brain at age E10.5. As shown in Figure 9, Wnt7a expression increased 0.9-fold (not

24
substantial) and the results were proven insignificant (P=0.23), so the null hypothesis was
accepted, meaning Wnt7a expression showed no change when induced with ethanol in
embryonic brain at age E10.5.
Limitations to this study include a lack of prior research studies, where previous studies
focused on Wnt7a suppression due to ethanol within neurodevelopmental stages at embryonic
age E15 [27, 28]. Additionally, having a larger sample size with more mice samples across
different litters could better justify results and allow for more effective statistical analysis of
data. One can also further this research in a multitude of ways. First, it is important to note the
RNA-Seq data from the preliminary studies showed a decrease in the expression of Wnt7a in
embryonic heart samples at ages E11.5 and E12.5 as well. These later ages can be studied to
further the experimentation of the effects of ethanol on Wnt7a expression to determine if similar
results occur. Moreover, Wnt7a is involved in the limb, skeletal, and urogenital tract
development of the embryo [12, 14]. With this in mind, one can further study Wnt7a expression
within mouse trunk samples at embryonic ages E10.5, E11.5, and E12.5 to further the knowledge
of Wnt7a presence in different tissues throughout various stages of embryonic development.
Wnt7a expression can also be tested with alterations made in the Webster et al. binge alcohol
animal model, where differing ethanol or saline volumes can be administered to the maternal
mice at various times, thereby expanding the study to include smaller or larger ethanol doses
administered at various times, rather than only embryonic age E9.5. Lastly, experimentation can
be extended to include cell cultures, where cardiomyocyte cell lines can be used and tested
directly.

25
APPENDIX A WNT7A CT VALUES AND EXPRESSION FOLD CHANGE IN HEART
AND BRAIN E10.5 SAMPLES

26
A
B
Table 2: CT Values for Beta-actin and GAPDH of embryonic heart samples age E10.5. (A) CT Values for Beta-actin and Wnt7a in embryonic heart age E10.5. (B) CT Values for GAPDH and Wnt7a in embryonic heart age E10.5. Here, W (Wnt7a) CT values were subtracted from B (Beta-actin) CT values or G (GAPDH) CT values to find individual expression fold change (2-ΔΔCT), providing an average expression fold change between control (red) and ethanol-treated (blue) samples.
*indicates an outlier. Outliers found using interquartile range (IQR) calculations, where all values must fall within the 25th and 75th quartiles of data, otherwise they are indicated as outliers and excluded from the total average expression fold change (2-ΔΔCT).
Samples CT (B) CT (W) ΔCT (W-B) ΔΔCT (ΔCT -ΔCT Control Avg) Expression Fold Change Avg Expression Fold ChangeControl 11.1 23.87 34.05 10.18 0.9 1
11.8 22.41 33.86 11.44 1.0118.7 23.87 34.25 10.38 0.925.1 21.94 34.31 12.37 1.095.2 22.11 34.12 12 1.06
Ethanol 8.2 21.59 34.26 12.66 1.38 0.38 0.518.4 21.33 34.19 12.85 1.58 0.338.5 22.65 34.09 11.44 0.16 0.898.6 21.19 34.07 12.87 1.59 0.338.7 22.33 34.31 11.97 0.69 0.61
Samples CT (G) CT (W) ΔCT (W-G) ΔΔCT (ΔCT -ΔCT Control Avg) Expression Fold Change Avg Expression Fold ChangeControl 11.1 28.95 34.05 5.09 0.66 1
11.8 26.52 33.86 7.33 0.9618.7 28.41 34.25 5.84 0.765.1 24.44 34.31 9.87 1.295.2 24.19 34.12 9.92 1.3
Ethanol 8.2 26.36 34.26 7.89 0.28 0.82 3.658.4 24.68 34.19 9.51 1.89 0.268.5 27.3 34.09 6.79 -0.82 1.76 0.92 (without outlier)8.6 30.32 34.07 3.74 -3.86 14.578.7 26.44 34.31 7.86 0.25 0.83

27
A
B
Table 3: CT Values for Beta-actin and GAPDH of embryonic brain samples age E10.5. (A) CT Values for Beta-actin and Wnt7a in embryonic brain age E10.5. (B) CT Values for GAPDH and Wnt7a in embryonic brain age E10.5. Here, W (Wnt7a) CT values were subtracted from B (Beta-actin) CT values or G (GAPDH) CT values to find individual expression fold change (2-ΔΔCT), providing an average expression fold change between control (red) and ethanol-treated (blue) samples.
*indicates an outlier. Outliers found using interquartile range (IQR) calculations, where all values must fall within the 25th and 75th quartiles of data, otherwise they are indicated as outliers and excluded from the total average expression fold change (2-ΔΔCT).
Samples CT (B) CT (W) ΔCT (W-B) ΔΔCT (ΔCT -ΔCT Control Avg) Expression Fold Change Avg Expression Fold ChangeControl 18.2 19.97 26.73 6.76 1.01 1
18.3 18.96 26.52 7.56 1.1318.4 19.36 26.56 7.2 1.0818.5 19.36 26.14 6.77 1.0118.9 19.76 26.16 6.39 0.9611.7 20.54 26.04 5.5 0.8211.6 20.17 26.22 6.04 0.911.5 19.24 26.12 6.87 1.035.8 19.07 25.86 6.79 1.02
Ethanol 27.6 19.52 26.11 6.59 -0.06 1.04 2.6827.7 19.94 26.42 6.47 -0.18 1.1327.8 24.03 27.18 3.14 -3.5 11.37 1.11 (without outlier)12.1 20.11 26.76 6.64 -0.01 112.2 20.01 26.44 6.42 -0.23 1.1712.3 20.46 26.35 5.89 -0.76 1.6912.4 23.08 27.03 3.95 -2.7 6.5112.5 19.67 26.22 6.55 -0.1 1.0712.6 19.75 26.43 6.68 0.02 0.9812.7 19.1 26.08 6.98 0.32 0.79
Samples CT (G) CT (W) ΔCT (W-G) ΔΔCT (ΔCT -ΔCT Control Avg) Expression Fold Change Avg Expression Fold ChangeControl 18.2 24.03 26.73 2.7 0.65 1
18.3 22.98 26.52 3.53 0.8518.4 21.66 26.56 4.89 1.1918.5 21.23 26.14 4.9 1.1918.9 21.63 26.16 4.52 1.0911.7 21.72 26.04 4.32 1.0511.6 22.95 26.22 3.26 0.7911.5 21.11 26.12 5 1.215.8 21.98 25.86 3.88 0.94
Ethanol 27.6 22.42 26.11 3.68 -0.43 1.34 3.2727.7 23.43 26.42 2.99 2.99 0.1227.8 27.92 27.18 -0.74 -4.85 29.02 0.41 (without outlier)12.1 23.95 26.76 2.8 -0.04 1.0312.2 22.24 26.44 4.19 4.19 0.0512.3 23.01 26.35 3.34 3.34 0.0912.4 26.83 27.03 0.2 0.2 0.8612.5 22.25 26.22 3.97 3.97 0.0612.6 22.31 26.43 4.11 4.11 0.0512.7 22.15 26.08 3.93 3.93 0.06

28
WORKS CITED
1. Iveli, M., Morales, S., Rebolledo, A. et al. (2007). Effects of Light Ethanol Consumption During Pregnancy: Increased Frequency of Minor Anomalies in the Newborn and Altered Contractility of Umbilical Cord Artery. Pediatr Res, 61, 456–46.
2. Cook, J.L., Green, C.R., Lilley, C.M., Anderson, S.M., Baldwin, M.E., Chudley, A.E., et al. (2016). Canada Fetal Alcohol Spectrum Disorder Research Network: Fetal alcohol spectrum disorder: a guideline for diagnosis across the lifespan. CMAJ: Canadian Medical Association Journal = journal de l'Association medicale Canadienne, 188(3), 191–197.
3. Hoyme, H.E., Kalberg, W.O., Elliott, A.J., et al. (2016). Updated Clinical Guidelines for Diagnosing Fetal Alcohol Spectrum Disorders. Pediatrics, 138(2).
4. National Institute of Alcohol Abuse and Alcoholism. (2004). NIAAA Newsletter, 3:3.
5. Smith, V.C. and Turchi, R. (2019). Fetal Alcohol Spectrum Disorders: FAQs of Parents & Families. American Academy of Pediatrics.
6. May, P.A., Chambers, C.D., Kalberg, W.O., et al. (2018). Prevalence of Fetal Alcohol Spectrum Disorders in 4 US Communities. JAMA, 319(5), 474-482.
7. Hoyme, H.E., May, P.A., Kalberg, W.O., et al. (2005). A practical clinical approach to diagnosis of fetal alcohol spectrum disorders: clarification of the 1996 institute of medicine criteria. Pediatrics, 115, 39-47.
8. Streissguth, A.P., Barr, H.M., Kogan, J., & Bookstein, F.L. (1996). Understanding the occurrence of secondary disabilities in clients with fetal alcohol syndrome (FAS) and fetal alcohol effects (FAE). Final report to the Centers for Disease Control and Prevention (CDC). Seattle: University of Washington, Fetal Alcohol & Drug Unit, 96-06. 9. O’Neil, E. (2011). Effects of Prenatal Alcohol Exposure on Cardiac Development. Embryo Project Encyclopedia. 10. Grewal, J., Carmichael, S.L., Ma, C., Lammer, E.J., & Shaw, G.M. (2008). Maternal periconceptional smoking and alcohol consumption and risk for select congenital anomalies. Birth defects research. Part A, Clinical and molecular teratology, 82(7), 519-526.
11. Shaw, G.M., Malcoe, L.H., Swan, S.H., et al. (1992). Congenital cardiac anomalies relative to selected maternal exposures and conditions during early pregnancy. Eur J Epidemiol 8, 757-760.
12. Eubelen, M., Bostaille, N., Cabochette, P., et al. (2018). A molecular mechanism for Wnt ligand-specific signaling. Science, 361:0-0.

29
13. Wnt7a Gene. (2020). National Institutes of Health: U.S. National Library of Medicine. 14. Valenta, T., Hausmann, G., & Basler, K. (2012). The many faces and functions of β-catenin. The EMBO journal, 31(12), 2714-2736. 15. Kikuchi, A., Yamamoto, H., Sato, A. & Matsumoto, S. (2011). New insights into the mechanism of Wnt signaling pathway activation. Int. Rev. Cell. Mol. Biol., 291, 21–7. 16. Nusse, R. and Clevers, H. (2017). Wnt/β-Catenin Signaling, Disease, and Emerging Therapeutic Modalities. Cell, 169: 985-999. 17. McCord, M., et al. (2017). Targeting Wnt Signaling for Multifaceted Glioblastoma Therapy. Front. Cell. Neurosci., 11:318. doi: 10.3389/fncel.2017.00318 18. Qu, Q., Sun, G., Murai, K., et al. (2013). Wnt7a Regulates Multiple Steps of Neurogenesis. Molecular and Cellular Biology, 33(13), 2551-2559. 19. Eisenberg, C.A. and Eisenberg, L.M. (2006). Wnt signal transduction and the formation of the myocardium. Dev Biol., 293(2): 305–315. 20. Daneman, R., Agalliu, D., Zhou, L., et al. (2009). Wnt/beta-catenin signaling is required for CNS, but not non-CNS, angiogenesis. Proc Natl Acad Sci USA, 106:641–646. 21. Naito, A.T., Shiojima, I., Akazawa, H., Hidaka K, et al. (2006). Developmental stage-specific biphasic roles of Wnt/β-catenin signaling in cardiomyogenesis and hematopoiesis. Proceedings of the National Academy of Sciences, 103(52) 19812-19817. 22. Naito, Atsuhiko T., et al. (2005). Phosphatidylinositol 3-Kinase–Akt Pathway Plays a Critical Role in Early Cardiomyogenesis by Regulating Canonical Wnt Signaling. Circulation Research. 23. Kwon, C., Arnold, J., Hsiao, E. C., Taketo, M. M., Conklin, B. R., & Srivastava, D. (2007). Canonical Wnt signaling is a positive regulator of mammalian cardiac progenitors. Proceedings of the National Academy of Sciences of the United States of America, 104(26), 10894–10899. 24. Dealy, C.N., Roth, A., Ferrari, D., et al. (1993). Wnt5a and Wnt7a are expressed in the developing chick limb bud in a manner suggesting roles in pattern formation along the proximodistal and dorsoventral axes. Mech Dev, 43:175-186. 25. Bond, J., Sedmera, D., Jourdan, J., et al. (2003). Wnt11 and Wnt7a are upregulated in association with differentiation of cardiac conduction cells in vitro and in vivo. Developmental dynamics: an official publication of the American Association of Anatomists, 227(4):536-543.

30
26. Marvin, M.J., Di Rocco, G., Gardiner, A., et al. (2001). Inhibition of Wnt activity induces heart formation from posterior mesoderm. Genes & development, 15(3), 316–327. 27. Karaçay, B., Li, S., Bonthius, D.J. (2008). Maturation-dependent alcohol resistance in the developing mouse: cerebellar neuronal loss expression during alcohol-vulnerable and -resistant periods. Alcohol Clin Exp Res, 32:1439–1450. 28. Choi, M.R., Jung, K.H., Park, J.H. et al. (2011). Ethanol-induced small heat shock protein genes in the differentiation of mouse embryonic neural stem cells. Archives of Toxicology, 85: 293-304. 29. Vangipuram, S.D., Lyman, W.D. (2012). Ethanol affects differentiation-related pathways and suppresses Wnt signaling protein expression in human neural stem cells. Alcohol Clin Exp Res., 36(5):788-97. 30. Xu, C. Q., de la Monte, S. M., Tong, M., Huang, C. K., & Kim, M. (2015). Chronic Ethanol-Induced Impairment of Wnt/β-Catenin Signaling is Attenuated by PPAR-δ Agonist. Alcoholism, clinical and experimental research, 39(6), 969–979. 31. Edenberg, H.J. (2007). The genetics of alcohol metabolism: Role of alcohol dehydrogenase and aldehyde dehydrogenase variants. Alcohol Research & Health, 30(1):5–13. 32. Ebert, S. (2018). Alcohol-Induced Congenital Heart Defects: Integrated Systems Approach to Identify Epigenetic Marks. 33. Webster, W.S., Germain, M.A., Lipson, A., Walsh, D. (1984). Alcohol and congenital heart defects: an experimental study in mice. Cardiovascular research, 18(6):335-338. 34. Dharmaraj, S. RT-PCR: The basics. Applied Biosystems. 35. Hayashi, K., Erikson, D. W., Tilford, S. A., et al. (2009). Wnt genes in the mouse uterus: potential regulation of implantation. Biology of reproduction, 80(5), 989-1000. 36. Livak, K.J. and Schmittgen, T.D. (2001). Analysis of relative gene expression data using real-time quantitative PCR and the 2(-Delta Delta C(T)) method. Methods, 25: 402–408.