invest success - succession advisory services · 05 04 four levels of diligence successful...
TRANSCRIPT

Investfor
sUCCessQuarterly bulletin
www.successionadvisoryservices.com


IntroductionFrom Group CEO Simon Chamberlain
www.successionadvisoryservices.com 03
It is widely reported that the unusual volatility of inancial markets in recent weeks, resulting in impressive peaks and troughs, will be with us for some time. The way we manage assets in a volatile market takes on signiicant importance.
Simon Taylor, Chair of Succession’s Investment Committee, shares
his thoughts on managing assets in a volatile market on pages 12 and
13, concluding that managing volatility for an investor is easier over the
long-term, and that the worst case scenario is trying to time the market
– a sure recipe for disaster.
Our investment strategy is based on the principle that over time, capital
markets will provide a return based on the risk an investor is taking. We
therefore construct and advise on portfolios using a long-term, risk adjusted
asset allocation, overlaid with any requirements to provide liquidity for
portfolio drawings.
We are conident this approach will provide the returns required over the long-term, but in the short-term, we do expect to suffer periods of volatility.
Given the uncertainty of world events, managing assets in a volatile market
requires diversiication and strategic asset allocation – the cornerstones of our investment philosophy. Succession’s strategic partners SEI and Charles
Stanley Pan Asset also share their thinking on this key lever on page 14-16.
For a full round-up of the economic highs and lows by geographical region
and asset class, our independent risk and research analysts, Rayner Spencer
Mills, have carried out an in-depth analysis featured on pages 6-11.
SIMON CHAMBERLAIN
THere Is A sTrONg reLATIONsHIP beTWeeN VOLATILITY ANd mArKeT PerfOrmANce
QUARTERLYBULLETIN
2015 Q3

04 www.successionadvisoryservices.com
Four Levels of Diligence
Succession provides investment solutions - from global fund managers and investment
houses, as well as specialist niche investment managers - delivered through our Investment
Matrix to match your volatility and return targets agreed as part of your inancial plan.
Assessing the quality of investment performance and fund manager capability can be
challenging and subjective. That is why we created a four-tier solution, co-ordinated by the
Succession Investment Committee.
• Succession works with investment experts to deliver our investment philosophy. The
strategy is founded on signiicant academic research, which emphasises the importance of strategic asset allocation and diversiication. Our aim is to deliver investment returns that match your long-term goals and aspirations, within an agreed risk proile that suits your attitude to risk and loss.
• We use the expertise of Rayner Spencer Mills, a dedicated resource, to monitor the
performance of individual funds, as well as the performance of fund managers and the
investment houses, against agreed targets for return and volatility.
• Our Succession Investment Committee reviews our models on a monthly basis.
Committee members possess both the expertise and knowledge to challenge our
selected investment managers and their activity.
• And inally, the Financial Planners and Advisers who best understand and appreciate what you are seeking to achieve to give you peace of mind that your inancial plan is on target.
While past performance can provide no guarantee of future returns, our rigorous approach
to investment means you can be certain your investments are subject to continuous
sophisticated analysis and scrutiny, from an experienced team of experts. S
QUARTERLYBULLETIN
2015 Q3
successful investment is critical to future inancial wellbeing, and succession provides innovative and effective investment expertise to meet your investment goals.

www.successionadvisoryservices.com 05
04 Four levels oF diligence Successful investment is critical to future inancial wellbeing.
06 general economic overview Third quarter review 2015.
12 managing assets in volatile market From Simon Taylor, Chair of the Succession Investment Committee.
14 investing For success From Charles Stanley Pan Asset.
16 managed volatility From SEI.
18 risk vs uncertainty From Seven Investment Management.
20 PortFolio Pilates From BMO Global Asset Management.
21 taking advantage oF the stock market diP From Quilter Cheviot.
22 Fundamentals intact From Goldman Sachs Asset
Management.
24 succession investment committee members
In this issue
QUARTERLYBULLETIN
2015 Q3

Although the market catalyst was a scare about irstly Chinese and then global growth, one of the reasons markets fell so far and so fast was related to valuation. Valuation is never a good indicator of market timing and markets often stay overvalued until a catalyst occurs, as was the case in 1987. Concerns about both slowing growth and an inevitable rise in US interest rates were the catalyst for the recent market setback and high valuation levels in many markets meant that investors were reluctant to step in to support the market until stock market declines meant valuations were more attractive.
Taking the key factors in turn, China’s rebalancing and transition from a ixed asset driven economy to a service
driven one was always likely to cause some level of economic volatility. Many Asian based managers believe China is taking up the slack from its slowdown in manufacturing via its service sector, which is why unemployment has not increased to date. Whilst China is undoubtedly slowing, the impact of this is arguably more important for commodity exporting nations than for China itself. This may indicate that sentiment has a
lot to do with recent moves in global markets rather than tested fundamentals and China has not helped this by fuelling the debate irstly with the recent devaluation of the Chinese Yuan (albeit
by only around 3%) which appears to have unsettled investors’ faith in the Chinese authorities to maintain growth and economic stability, and secondly by mismanaging the turmoil in the stock market by trying to manipulate the market which it proved was impractical and unachievable.
Since the last rate hike in the USA on 29 June 2006 the world has been through a huge inancial crisis during which we have seen 697 interest rate cuts globally and a combined $15 trillion of inancial assets bought by central banks. Despite this, economic growth remains sluggish and many developed economies continue to grapple with close to zero inlation. Central banks seem to be sure of their roles in ighting these delationary pressures and we are not likely to see a trend for interest rate rises for
some time yet. The US has been more dovish on rate rises, not because of poor domestic data, but due to the concerns in the global economy and in particular emerging markets. This stance has been supported by global organisations like the IMF, but has been criticised internally and has created
further uncertainty and market volatility as the rise was potentially priced into markets for September this year. The fact that inlation is so low and delation remains a potential threat also points
to lower rates which is unusual at this stage of the economic cycle. Overall markets will continue to watch the Fed and analyse each comment in detail for
any signs of change but it seems that they are looking beyond the US for stabilisation before they act.
Asset allocators look to make decisions informed by experience and whilst most fund managers have grown up in a standard business cycle environment, the economic recovery post the inancial crisis has not followed normal patterns. In particular, the credit channel of monetary transmission has not
operated effectively and low interest rates have not resulted in a willingness to borrow and engage in capex by corporates. A muted capital investment cycle has now been further hit by the slowdown in the resources sector and as yet non-resource capex has not fully compensated for this.
Throughout the developed nations the pickup compared to previous cycles has been muted, and in this environment the slowdown caused by the hit to commodity exporting nations has resulted in some softness in the
global economy in the third quarter. Investors should not necessarily panic at this as very often during extended economic recoveries there are periodic soft patches.
06 www.successionadvisoryservices.com
General Economic Overview QUARTER THREE 2015
QUARTERLYBULLETIN
2015 Q3
It is not dificult to see that quarter three has been the worst quarter for equity markets for some considerable time. In fact most risk assets, with the probable exception of property, have fared badly in the last quarter which has been dominated by two key inluencing factors - the chinese slowdown and Us Interest rates - resulting in higher volatility across most stock markets. There are a number of other issues, such as valuation, that interact with these but most of the increase in uncertainty has been as a result of these two factors.

www.successionadvisoryservices.com 07
eQuity markets overview
chart showing 2015 year to date returns for major market indices:
chart showing Q3 2015 returns for major market indices:
RSMR Rayner Spencer Mills Research
QUARTERLYBULLETIN
2015 Q3
As we saw in January, the third quarter has
again seen markets sell off on concerns
about global growth. This came against the
backdrop of the signiicant rally in markets which has occurred without a serious
correction since the Draghi ‘do whatever
it takes’ speech in July 2012. QE and lower
than normal interest rates have previously
resulted in markets front running the
economic cycle.
At the start of 2015 Europe was the only
developed Western market trading below
longer term valuation averages. European
QE resulted in multiple expansion in
Europe from below 14x to 16.5x earnings
by April - by the end of Q1 all markets
were trading either a little above fair
value, or at expensive valuations. This was
particularly true of the US when looking
at the Shiller cyclically adjusted PE ratio
which looks at an average of the last 10
years proits and certainly showed the United States to be trading at elevated
levels. This left markets reliant on earnings
growth to make further progress. Earnings
expectations ex Europe have in the main
been trimmed back since the start of 2015
and both the US and UK are expected
to show negligible earnings growth in
2015, with Europe the only major region
seeing upgrades, partly due to currency
depreciation. Japan has been the strongest
market year to date having only really fallen
in recent months because of the knock-on
effect from concerns over China.
There are three main elements that
affect equity market pricing – valuation,
fundamentals and sentiment. The most
important of these continues to be
valuation. This does not provide a reliable
timing indicator but is an excellent
indicator of risk – a negative catalyst when
valuations are high can result in a sharp
pull back in equity prices. Very often the
perceived catalyst, such as China today, is
not the real reason for a market setback
as when valuation levels are high, there is
less market support in the initial stages of
a pull back. This appeared to be the case
in August of this year.
Looking at fundamentals, despite the
slowdown in China and parts of the
emerging world, the global economic
recovery is now more broadly based
with both Europe and Japan on an
improving trend and central banks in
both the US and UK contemplating
an interest rate rise. Even though the
recovery in the developed world is now
more synchronised, it will be restrained
by the excessive levels of debt in the
global economy and the slowdown
amongst commodity exporting nations
so overall accommodative monetary
policy is likely to remain in place for an
extended period.
Finally sentiment – this is very
often the contrarian one. Sentiment
towards equity markets by private
investors is now more cautious,
especially towards Asia and this is
generally a positive sign. The sharp
sell off may have succeeded in putting
off cautious investors from moving
into higher risk assets.

08 www.successionadvisoryservices.com
General Economic Overview (cont.)
QUARTER TWO 2015
The UK, like the US, has been on a steady growth path for some time and has the beneit of being in a stronger position than other European economies with the exception of Germany. The stock market has not been able to avoid the recent falls with the FTSE down some 7% over the quarter, which is a relection of both uncertainty in sentiment and the general global downturn based on China. The UK has a global stock market, particularly in mega caps, and has been gradually dominated by mining and oil majors over the last ten years as inancials have struggled. The commodity related slowdown has therefore hit this part of the stock market more signiicantly than perhaps other western markets. The domestic economy has been in good shape and this is why we have seen greater strength in mid and small cap stocks since mid-2014. The market had also started to anticipate a rising rate environment which was affecting the valuations of the traditional high dividend or so called bond proxy stocks. The strength of the UK consumer has however been robust in the last 12 months, helped by a low interest rate environment and weaker commodity and energy prices. Earnings have generally been stabilising if not increasing and M&A activity is still growing making the valuation of UK equities more attractive after the recent falls. The UK has a stronger growth rate than many economies in Europe and will also beneit from the fact that Europe is also strengthening following the fears created by the Greek crisis. This will help to support the UK economy as exports begin to improve. House prices have continued to rise, but now on a nationwide basis rather than just being focused on an improvement in the south east. The labour market continues to tighten and wage growth has at last shown signs of acceleration. Wages at the lower end of the economy will improve further with the introduction of the new minimum wage which takes effect next year.
The UK is now part of the global market which is interconnected and interdependent to a far larger degree than ever before. This means scares in the emerging markets and China will continue to deliver volatility to the UK market.
uk us
European markets have enjoyed a signiicant rally since the Draghi ‘do whatever it takes speech’ in July 2012 ended fears of a collapse in the European project. At the start of 2015 Europe was the only developed western market trading below longer term valuation averages. By the end of quarter one all developed markets were trading either a little above fair value to expensive and were reliant on earnings growth to make further progress. Earnings expectations ex Europe have in the main been trimmed back since the start of 2015. Europe has been the only major region seeing upgrades, partly due to currency depreciation. As fundamentals would suggest, Europe has outperformed this year.
The recent sell off has been driven by a number of factors, the main one being that the market valuation in the States, the world’s dominant market, was expensive. The current catalyst has been a scare about irstly Chinese and then global growth and markets have also had to recognise that the timing of the irst US rate hike draws ever closer. One would expect this event, or irm forward guidance to this effect by the Fed, to result in increased levels of market volatility and this has been a further factor behind the sell off. Recent economic data from Europe has been encouraging with PMI’s indicating continues expansion. Lower commodity and oil prices are a plus for the developed world and most of Europe. This is a boost to the consumer.
Markets have been able to sustain high valuation levels because of Central Bank policy - generally speaking, the quicker monetary policy normalises the more valuation pressure the market would face – and also fears over the irst US rate rise was likely to result in some form of market setback, albeit historically a transitory one. Markets have also attracted certain investors who have chased yield due to zero interest rates and these may well have panicked, compounding the market setback, which occurred in August/September, traditionally a time of lower market liquidity. The base case scenario is for markets to recover their poise as investors realise growth concerns have been overdone. European companies continue to have scope to raise proits as the cycle catches up with the States and UK. European companies have the potential to increase margins towards the previous peak and earnings can take European markets higher as long as growth concerns dissipate.
Qe Quantitive easing
ecb european central bank
gdP gross domestic Product
cbi confederation of British Industry
Pmi Purchasing managers’ Index
QUARTERLYBULLETIN
2015 Q3
The US economy continues to deliver good GDP growth and has positive employment and wage trends leading many investors to have priced in a rate rise in 2015. Whilst this looks sensible in isolation the Fed has chosen to resist increasing rates so far, taking a more global view of the effect this may have. At the end of Q1 all markets were trading a little above fair value or expensive in the case of the US and were reliant on earnings growth to make fur ther progress, expectations of which have been trimmed back since the star t of 2015 – par ticularly in the energy and related sectors in the US. Multi nationals (Including the tech sector) have suffered from the strong US dollar negatively impacting on earnings estimates and so the US is now only expected to show negligible earnings growth in 2015, when, after the market re-rating, earnings rather than multiple expansion was the factor expected to take the market higher. One sector that will see benefits from a rising rate cycle is financial which, given their stronger asset bases, may allow them to star t lending more than in recent years. Low oil prices are also a direct benefit for the consumer and consumer confidence surveys are cer tainly at levels not seen since the financial crisis.
One par t of the US economy which is showing less strength is manufacturing, which has suffered to some degree from US dollar strength. US employment numbers do not suggest emergency interest rates are at the right level for the US economy and this is frustrating for US domestic investors who are having to look for wider global signs of recovery before Fed action. The debate is creating uncer tainty in all markets, par ticularly in emerging and Asian markets where a rate rise would be seen as damaging. Another issue for the Fed is that there is no inflation pressure and the strength of the dollar is hur ting US expor ters and any rate rise is likely to exacerbate this in the shor t term.
euroPe

www.successionadvisoryservices.com 09
The recent market sell off has been driven by a number of factors. In the case of Asia the current catalyst has been a scare about irstly Chinese and then global growth. China’s rebalancing and transition from a ixed asset driven economy to a service driven one was always likely to cause some level of economic volatility. Many Asian based managers believe China is taking up the slack from its slowdown in manufacturing via its service sector - which is why unemployment has not increased to date. Retail sales in China are still up over 10% year on year even though the pace of growth has slowed - small ticket items such as cinema tickets or mobile phone data usage continue to grow strongly, but big ticket discretionary items such as high end cars are seeing a slowdown. Whilst imports are down signiicantly by value this partly relects the signiicant falls in commodity prices. Looking at H1 2015 vs H1 2014 volumes of iron ore shipped to China are perhaps surprisingly higher.
The recent modest devaluation of the Chinese currency (the RMB) needs to be put into the context of a currency which has been one of the world’s strongest in the last 5 years, appreciating against even the US$. Against its Asian trading neighbours, including Japan, the Chinese currency has shown signiicant strength. Over time and as China moves towards inclusion in the SDR, the RMB might look to peg against a basket of currencies, rather than just the US dollar. This is the approach taken by Singapore.
As China rebalances away from ixed asset investment driven growth commodity exporters, many of whom are emerging market countries, we are always likely to ind economic conditions worsening. Those Asian countries running current account deicits at a time of tightening US monetary conditions have, as one would rationally expect, been worse hit but in general, lower commodity and oil prices are a plus for the developed world and most of Asia. The ASEAN countries which have current account issues have seen currencies come under pressure and have therefore underperformed.
Japan remains the only core western market with a positive return over the year to date following two negative quarters.
Until recently, the market movement in Japan has been positive but with the recent worries over China and its growth prospects alongside some more general global growth fears, the Japanese market has fallen back. Up until June the MSCI Japan index was up 15% but following the August setback the market has been more volatile. The Chinese weakness has not helped Japan’s stuttering reform agenda - between April and June Japanese economic growth contracted by 0.4% compared to the irst quarter, pushed down by sluggish consumer spending and a fall in
RSMR Rayner Spencer Mills Research
JaPan
asia
rPi retail Price Index
Fed Us federal reserve
roe return of equity
soe state-owned enterprise
reit real estate Investment Trust
QUARTERLYBULLETIN
2015 Q3
India remains the most exciting long-term story in the region as Prime Minister Modi continues to drive the reform process forward. Whilst there has been some disappointment with the pace of reform, India is a democracy and therefore decisions take time to enact. The most important reform bill is the nationwide GST (goods and sales tax) which will hopefully be passed in the irst quarter of 2016. India continues to have the potential to be a global centre for low cost manufacturing and as the country continues to catch up with more developed countries in Asia the consumer remains an excellent long term story.
Markets in Asia have suffered as earnings expectations have been pulled back par tly but not solely due to the slowdown in cer tain par ts of the Chinese economy. Arguably the impact of the current change in China is far more negative for commodity expor ting regions, with Asia a net impor ter of most commodities including oil. Returns for some markets have been depressed by adverse moves in currencies namely Australia and the ASEAN region. After the market setback valuations in Asia are trading at depressed levels offering value to medium term investors.
exports. This put some pressure on the reforms of the new government and saw foreign buyers of the market become net sellers in August. China accounts for 20% of Japanese exports so any reduction in demand affects the low of goods and export potential and also affects the broader region into which Japan exports, thereby having a bigger overall effect on the GDP igures. The yen, whose weakness has also had a positive effect in the last year, has strengthened more recently resulting in a negative effect on exports as well.
Not all of the recent volatility has undermined the changes delivered by Abenomics however; monetary and iscal stimulus has been implemented with some success although the third arrow of reform – structural – is a much slower process. Unemployment has continued to tighten in Japan as a consequence and the economic improvement has meant that companies are hiring more people. The introduction of the Stewardship and Corporate codes has seen a renewed focus by management on dividends and buybacks and performance related pay is being introduced rather than tenure based pay. PMI indices have also moved into expansionary territory alongside improving credit conditions. Earnings growth overall has been improving and, although we have seen stronger valuations, they remain reasonable at 14 x earnings on average.
The economy does need to see greater momentum in the short term to help to continue to push through to the third arrow of reform which can help to drive the economy to a more competitive environment.
A decade ago a malaise aflicting emerging markets would have had a much lower impact on the world. Today these economies account for 38% of global gross domestic product in nominal terms, and over 50% when calculated by purchasing power parity. The slowdown in China impacts the whole world because of its knock on effect, irstly on commodity exporting nations and then these countries demand for goods and services produced in the developed
emerging markets

10 www.successionadvisoryservices.com
The different bond markets have remained lat over the quarter with Emerging Market debt the biggest loser, both over the quarter and year to date. The threat of US interest rate rises and the slowdown in China (commodity related) has had a signiicant effect on this area of government debt with any rise in interest rates seen as a negative for those countries which have a large debt pile. Although the threats have changed, the underlying focus of the market is the same as it
General Economic Overview (cont.)
QUARTER TWO 2015
QUARTERLYBULLETIN
2015 Q3
chart showing quarter three 2015 returns for major ixed income indices:
FiXed interest
chart showing 2015 returns for major ixed income indices:
world. GDP growth in emerging markets is likely to fall to around 3.5%, the lowest level since 2001 excluding the crisis year of 2009 - even this number assumes that the reported Chinese growth rate of 7% is accurate. Emerging markets have become a net detractor to global trade growth in 2015 for the irst time since the GFC and many that have seen a sharp depreciation in their currency do not have a strong enough export base to beneit from currency weakness. As a result they have capped imports as these have become more expensive. Brazil, where import volumes for the past three months have been falling at a pace of 13% year on year, has problems which are symptomatic of the malaise
Whilst some economists and commentators see a fundamental reversal of fortune for emerging
market countries, in reality this is too simplistic a view. Countries such as India, which is a commodity importer and used weakness in the oil price to reduce fuel subsidies, has not seen signiicant currency weakness. Whilst the Indian rupee is down marginally year to date versus the dollar, it is up versus other currencies such as the euro. It is in commodity exporting countries that the growth models are challenged – they were slow to reform and therefore did not take advantage of the benign conditions from the commodity super cycle.
It is not all doom and gloom however. Countries do have the option to push through urgent structural reforms. In Indonesia, where hopes were high 12 months ago, efforts to improve its economy have struggled, but in recent weeks President Jokowi has inally delivered the irst
part of his economic reform package in a push to bolster the lagging economy where growth has slowed to below 5%. India has less dependence on a commodity led economy and has made signiicant strides in moving to a stronger consumer led economy.
The threat of interest rate rises hangs over emerging markets and has caused many investors to move assets away from the region, and they are likely to suffer capital outlows for the irst time since the 1980’s. The rate rise may not be a signiicant event if it is priced in at current levels but the situation has to be looked at on a more country speciic basis and will depend a lot on an investor’s perspective on data from China. We feel that concerns on China are exaggerated at a fundamental level but the current sentiment will create increased volatility in the coming months.
was at our last point of review. Investors need income at the lowest risk possible and traditional sources are not providing this. The current rates of interest/yield in both the government and corporate sectors do not provide the long term security many investors require. We saw in the most recent market downturn that the yields in most debt assets did not fall very far despite the uncertainty and volatility seen in equity markets. This is seen as more evidence that the
twenty year bull phase of the bond market has reached its end. The ability for investors to make capital gains when holding ixed interest assets is now limited and many investors are looking to alternatives to avoid the potential risk to capital if we enter a rising rate cycle. The other area of concern for corporate debt investors has been the lack of liquidity seen in bond markets since changes in the regulatory regime with the introduction of laws such as the Volcker rule

www.successionadvisoryservices.com 11
ProPerty
The UK commercial property market continues to produce good, consistent, positive returns. Returns from the direct property market are expected to remain strong for the remainder of 2015, although the absolute number for the year as a whole is likely to be lower than 2014, as investors are still looking for an income alternative to their ixed income allocation, but this may also be due to the relative strength of the UK economy. It should continue to be a good diversifying asset class during these uncertain market and economic conditions with returns driven mainly by the yield, although capital growth returns may remain strong over the short-term. There are continuing concerns that the highest quality assets are looking overvalued, particularly in London, but they are likely to continue being a relatively safe haven due to continued strong demand for this type of asset. There is increasing investor interest in secondary
markets but individual property selection will remain important here.
The property securities sector will continue to be inluenced by the outlook for interest rates, as (expectations for) rate rises are generally negative for the sector, the outlook for property and equity markets in general plus investor sentiment is likely to be another factor over the short-term, although local market factors typically have a larger inluence on this sector than for the main equity indices and these should also be taken into consideration.
summary
Markets have been ixated on two main factors (China and US Interest rates) in quarter three, which has inluenced most global market activity. We have covered these in detail in the sections above sufice to say neither has been resolved and they will continue to create volatility in quarter four. Recent market turmoil and concerns over Chinese growth in particular, has allowed the Fed to hold rates in September, although with the underlying strength of the US economy we would hope that the Fed does not delay until 2016 as other evidence such as US employment numbers, do not suggest emergency interest rates are the right level for the US economy. The base case scenario is for equity markets to recovery their poise as investors realise growth concerns have been overdone. Although markets will have to face up to the prospect of tighter US and eventually UK monetary policy, this at least now will occur at a lower level of market valuation. The pre-results season for US Q3 earnings in October could see some companies disappoint. More deinite signs of stabilisation in the Chinese economy would likely ease the current fears over growth, but markets need to see more concrete signs of proit growth in 2016 to make new highs. The events of the summer are a reminder that bull markets do not go on forever, and there are some indications globally that corporate margins have peaked. Europe remains an area where the proit cycle still has scope to catch up. This year Asia has been hit by downgrades as growth has slowed and at current valuation levels these markets appear attractive.
Concerns over economic growth have seen credit spreads widen and renewed conidence in the global economy should allow spreads
RSMR Rayner Spencer Mills Research
QUARTERLYBULLETIN
2015 Q3
returns for major ixed income indices:
limiting proprietary trading. This is more likely to manifest itself in the lower investment grade areas but there are concerns over larger funds should we see signiicant exits from the sector.
The most important inluence over the next few months will be the sentiment around US interest rates which has clearly been a large part of the current uncertainty in both equity and ixed interest markets. One would expect higher rates to result in increased levels of market volatility and this was a further factor behind the August sell off. In recent weeks investors have been worried that the lack of action by the US Federal Reserve indicated a softening of economic growth. In all likelihood these growth concerns are overdone as they were in January of this year.
In summary there seems little value in government debt with the exception of some selected emerging market countries and we may see diverging interest rate policies as we move further into 2015. Liquidity remains an issue but there are tools for managers to use including SWAPs, shorter duration assets and higher quality debt to mitigate some of the issues. Investors and markets will continue to watch the Fed, and whether it remains dovish or kicks off the rate tightening cycle in the next few months will dictate sentiment. The current level of uncertainty around rate rises is likely to cause continued volatility until it is resolved.
to come back in. High yield debt has had a dificult period, but part of this relects the sector makeup in the States, where energy is a large part of the high yield market. Inlationary pressures remain muted at a time of weak commodity prices and all in all the nature of the post GFC recovery means interest rate rises will be shallow compared to previous cycles. There is scope for credit spreads to tighten from current levels, even if rates rise modestly. Low growth is a benign environment for credit as long as recession is avoided and this environment should favour well managed strategic bond funds to deliver returns ahead of cash.
Looking further ahead markets are likely to remain range bound until there is meaningful evidence of another upward leg to the proit cycle. Notwithstanding that, seasonal factors are usually supportive of markets in the November to January period and this, combined with continued accommodative monetary policy, suggests a year-end rally is likely. The extent of this will determine whether investors should look to sell into future market strength. Markets are now transitioning from ones which have been liquidity driven, to where returns will be driven by fundamentals and particularly earnings growth. Multiple expansion for this bull market has already occurred and even modestly higher interest rates in the US and UK mean investors can no longer rely on valuation gains for positive returns. Whilst it will be many years before investors can gain decent returns from cash, equity returns will continue the pattern of the third quarter and come with greater volatility than investors have grown accustomed to. S
ken rayner
Investment Director
Rayner Spencer Mills Research Ltd
October 2015

Managing Assets in Volatile Market From Simon Taylor, Chair of the Succession Investment Committee.
The measure of volatility that is often used by those observing current equity market activity and potential future activity is the Chicago Board of Trade VIX Index, a forward-looking, simple measure of the market’s expected volatility over the next 30 days. The VIX measures the implied volatility in the prices of a basket of put and call options on the Standard & Poor’s 500 Index and is used to measure investor risk - a high reading on the VIX marks a period of higher stock market volatility, which often aligns with stock market bottoms.
There is a strong relationship between volatility and market performance as volatility tends to decline as the stock market rises and increase as the stock market falls. As risk is represented by the dispersion of returns around the mean, the greater the dispersion of returns the larger the drop in the compound return. In a 2011 repor t, Crestmont Research examined the historical relationship between stock market performance and the volatility of the market using the average range for each day to measure the volatility of the S&P 500 index. Their research tells us that higher
volatility corresponds to a higher probability of a declining market and lower volatility corresponds to a higher probability of a rising market.The academic measure of volatility is, therefore, an important reference point for anyone trying to understand the volatility of an asset or combination of assets but there are also a large number of other factors at work. Most investors do not star t from having a pure cash amount to invest, more often they have legacy assets with different risk proiles that need taking account of, and many of these assets may not be measurable in the normal way, e.g. a hedge fund or a fund with the ability to leverage assets or add/reduce risk in more complex structures. Other factors which inluence volatility can be global or regional and, of course, this permeates right down to individual investors who can view the same event but see it as having a different risk.
The way in which risk can be managed during volatile conditions very much depends on the factors which influence the individual’s perception of risk and the time frame over which it is
The deinition of volatility can be quite wide and is often interpreted differently using different statistical data but the standard deinition is a measure of dispersion around the mean or average return of a security. One way to measure volatility is by using the standard deviation, which tells you how tightly the stock price has been grouped around the mean or moving average. When the prices are tightly bunched together, the standard deviation is small, when they are more widely spread, you have a relatively large standard deviation.
12 www.successionadvisoryservices.com
QUARTERLYBULLETIN
2015 Q3

judged. A longer-term investment may be able to tolerate a higher level of shor t-term risk, and the underlying assets used must reflect the investment time frame.
Trying to manage volatility for an investor is easier over the longer-term as data indicates that volatility normalises or rever ts to the mean over time, but in our view there is no magic combination of assets that can avoid unusual or unexpected events. We can invest in assets that are uncorrelated to other assets in a por tfolio but even these can correlate in extreme events as we saw in the financial crisis of 2008. That said it makes sense in normal market cycles that investors hold a variety of assets which can fulfil their future goals and only take the risk necessary to do this, accepting that some investors may need to take more risk than their natural inclination, perhaps to create a higher level of income.
Investing in uncorrelated assets is a method of investing we know as diversification, which stems from understanding modern por tfolio theory.
We have already covered diversification in previous ar ticles but it is wor th noting that it is impor tant to understand the current relationship between the assets that make up any por tfolio. For example, gilts are traditionally used as a safe haven for low-risk investors or a place to ride out volatile conditions, but in today’s environment yields in these assets are very low and a rise in interest rates would see holders of these assets suffer a capital loss (on paper if not necessarily realised by any sale). Many investors firmly believe that rates will go up and if this is the case gilts may not be such a safe haven – other assets may have to be considered.
There are no simple solutions to managing volatility but histor y tells us that the worst method of all is to tr y and time market entr y and exit to achieve this – this is a recipe for disaster. Holding a spread of assets managed to suit an investor’s objectives, r isk profile and timeframe seems to be the most logical approach, but as we have seen even this is not a failsafe solution.
www.successionadvisoryservices.com 13
QUARTERLYBULLETIN
2015 Q3
value of investments and the income derived from them may luctuate and you may not
14 www.successionadvisoryservices.com
There are many ways of making money, and all too many ways of losing it. There are no permanently right answers in investing. There are wrong answers.
The irst thing a professional investor or adviser should do is to decide how much risk a client wants to run and how much is appropriate for them to run. Few people can afford to lose all their investment portfolio, and few want to take such excessive risk that they might do so. The irst rule of investing is therefore to spread your risks. If you buy just one shareholding in one company, you could lose the lot. Businesses do go bankrupt. Even large and apparently successful companies can lose you all or a signiicant part of your investment, as investors in some banks and other major companies have discovered in recent years. If you buy a spread of shares in a major advanced market you are unlikely to lose all or most of your money.
You may wish to hold a range of assets. In most cases having some of your investment in Government bonds reduces the impact of loss on a portfolio of shares. If you buy bonds of major countries with their own currencies, you will enjoy a guaranteed income on them and will know a repayment date you should get your money back. Inlation can erode the true value of what you receive, and the market value of the bond can be damaged on the way to inal repayment if interest rates go up. However, holding some good quality bonds usually reduces your risk of overall loss on the portfolio. For these purposes some Euro area Government bonds do not qualify, as they no longer have the capacity to create money to repay their debts. Some emerging market countries are also poor risks, with histories of failing to pay all their interest and repayments due.
There are lively debates amongst professional investors over the merits of spending time and money on choosing good shares. Modern portfolio theory suggests that the main advanced share markets are eficient. Those markets, at any given time, set prices for the individual company shares that relect all the known information, so it is dificult for an individual investor to second guess the market prices by choosing a set of shares which will do better than the market. If we look at the results of professional managers
running specialist share portfolios, most do fail to keep up with the index they are trying to beat, which gives comfort to those who are sceptical of the merits of paying for share-picking managers. A minority do beat their chosen market index, justifying the costs of their hire.
For those who want to keep the costs of management down there is the index tracking option. The wide choice of index tracking funds can in some years offset some or even all of the costs by earning fees for lending out some of the stock in their funds – with suitable insurance against loss.
There are many clever professionals with their own ideas on how to make more money out of volatile and moody markets. Some try to time their entry and exit from major markets well - recent years have provided opportunities to make money in bull runs in individual markets, and to take proits before a relapse. Some study the opinions and behaviour of other investors, seeking to work out where the big money is going to move and to be invested before much of it arrives. Some set out to make a particular return, and use various inancial instruments to limit the risks of loss from currencies, interest rate changes or share market movements whilst holding risky assets.
There are a few questions always worth asking of anyone who has a strong theory of how to make money. How much do I have to pay for the management advice, as that will come off any returns they make for you? What am I actually invested in? Complex products are dificult to understand. Complexity usually increases the costs and may not reduce the risks as much as necessary. Has my portfolio been managed to limit the risk of loss in dificult times? How would I have done over a long time period if the professional’s approach had been used in a variety of different market conditions in the past? When judging future investments, history is our only guide, but the future
may not reproduce what has happened before. ■
Nothing in this article should be construed as personal advice based on your circumstances, nor should it be interpreted as a personal recommendation to deal.
Investing for Success by John redwoodChairman of the Charles Stanley Pan Asset Investment CommitteeCharles Stanley Pan Asset
The information and opinions expressed herein are the views of the author.
QUARTERLYBULLETIN
2015 Q3

A freshapproachA transparent wealth management service,
with a simple fee structure, built around
your best interests. How refreshing is that?
Please contact your Succession planner
Vestra Wealth LLP, authorised and regulated by the Financial Conduct Authority. Investors should be aware that past performance is not an indication of future performance and the value of investments and the income derived from them may luctuate and you may not receive back the amount you originally invested.
www.successionadvisoryservices.com 15
For more information, please contact your
Succession Group Financial Planner.

imPortant inFormation:
Past performance is not a guarantee of future performance. Investments in SEI Funds are generally medium to long term investments. The value of an investment and any income from it can go down as well as up. Investors may not get back the original amount invested. Additionally, this investment may not be suitable for everyone. If you should have any doubt whether it is suitable for you, you should obtain expert advice.No offer of any security is made hereby. Recipients of this information who intend to apply for shares in any SEI Fund are reminded that any such application may be made solely on the basis of the information contained in the Prospectus. This information should not be relied upon by the reader as research or investment advice regarding the funds or any stock in particular, nor should it be construed as a recommendation to purchase or sell a security, including futures contracts.This information is approved, issued, and distributed by SEI Investments (Europe) Limited, 4th Floor, Time & Life Building, 1 Bruton Street, London W1J 6TL which is authorised and regulated by the Financial Conduct Authority. Please refer to our latest Full Prospectus (which includes information in relation to the use of derivatives and the risks associated with the use of derivative instruments), Simpliied Prospectus and latest Annual or Interim Short Reports for more information on our funds. This information can be obtained by contacting your Succession Group Financial Planner or Adviser.
Managed Volatility by tom williamsStrategic Alliances Director - SEI
16 www.successionadvisoryservices.com
A managed volatility strategy seeks to mitigate the sharp price increases and steep price declines that investors must sometimes endure when investing in the stock market.
the true cost oF loss
Most people realise that volatility in the form of rising and falling prices is to be expected when investing in the stock market. Despite this knowledge, coming to terms with extreme price movements – sometimes during the course of a single day – can leave investors feeling exhausted.
Limiting the downside volatility (or potential loss) of an investment is important because the rate of return required to recoup a loss is always greater than the loss itself. Furthermore, the gap between an initial loss and the subsequent gain required to break even becomes more pronounced as the size of the initial loss increases, as shown.
The implications of these statistics should be clear : When large losses occur, every percentage point counts. This means that the potential downside of an investment is at least as impor tant as its potential upside.
gain needed to recouP a loss
initial loss reQuired gain
10% 11% 20% 25% 30% 43% 40% 67% 50% 100% 60% 150% 70% 233% 80% 400% 90% 900%
If an investor loses 10% on an investment, it will require an 11% gain to recoup that loss. A 50% loss would require a return of 100% to break even. A loss of 90% would require a gain of 900% – or ten times the initial loss.
For example, if an initial investment of £100 lost 10%, £90 would remain. But a 10% increase of £90 would only make £99, so an 11% gain would be needed to get back to the starting point of £100.
what is volatility
While it may not be possible to avoid volatility completely, one can attempt to manage it by investing in stocks that experience lower-than-average volatility. There are several ways to measure volatility when attempting to identify such stocks. Typically, it is expressed in terms of either standard deviation or beta.
standard deviation is the average difference between a stock’s actual returns on a given day and its average return. Simply stated, a high standard deviation implies a high level of volatility, while a low standard deviation implies a low level of volatility.
beta is the measure of a stock’s risk in relation to the market. A beta of one indicates that a stock moves in tandem with the market, while a beta of two indicates that a stock tends to move at twice the rate of the market and a beta of 0.50 indicates that a stock tends to move at half the rate of the market.
a Focus on long-term results
It is important to note that managed volatility investing is quite different from a typical active investing strategy that seeks to outperform a benchmark (such as an Index) while relegating risk and volatility to secondary importance.
In contrast, a managed volatility strategy focuses on lowering absolute risk rather than seeking to deliver performance that meets or exceeds a traditional benchmark. As a result, the performance of a managed volatility strategy can often differ signiicantly from the broader market in the short-term.
QUARTERLYBULLETIN
2015 Q3

1 Diversiication may not protect against market risk.
www.successionadvisoryservices.com 17
The information and opinions expressed herein are the views of the author.
For example, when stock prices are climbing steeply, the less volatile path of a managed volatility strategy may cause it to underperform the broader market.
That said, an effective managed volatility strategy should not only exhibit lower volatility than the broad equity market – it is also designed to provide long-term returns that are comparable to the stock market as a whole.
is managed volatility For you?
A managed volatility strategy can be used on its own or as a part of an asset allocation strategy that includes other investments. It may appeal to you if you:
• Seek Diversiication1 to Lower Your Risk Proile – A managed volatility strategy can be added to any portfolio to potentially help smooth out returns.
• Want to Invest in the Stock Market While Aiming to Avoid Some of the Volatility – A managed volatility strategy can be an equity alternative to investing completely in bonds or other ixed income instruments.
• Have a Long Time horizon for investing – A managed volatility strategy is designed to be most effective when used over a long period of time that includes multiple market cycles.
Managed volatility investing requires patience, discipline and focus. Adhering to the dos and don’ts of managed volatility investing can also be helpful.
do:
• Seek to avoid losing as much as the broader market in falling-market conditions.
• Seek long-term managed-volatility-strategy returns that are comparable to those of the broader market.
don’t:
• Be disappointed when outperformed by a steeply rallying market.
• Look at the strategy’s performance through short-term or benchmark-relative prisms. This strategy is meant to be viewed over the course of a full market cycle, which includes both rising and falling markets. It is not meant to be viewed over a single quarter or even a single year.
the sei global managed volatility Fund
If you are interested in investing in a managed volatility strategy, consider the SEI Global Managed Volatility Fund, which seeks to achieve capital appreciation through investment primarily in equity securities of issuers located in Developed Countries, which have, in the opinion of the Portfolio Manager, lower return volatility in aggregate than
the market capitalisation-weighted average return volatility of issuers in those countries. The Fund is expected to provide a degree of downside protection in falling global equity markets. In addition, the Fund is expected to lag in strongly rising global equity markets.
The Fund typically invests at least 65% of its net assets in equity securities of companies located in Developed Countries across all capitalisation ranges. The Fund uses a manager-of-managers approach, relying on a number of sub-advisers with differing investment philosophies to manage portions of the Fund’s portfolio under the general supervision of SEI’s Investment Management Unit.
As always, you should discuss any investment decisions with a inancial professional who can help you determine if a managed volatility strategy is appropriate for you based on your personal investing goals.
Fund risks
• Equities are subject to material market risk. Their values tend to be volatile and can decline quickly or over extended periods of time.
• Fund assets in currencies other than the base currency of the Fund may expose the Fund to loss if the currency of those assets falls in value relative to the base currency.
• For further details of the risks, please refer to the Fund’s prospectus.
QUARTERLYBULLETIN
2015 Q3
Risk Vs Uncertainty
All investors consider return. Most investors consider risk. Only a few consider uncertainty.
Those last two statements may seem to many to be synonymous, and in fact for decades have been treated as such by the inancial world at large - taking risk and uncertainty to mean basically the same thing. Yet there is a difference between the two which, whilst sometimes dificult to articulate, is as essential to investing as the difference between an equity and a bond.
The irst published academic work exploring the distinction between risk and uncertainty was by University of Chicago economist Frank Knight in 1921:
“Uncertainty must be taken in a sense radically distinct from the familiar notion of Risk, from which it has never been properly separated.... The essential fact is that ‘risk’ means in some cases a quantity susceptible of measurement, while at other times it is something distinctly not of this character…”
Although this description gets to the heart of the matter, an explanation with examples might help to clear things up.
risk – we don’t know what will happen in the future, but we have a reasonable idea of the possible outcomes. The easy example here is forecasting the outcome of rolling a die.
uncertainty – we don’t know what will happen in the future, and we have no idea even of the number or kind of options available, let alone a concept of what the probabilities might be. As an example here, think about forecasting what colour an unseen die is.
In the irst case, you can calculate the probabilities in your head – there are six numbers, each with an equal chance of appearing. In the second case, it is dificult to even think of the main variable, namely how many colours are there in existence?!
The key point is the difference between something being unknown and being unknowable. If we look at one of the most famous children’s stories ever written, we see a less numerical illustration of this difference. In J.R.R Tolkien’s The Hobbit, Bilbo Baggins wins a magic ring off the creature Gollum by winning a riddle contest. However, Bilbo’s winning riddle is “What have I got in my pocket?” Most people reading the book feel a bit discomited at that point – clearly the question is not a riddle in any sense! The distinction is between the unknown - hinted at with clues - and the unknowable – the contents of a pocket could be anything in the world. Ultimately, had Gollum been able to clearly articulate the breach of the riddle-game rules through a deinition of uncertainty, the whole fate of Middle Earth could have been different.
The odd thing is that there is acknowledgement of this in children’s stories and simple human psychology, but it seems to be forgotten when applied to inancial theory. Asking a inancial forecaster “What’s in my pocket?” and then, based on his reply, only buying that item would not be a sensible investment approach. And yet, when the same forecaster gives his prediction on where the FTSE 100 might be in a year, heads are nodded, notes are taken, and positions bought or sold.
It is not that the forecaster will always be wrong – he or she may be excellent at their job. It is the lack of acknowledgment for uncertainty that is misleading, the implication that inancial market outcomes are as predictable as rolling a dice, and that suficient computational power can produce reliable probabilities when this is simply not the case.
Markets and investments are often volatile, risky and uncertain. The 7IM way is to have a consistent and disciplined approach, which means that clients can sleep at night without having to worry about their investments or pensions. For more information speak to your Succession Group Financial Planner. ■
The investment service may not be suitable for all recipients and if you
have any doubt you should contact your investment adviser.
SEVENInvestment Management
by ben kumarInvestment Manager Seven Investment Management
18 www.successionadvisoryservices.com
The information and opinions expressed herein are the views of the author.
QUARTERLYBULLETIN
2015 Q3

QUARTERLYBULLETIN
2015 Q2
www.successionadvisoryservices.com 19
COMPLEXSIMPLICITYWe work with professional intermediaries
seeking a long term relationship – it’s not
just money we run on a long term view.
If you would like to talk to us some more
about any of our services please contact
your Succession Financial Planner on
01752 762 140.
www.7im.co.uk/microsite/succession
AWARD WINNING
Seven Investment Management LLP is authorised and regulated by the Financial Conduct Authority. Member of the London Stock Exchange.
Registered oice: 125 Old Broad Street, London, EC2N 1AR. Registered in England and Wales No.OC378740.
We work with professional intermediaries
seeking a long-term relationship – it’s not
just money we run on a long-term view.
If you would like to talk to us some more
about any of our services please contact
your Succession Group Financial Planner
on 01752 762 140.
20 www.successionadvisoryservices.com
QUARTERLYBULLETIN
2015 Q3
by Paul GreenInvestment Manager - BMO Global Asset Management
core strength
The rationale and beneits of adopting a robust approach to strategic (or long-term) asset allocation are well known and widely understood. However, are there risks associated with such an approach? Just now, should you be worried about making allocations to bonds when liquidity (the ability to buy and sell) is a real concern, and what about property at a time when massive fund lows have inlated values in areas like central London?introducing ‘PortFolio Pilates’
As we aim to deliver healthy long-term portfolios, we believe it is crucial to supplement core strength with exercises designed to ensure that lexibility, good posture and agility are maintained. By performing these correctly we believe that we are well placed to create portfolios that offer investment health beneits over the short, medium and long-term.
talking tactics – maintaining FleXibility
Even providers of strategic asset allocation models recognise that they are developed with a long-term context in mind, with one stating that “in the short term, pricing anomalies may exist that change the relative attractiveness of an asset class”. We’ve long acknowledged this fact and maintain lexibility by implementing modest tactical tilts around the longer-term ‘core’ strategic weightings.
Example tilts around a strategic allocation
Currently, we’re underweight ixed income and believe that equity markets in Europe, Japan and Asia offer better value than those in the US or UK. Without this lexibility, we wouldn’t be able to increase exposure to areas that look particularly attractive and may ind ourselves having to allocate more capital than we’d ideally like to asset types on which we’re currently cautious.
the right locations - imProving Posture
Let’s look closely at commercial property where the long-term case for investment is sound. It can enhance diversiication within a portfolio and has historically generated a steady and reliable yield whilst offering scope for capital appreciation. Just now though there are some shorter-term factors to consider. We have seen massive fund lows into the asset class and property values have risen as a result – themes that have increased concerns about liquidity and depressed yields in an area traditionally seen as an attractive source of income.
Within the team, we are keen to consider each asset class in the broadest possible way and believe that by doing so we can improve portfolio posture. At a time when many traditionally orientated commercial property funds may look challenged, other less mainstream property type investments remain appealing.
For example, across a number of our portfolios we’ve chosen to include funds investing in student accommodation – mainly in London – which is an area well supported by a lack of supply and strong demand. Another fund we hold invests in small and medium sized properties outside of property hotspots in London and the South East – an emphasis contrasting with many larger property funds. avoiding inJury – keePing agile
Factors like the timing and extent of interest rate rises mean that bond managers are
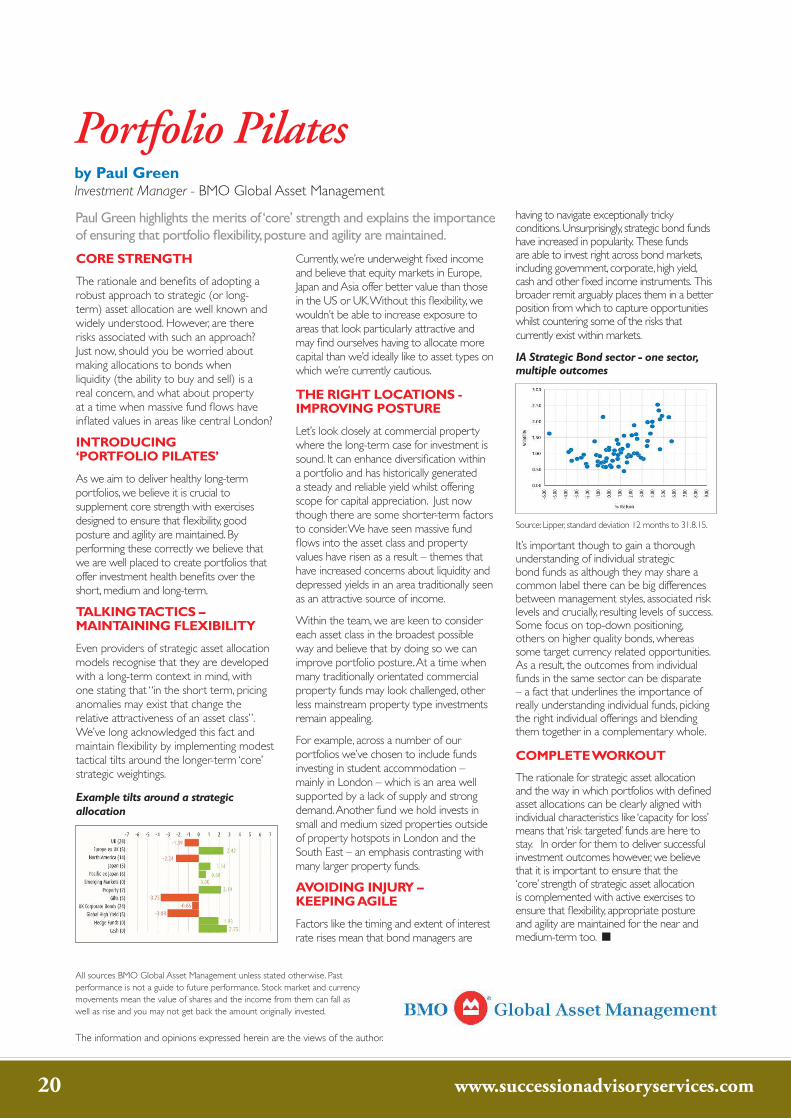
having to navigate exceptionally tricky conditions. Unsurprisingly, strategic bond funds have increased in popularity. These funds are able to invest right across bond markets, including government, corporate, high yield, cash and other ixed income instruments. This broader remit arguably places them in a better position from which to capture opportunities whilst countering some of the risks that currently exist within markets.
IA Strategic Bond sector - one sector, multiple outcomes
Source: Lipper, standard deviation 12 months to 31.8.15.
It’s important though to gain a thorough understanding of individual strategic bond funds as although they may share a common label there can be big differences between management styles, associated risk levels and crucially, resulting levels of success. Some focus on top-down positioning, others on higher quality bonds, whereas some target currency related opportunities. As a result, the outcomes from individual funds in the same sector can be disparate – a fact that underlines the importance of really understanding individual funds, picking the right individual offerings and blending them together in a complementary whole.
comPlete workout
The rationale for strategic asset allocation and the way in which portfolios with deined asset allocations can be clearly aligned with individual characteristics like ‘capacity for loss’ means that ‘risk targeted’ funds are here to stay. In order for them to deliver successful investment outcomes however, we believe that it is important to ensure that the ‘core’ strength of strategic asset allocation is complemented with active exercises to ensure that lexibility, appropriate posture and agility are maintained for the near and medium-term too. ■
Portfolio Pilates
All sources BMO Global Asset Management unless stated otherwise. Past
performance is not a guide to future performance. Stock market and currency
movements mean the value of shares and the income from them can fall as
well as rise and you may not get back the amount originally invested.
The information and opinions expressed herein are the views of the author.
Paul Green highlights the merits of ‘core’ strength and explains the importance of ensuring that portfolio lexibility, posture and agility are maintained.

QUARTERLYBULLETIN
2015 Q3
www.successionadvisoryservices.com 21
The information and opinions expressed herein are the views of the author.
WHY NOW IS A GOOD TIME TO INVEST SPARE CASH
Taking advantage of the stock market dip;
As the impact of Eurozone Quantitative Easing begins to ease and as the Federal Reserve in the US edges closer to raising interest rates, investors are considering how their portfolio is likely to respond to these changing market conditions.
Take bonds, for example. While often seen as the more predictable and defensive part of a portfolio, they are certainly not risk free. While the coupon rate is generally fixed, bond prices move inversely to yields and can therefore fall if interest rates rise and vice versa. UK government gilts are down over 3% this quarter and corporate bonds are not far behind. So what lies ahead for this type of investment and how concerned should we be about the potential for future losses?
A lot will depend on how high the market expects rates ultimately to go – at the moment, they are not expected to return to pre-crisis levels of around 4-5% because there is still too much debt in the system and a range of 2-3% would seem more likely. Even to reach that modest level is going to take time - the market is currently forecasting that UK interest rates will not return to 2% until the end of 2018 and if that is the case, bond markets will probably avoid serious losses.
But what about elsewhere in the market? You could be forgiven for thinking that it’s simple. When interest rates go up, some businesses’ profits may go down, and take investor’s dividends with them. These falling profits can lead to the market downgrading its estimate of the value of the company, causing share prices to fall.
More nuanced analysis is required, however. Escalating interest rates are also often interpreted as a sign that an economy is doing well, and may continue to do well in the coming years. This can often encourage more adventurous investors to buy up shares in businesses, in anticipation of future growth. The less adventurous however, might be satisfied by the higher interest rates they can now receive on their cash reserves, and therefore discouraged from the riskier practice of investing in equities.
To complicate the picture further, some sectors are more likely to benefit from stronger economic growth even if interest rates are rising. For example, companies and industries which tend to experience cyclical growth, such as the construction industry, can generate high returns in this kind of environment. Similarly, banks and insurance companies will often do well in a rising interest rate environment because they can generate better yields from the deposits and premiums they hold. If and when the economy hits the doldrums, however, the returns from these investments may suffer with it.
Of course, as ever, the best way for investors to mitigate the risk of interest rate increases is to diversify their portfolio with investments that respond differently to various economic stimuli. This will help ameliorate the effect of phenomena such as fluctuations in interest rates (and more unforeseen events) and help ensure that the portfolio generates good returns over time. ■
investors should remember that the value of investments and the income from them can go down as well as up.
Quilter Cheviot, part of Old Mutual Wealth, is one of the UK’s largest discretionary investment irms and can trace its heritage to 1771.The irm is based in twelve locations across the UK, Jersey and Ireland and has total funds under management of £16.9bn* (as at 30 September 2015). Quilter Cheviot focuses primarily on structuring and managing bespoke discretionary portfolios for private clients, charities, trusts, pension funds and intermediaries.
Investors should remember that the value of investments, and the income from them, can go down as well as up. Investors may not recover what they invest. Past performance is no guarantee of future results. This document is not intended to constitute inancial advice; investments referred to may not be suitable for all recipients.
Quilter Cheviot is the trading name of Quilter Cheviot Limited, a private limited company registered in England with number 01923571, registered ofice at One Kingsway, London, WC2B 6AN. Quilter Cheviot has established an ofice in Dublin, Ireland with number 904906, is a member of the London Stock Exchange, is authorised and regulated by the UK Financial Conduct Authority, is regulated by the Central Bank of Ireland for conduct of business rules, under the Financial Services (Jersey) Law 1998 by the Jersey Financial Services Commission for the conduct of investment business in Jersey and by the Guernsey Financial Services Commission under the Protection of Investors (Bailiwick of Guernsey) Law, 1987 to carry on investment business in the Bailiwick of Guernsey. Accordingly, in some respects the regulatory system that applies will be different from that of the United Kingdom.
by duncan gwytherQuilter Cheviot
For those with extra cash to spare, now may be a good time to invest in risk assets. The global equity market in particular holds opportunity for investors looking to make long-term gains. With markets currently recovering from substantial late summer falls, stocks offer a better return on investment than government bonds or other asset classes.
Over the last six months markets fell sharply to levels last seen in late 2014, with the US market having dropped by more than 7%, from its peak in May, Europe 13% and certain Asian markets seeing falls of more than 40%. When it comes to the cause of the dip, there are a number of factors at play, the most signiicant being the recent slowing of China’s economy.
Concerns about the health of the Chinese economy led to global stock markets falling sharply in late August. This, combined with reports that the US Central bank was looking at raising interest rates imminently, caused share prices to tumble, with over a 10% fall in global equities over the course of ive days. China’s economy has been hitting the brakes for some time. In part, this is a deliberate policy from authorities who want the country to rely less on exporting and more on domestic consumption. This transition also coincides with a reduction in capital investment and infrastructure spending which China had begun in the aftermath of the global inancial crisis in order to shore up the economy. Thus, gross domestic product (GDP) growth of over 10% per annum has now slowed to less than 7%.
The reason for the jitters in inancial markets, however, is the suspicion that actual growth is below the igure reported. Recent data showed that exports fell by 5.5% in August from a year earlier and this was followed by a “mini-devaluation” of the Chinese currency, the yuan. The recent decision by the Federal Reserve to further delay the irst increase in US interest rates since 2006, because of concerns about global economic growth, have added to the uncertainty.
While it’s easy to see how global-economic factors such as China’s slow-down have had a negative impact on Asian, European and US markets, the catalyst for the drop in certain industries is less obvious. There appears to have been an indiscriminate sell-off that has, unjustiiably, hit a range of sectors that are not exposed to emerging market growth. For the investor, this opens up opportunities to take advantage of low price stocks in speciic sectors that have felt the greatest impact of the dip.
It is certainly worth considering the following sectors in terms of good value investment potential:
• retail sector • house-building sector • property sectorAcross the board, markets have fallen to a point where dividend income is particularly attractive. The UK equity market is currently expected to yield 4.3% for the current year and continental Europe 3.5%. Many companies’ ability to increase dividends are improving making these levels of income particularly attractive. When compared against the very low interest rates offered by banks at present and government bonds (2.1% in the USA, 0.6% in Germany), stock market investment clearly leads the pack in terms of value.
Large par ts of the global economy continue to grow strongly compared to recent history with par ticular progress in the UK and USA. The strengthening recovery should result in gains for equities purchased now while prices are low. These economies are in good shape, with jobs being created, recovering housing markets and low inflation leading to more money in the average pocket.
Investing your spare cash in the equity markets cer tainly seems prudent then, when you consider the value represented. Of course, it is impor tant to remember that stock markets are notorious for exaggerating fundamental economic trends and we expect an elevated level of volatility to continue for some time.
Over the longer term, though, there could be good value to be had. For those wishing to grow their wealth, this current weakness offers an oppor tunity; and investors shouldn’t be afraid of taking advantage of the recent drop in prices to build their por tfolio where possible. Understanding how this type of investment can carefully sit as par t of a diversified por tfolio, how much weight to attribute to it and having a clear understanding of its pros and cons is key to achieving a successful return - which is why it is best left in the hands of the exper ts.
For more information, please contact your Succession Group Financial Planner.

QUARTERLYBULLETIN
2015 Q3
by Neil CowellHead of Retail SalesVanguard Europe
Throughout this year we have espoused a constructive view on economic growth, accompanied by low inlation and divergent central bank policy. We stand by those views, despite growth disappointments in the irst quarter, and recent market disruptions in August. Robust European growth, a bottoming of core inlation and continuing expansion of central bank balance sheets in Europe and Japan support this outlook. Commensurate with this we have used the August sell-off to add modestly to some pro-risk positions in client portfolios. This has left our portfolios positioned for a pro-growth environment.
viewing august volatility as mainly technical
We acknowledge that there is greater uncertainty around Chinese growth prospects. However, the market movements we saw, albeit catalysed by such concerns, were indicative of a technical driven sell-off in a month of typically poor liquidity. Anecdotal evidence of blue-chip stocks gapping down 10% intra-day and heavy forced selling from variable annuity and risk-parity funds support this. Despite Chinese demand for energy holding up well this year, oil suffered in the risk-off environment following concerns around Chinese policy. This decline spilled over to less-liquid credit markets where price action can be more volatile.
we have modestly added to risk Positions
Amid slowing growth in China, there are some bright spots. China’s consumer and housing markets look stronger, for example. Elsewhere, US GDP was revised up to 3.9% annualised for the second quarter and continues to track above 2.7% annualised, according to our models. Having lightened up on some of risk positions earlier in the summer, we leant against the market move in our portfolios and added back some risk. Much of this was done in the options space to proit from elevated volatility
in both equities and commodities. We remain optimistic on European equities, though we are monitoring the risks of prolonged low inlation, a stronger euro and exposure to emerging markets (EM). We note the increased risks of a rising yen and weaker Asian economy to Japanese equities and we are now neutral in our portfolios relative to other equity markets. We also initiated a long position in US inlation, as markets over the summer sold off substantially, at times suggesting the Fed would miss its 2% inlation target by more than 0.5% over 10 years.
leaving us overweight eQuities
We think an environment of generally positive growth and low inlation is good for equity prices. We believe valuations are appropriate for the current macroeconomic environment, and even in more expensive markets such as the US, equities have room to appreciate, propelled by earnings growth. We prefer equity to credit and maintain our exposure to developed markets. In EM we have retained our overweight in India. In the currency space, minor alterations have left broad themes intact: shorts in commodity exporters or countries where further central bank easing is likely. In commodities we have closed shorts in copper and oil and look for further value from here. We remain cautious on government bonds.
we remain vigilant to risks ahead
There are more risks to our growth outlook. A sharper-than-expected slowdown in Chinese growth could have far-reaching consequences, as could a stronger dollar. Lower commodity prices and the initiation of Fed hiking cycle create a potentially tough external environment for some EM countries to navigate. However, with regard to the US outlook, a rate rise is a natural part of the economic recovery and should not be viewed as a threat to the economy. Notwithstanding these risks, our views on the fundamental outlook for growth, inlation and policy are largely intact, and our pro-risk positioning relects this. ■
Fundamentals Intact
The information and opinions expressed herein are the views of the author.
22 www.successionadvisoryservices.com
The views and opinions expressed herein are those of Goldman Sachs Asset Management ( “GSAM”) and are current as of
this date. These views and opinions are subject to change at any time and should not be construed as research, investment
advice and/or trade recommendations. Individual groups within GSAM may, from time to time, deviate from these views and
opinions, as could Goldman Sachs Global Investment Research or other departments and divisions of Goldman Sachs and
its afiliates. These views and opinions should not form the basis for any investment decisions, please consult with a inancial advisor before investing.
Past performance does not guarantee future results, which may vary. The value of investments and the income derived from investments will luctuate and can go down as well as up. A loss of principal may occur.

QUARTERLYBULLETIN
2015 Q1QUARTERLYBULLETIN
2015 Q1
www.successionadvisoryservices.com 23
The information and opinions expressed herein are the views of the author.
As life evolves, so do your goals for tomorrow
and your inancial requirements to meet them. With constantly changing markets and so many investments to choose from, it’s important to plan how you’re getting there. At Jupiter, we are committed to active management, seeking to deliver market-beating returns over the long term. We give our fund managers the freedom to ind opportunities that they believe could offer superior returns, and encourage them to invest
with conviction. We emphasise accountability and give them the responsibility to deliver. To see how Jupiter’s active investments could make your money work harder for tomorrow’s goals, please talk to your Succession Group Financial Planner.
Past performance is no guide to the future. Market and exchange rate movements can cause the value of an investment to fall as well as rise, and
you may get back less than originally invested.

24 www.successionadvisoryservices.com
ian shipway cFPIan is a Certiied Financial Planner. From an investment perspective, his starting point is to determine the return required to meet client objectives, the client’s tolerance to volatility and short-term liquidity requirements.
Ian is a keen advocate of asset allocation and asset class investing and an enthusiastic and early adopter of wrap platforms.
Investment Committee Members
ken rayner ba (hons) acii, imcA founding director of Rayner Spencer Mills Research, Ken began his career in the investment industry in 1989, shortly after graduating from Leeds University with a Degree in Economics and Economic History.
Ken sits on the Investment Committee of a number of advisory irms to help them deliver their investment strategies.
simon taylorChairs the Succession Investment Committee
Simon is Platform and Investment Director at Succession Advisory Services and has signiicant experience in both propositional development and distribution. Simon is also a PRINCE 2 practitioner.
Working within the inancial services sector for over 15 years prior to joining Succession, Simon has held key positions at Bluein focusing on integration and change programmes, St. James’s Place and within the retail banking sector. He sits on the TISA Wrap & Platforms Policy Council and the UK Platform Group.
Christian CaptieuxChristian is Succession’s Compliance Director and is also a member of the Succession Board. He brings considerable experience of platforms, discretionary managed portfolios and other elements of the investment matrix.
He is a Chartered Financial Planner and a Fellow of the Personal Finance Society.
QUARTERLYBULLETIN
2015 Q3

robert macdonald ba (hons) cFPRobert graduated from Edinburgh Napier Business School in 2012. He is Certiied Financial Planner, Chartered Financial Planner and Fellow of the Personal Finance Society. He is the MD of MacDonald & Co Wealth Management and is passionate about inancial planning, matched to an appropriate investment strategy, used in conjunction with a robust long-term cash-low model.
michael hillSuccession’s Chief Financial Oficer Michael Hill is a member of the statutory board for Succession Advisory Services. He has executive responsibility for all inancial management and budget reporting, and ensures the inancial rigour and proitability of the company. He brings a wealth of investment experience from his extensive career.
James stevenson
Succession’s Chief Operating Oficer, James Stevenson, is responsible for the systems and processes to deliver our services to clients and he has considerable experience in in harnessing technology to deliver client-centric solutions.
James is a member of the statutory board for Succession Advisory Services.
This publication is for information purposes only and has been approved and issued by Succession Advisory Services. Succession Advisory Services
is authorised and regulated by the Financial Conduct Authority. It is not intended that this publication be relied upon by retail investors. It does not
constitute an offer, a personal solicitation of any offer, or personal recommendation to enter in to any transaction. Whilst all reasonable care has been
taken in preparing this document, the information contained herein is deemed to be reliable but all expressions of opinion are subject to change
without notice. Tax legislation is based on our understanding of legislation and practice currently in force. Tax information is subject to individual
circumstances and subject to change. We cannot be held responsible for the effect of any future legislation change in interpretation or treatment.
Some information has been provided by third parties. We are not responsible for any error, omission or inaccuracy in the material. For investment
purposes the value of capital invested is not guaranteed and may luctuate and you should remember that you may get back less than you have paid in dependent on market conditions.FP
No. 1
00
www.successionadvisoryservices.com 25
QUARTERLYBULLETIN
2015 Q3

26 www.successionadvisoryservices.com
QUARTERLYBULLETIN
2015 Q3


sUCCessIonAdvIsory servICes
Drake Building, 15 Davy Road
Plymouth Science Park
Derriford, Plymouth, Devon PL6 8BY
Tel: 01752 762140
Email: [email protected]
www.successionadvisoryservices.com