invest in japan178 listed companies settlement of accounts (april-december ) fy2007 2008 2009 2010...
TRANSCRIPT

Invest in Japan
May 2014
Norihiko Ishiguro
Vice-Minister for International Affairs
Ministry of Economy, Trade, and Industry 1

Outline
1. Overall Picture of Abenomics and the
Current Japanese Economy
2. Attractive Investment Environment
3. New Business Chances Provided by the
Growth Strategy of Abenomics
4. Government Incentives for Global
Companies
2

1. Overall Picture of Abenomics and the
Current Japanese Economy
2. Attractive Investment Environment
3. New Business Chances Provided by the
Growth Strategy of Abenomics
4. Government Incentives for Global
Companies
3
Outline

Downward
Spiral
Anxiety about the Future
Increasing Domestic Saving
Continued Deflation
→Decline in Expected
Growth Rate
Slumping Domestic
Consumption
Worsening
Employment Situation → Decline in Labor Income
Sluggish Capital Investment
Stagnated Corporate Profits
4
Virtuous
Cycle
Expanding High-Quality
Employment
→Improving Labor Income
Exit from Deflation
→Expansion of
Expected growth Rate
Active Capital Investment
Increasing Corporate profit
Revitalizing Domestic
Consumption
Overcoming Anxiety
of the future
Abenomics has been Transforming the Downward Spiral to a Virtuous Cycle

Massive ¥10 trillion (US$100 billion) fiscal stimulus package 【FY2012 Supplementary Budget】
Additional ¥5.5 trillion (US$55 billion) fiscal stimulus package to counter the impact of the April
2014 consumption tax increase (5% to 8%) 【FY2013 supplementary budget】
Price stability target (2% inflation) within about a two year time frame
Revitalizing the Japanese Economy ~The Three Arrows of Abenomics~
5
1. Price Stability Target and Bold Monetary Policy: The First Arrow
2. Flexible Fiscal Policy: The Second Arrow
3. Growth Strategy: The Third Arrow

-9.3% +1.4%
July-September 2012 July-September 2013
Capital investment
(nominal terms)
Approximately
¥70 trillion <Approx. US$ 700billon>
Approximately
¥63 trillion <Approx. US$ 630billon>
Pre-Lehman Shock level
Fiscal 2012
Private capital investment
(nominal terms)
+4.1%
Consumption
-3.2%
July-September 2012
(real terms)
The Japanese economy shifted from
negative to positive growth
Consumption is starting to pick up.
(contribution of final consumption expenditures
by households (in real terms) to GDP)
+0.9% -1.3%
July-September 2012 October-December 2013
Change from previous quarter and these numbers are annual rates.
+ 4.5%
April-June 2013
+ 4.1%
July- September 2013
+0.9% +0.7%
January-March 2013 October-December 2013
Private capital investment has largely bottomed up
October-December
2013
Capital Investment
GDP Growth Rate
Signs of Economic Recovery: A Tidal Shift
1US$=about 100YEN
6
The values in last June when the growth
strategy was developed.
The confirmed level:¥64.6 trillion
(Approx. US$ 646 billion, December 2013)

非製造業
2,129 2,104 1,891 1,970 2,025 2,094 2,255
製造業
3,009 2,659 2,337 2,489 2,484 2,562 2,833
5,138 4,762
4,228 4,459 4,509 4,656 5,088
0
1,000
2,000
3,000
4,000
5,000
6,000
7,000
非製造業
1,149 951 835 1,013 856 855 1,047
製造業
2,007
465 755
1,337 1,043 1,168
1,641
3,156
1,416 1,589
2,349 1,899 2,023
2,688
0
1,000
2,000
3,000
4,000
非製造業
1,103 835 778 956 833 849 1,036
製造業
1,985
255 686
1,309 970 1,153
1,660
3,088
1,089 1,463
2,264
1,803 2,002
2,696
0
1,000
2,000
3,000
4,000
非製造業
549 319 352 312 297 344 629
製造業
1,134
▲ 374
248 672 335
477
1,006
1,683
▲ 55
600
984
632 821
1,635
▲ 500
0
500
1,000
1,500
2,000
Signs of Economic Recovery: Improvement of Corporate Profits
Major improvement of profitability of companies Recovered to the pre-Lehman shock level
Sales
1,178 Listed Companies Settlement of Accounts (April-December)
FY2007
2008
2009
2010
2011 2012
2013
Year-on-year rates of change(%) -41.3 -29.6 80.6 -22.6 3.1 49.7
FY2007
2008
2009
2010
2011 2012
2013
Year-on-year rates of change(%) -0.8 -18.9 6.6 -0.2 2.1 11.8
12% improvement
50% improvement
¥100 billion (=US$ 1 billion) ¥ 10 billion (=US$ 100 million)
Current profits
-3.0% +3.5%
The Year-end Bonus (Year-on-Year)
2012 2013
4.3% 3.6%
Unemployment Rate 2012
(December) 2014
(February)
0.7% Improvement
7
Improvements to Bonus Payouts and the Employment Environment

1. Overall Picture of Abenomics and the
Current Japanese Economy
2. Attractive Investment Environment
3. New Business Chances Provided by the
Growth Strategy of Abenomics
4. Government Incentives for Global
Companies
8
Outline

GDP: US$5.96 trillion (world’s third largest market) Source:IMF World Economic Outlook (2012)
Sophisticated consumers
3.7 2.9 2.8
2.2 1.8 1.7
1.3 1.1
00.5
11.5
22.5
33.5
4%
Gross domestic expenditure on R&D
Source: OECD (2013) , MIC Statistics Bureau (Japan, 2013)
U.S. 26%
Japan 22%
Germany 10%
China 10% Korea
6%
France 4%
UK 3%
Switzerland 2%
Netherlands
2%
Sweden 2%
Others 14%
Share of PCT filings by country of origin
Source:WIPO Statistic Database (October 2013)
PCT: Patent Cooperation Treaty
Attractive Investment Environment for Innovation and Manufacturing
9
Large and Sophisticated Market
Optimized for Innovation

• Japanese functional materials are playing a key role in the field.
Industrial Cluster which consists of high-tech Supporting Industries
Japanese manufacturing industries have state-of-the-art materials which determine the performance of the final products. Huge growth potential is anticipated in this field.
Major Japanese companies producing carbon fiber; Toray, Toho Tenax (a subsidiary of Teijin), Mitsubishi Rayon
Color Resist
Market ¥85.5 billion Japanese Share in the World
71.3%
Companies: JSR, Toyochem
Functional Materials with a Large Global Share
• Features of Carbon Fiber; Lightness (1/4x of iron), intensity (10x of iron), hardness (7x of iron), non-corrosiveness etc.
• The market is growing by 20% a year, expected to become 4 times larger in 2020.
Carbon Fiber Available in Multiple Areas
Black Resist
Companies: TOKYO OHKA KOGYO, Mitsubishi Chemical
Market ¥16.5 billion Japanese Share in the World
81.4%
TAC Film for Polarizer
Companies: Fuji Film, Konica Minolta Opto Products
Market ¥126 billion Japanese Share in the World
100%
Photo Spacer
Companies: JSR, Osaka Organic Chemical Industry
Market ¥20.7 billion Japanese Share in the World
94.5%
Liquid Crystal Glass Substrate
Companies: Asahi Glass, Nippon Electric Glass
Market ¥1.3 trillion Japanese Share in the World 51%
Companies: FUJI FILM Konica Minolta Opto Products
Phase Difference Film with Compensatory Function
Market ¥150 billion Japanese Share in the World
100%
Antireflection Film
Companies: JSR, Nissan Chemical Industries
Market ¥116 billion Japanese Share in the World
94.2%
Japanese share in the world
60%
TAC Film for Polarizer
PVA(Polarization Coating)
Optical Functional
Film
Polarization Plate
Color Filter
Liquid Crystal
Polarization Plate
Backlight
Polarization Plate
Diffusion Plate
Light - guiding
Plate
Glass Substrate Backlight
Structure of a liquid-crystal display
Sub-components of the above
10

SMEs with Superior Technology
“J-Good Tech” – a website for matching with Japanese SMEs
11
A matching website that connects superior small and medium manufacturers with top niche/unique
technology/products in Japan, selected by SMRJ (Organization for SMEs and Regional Innovation,
JAPAN), with large domestic manufacturers and overseas companies.
Information will be available in Japanese and English. Service available from May 2014.
SMRJ Website: http://jgoodtech.smrj.go.jp/en/index.html
Mirror Polishing Technology
Polishing metal and ceramic surfaces at the
nanolevel
Approved for the sample collection capsule for
the Japan Aerospace Exploration Agency
Hayabusa 2 asteroid mission
TDC Corporation
Miyagi Pref. Capital: US$ 300,000.
No. of employees: 54
Encapsulation molding technology using a new
adhesive (hot melt adhesive) has been developed
Enhanced electric product quality (waterproof, dust
moisture performance, etc.)
Resin Molding Technology
Nakatani Sangyo
Kanagawa Pref. Capital: US$ 2.25 million
No. of employees: 250

Well-developed Infrastructure – Punctual and Reliable Railways
The annual number of Japan’s railway passengers is ranked among the world’s largest. Due to volume of passengers, high frequency operation management (1 train / every 2-3 minutes) is implemented.
Average delay per conventional train (2005-2009 average) is around 1 minute, comparatively punctual.
The number of failures per 1 million km is almost zero, which means high reliability.
0.0
0.2
0.4
0.6
0.8
1.0
1996-2000 average
0.097
(Nu
mb
er o
f fa
ilure
s p
er 1
mill
ion
kilo
met
er)
Failures of rolling stock
(Data of JR East)
※Definition of rolling stock failure
Failure in rolling stock that cause driving accidents and
obstruction that result in passenger trains being
suspended or delayed by 10 minutes or more or non-
passenger trains being delayed by 30 minutes or more.
1.68
5.09
8.84
0.00 2.00 4.00 6.00 8.00 10.00
Germany
India
Japan
The annual number of railway
passengers in 2009
(billion passengers) 0.0
0.4
0.8
1.2
1.6
2.0
2005-2009 average
1.1
Average delay per
conventional train
(minutes)
12

1964 → 2014 ZERO Tokaido Shinkansen
opened
(1964)
49Years
Safety Passenger fatalities
SHINKANSEN TGV ICE
5 trains/h 5 trains/h
15trains/h
×3times Trains / h
15
Operating frequency (at peak time)
The car body of Shinkansen is wider than that of any other high speed rail train.
Within
minute 1 More passengers
1 Comfort
2
Width (mm)
Seat Pitch(mm)
Seats/Car (No./car)
Series E5 3350 1040 73.1
Series N700 3360 1040 82.7
TGV-R 2904 900 37.5
ICE3 2950 920 53.6
Average delay time per trip Efficiency Reliability
The Outstanding Feature of Shinkansen
Frequency
13
Japan has nine dedicated super-fast express Shinkansen networks

Japan’s Contribution in the UK Railway Sector
Hitachi contributes to the UK’s railway sector by providing high quality rolling stock based on cutting-edge technologies of Japanese origin.
Hitachi is constructing a new rolling stock factory in the UK that contributes not only to improving UK railway services but also the UK economy as a UK company.
Overview Of Class 395 for HS1
Speed Max 225km/h*1
Route Dover – St. Pancreas
Journey Times: *2
Before Class 395: 83 min After: 37 min
*1 High speed line *2 High speed line (Ashford ~ St. Pancras)
Channel Tunnel Rail Link (CTRL)
• Class 395 worked as
a shuttle express to
Olympic Park in
Stratford.
• Highly evaluated due
to lack operational,
maintenance
problems.
• The factory is being constructed in Durham.
• Manufacture, assembling and testing facilities
with increasing scope including R&D
• More than 700 new jobs are to be
created.
Intercity Express Programme
(IEP) Introducing Hitachi’s rolling stock (Class 395)
could shorten the necessary time.
14

By constantly monitoring water quality and water pressure, stable water supply is ensured 24/7
Half of the people who took blind taste tests answered tap water is better tasting than bottled water.
Well-developed Infrastructure – World Class Waterworks Technology
Tokyo Water PET bottle (for PR),
100% advanced water treatment
0%
10%
20%
30%
40%
50%
60%
70%
80%
90%
19
45
19
50
19
55
19
60
19
65
19
70
19
75
19
80
19
85
19
90
19
95
20
00
20
05
20
10
Leakage Rate
Leakage rate is only 3%. It is implemented by high-level technology and know-how.
2011/1/29 AFC Asian Cup Qatar 2011 Final Japan vs Australia
During a big football game, people's behavior changes.
During halftime or after the game, water demand increases through the use of toilets and others.
According to changes in demand, water pressure is controlled.
An advanced water treatment system supplies safe, better tasting water which can be drunk directly from the tap anytime and anywhere
15

Rank Country Score
1 Iceland 1.162
2 Denmark 1.207
3 New Zealand 1.237
4 Austria 1.250
5 Switzerland 1.272
6 Japan 1.293
7 Finland 1.297
8 Canada 1.306
9 Sweden 1.319
10 Belgium 1.339
Source: Institute for Economics and Peace,“2013 Global Peace Index”
Global Peace Index Ranking Number of Michelin-starred Restaurants
0
50
100
150
200
250
300
Tokyo New York Hong Kong
・Macau
3 Stars
2 Stars
1 Star
Source: Michelin guide website
Safe and Comfortable Living Environment
16
Foods Safety and Security

※ ASEAN4: Malaysia, Thailand, Indonesia and Philippines
Japanese manufacturers in ASEAN4
Transportation equipment
Japanese manufacturers in China
Electronics
Japan as a Gateway to Utilize Supply Chains in Asia
ASEAN
Australia NZ
Japan
China
Korea
India
17
AJCEP (ASEAN-Japan Comprehensive Economic Partnership Agreement) became effective in April, 2008
Broad, International Supply Chain
being Created in East Asia
Local Procurement Rate of Japanese
Manufacturers in ASEAN 4
(%)
(year)

18 18
18
TTIP
Japan-EU・EPA TPP
Japan-EU EPA / FTA
In March 2013, the negotiation was launched in the conference call between the EU and Japan leaders. Since April 2013,five rounds of the negotiation meetings have taken place.
Both leaders agreed to pursue a comprehensive and high level Economic Partnership Agreement (EPA) and reaffirmed their strong commitment to its early conclusion.
The 21st Japan-EU Summit -19 Nov, 2013

1. Overall Picture of Abenomics and the
Current Japanese Economy
2. Attractive Investment Environment
3. New Business Chances Provided by the
Growth Strategy of Abenomics
4. Government Incentives for Global
Companies
19
Outline

Creating New Businesses and Reform of Electric Utility Systems
Energy Control Using an Energy Management System
Home Energy Management System (HEMS) by Denso Corporation
Management and operation from
outside of the house
1st stage (by around 2015)
◆ Establishment of the Organization for Cross-regional Coordination of Transmission Operators (OCCTO).
→nation-wide grid system
2nd stage (by around 2016 )
◆ Full liberalization of the retail market.
3rd stage (by around 2018 - 2020)
◆ Unbundle the transmission and distribution sector.
◆ Full liberalization of retail rates.
Implementing Reforms of the Electricity System
Enacted the related bill
The related bill is under discussion
in the current Diet session
Smartphones
Solar Cells
Plug-in Station
Rechargeable Batteries Fuel Cells Water Heater Plug-in Hybrid Car
20
Control Center ITS
Quick Charging Station
80% charge in 30 minutes
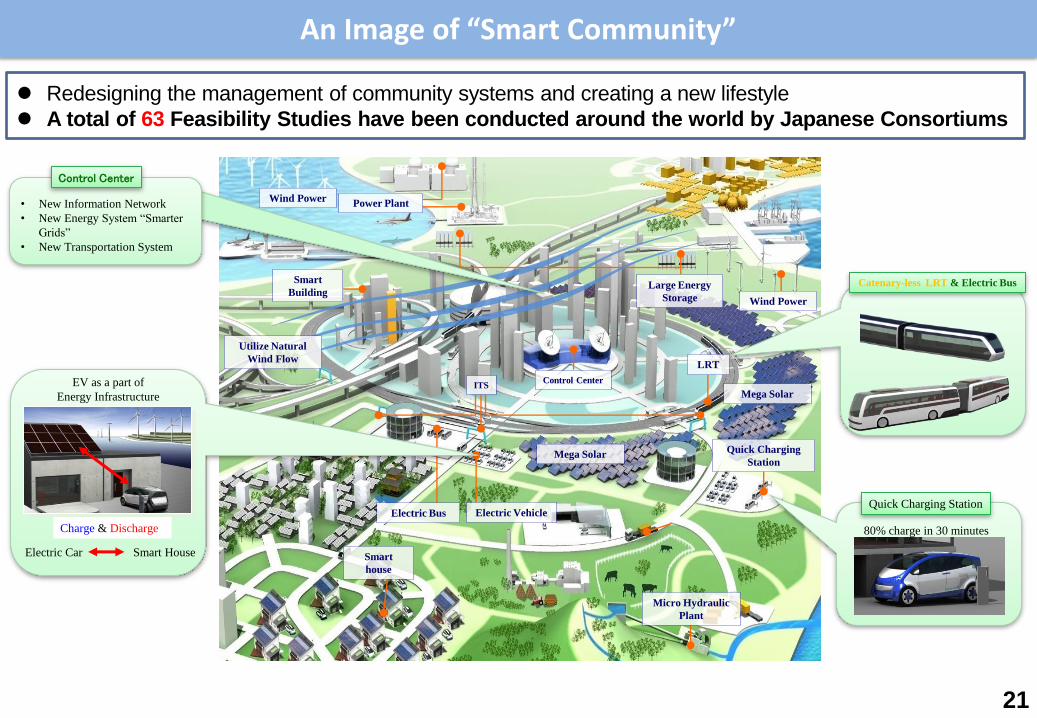
21 An Image of “Smart Community”
EV as a part of
Energy Infrastructure
• New Information Network
• New Energy System “Smarter
Grids”
• New Transportation System
Control Center
Catenary-less LRT & Electric Bus
Wind Power Power Plant
Smart
Building Large Energy
Storage
Electric Bus Electric Vehicle
Smart
house
Micro Hydraulic
Plant
Utilize Natural
Wind Flow
Quick Charging
Station
Mega Solar
LRT
Wind Power
Mega Solar
Electric Car Smart House
Charge & Discharge
21
Redesigning the management of community systems and creating a new lifestyle
A total of 63 Feasibility Studies have been conducted around the world by Japanese Consortiums

Revised Pharmaceutical Affairs Law last autumn
(As part of the regulatory reform in the field of healthcare)
Creation of New Industries in Response to Japan’s Aging Society - Examples from the Healthcare Sector
(1)Speed up the certification for innovative medical
devices.
Establish an early authorization system.
(2) Faster authorization in Regenerative Medicine.
Major revisions in the related bills of the Pharmaceutical Affairs Law, etc.
0
10
20
30
2008 2009 2010 2011 2012
Review times for medical devices behind the U.S.
(Priority Review Products) Months
Source: Pharmaceuticals and Medical Devices Agency (PMDA)
Example.
Medical Device Making Use of SME Manufacturing Technology
Tailor-made Joint Prostheses
・Apply its propeller manufacturing
technique for tankers.
・Develop less-wearing and durable joint
prostheses suited for lifestyles and body
structures common in Japan.
Nakashima Medical Co., Ltd,
(Okayama Pref. Capital: 50 million yen
Employees: 153)
Productivity Improvement in Nursing Care Business
[Example] SMART SUPPORT Corporation (Use of nursing care robots contributes
to improving the productivity of nursing services.)
Reduce the burden on nurses and care helpers
22

Clarify the white (legal) zones to enable
companies to embark on new ventures with peace of mind.
Regulatory Reforms to Create New Industries
Example
Give the special approval of field tests for “pioneer” companies even if they are in conflict with the existing laws
The service of a simple blood testing
Example
Field tests scheme particularly for“pioneer”companies “Gray Zone” elimination scheme
○Approved the regulatory exemption to utilize a new type of a hydro tank
Enforced the related bill this January
Putting a forklift with a fuel cell into practical use
○Clarified it does not correspond to regulated “the practice of medicine” that companies give a diagnosis of blood collected by customers themselves
23

The Fourth Arrow on Abenomics
Demand Creation Amount (¥ 1 trillion = US$10 billion )
Production Inducement Amount (¥ 1 trillion = US$10 billion )
Daiwa Securities Co. Ltd. (September 2013)
For reforming infrastructure: 55 Effect of tourism: 95
SMBC Nikko Securities Inc. (November 2013)
14.9 36.6
Mitsubishi UFJ Morgan Stanley Securities (September 2013)
12.2 29.3
The Mori Memorial Foundation Institute for urban strategies (January 2014)
8.6 19.4
Economic Effect of Tokyo Olympic Games
24

1. Overall Picture of Abenomics and the
Current Japanese Economy
2. Attractive Investment Environment
3. New Business Chances Provided by the
Growth Strategy of Abenomics
4. Government Incentives for Global
Companies
25
Outline

Government Incentives (1)
Tax incentives for promoting capital investment
Tax incentives for promoting business restructuring
(carve outs & integration of business)
Tax incentives for promoting venture / start up investment
Together with tax incentives for promoting R&D, for raising wages, and for promoting investment by small and medium enterprises, the tax cut amounts to approximately ¥1 trillion (Approx. US$10 billion). (Total of revenue of corporate tax: ¥14 trillion (Approx. US$140 billion). [FY2012])
These 3 tax incentives have been
available from this January.
26
Foreign Companies are also given preferential treatment!
Tax incentives to Vitalize Industries

Eligible costs: Survey Design Costs, Facility Costs, Equipment Costs,
Facility Rental Fees
Subsidy rates: Up to 1/2 for SMEs, up to 1/3 for non-SMEs
(Max ¥ 500 million per case(=US$ 5 million ))
№ Company name Global HQ
1 BASF Japan, Ltd. Germany
2 Comverge Japan K.K. U.S.
3 Nippon Busch K.K. Germany
4 Siemens Japan K.K. Germany
Selected companies of the Subsidy Program
№ Company name Global HQ
1 Faurecia Japan K.K. France
2 GE Japan Limited U.S.
3 Johnson & Johnson K.K. U.S.
4 Tenneco Japan Ltd. U.S.
FY2012 FY2013
Government Incentives (2)
27
For R&D facilities and Regional Headquarters
Subsidy Program

Corporate tax breaks
(from approximately 36% to 29%)
Acceleration of visa issuing procedures
(ordinarily 1 month → around 10 days)
Acceleration of patent examinations
(ordinarily: around 16 months
→ around 2 months)
(*) Act for Promotion of Japan as an Asian Business Center
Government Incentives (3)
28
Providing an incentive for foreign companies!
For R&D facilities and Regional Headquarters
Preferential Treatment by the Act (*)

Cabinet
Office
JETRO’s New Support Framework
Meeting
Questions on
administrative procedures
Questions Requests JETRO
Official in charge
Invest Japan Hotline
Requests for
regulatory reforms
29 < JETRO Inquiry form> http://www.jetro.go.jp/en/invest/hotline/

Buy Abenomics!
Thank you! 30