inventory management and erp at the university of pretoria
TRANSCRIPT

Inventory management and
ERP at the University of
Pretoria
Investigation, Optimization and Implementation
By
Reza Eksteen
26027322
Submitted in partial fulfilment of the requirements for the degree
of
BACHELORS OF INDUSTRIAL ENGINEERING
in the
FACULTY OF ENGINEERING, BUILT ENVIRONMENT AND
INFORMATION TECHNOLOGY
UNIVERSITY OF PRETORIA
October 2010
ii
Executive Summary
Information integration in a large business is a critical factor for achieving a competitive advantage
and the importance of ERP (Enterprise Resource Planning) and the implementation of the
appropriate system cannot be stressed enough; however, the success rests in the approach to and
research into the implementation process.
Since the University of Pretoria has procured Oracle PeopleSoft, the successful Phase II
implementation of the PeopleSoft SCM Inventory module is the main focus of this project. This will
be done through gaining a thorough understanding of the PeopleSoft SCM Inventory module and a
meticulous investigation of one of the typical inventory environments at UP, the stationary store.
After complete investigation of the current policies and procedures, an appropriate optimization
process regarding the inventory practices is followed in order to populate PeopleSoft with the best
possible information. Subsequently the unique configurations on PeopleSoft SCM Inventory will be
designed.
Finally a revised inventory model will be delivered for the purpose of the Phase 2 implementation of
Oracle PeopleSoft at UP.

iii
Contents
List of Figures ............................................................................................................................................................. v
List of Tables ............................................................................................................................................................... v
Abbreviations ............................................................................................................................................................. vi
Chapter 1 ...................................................................................................................................................................... 1
1.1 General background on the problem .............................................................................................................. 1
1.1.1 University of Pretoria’s system renewal ................................................................................................ 1
1.1.2 A brief history on PeopleSoft.................................................................................................................... 1
1.1.3 PeopleSoft Supply Chain Management (SCM) Inventory ................................................................ 1
1.1.4 The stationary store .................................................................................................................................... 2
1.2 Quantifying the need for a solution ................................................................................................................ 2
1.2.1 Project purpose ............................................................................................................................................ 3
1.2.2 The role of PeopleSoft in this project ..................................................................................................... 4
1.3 Current processes and procedures ................................................................................................................... 4
1.3.1 Description of items .................................................................................................................................... 4
1.3.2 Inventory replenishing ............................................................................................................................... 5
1.3.3 Inventory issuing ......................................................................................................................................... 6
1.3.4 Inventory counts .......................................................................................................................................... 6
1.3.5 Obsolete, damaged and slow moving inventory .................................................................................. 6
1.3.6 Holding cost .................................................................................................................................................. 7
1.4 Scope and limitations of the project ................................................................................................................ 7
Chapter 2 ...................................................................................................................................................................... 8
Literature review ........................................................................................................................................................ 8
2.1 Characteristics of an inventory system ..................................................................................................... 8
2.1.1 Carrying cost ................................................................................................................................................ 8
2.1.2 Shortage cost ................................................................................................................................................ 9
2.1.3 Replenishment cost ..................................................................................................................................... 9
2.1.4 Customer demand ........................................................................................................................................ 9
2.1.5 Safety stock ................................................................................................................................................... 9
2.1.6 Lead time ..................................................................................................................................................... 10
2.1.7 Obsolete items ............................................................................................................................................ 10
2.2 Tools and techniques ........................................................................................................................................ 11
2.2.1 The Pareto principle ................................................................................................................................. 11
2.2.2 ABC analysis ............................................................................................................................................... 11
2.2.3 Traditional ABC analysis vs. multiple criteria ABC analysis ......................................................... 12
2.2.4 Economic Order Quantity (EOQ) ......................................................................................................... 15

iv
2.3 Enterprise Resource Planning (ERP)........................................................................................................... 16
2.3.1 A brief history on enterprise resource planning ................................................................................ 16
2.3.2 ERP implementation................................................................................................................................. 16
Chapter 3 .................................................................................................................................................................... 18
Solution Design ........................................................................................................................................................ 18
3.1 Design regarding inventory environment .................................................................................................. 18
3.2 Design regarding PeopleSoft environment ................................................................................................ 19
Chapter 4 .................................................................................................................................................................... 21
Solutions and recommendations ........................................................................................................................... 21
4.1 ABC Analysis ...................................................................................................................................................... 21
4.2 EOQ Computations ........................................................................................................................................... 22
4.2.1 Cost elements in equation ........................................................................................................................ 22
4.3 Safety stock computations ............................................................................................................................... 23
4.3.1 Elements in equation............................................................................................................................. 23
4.4 PeopleSoft Input ................................................................................................................................................ 23
4.4.1Current renewed replenishing method .................................................................................................. 23
4.4.2 PeopleSoft Set-up requirements ............................................................................................................. 23
Chapter 5 .................................................................................................................................................................... 28
Conclusion .................................................................................................................................................................. 28
5.1 Objectives revised ......................................................................................................................................... 28
5.2 Future research ............................................................................................................................................. 28
Bibliography .............................................................................................................................................................. 29
Appendix .................................................................................................................................................................... 31
Appendix A............................................................................................................................................................ 31
Table A1 (Transformation calculations) ........................................................................................................ 31
Appendix B ............................................................................................................................................................ 32

v
List of Figures Figure 1.1: PeopleSoft SCM Inventory user interface....................................................................................2
Figure 1.2: Set-up financials and supply chain user interface........................................................................2
Figure 1.3: Supply Chain Management (SCM) integration user interface.................................................2
Figure 1.4: Inventory Policy Planning user interface.....................................................................................2
Figure 1.5: “Big picture” view of the project......................................................................................................3
Figure 1.6: The role of PeopleSoft as enabler....................................................................................................4
Figure 1.7: Current replenishing procedure.......................................................................................................5
Figure 1.8: Current issuing procedure.................................................................................................................6
Figure 2.1: Inventory control................................................................................................................................11
Figure 2.2: ERP implementation steps (Edwin, 2006)....................................................................................17
Figure 2.3: ERP implementation steps (Umble et al, 2003)..........................................................................17
Figure 4.1: Steps when designing a workflow application)...........................................................................24
Figure 4.2: Issuing process model........................................................................................................................27
Figure C1: Current preliminary replenishing procedure...............................................................................32
Figure C2: Suggested preliminary issuing procedure.....................................................................................33
List of Tables Table 1.1: Current item categories.........................................................................................................................5
Table 1.2: Current holding cost elements............................................................................................................7
Table 2.1: Suggested percentages to calculate inventory carrying cost.......................................................8
Table 2.2: Essence of ABC analysis.....................................................................................................................11
Table 2.3: Possible approaches to different item classes (Wild, 2002)........................................................12
Table 2.4: Important criteria for classifying items (Lung, 2007).................................................................12
Table 2.5: Spreadsheet sample (Lung, 2007).....................................................................................................14
Table 2.6: Calculation of partial averages sample (Lung, 2007)…..............................................................14
Table 2.7: Formulas derived from basic EOQ model......................................................................................16
Table 3.1: Summary of inputs, techniques and deliverables..........................................................................18
Table 3.2: PeopleSoft implementation phases and the tools and technologies required........................19
Table 4.1: Holding cost calculation.....................................................................................................................22
Table 4.1: Description of EOQ computations for each item..........................................................................22
Table 4.3: Item requirements for PeopleSoft upload.......................................................................................27

vi
Table A1: Transformation calculations..............................................................................................................31
Table A2: Calculation of partial averages..........................................................................................................31
Abbreviations EOQ – Economic Order Quantity
ERP – Enterprise Resource Planning
HOD – Head of Department
IT – Information Technology
MAD – Mean Absolute Deviation
MCIC – Multiple Criteria Inventory Classification
MRP – Material Requirement Planning
SCM – Supply Chain Management
UOM – Unit Of Measure
UP – University of Pretoria
VMI – Vendor Managed Inventory

1
Chapter 1 A problem well stated is a problem half solved – Charles F. Kettering
1.1 General background on the problem
1.1.1 University of Pretoria’s system renewal The University of Pretoria’s (UP) information systems evolved over many years. Regrettably these systems
were run separately, leading to numerous fragmented systems carrying related or similar data with little or
no integration between the systems, thus developing the need for systems renewal. The legacy financial
system (Unikom) was introduced to UP in 1996 and has been running to the present. Unikom is a main
frame system written in Natural Adabas – a programming language which in this day and age, has become
almost obsolete. Since 2005 UP has been planning to introduce an integrated platform for all IT systems.
In 2007 UP decided to procure Oracle PeopleSoft.
As UP is a large institution, and an entire implementation of PeopleSoft in one go is merely impossible, a
phased approach is followed.
The Phase 1 implementation of PeopleSoft at UP includes the Financial and Procurement Management
functions and will be running in parallel with Unikom for some time before the old system is switched off.
During the phase 2 implementation in 2011, the Inventory Module will be incorporated, hence developing
the need for this project.
1.1.2 A brief history on PeopleSoft Oracle is a software company; it is the first to develop 100 percent internet-enabled enterprise software
across its entire product line (Oracle, 2010). In earlier years PeopleSoft primarily developed human resource
management (HRMS) and customer relations management (CRM) software. PeopleSoft was obtained by
Oracle Corporation in 2005. PeopleSoft is an ERP (Enterprise Resource Planning) software product for the
purpose of business management. The typical ERP system consists of sets of customisable software, that
when implemented fruitfully, integrates all business functions within an organisation.
PeopleSoft, Inc. designs, develops, markets and supports enterprise application
software products for use throughout large and medium-sized organizations
worldwide. These organizations include corporations, educational institutions
and national, state, provincial and local government agencies. The Company
provides enterprise application software for customer relationship management,
human capital management, financial management and supply chain management,
each with a range of industry-specific features and functions. (Yahoo Finance, 2004)
PeopleSoft Campus Solutions is a product specifically designed for universities and other higher education
institutions and thus the ideal product for the renewal of UP’s system.
1.1.3 PeopleSoft Supply Chain Management (SCM) Inventory PeopleSoft SCM Inventory is an extensive inventory management system that enables users with a
competitive advantage. It improves accuracy and customer service along with multiple decision making
tools for support in complex inventory management environments. This is moreover the chosen module for
the phase 2 implementation of PeopleSoft at UP. Figure 1.1 from the PeopleSoft demonstration database
2
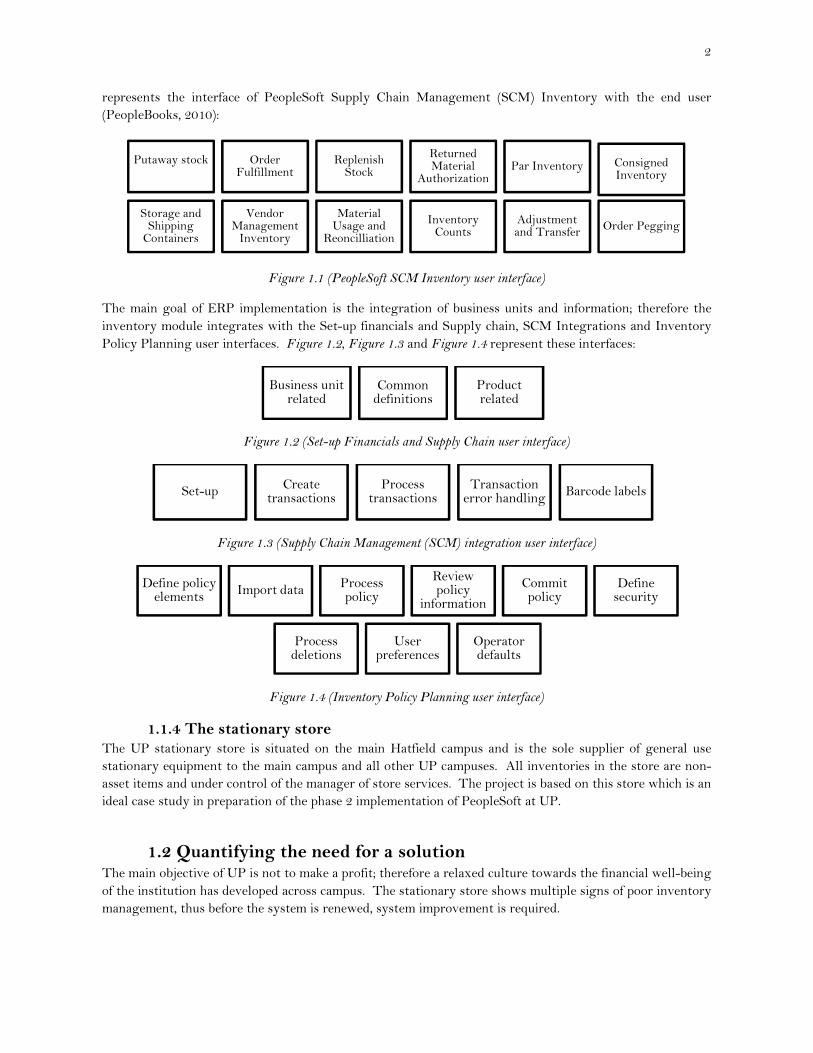
represents the interface of PeopleSoft Supply Chain Management (SCM) Inventory with the end user
(PeopleBooks, 2010):
Figure 1.1 (PeopleSoft SCM Inventory user interface)
The main goal of ERP implementation is the integration of business units and information; therefore the
inventory module integrates with the Set-up financials and Supply chain, SCM Integrations and Inventory
Policy Planning user interfaces. Figure 1.2, Figure 1.3 and Figure 1.4 represent these interfaces:
Figure 1.2 (Set-up Financials and Supply Chain user interface)
Figure 1.3 (Supply Chain Management (SCM) integration user interface)
Figure 1.4 (Inventory Policy Planning user interface)
1.1.4 The stationary store The UP stationary store is situated on the main Hatfield campus and is the sole supplier of general use
stationary equipment to the main campus and all other UP campuses. All inventories in the store are non-
asset items and under control of the manager of store services. The project is based on this store which is an
ideal case study in preparation of the phase 2 implementation of PeopleSoft at UP.
1.2 Quantifying the need for a solution The main objective of UP is not to make a profit; therefore a relaxed culture towards the financial well-being
of the institution has developed across campus. The stationary store shows multiple signs of poor inventory
management, thus before the system is renewed, system improvement is required.
Putaway stock Order Fulfillment
Replenish Stock
Returned Material
AuthorizationPar Inventory Consigned
Inventory
Storage and Shipping Containers
Vendor Management Inventory
Material Usage and
Reoncilliation
Inventory Counts
Adjustment and Transfer
Order Pegging
Business unit related
Common definitions
Product related
Set-upCreate
transactionsProcess
transactionsTransaction error handling
Barcode labels
Define policy elements
Import dataProcess policy
Review policy
information
Commit policy
Define security
Process deletions
User preferences
Operator defaults
3
1.2.1 Project purpose The project aim is to deliver a revised inventory model representing the processes and procedures at the
stationary store to pilot the second stage ERP implementation regarding the Inventory module of Oracle
PeopleSoft at UP.
An investigation of the current inventory management practices is conducted at the stationary store on main
campus, as well as a comprehensive study of the Inventory module on PeopleSoft in order to present an
optimized inventory management model to employ in all other inventory environments at UP. Subjects
such as re-order points, shelf life, item mix, forecasting, item value and classification, amount of vendors and
utilization is addressed and optimized.
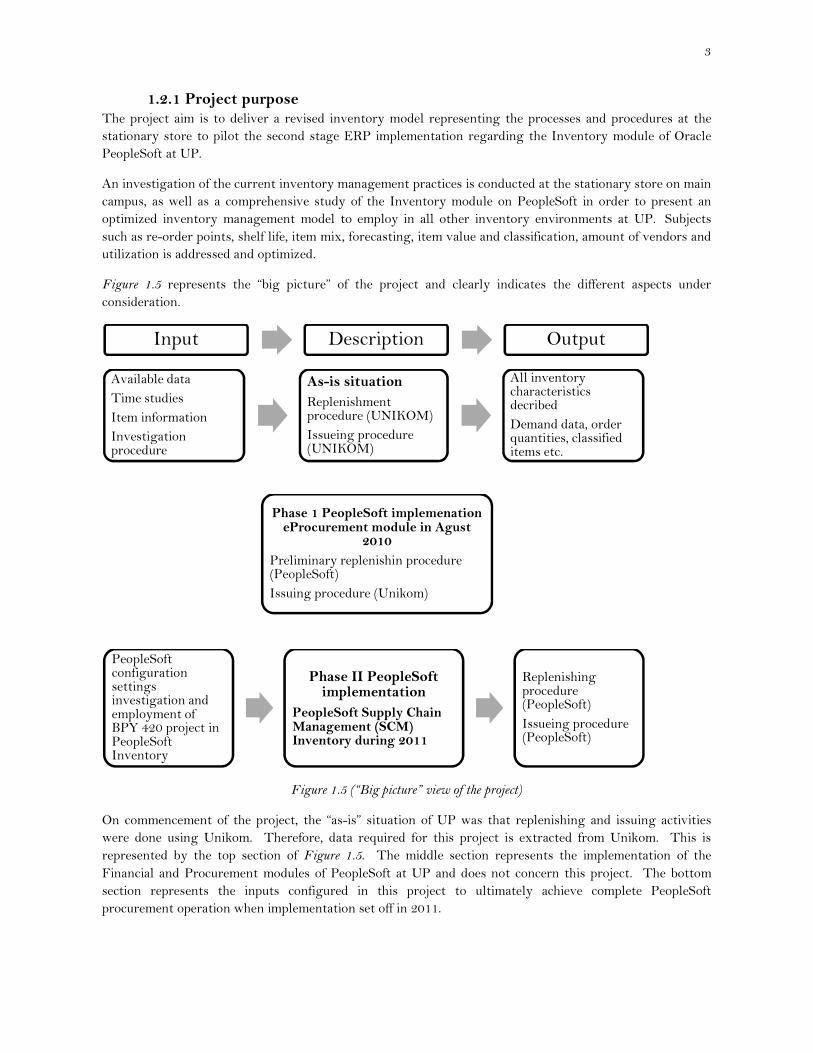
Figure 1.5 represents the “big picture” of the project and clearly indicates the different aspects under
consideration.
Figure 1.5 (“Big picture” view of the project)
On commencement of the project, the “as-is” situation of UP was that replenishing and issuing activities
were done using Unikom. Therefore, data required for this project is extracted from Unikom. This is
represented by the top section of Figure 1.5. The middle section represents the implementation of the
Financial and Procurement modules of PeopleSoft at UP and does not concern this project. The bottom
section represents the inputs configured in this project to ultimately achieve complete PeopleSoft
procurement operation when implementation set off in 2011.
Input Description Output
Available data
Time studies
Item information
Investigation procedure
As-is situation
Replenishment procedure (UNIKOM)
Issueing procedure (UNIKOM)
All inventory characteristics decribed
Demand data, order quantities, classified items etc.
Phase 1 PeopleSoft implemenation eProcurement module in Agust
2010
Preliminary replenishin procedure (PeopleSoft)
Issuing procedure (Unikom)
PeopleSoft configuration settings investigation and employment of BPY 420 project in PeopleSoft Inventory
Phase II PeopleSoft implementation
PeopleSoft Supply Chain Management (SCM) Inventory during 2011
Replenishing procedure (PeopleSoft)
Issueing procedure (PeopleSoft)

1.2.2 The role of PeopleSoft in this projectPeopleSoft performs the role of enabler in this project.
utilize the techniques used and results found in
PeopleSoft consist of various built-in tech
achieve the unique requirements of UP
procedures given the correct input. T
best policies for UP to finally present a complete list of configurations for the PeopleSoft consultants to
implement into the distinctive UP PeopleSoft inventory management system.
Figure 1.6 represents the enabling role of PeopleSoft in this project. PeopleSoft offers certain built
functionality to customers and decisions regarding the relevance, need and employability of this
functionality requires managerial and expert decision making
acquiring the necessary configurations
software is required to be minimal and a last resort d
Figure
1.3 Current processes and proceduresOver the years employees developed a sense for the inventory environment at the stationary store. This
resulted in current business processes and decision making methods at the store.
1.3.1 Description of itemsThe stationary store currently stock roughly
million at any given stage. After analyzing available data, it is apparent that in the year 1 July 2009 to 30
June 2010 there was movement on only 434 items.
where each group has an identifying ID number in Unikom
The role of PeopleSoft in this project enabler in this project. PeopleSoft enables the implementation team to
and results found in this project during the phase 2 implementation in 2011.
in technologies and business processes that may be customised in order to
UP. PeopleSoft Inventory has the capacity to optimize i
. The built-in functionality of PeopleSoft will be evaluated in terms of
to finally present a complete list of configurations for the PeopleSoft consultants to
UP PeopleSoft inventory management system.
represents the enabling role of PeopleSoft in this project. PeopleSoft offers certain built
functionality to customers and decisions regarding the relevance, need and employability of this
managerial and expert decision making. Facets of this project are dedicated to
acquiring the necessary configurations for set-up in PeopleSoft. Furthermore, customization of PeopleSoft
and a last resort due to software upgrades and incompatibility issues.
Figure 1.6 (The role of PeopleSoft as enabler)
Current processes and procedures Over the years employees developed a sense for the inventory environment at the stationary store. This
business processes and decision making methods at the store.
items The stationary store currently stock roughly 473 items and carries an approximate inventory value of R 2.4
After analyzing available data, it is apparent that in the year 1 July 2009 to 30
June 2010 there was movement on only 434 items. Items are categorized in groups and
where each group has an identifying ID number in Unikom:
4
the implementation team to
implementation in 2011.
that may be customised in order to
. PeopleSoft Inventory has the capacity to optimize inventory
in functionality of PeopleSoft will be evaluated in terms of
to finally present a complete list of configurations for the PeopleSoft consultants to
represents the enabling role of PeopleSoft in this project. PeopleSoft offers certain built-in
functionality to customers and decisions regarding the relevance, need and employability of this
. Facets of this project are dedicated to
PeopleSoft. Furthermore, customization of PeopleSoft
ue to software upgrades and incompatibility issues.
Over the years employees developed a sense for the inventory environment at the stationary store. This
and carries an approximate inventory value of R 2.4
After analyzing available data, it is apparent that in the year 1 July 2009 to 30
listed in Table 1.1

5
Books Computer consumables Paper
General Exam pads Files
Envelopes Exam books Slides
Video tape Audio cassettes Diverse
Pens Labels Staplers and staples
Record cards Pencils Tape
Office glue Post-it notes and flags Ink
Chalk Paper binders Ribbon
Marketing service Transparencies Batteries Table 1.1 (Current item categories)
1.3.2 Inventory replenishing The first aspect in inventory replenishing is the acquisition cost. A set-up cost of R 350 per order has been
determined by the managers at the stationary store and includes all costs and processes from the point
where the order is placed to the point where the invoice is sent to the creditors department for payment.
The analysis of replenishment data for one year revealed that there are 1 – 15 different items per official
order; therefore an average amount of items per order could be calculated. There is an average of 7.9 items
per order, thus the average order cost per item is R 44.
The stationary store employs a 95-98% availability of stock rule and inventory is replenished according to
customer usage and available space. The store does not make emergency orders when a stock out occurs.
Predetermined minimum and maximum stock levels may be viewed on the Unikom financial system by
using the EAS 507 P program, the replenishing procedure is triggered when the minimum stock level is
reached. Figure 1.7 below represents the process flow after the requirement for replenishment has been
established.
Figure 1.7 (Current replenishing procedure)
Requisitions are raised on the EAS 503 P program on Unikom and receive a Status 1 in the approval
procedure. This is where item descriptions and specifications are made. The requisition is then sent to the
procurement division where university buyers acquire quotations from different vendors and send the
quotations back to the requestor where a status 2 is assigned to the requisition. On receipt of the
quotations, the manager of the stationary store approves or denies the request. If denied, the request is sent
back to the requestor in order to fix the problem, alternatively a status 5 is assigned to the requisition and a
purchase order may be dispatched.
On receipt of ordered goods, the inventory supervisor verifies item descriptions, amounts, prices etc. to be
correct and signs off the invoice, however, if the invoice exceeds R 10 000, the store manager is required to
sign the document. Proof of goods received is done in the EAS 901 P program in Unikom directly after
receipt.
Items are counted and controlled during storage and the inventory process is completed. Inventory is
stored on shelves with the following dimensions: Length 10.65 m, Width 2.20 m and Height 45.0 cm.
Hereafter, the invoice is sent to the financial department for payment.
Order
Requisition
EAS 503 P
Status 1
Procurement division
Quotation
EAS 503 P
Status 2
Facilities management
Order
Approval
EAS 503P
Status 5
Stores services
Delivery
Goods recieving
EAS 901 P

6
UP has an extensive list of active vendors to facilitate the supply of necessary items; a catalogue is uploaded
in PeopleSoft with suppliers and products available from these suppliers for the use of buyers and requestors.
1.3.3 Inventory issuing The stationary store is the sole supplier of general use stationary materials to all UP campuses. These
include the Groenkloof, Mamelodi, Onderstepoort, Medical and Hatfield campuses. Specialized items are
acquired by the departments and users themselves. The store does not have lead time as customers collect
their own items and rarely require a delivery service. Figure 1.8 below depicts the issuing procedure as
currently followed by the stationary store:
Figure 1.8 (Current issuing procedure)
In the stationary store’s case, users across all UP campuses fulfil the role of the customer. A request is
raised by the customer in the EAS 501 P program in Unikom and assigned a status 1. The requisition is
sent to the Head of Department (HOD) pending approval. The inventory process is triggered when the
HOD approves the request and assigns a status 2. The picking process is initiated in the EAS 508 P
program in Unikom.
The issuing clerk approves the pick list in the EAS 132 P program in Unikom and releases the required
inventory from the store to the waiting area. In the waiting area the stock is validated for correct item,
quantity, damage etc. before it is exported. In the EAS 005 P program in Unikom a stores issue is made and
a status 4 is assigned. The last two boxes in the process represent the case where inventory is returned.
Returns of inventory from customers are done in the EAS 115 P program in Unikom where stock is placed
back in the system. In the case of broken or damaged goods, the item/s is sent back to the original supplier
accompanied by the invoice. A stock update is done in the EAS 507 P program in Unikom.
1.3.4 Inventory counts Complete inventory counts are done twice yearly in June and November using the EAS 015 P program in
Unikom for comparison of actual and system inventory amounts. Test counts of 5% of items are held
monthly, if the test count deviates more than 2.5% in rand value, an additional 5% is counted, if again the
deviation is more than 2.5% the entire store is counted to determine the cause of the deviation. A current
business rule is to manage inventory with 97.5% accuracy.
1.3.5 Obsolete, damaged and slow moving inventory Items are classified obsolete when no movement has occurred on them in 2 years. Items with no usage value
are disregarded with the approval of the vice director of facilities and services and removed from the store.
Client
Requisition
EAS 501 P
Status 1
HOD
Approve
EAS 501 P
Status 2
Pick list
EAS 508 P
Status 2
Pick list approve
EAS 132 P
Stores issue
EAS 005 P
Status 4
Maintenance
(Modify)
EAS 115 P
Stock update
EAS 507 P
7
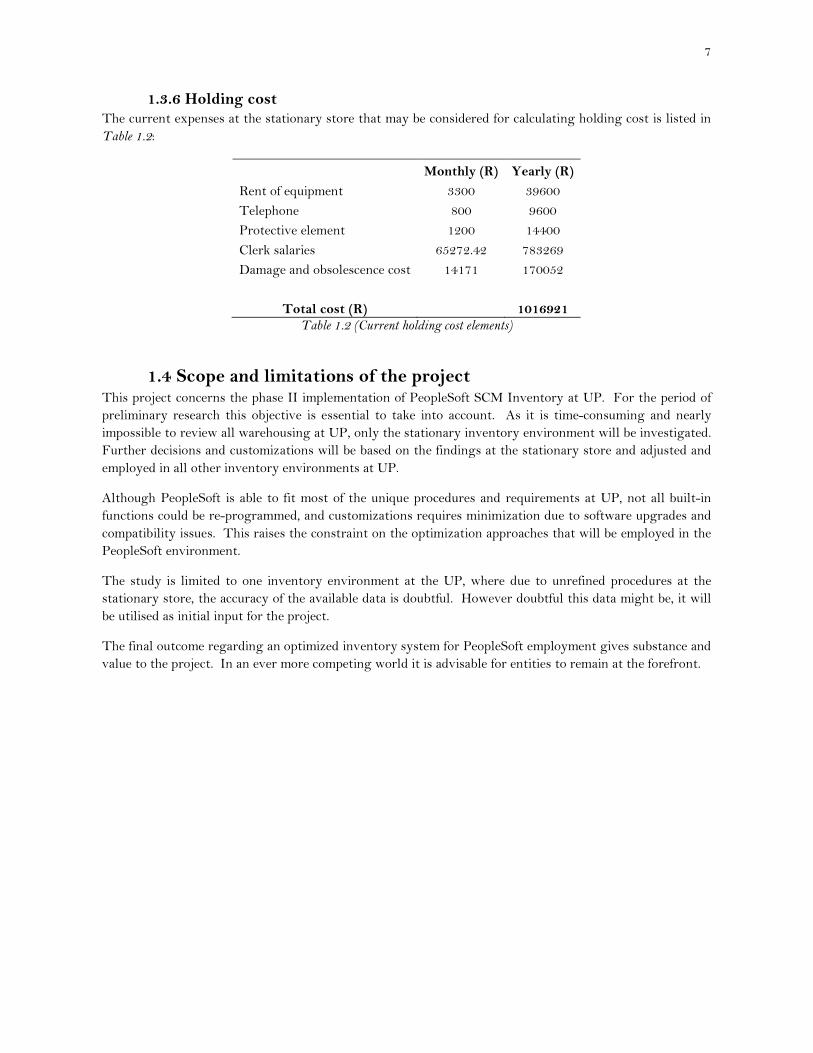
1.3.6 Holding cost The current expenses at the stationary store that may be considered for calculating holding cost is listed in
Table 1.2:
Monthly (R) Yearly (R)
Rent of equipment 3300 39600
Telephone 800 9600
Protective element 1200 14400
Clerk salaries 65272.42 783269
Damage and obsolescence cost 14171 170052
Total cost (R) 1016921
Table 1.2 (Current holding cost elements)
1.4 Scope and limitations of the project This project concerns the phase II implementation of PeopleSoft SCM Inventory at UP. For the period of
preliminary research this objective is essential to take into account. As it is time-consuming and nearly
impossible to review all warehousing at UP, only the stationary inventory environment will be investigated.
Further decisions and customizations will be based on the findings at the stationary store and adjusted and
employed in all other inventory environments at UP.
Although PeopleSoft is able to fit most of the unique procedures and requirements at UP, not all built-in
functions could be re-programmed, and customizations requires minimization due to software upgrades and
compatibility issues. This raises the constraint on the optimization approaches that will be employed in the
PeopleSoft environment.
The study is limited to one inventory environment at the UP, where due to unrefined procedures at the
stationary store, the accuracy of the available data is doubtful. However doubtful this data might be, it will
be utilised as initial input for the project.
The final outcome regarding an optimized inventory system for PeopleSoft employment gives substance and
value to the project. In an ever more competing world it is advisable for entities to remain at the forefront.

8
Chapter 2
Literature review The answers you get from literature depend upon the questions you pose – Margaret Atwood
2.1 Characteristics of an inventory system
According to Naddor (1982:3), a typical inventory system is a system where the following three costs are
considerable and subject to control:
- Carrying cost - Shortage cost - Replenishment cost
2.1.1 Carrying cost The costs associated with the amount of inventory stored at a given stage are called inventory holding costs
or inventory carrying costs. This commonly represents one of the elevated costs of logistics. The need for
proper assessment of these costs is due to the magnitude of them (Stock & Lambert, 2001). Problems
associated with these costs are that many company’s costs are not calculated according to their own unique
situations however include only the current interest rate, taxes and insurance paid on inventory. Some
managers find it appropriate to apply textbook or industry percentages for calculation of these costs (Stock
& Lambert, 2001).
Inventory holding fixes money where it could be applied in other investments on which interest could be
earned. Douglas and Lambert (2001) suggests inventory carrying costs should only include costs varying
with the amount of inventory and categorize them in 4 groups: (1) capital costs, (2) inventory service costs,
(3) storage space costs, and (4) inventory risk costs. Atkinson (2005) state that the estimated holding cost
for an item is roughly 15-35% of the items actual value per year. According to REM Associates a “rule of
thumb” to determine inventory carrying costs is 25% of on-hand inventory.
Naddor (1982:37) declares the following costs included in unit carrying cost: the costs of money tied up in
inventory, storage, taxes payable on stock, obsolescence, insuring inventory and more. Richardson (1995)
suggests the percentages in Table 2.1 a basis for calculating inventory carrying cost:
Cost element Percentage range
Cost of money 6% - 12%
Taxes 2% - 6%
Insurance 1% - 3%
Warehouse expense 2% - %5
Physical handling 2% - 5%
Clerical and inventory control 3% - 6%
Obsolescence 6% - 12%
Deterioration and pilferage 3% - 6% Table 2.1 (Suggested percentages to calculate inventory carrying cost)
Douglas and Lambert (2001:203-212) explains an industry example for calculating inventory holding cost.
In the example, 11 cost categories, each with the source, explanation and amount is described. According to
Douglas and Lambert (2001:205), the value of average system inventory should be calculated and all other
inventory costs should be calculated as a percentage of average variable cost of total inventory and added to

9
the capital cost. Assumptions to the method are that variable costs are 80% of full cost and the cost of
money is 30% before taxes and 15% after taxes (Douglas & Lambert, 2001:205).
2.1.2 Shortage cost According to Naddor (1982:38), shortage cost is the most difficult cost to quantify. In other words, shortage
cost is the penalty for not having demanded stock available.
The following costs may be included when calculating the shortage cost: overtime costs, extra
administration and clerical costs, sales loss, goodwill loss, customer loss and other costs (Naddor, 1982:38).
Shortage costs not only depend on the quantities that are short but the time the stock is unavailable as well.
2.1.3 Replenishment cost Replenishment cost includes ordering and set-up cost as well as unit purchasing cost. Ordering and set-up
cost does not depend on the size of the order, unlike unit purchasing cost which is the variable cost of
purchasing one unit of the item (Winston, 2004:103-104). In general, replenishment refers to the amounts
that are put back in stock, decisions regarding ordering these amounts and the time ordered items are
refilled in stock (Naddor, 1982:26).
When calculating the replenishment cost, the following costs may be considered: administration cost,
delivery cost, and labour cost for storage etc.
2.1.4 Customer demand The purpose of keeping inventory is to have items available on demand. Demand from the customers may
be considered as an initializing feature of the inventory policies and procedures that an organization will
employ. Wild (2002:19) defined availability:
������������ ��� � �������������� ���� �
This criterion should be employed as a measure of investment performance made in inventory management.
Wild (2002) suggests that when demand is evaluated, historical data for each period should be collected for
each item. The most common type of demand follows a normal distribution where the majority of the
demand falls close to the average and is sometimes much higher or lower.
The mean represents the average demand for the item. When calculating minimum and maximum levels of
inventory, the outliers should be disregarded.
2.1.5 Safety stock Safety stock is the amount of inventory of each item carried in addition to cycle stock to cover calculated
variations in demand (Stock & Lambert, 2001:232). The carrying of safety stock is a direct result of
uncertainties in demand i.e. errors in forecasting (Grant et al., 2006:163).
Reasons for having safety stock may include the convenience of buying in bulk or because supply time
exceeds the time in which items are required. The amount of safety stock held by a company depends on the
variability of demand, reliability of suppliers or dependability of transportation (Wild, 2002).

10
By gathering valid statistical data of sales and replenishments, the safety stock may be computed. Stock and
Lambert (2001) suggests the following equation:
�� �������� � ����� �� where:
�� ! ��� �� ������ ���"# $�%&�$�� �� ������� 68 )�$"� � �� ��� )$����������� �� ���$�*� $�)�� ��+�� �� �, ��� ��$� �������� �� ����� �� ���$�*� ����� � ��� ��$� �������� �� $�)�� ��+�� � "�"��
2.1.6 Lead time The lead time of an item is the time between the occurrence of a shortage and the point where items are
available for supply again. Lead time may be organized into different components according to Wild (2002),
depending on the businesses practice preferred. The following are examples of times that may be included
in total lead time:
- Order review time - Order processing time - Lead time of supplier - Transportation time - Receiving, storage and update time
The consequence of long lead time creates difficulty in inventory replenishment to cover a supply period.
2.1.7 Obsolete items Obsolete items are those items that are damaged, expired or lost i.e. items that cannot be accounted for.
This introduces a hidden cost when calculating holding cost as the amount of inventory stocked may be
related to the amount of obsolete items.
A tool that may be used for the calculation of cost that is variable with inventory levels is simple linear
regression. A calculation for damaged inventory related to the level of inventory follows (Stock & Lambert,
2001):
1. Find dollar observations for as many possible events where stocks are damaged, expired, lost etc. and the dollar value at which total inventory was in each instance.
2. The relationship between damage (D) and inventory level (I) is then graphed and a straight line is drawn through the plotted points whilst minimizing the distance of each plotted point from the graph.
3. Two points may now be selected on the regression line and the change from one to the other is expressed as a percentage. In mathematical terms:
�∆ ∆.⁄ � 0 100%
This concept may be employed for calculating the cost of expired goods, damaged goods, lost goods,
generally items that cannot be summoned up.

Many of the elements of a typical inventory environment are graphically represented in Figur
Wild (2002:113).
2.2 Tools and techniquesThis section is dedicated to a comprehensive
inventory systems.
2.2.1 The Pareto principleA study of wealth distribution in Milan during the 18
of the wealth was controlled by 20 percent of the people. The logic of many with little importance and a few
with great importance has come to be the Pareto Princi
2.2.2 ABC analysis The principle of ABC analysis has been around for many years, more specifically since the Pareto Principle
of imbalance was developed. In the 1950’s ABC classification was devise
a small amount of items which constitute a large amount of annual dollar value of sales
In an organization there may be thousands of different inventory items with multiple units of measure. A
traditional approach to inventory is to classify the items into different classes according to annual dollar
usage i.e. ABC analysis. Wild (2002) summarizes the essence of ABC analysis in
Item Category
A
B
C
Table 2.2
Flores and Whybark (1987) states that little guidance is give
analysis and general advice such as “manage the A items more closely” and “spend less time
are given which does not necessitate the need
stock items may be expressed as:
which is the traditional measurement criteria in ABC analysis.
represent average cost of units, latest cost or standard
items. Table 2.3 from Wild (2002) summarizes approaches and metho
items:
Many of the elements of a typical inventory environment are graphically represented in Figur
Figure 2.1 (Inventory control)
echniques comprehensive description of the tools and techniques generally applied to
rinciple distribution in Milan during the 18th century by Villefredo Pareto revealed that 80 percent
of the wealth was controlled by 20 percent of the people. The logic of many with little importance and a few
with great importance has come to be the Pareto Principle (Stock & Lambert, 2001).
The principle of ABC analysis has been around for many years, more specifically since the Pareto Principle
of imbalance was developed. In the 1950’s ABC classification was devised by General Electric and identifies
a small amount of items which constitute a large amount of annual dollar value of sales (Winston
In an organization there may be thousands of different inventory items with multiple units of measure. A
nal approach to inventory is to classify the items into different classes according to annual dollar
Wild (2002) summarizes the essence of ABC analysis in Table 2.2:
% of Company Business
Amount in Inventory
70% 10%
20% 20%
10% 70% Table 2.2 (Essence of ABC analysis)
states that little guidance is given on what to do after completing
eneral advice such as “manage the A items more closely” and “spend less time
which does not necessitate the need to improve managerial performance. The annual turnover of
� &�� &��*� 4 ! �� "��� measurement criteria in ABC analysis. The assumption may be made that unit cost
, latest cost or standard cost provided that the same cost is applied to all
summarizes approaches and methods concerning the different classes of
11
Many of the elements of a typical inventory environment are graphically represented in Figure 2.1 from
description of the tools and techniques generally applied to
century by Villefredo Pareto revealed that 80 percent
of the wealth was controlled by 20 percent of the people. The logic of many with little importance and a few
The principle of ABC analysis has been around for many years, more specifically since the Pareto Principle
d by General Electric and identifies
(Winston, 2004).
In an organization there may be thousands of different inventory items with multiple units of measure. A
nal approach to inventory is to classify the items into different classes according to annual dollar
:
n on what to do after completing the ABC
eneral advice such as “manage the A items more closely” and “spend less time on the C items”
The annual turnover of
be made that unit cost
provided that the same cost is applied to all
ds concerning the different classes of
12
Class Characteristics Policy Method
A items Few items Tight control Frequent monitoring
Most of the turnover Personal Supervision Accurate records
Communication Sophisticated forecasting
Balanced safety stock Service-level policy
B items Important items Lean stock policy Rely on sophisticated method
Significant turnover Use classic stock control Calculated safety stocks
Fast appraisal method Limit order value
Manage by exception Exception reporting
C items Many items Minimum supervision Simple system
Low turnover value Supply to order where possible Avoid stock outs and excess
Large orders Infrequent ordering
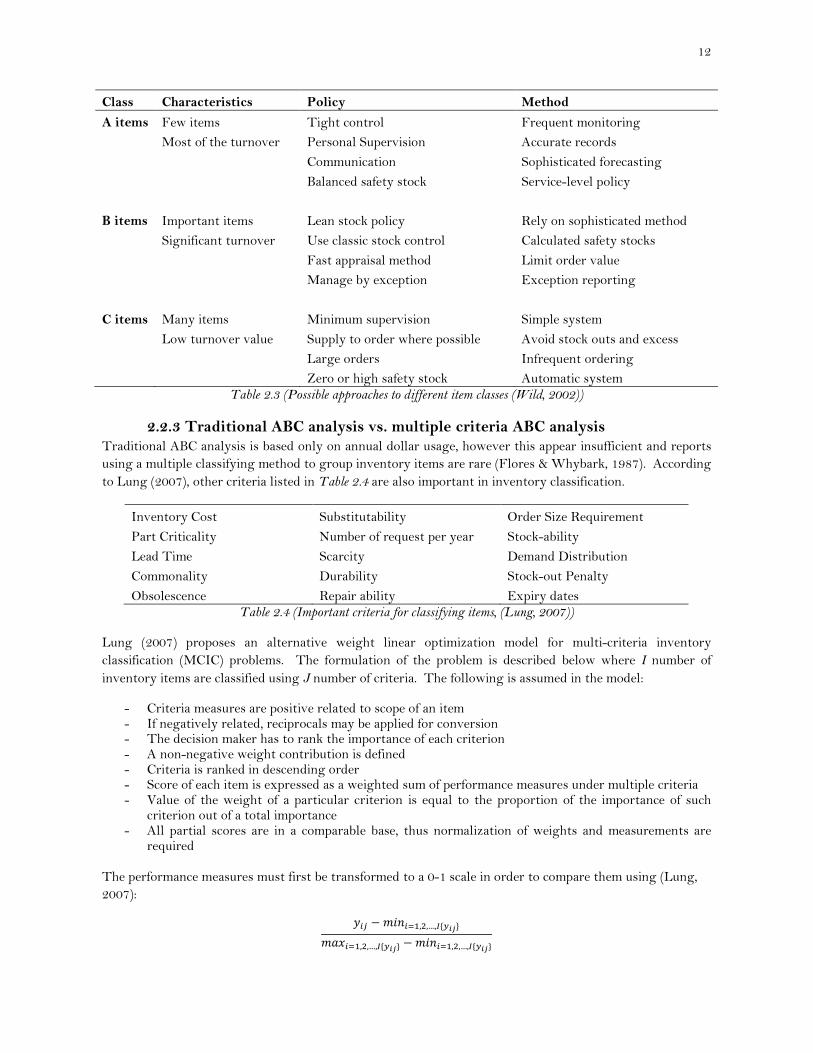
Zero or high safety stock Automatic system Table 2.3 (Possible approaches to different item classes (Wild, 2002))
2.2.3 Traditional ABC analysis vs. multiple criteria ABC analysis Traditional ABC analysis is based only on annual dollar usage, however this appear insufficient and reports
using a multiple classifying method to group inventory items are rare (Flores & Whybark, 1987). According
to Lung (2007), other criteria listed in Table 2.4 are also important in inventory classification.
Inventory Cost Substitutability Order Size Requirement
Part Criticality Number of request per year Stock-ability
Lead Time Scarcity Demand Distribution
Commonality Durability Stock-out Penalty
Obsolescence Repair ability Expiry dates Table 2.4 (Important criteria for classifying items, (Lung, 2007))
Lung (2007) proposes an alternative weight linear optimization model for multi-criteria inventory
classification (MCIC) problems. The formulation of the problem is described below where I number of
inventory items are classified using J number of criteria. The following is assumed in the model:
- Criteria measures are positive related to scope of an item - If negatively related, reciprocals may be applied for conversion - The decision maker has to rank the importance of each criterion - A non-negative weight contribution is defined - Criteria is ranked in descending order - Score of each item is expressed as a weighted sum of performance measures under multiple criteria - Value of the weight of a particular criterion is equal to the proportion of the importance of such
criterion out of a total importance - All partial scores are in a comparable base, thus normalization of weights and measurements are
required
The performance measures must first be transformed to a 0-1 scale in order to compare them using (Lung,
2007):
�56 7�� 589,�,…,<=>?@A��B589,�,…,<=>?@A 7�� 589,�,…,<=>?@A
13
�56 ��+ ���� ���&�$�� & ��$ �+� C�+ "$���$�� D56 D��*+� "� �$��&��� �� )�$��$�� "� �� �+� ��+ ���� & ��$ �+� C�+ "$���$�� where D96 E D�6 E F E D5G ��$ ��� ����� � �5 �"�$� �� �+� ��+ ����
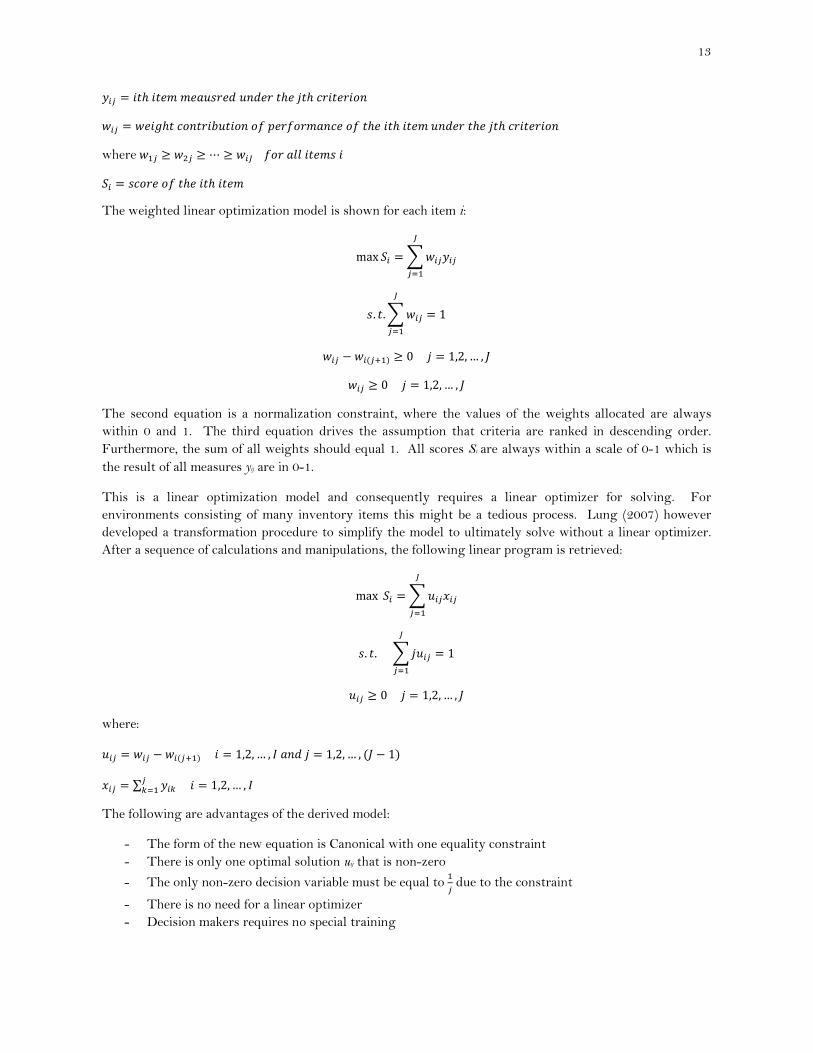
The weighted linear optimization model is shown for each item i:
max �5 KD56�56G
689
�. �.KD56 1G
689
D56 7 D5�6M9� E 0 C 1,2, … , O D56 E 0 C 1,2, … , O
The second equation is a normalization constraint, where the values of the weights allocated are always
within 0 and 1. The third equation drives the assumption that criteria are ranked in descending order.
Furthermore, the sum of all weights should equal 1. All scores Si are always within a scale of 0-1 which is
the result of all measures yij are in 0-1.
This is a linear optimization model and consequently requires a linear optimizer for solving. For
environments consisting of many inventory items this might be a tedious process. Lung (2007) however
developed a transformation procedure to simplify the model to ultimately solve without a linear optimizer.
After a sequence of calculations and manipulations, the following linear program is retrieved:
max �5 K&56B56G
689
�. �. KC&56 1G
689
&56 E 0 C 1,2, … , O where:
&56 D56 7 D5�6M9� � 1,2, … , . � � C 1,2, … , �O 7 1� B56 ∑ �5Q � 1,2, … , .6
Q89
The following are advantages of the derived model:
- The form of the new equation is Canonical with one equality constraint
- There is only one optimal solution uij that is non-zero
- The only non-zero decision variable must be equal to 96 due to the constraint
- There is no need for a linear optimizer
- Decision makers requires no special training
14
The score of the ith inventory item may now be obtained by:
��B689,�,…,G�1C K �5Q6Q89
�
The procedure, according to Lung (2007), following the transformation is done on a spreadsheet package
and consists of the following steps:
- Calculate all partial averages, R@∑ S?T 689,�,…,G@TUR
- Compare and locate the maximum among these partial averages. The corresponding value is the score Si of the ith item
- Sort all the scores Si in descending order - Group all inventory items according to standard ABC analysis principles
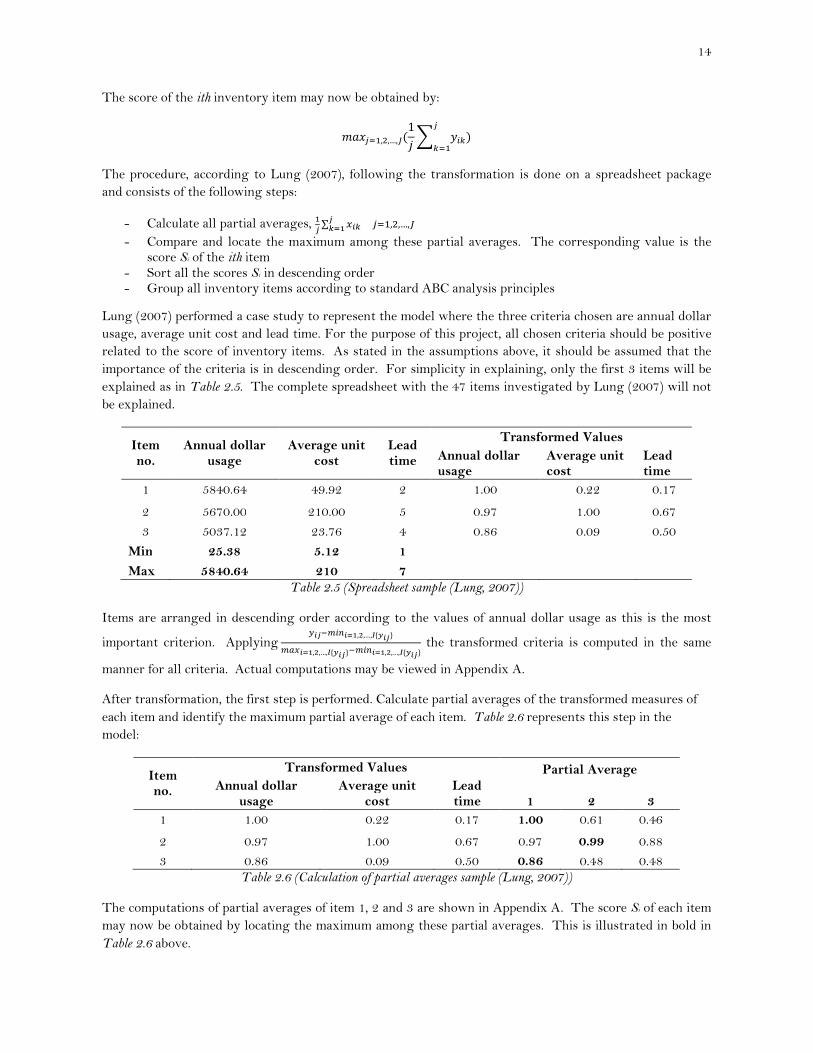
Lung (2007) performed a case study to represent the model where the three criteria chosen are annual dollar
usage, average unit cost and lead time. For the purpose of this project, all chosen criteria should be positive
related to the score of inventory items. As stated in the assumptions above, it should be assumed that the
importance of the criteria is in descending order. For simplicity in explaining, only the first 3 items will be
explained as in Table 2.5. The complete spreadsheet with the 47 items investigated by Lung (2007) will not
be explained.
Item no.
Annual dollar usage
Average unit cost
Lead time
Transformed Values
Annual dollar usage
Average unit cost
Lead time
1 5840.64 49.92 2 1.00 0.22 0.17
2 5670.00 210.00 5 0.97 1.00 0.67
3 5037.12 23.76 4 0.86 0.09 0.50
Min 25.38 5.12 1 Max 5840.64 210 7
Table 2.5 (Spreadsheet sample (Lung, 2007))
Items are arranged in descending order according to the values of annual dollar usage as this is the most
important criterion. Applying >?@VW5X?UR,Y,…,Z=[?@AW\S?UR,Y,…,Z=[?@AVW5X?UR,Y,…,Z=[?@A
the transformed criteria is computed in the same
manner for all criteria. Actual computations may be viewed in Appendix A.
After transformation, the first step is performed. Calculate partial averages of the transformed measures of
each item and identify the maximum partial average of each item. Table 2.6 represents this step in the
model:
Item no.
Transformed Values Partial Average Annual dollar
usage Average unit
cost Lead time 1 2 3
1 1.00 0.22 0.17 1.00 0.61 0.46
2 0.97 1.00 0.67 0.97 0.99 0.88
3 0.86 0.09 0.50 0.86 0.48 0.48 Table 2.6 (Calculation of partial averages sample (Lung, 2007))
The computations of partial averages of item 1, 2 and 3 are shown in Appendix A. The score Si of each item
may now be obtained by locating the maximum among these partial averages. This is illustrated in bold in
Table 2.6 above.

15
The scores are now sorted in descending order and inventory items are grouped by means of the ABC
principle. When comparing the traditional method and the 3 criteria classification method by Lung (2007),
only 28 out of 47 items remained in the same class. Thus, almost half of the items were classified in another
group using the multi-criteria method. For comparison, items were grouped in the following manner: 10 A
class items, 14 B class items and 23 C class items and established the following:
- Eight out of ten items remained in the A group after applying the multi-criteria method.
- Two are re-classified as group B items using the multi-criteria method.
- Only 5 group B items remained in group B comparing to the traditional method, eight is re-
classified as group C items and one as group A.
- 15 of the 23 group C items are kept in group C, whilst seven are moved to group B and one is moved
to group A.
The model is simple and inventory managers will find it easy to use. There is no need for a linear optimizer
as the simple calculations may be performed on any spreadsheet package. Although this model has
shortages and requires further investigation, in the case were a small amount of criteria is considered, the
ranking process is not too difficult.
2.2.4 Economic Order Quantity (EOQ) According to Ballentine et al. (1976) the economic order quantity (EOQ) concept has references that may be
traced back to 1904 and has been used in the American industry for extended periods of time. EOQ is
generally defined as the re-order quantity that will result in the lowest annual cost for that specific item.
Lee and Dobler (1965) group incremental costs in two categories as the optimal re-order quantity depend on
these. The two categories are as follows: (1) inventory carrying costs and (2) inventory acquisition costs.
Cargal et al. (1963) too support this policy as optimal. The preferred point in EOQ is where (1) = (2), which
result in lowest annual total cost. The following is a standard formula for EOQ:
]^_ ��`abc
� &�� &��*�/���� � - The demand for items per year e f�$ & �� "��� - Independent of EOQ
g . �� ��$� "�$$�� * "��� �$ g���� * "��� - Cost of holding per unit per time � �%&������ "��� – Flat fee for placing an order, independent of EOQ
There are a number of assumptions to be made when employing EOQ formulas. Winston (2004) suggests
the following:
- Repetitive ordering - Constant demand - Constant lead time - Continuous ordering
Orders are placed on a regular basis as inventory is depleted and replenishing is required and orders may be
placed at any point in time, this is called continuous review models. Demand remains constant throughout
certain periods. The lead time for each order is a known constant i.e. the institution is familiar with the lead
time from all suppliers (Winston, 2004:104-105).

16
According to Winston (2004:113) other elements may also be derived from the basic EOQ formula. These
include calculations using the formulas in Table 2.7:
Orders per year /]^_ Annual holding cost 1
2 4 ]^_ 4 g Total annual cost g � � Re-order point h 4 /]^_
Table 2.7 (Formulas derived from basic EOQ model)
2.3 Enterprise Resource Planning (ERP)
2.3.1 A brief history on enterprise resource planning
The following definition for ERP is by Blackstone and Cox (2005:38) and states that ERP is a “framework for
organising, defining and standardizing the business processes necessary to effectively plan and control an organization
so the organization can use its internal knowledge to seek external advantage”.
Joining in effort, J.I Case and IBM developed MRP (Material Requirements Planning) in the late 1960’s
which was a state of the art method for scheduling and planning. In the 1970’s MRP rapidly became a
fundamental part in production control and planning (Jacobs & Weston, 2006).
In 1972 SAP (Systemanalyse und Programmentwicklung) was started by 5 engineers and Oracle
Corporation was established in 1977 (Jacobs & Weston, 2006). From there multiple enthusiasts and
companies started developing software, mainly focussed on manufacturing companies, for the purpose of
planning and control.
In the 1980’s the term MRP was being referred to as Manufacturing Resource Planning rather than Material
Requirements Planning and in due course MRP II came to pass (Jacobs & Weston, 2006). Dave Duffield
and Ken Morris found PeopleSoft Company in 1987 at which stage all of the main ERP companies (Oracle,
SAP, PeopleSoft, IBM, J.D Edwards and Baan) were already in position (Jacobs & Weston, 2006). In the
late 1980’s the question “What is not included in MRP II?” started to arise.
In the early 1990’s the term Enterprise Resource Planning was introduced by Gartner Group (Wylie, 1990).
Customers and new development of the major ERP companies escalated during this era where the most
significant growth was depicted in the year 2000 (Jacobs & Weston, 2006).
In August 2003 PeopleSoft and J.D Edwards merged companies and in 2005 PeopleSoft were taken over by
Oracle leaving only two major competitors, SAP and Oracle (Jacobs & Weston, 2006). ERP systems have
since reached maturity. Current ERP developed into an environment that is ready for intelligent planning
and logic execution as not much regarding the logic of these systems has changed since the 1970’s (Jacobs &
Weston, 2006).
2.3.2 ERP implementation The pilot point for ERP implementation is determining the steps required to reach the goal. Edwin (2006)
believes there are seven steps defining the best path for implementation of a new ERP system. The steps are
shown in Figure 2.2 below:

17
Figure 2.2 (ERP implementation steps (Edwin, 2006))
The implementation steps in Figure 2.3 below have been compiled by Umble et al. (2003) who integrated
numerous works:
Figure 2.3 (ERP implementation steps (Umble et al., 2003))
Umble et al. (2003) states that various authors have defined critical success factors for the implementation of
an ERP system, of these, the most prominent are:
- a understanding of strategic goals - commitment of top management - effective project management - organizational change management - an immense implementation team - accurate data - extensive education and training - focussed performance measures - multi-site issues
Umble et al. (2003) concludes that ERP systems are highly complex and implementation of these is difficult
and cost a lot of money, time and corporate resources. Therefore the correct implementation procedure is
critical to the success of the venture.
1. Strategic plan2. Readiness assessment
3. Prepare for vendor selection
4. Vendor selection
5. Plan the implementation
6. Implement the ERP solution
7. Post implementation assessment
1. Review pre-implemenation process
to date
2. Install and test any new software
3. Install software and perform computer room
pilot
4. Attend system training
5. Train on the conference room pilot
6. Establish security and necessary permissions
7. Ensure that all data bridges are sufficiently robust and the data is sufficiently accurate
8. Document policies and procedures
9. Bring the entire orginization online, either once off or in a phases approach
10. Improve continually
18
Chapter 3
Solution Design It isn’t that they can’t see the solution; it’s that they can’t see the problem – G.K. Chesterson
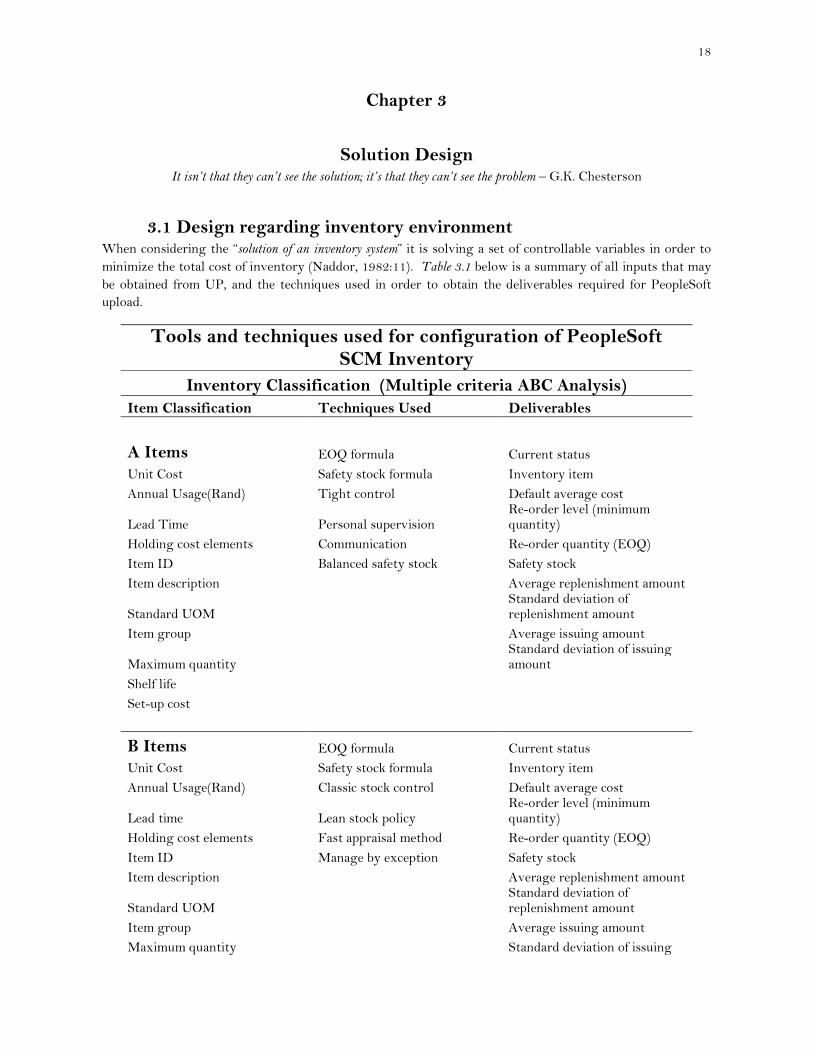
3.1 Design regarding inventory environment When considering the “solution of an inventory system” it is solving a set of controllable variables in order to
minimize the total cost of inventory (Naddor, 1982:11). Table 3.1 below is a summary of all inputs that may
be obtained from UP, and the techniques used in order to obtain the deliverables required for PeopleSoft
upload.
Tools and techniques used for configuration of PeopleSoft SCM Inventory
Inventory Classification (Multiple criteria ABC Analysis)
Item Classification Techniques Used Deliverables
A Items EOQ formula Current status
Unit Cost Safety stock formula Inventory item
Annual Usage(Rand) Tight control Default average cost
Lead Time Personal supervision Re-order level (minimum quantity)
Holding cost elements Communication Re-order quantity (EOQ)
Item ID Balanced safety stock Safety stock
Item description
Average replenishment amount
Standard UOM
Standard deviation of replenishment amount
Item group
Average issuing amount
Maximum quantity
Standard deviation of issuing amount
Shelf life Set-up cost
B Items EOQ formula Current status
Unit Cost Safety stock formula Inventory item
Annual Usage(Rand) Classic stock control Default average cost
Lead time Lean stock policy Re-order level (minimum quantity)
Holding cost elements Fast appraisal method Re-order quantity (EOQ)
Item ID Manage by exception Safety stock
Item description
Average replenishment amount
Standard UOM
Standard deviation of replenishment amount
Item group
Average issuing amount
Maximum quantity
Standard deviation of issuing

19
amount
Shelf life Set-up cost
C Items EOQ formula Current status
Unit Cost Safety stock formula Inventory item
Annual Usage(Rand) Minimum supervision Default average cost
Lead time Supply to order where possible Re-order level (minimum quantity)
Holding cost elements Large orders Re-order quantity (EOQ)
Item ID
Safety stock
Item description
Average replenishment amount
Standard UOM
Standard deviation of replenishment amount
Item group
Average issuing amount
Maximum quantity
Standard deviation of issuing amount
Shelf life Set-up cost
Other considerations
EOQ derivations Total ordering cost
EOQ derivations Total cost Table 3.1 (Summary of inputs, techniques and deliverables)
3.2 Design regarding PeopleSoft environment PeopleSoft provides numerous methods to enhance understanding and implementation of the ERP system
and literature makes provision for numerous step-by-step guides for implementing an ERP system. The
phases, tools and technologies for implementation suggested by PeopleSoft are portrayed in Table 3.2 below
and serve as the guideline for implementing the inventory module in 2011:
Phase Description Tools and technologies used Installation Involves installation of PeopleSoft
CD’s and demonstration environment which include application servers, process scheduler servers, web servers and a PeopleSoft database
Data mover Configuration manager PeopleSoft application designer PeopleTools security Data integrity tools
Application configuration
Configuration of PeopleSoft applications to fit organisation processes. The activities include security access, customising pages, creating batch programs etc.
PeopleTools security PeopleSoft application designer Global technology PeopleCode PeopleSoft application engine PeopleSoft set-up manager
System configuration
Configuration of the infrastructure that supports the deployment of application configuration. This is the phase were necessary effects are set in place for users to be able to complete business transactions.
Internet technology (portal) PeopleTools security PeopleSoft application server PeopleSoft process scheduler PeopleSoft MultiChannel framework PeopleSoft set-up manager

20
PeopleSoft mobile agent PeopleSoft application engine
Decision support configuration
Activities involved with setting up support system for decision makers to gather business information. Development of predefined queries and reports, set-up a system to generate scheduled reports, access to OLAP cubes etc.
PeopleSoft process scheduler PeopleSoft query PeopleSoft analytic calculation engine PeopleSoft tree manager Crystal reports for PeopleSoft S/n vision PeopleSoft cube manager QR for PeopleSoft PeopleCode
Business process integration
Set-up of systems that enables business processes to span multiple business areas. Includes setting up XML-driven integration technology that enables disparate systems to exchange data. This step includes set-up of PeopleSoft workflow which enable multiple users to route data and notifications
PeopleSoft integration broker Workflow technology PeopleSoft component interfaces PeopleSoft application designer PeopleCode PeopleSoft application engine
Maintenance Maintenance of the PeopleSoft system once used by the end-users. This include monitoring of system performance, new release upgrades, applying patches etc.
PeopleSoft performance manager Diagnostic framework PeopleSoft data archive manager PeopleSoft change assistant PeopleSoft tools utilities
Table 3.2 (PeopleSoft implementation phases and the tools and technologies required)
The PeopleSoft implementation team should be familiar with the tools and applications mentioned above.
All tools and technologies described for each implementation phase should direct the team in the correct
direction throughout implementation during 2011.

21
Chapter 4
Solutions and recommendations It so happens that the world is undergoing a transformation to which no change that has yet occurred can be compared,
either in scope or in rapidity – Charles de Gaulle
Prior to the discussion on solutions and recommendations a few notes regarding this report is necessary.
There is a CD at the end of the report containing all data concerning the project. As UP is undergoing a
system renewal procedure, many of the required information and data is not readily retrievable. This poses
some constraints on the solutions presented as there is insufficient and inaccurate data that had to be used.
4.1 ABC Analysis The inputs required for completing the ABC analysis includes the annual usage, average unit cost and lead
time for each item. The Pareto Principle is apparent during this project and is used to gain the supplier lead
times. 16 vendors are responsible for the supply of 80% of the stationary stores inventory, for these the lead
times are exact. For the remaining 20% a lead time of 2 days is used as the university buyer responsible for
purchasing stationary suggests. Data for the annual usage is from the EAS 062 P program in Unikom. A
list of all store issues from 1 July 2009 to 30 June 2010 was compiled from which the annual usage and
average unit cost was determined.
PeopleSoft comprise of built-in functionality regarding categorized items i.e. ABC classified items. Settings
regarding this built-in functionality may be altered in order to reflect UP’s unique needs.
The literature from Lung (2007) was utilized to execute the multiple-criteria ABC classification. The
calculation sequence includes the transformation of criteria, calculation of partial averages, acquiring of all
maximum row partial averages and sorting of items according to this maximum partial average.
The outcome portrays the classification of items according to Lung’s (2007) method and the traditional ABC
approach. Spreadsheets of item data and the classification procedure may be viewed on the CD (file
Data.xls). The final comparison of classified items is as follows:
- 21 out of 43 items remained in class A - 13 items in class A are now in class B - 30 items in class B are now in class C - 4 items in class B are now in class A - 13 items in class C are now in class A - 24 items in class C are now in class B
There is a total of 42 items in class A, 87 items in class B and 304 items in class C. This is in order with the
Pareto Principle and the essence of ABC analysis in Table 2.2. These items may now be appropriately
prioritised according to correct item and class procedures as a more accurate approach to inventory items is
MCIC.
22
4.2 EOQ Computations
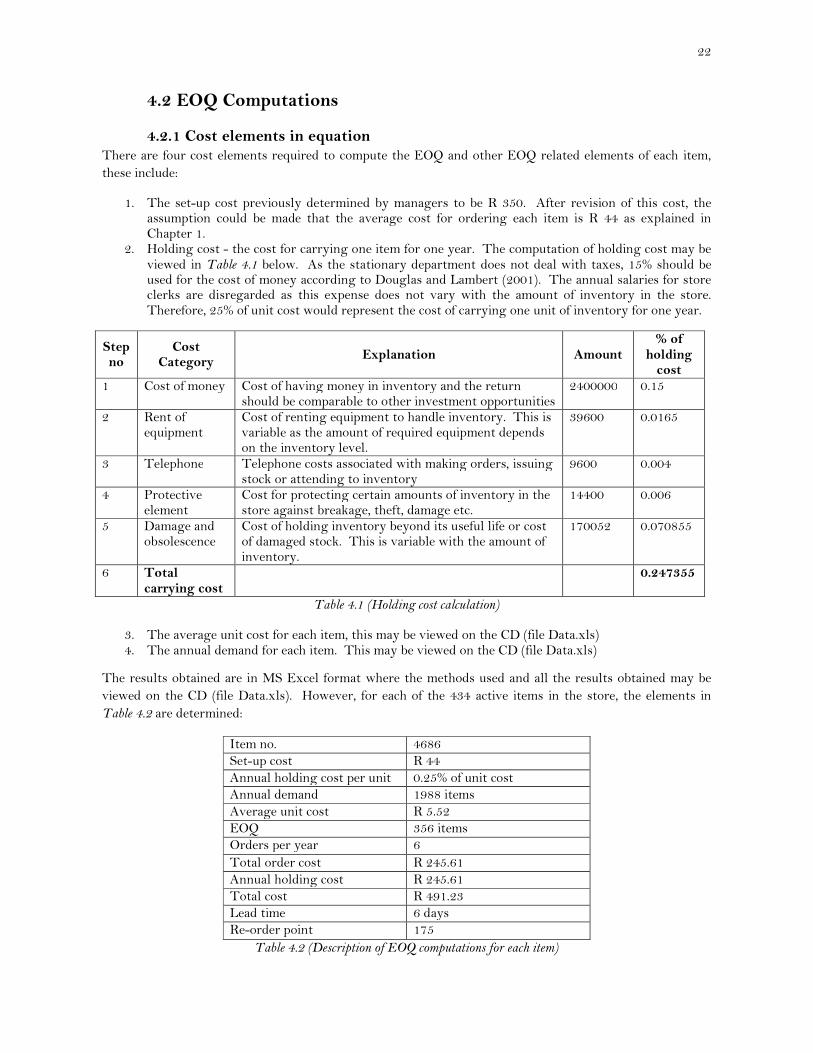
4.2.1 Cost elements in equation There are four cost elements required to compute the EOQ and other EOQ related elements of each item,
these include:
1. The set-up cost previously determined by managers to be R 350. After revision of this cost, the assumption could be made that the average cost for ordering each item is R 44 as explained in Chapter 1.
2. Holding cost - the cost for carrying one item for one year. The computation of holding cost may be viewed in Table 4.1 below. As the stationary department does not deal with taxes, 15% should be used for the cost of money according to Douglas and Lambert (2001). The annual salaries for store clerks are disregarded as this expense does not vary with the amount of inventory in the store. Therefore, 25% of unit cost would represent the cost of carrying one unit of inventory for one year.
Step no
Cost Category
Explanation Amount % of
holding cost
1 Cost of money Cost of having money in inventory and the return should be comparable to other investment opportunities
2400000 0.15
2 Rent of equipment
Cost of renting equipment to handle inventory. This is variable as the amount of required equipment depends on the inventory level.
39600 0.0165
3 Telephone Telephone costs associated with making orders, issuing stock or attending to inventory
9600 0.004
4 Protective element
Cost for protecting certain amounts of inventory in the store against breakage, theft, damage etc.
14400 0.006
5 Damage and obsolescence
Cost of holding inventory beyond its useful life or cost of damaged stock. This is variable with the amount of inventory.
170052 0.070855
6 Total carrying cost
0.247355
Table 4.1 (Holding cost calculation)
3. The average unit cost for each item, this may be viewed on the CD (file Data.xls) 4. The annual demand for each item. This may be viewed on the CD (file Data.xls)
The results obtained are in MS Excel format where the methods used and all the results obtained may be
viewed on the CD (file Data.xls). However, for each of the 434 active items in the store, the elements in
Table 4.2 are determined:
Item no. 4686
Set-up cost R 44
Annual holding cost per unit 0.25% of unit cost
Annual demand 1988 items
Average unit cost R 5.52
EOQ 356 items
Orders per year 6
Total order cost R 245.61
Annual holding cost R 245.61
Total cost R 491.23
Lead time 6 days
Re-order point 175
Table 4.2 (Description of EOQ computations for each item)

23
4.3 Safety stock computations
4.3.1 Elements in equation Calculations are based on demand and replenishment data for one year. A current rule at UP is that no
movement on items are allowed for two years after which the items become obsolete. In the available data
there are many such items and zero values are assumed for these items. The following four elements are
required for calculating of the amount of safety stock to be kept in inventory:
1. Average amount each item was replenished with for the year 1 May 2009 – 30 April 2010. This represents � in the safety stock equation in Chapter 2.1.5
2. Standard deviation of the replenishment amount for each item. This represents �R in the safety stock equation in Chapter 2.1.5
3. Average amount of each item issued for the year 1 July 2009 to 30 June 2010. This represents � in the safety stock equation in Chapter 2.1.5
4. Standard deviation of the amounts issued for each item. This represents �S in the safety stock equation in Chapter 2.1.5
The amount of safety stock that should be kept in inventory for each item and all calculation requirements
may be viewed on the CD (file Data.xls). Keeping the amount as suggested on the CD (file Data.xls) of
safety stock in inventory would cover 68% of variation probabilities.
4.4 PeopleSoft Input
4.4.1Current renewed replenishing method During the phase 1 implementation of PeopleSoft FSCM Financial and Procurement at UP, a preliminary
replenishing procedure was employed as portrayed in Figure 1.5 in Chapter 1. The procedure as currently
running at UP may be viewed in Appendix B, Figure B1. In PeopleSoft, stationary or any other inventory
replenishment would follow the same procedure; however certain attributes are given to inventory items
which pilot the PeopleSoft inventory management procedure that operates in the “background”.
4.4.2 PeopleSoft Set-up requirements PeopleSoft workflow technology - Workflow capabilities enable efficient automated information flow
throughout the enterprise. The application tools automate business processes that are time consuming in
which activities of multiple users are merged. The term workflow refers to the larger process involved with
doing business tasks.
A step-by-step guide of business processes and rules is required for the implementation of PeopleSoft
workflow. These business processes are defined and approved by UP stakeholders, managers and applicable
staff. Designing a workflow enables the automation of paper-based business processes, increase employee,
customer and supplier collaboration and system integration. Some of the main elements of PeopleSoft
workflow are listed below:
- Process definitions for the business - Sets of logically ordered steps in a process called activities - Worklists, which are automated “to-do” lists - Rules determining the activities required to process business data - Roles describing where people fit into the workflow - Routings specifying where information goes and the form it takes, e.g. email, message or worklist
entry

The above mentioned elements are decisions for stakeholders to agree upon before implementation of
phase 2 PeopleSoft starts. Figure 4.1
PeopleSoft:
Figure 4.1 (Steps when designing a workflow application)
Inventory facility structure - PeopleSoft may reflect different storage levels within an inventory business
unit. A business unit consist of storage areas which
a unique store code, for the stationary
storage levels. The campus in question represents Level 1 storage space in PeopleSoft. Eac
certain amount of shelves with corresponding BIN numbers in Unikom, these BIN numbers represent Level
3 storage in PeopleSoft. For each store the shelf dimensions should be uploaded in PeopleSoft.
Define business rules in PeopleCode for triggering events
6.1 Define events and routings that make up workflow in application designer
5.1. Record defining all application specific information
4.1 Query roles
3.1 Steps, activities and processes defined in first step
2. Build supporting definitions
If applications required for the workflow do not exist, build required definitions for fields, records, pages,
1. Designing a workflow application
1.1. Analyse and document business processes
The above mentioned elements are decisions for stakeholders to agree upon before implementation of
4.1 below describes the steps for designing a workflow a
(Steps when designing a workflow application)
pleSoft may reflect different storage levels within an inventory business
unit. A business unit consist of storage areas which may be divided in storage levels. At UP, each store has
stationary store the code is 8211, this code represents Level 2 in PeopleSoft
. The campus in question represents Level 1 storage space in PeopleSoft. Eac
certain amount of shelves with corresponding BIN numbers in Unikom, these BIN numbers represent Level
3 storage in PeopleSoft. For each store the shelf dimensions should be uploaded in PeopleSoft.
8. Test
7. Define event triggers
Define business rules in PeopleCode for triggering events
6. Define workflow objects
6.1 Define events and routings that make up workflow in application designer
5. Define worklist records
5.1. Record defining all application specific information 5.2. Separate worklists for different type of entries
4. Define roles and role users
4.2 User list roles
3. Create workflow maps
3.1 Steps, activities and processes defined in first step3.2 Peoplesoft application designer to create graphical
maps representing business processes
2. Build supporting definitions
If applications required for the workflow do not exist, build required definitions for fields, records, pages, components, and menus.
1. Designing a workflow application
1.2. Diagram the process flow1.3. Document workflow object
attributes
24
The above mentioned elements are decisions for stakeholders to agree upon before implementation of
designing a workflow application in
pleSoft may reflect different storage levels within an inventory business
At UP, each store has
the code is 8211, this code represents Level 2 in PeopleSoft
. The campus in question represents Level 1 storage space in PeopleSoft. Each store has a
certain amount of shelves with corresponding BIN numbers in Unikom, these BIN numbers represent Level
3 storage in PeopleSoft. For each store the shelf dimensions should be uploaded in PeopleSoft.
5.2. Separate worklists for different type of entries
3.2 Peoplesoft application designer to create graphical maps representing business processes
If applications required for the workflow do not exist, build required definitions for fields, records, pages,
1.3. Document workflow object
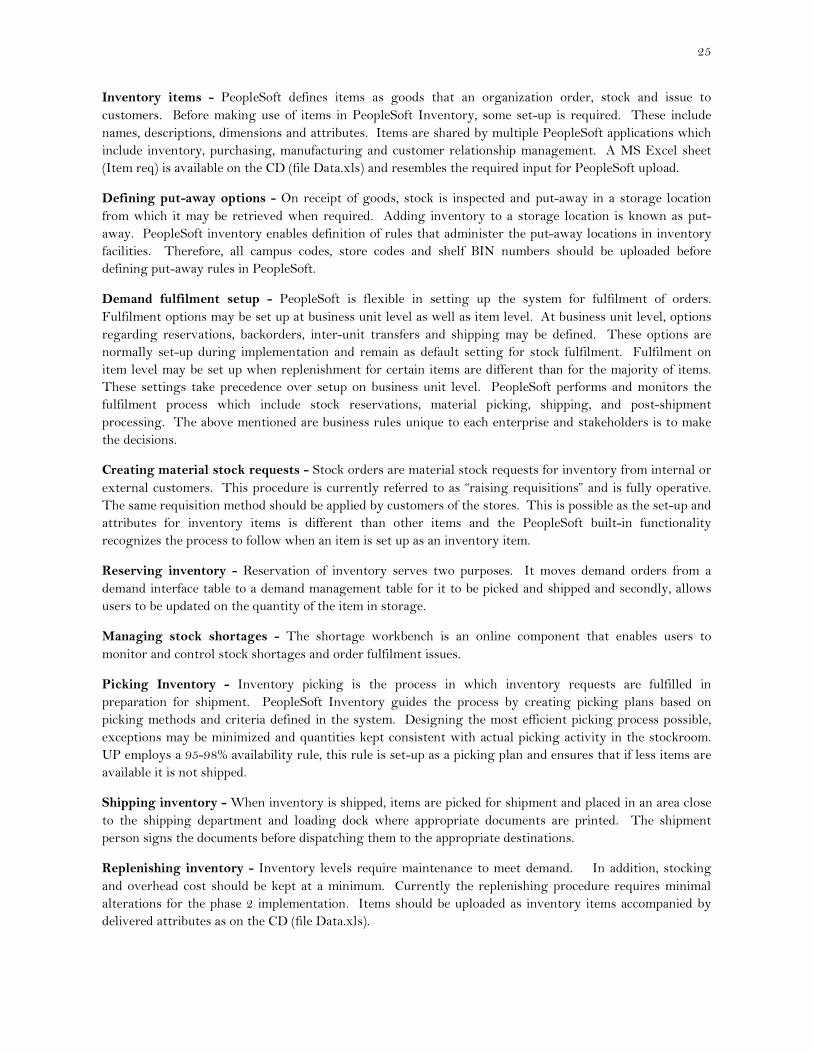
25
Inventory items - PeopleSoft defines items as goods that an organization order, stock and issue to
customers. Before making use of items in PeopleSoft Inventory, some set-up is required. These include
names, descriptions, dimensions and attributes. Items are shared by multiple PeopleSoft applications which
include inventory, purchasing, manufacturing and customer relationship management. A MS Excel sheet
(Item req) is available on the CD (file Data.xls) and resembles the required input for PeopleSoft upload.
Defining put-away options - On receipt of goods, stock is inspected and put-away in a storage location
from which it may be retrieved when required. Adding inventory to a storage location is known as put-
away. PeopleSoft inventory enables definition of rules that administer the put-away locations in inventory
facilities. Therefore, all campus codes, store codes and shelf BIN numbers should be uploaded before
defining put-away rules in PeopleSoft.
Demand fulfilment setup - PeopleSoft is flexible in setting up the system for fulfilment of orders.
Fulfilment options may be set up at business unit level as well as item level. At business unit level, options
regarding reservations, backorders, inter-unit transfers and shipping may be defined. These options are
normally set-up during implementation and remain as default setting for stock fulfilment. Fulfilment on
item level may be set up when replenishment for certain items are different than for the majority of items.
These settings take precedence over setup on business unit level. PeopleSoft performs and monitors the
fulfilment process which include stock reservations, material picking, shipping, and post-shipment
processing. The above mentioned are business rules unique to each enterprise and stakeholders is to make
the decisions.
Creating material stock requests - Stock orders are material stock requests for inventory from internal or
external customers. This procedure is currently referred to as “raising requisitions” and is fully operative.
The same requisition method should be applied by customers of the stores. This is possible as the set-up and
attributes for inventory items is different than other items and the PeopleSoft built-in functionality
recognizes the process to follow when an item is set up as an inventory item.
Reserving inventory - Reservation of inventory serves two purposes. It moves demand orders from a
demand interface table to a demand management table for it to be picked and shipped and secondly, allows
users to be updated on the quantity of the item in storage.
Managing stock shortages - The shortage workbench is an online component that enables users to
monitor and control stock shortages and order fulfilment issues.
Picking Inventory - Inventory picking is the process in which inventory requests are fulfilled in
preparation for shipment. PeopleSoft Inventory guides the process by creating picking plans based on
picking methods and criteria defined in the system. Designing the most efficient picking process possible,
exceptions may be minimized and quantities kept consistent with actual picking activity in the stockroom.
UP employs a 95-98% availability rule, this rule is set-up as a picking plan and ensures that if less items are
available it is not shipped.
Shipping inventory - When inventory is shipped, items are picked for shipment and placed in an area close
to the shipping department and loading dock where appropriate documents are printed. The shipment
person signs the documents before dispatching them to the appropriate destinations.
Replenishing inventory - Inventory levels require maintenance to meet demand. In addition, stocking
and overhead cost should be kept at a minimum. Currently the replenishing procedure requires minimal
alterations for the phase 2 implementation. Items should be uploaded as inventory items accompanied by
delivered attributes as on the CD (file Data.xls).

26
Managing consigned inventory purchasing - Consignment inventory is a supply chain management
strategy in which goods are stored in a business unit without paying the vendor until the goods are
consumed. As the vendor owns consigned stock until it is consumed, warehouse stocking with consignment
items enables reduction in carrying costs and defers payment of liabilities. However, for implementing this
strategy consignment vendors should first be identified in PeopleSoft payables. This application will be
utilized after the phase 2 implementation as the set-up for this strategy is not a necessity for successful
operation of the inventory module.
Vendor managed inventory - Vendor managed inventory is a supply chain management strategy in which
a vendor manages inventory located in a customer’s warehouse. The goods may be consigned or non-
consigned. As the vendor, a Vendor Managed Inventory (VMI) business unit will be created which
represents customer inventory. This includes items, quantities and storage space. Proper management and
synchronization is required to use this functionality and will only be employed after the phase 2
implementation.
Counting inventory stock - To ensure sufficient available stock for order fulfilment, regular inventory
counts is required. The process includes physical counting of stock and system updates. UP stakeholders
define parameters or calculation rules for a combination of a business unit and a utilization group to
calculate utilization rules. For each rule, a specification regarding static or percent values is made. Various
types of rules include:
- Forecasted amount - Forecasted quantity - Historical amount of transactions - Historical adjustment amount - Historical adjustment quantity - Historical usage amount - Lead-time (days) - On hand quantity - Unit cost
Currently complete inventory counts are done twice yearly in June and November for comparison of actual
and system inventory amounts. Test counts of 5% of items are held monthly, if the test count deviates more
than 2.5% in rand value, an additional 5% is counted, if again the deviation is more than 2.5% the entire store
is counted to determine the cause of the deviation. A current business rule is to manage inventory with
97.5% accuracy. These unique rules may now be set-up as utilization rules connected to certain inventory
items.
PeopleSoft Inventory calculates the minimum permitted value for all utilization rules. In PeopleSoft
Inventory, ABC classification primarily drives the cycle count frequency. PeopleSoft Inventory allows for
cycle counts and physical counts. When the count type is confirmed, a counting event is generated by the
system. Periodic checks on inventory quantities may be performed using the physical inventory process
which involves the recording of hand item quantities, reconciling the system and updating the system to
reflect accurate physical inventory.
Maintaining inventory - another purpose of inventory maintenance is to know the location and quantities
of stock. PeopleSoft Inventory enables users to maintain inventory by tracking and updating quantities
during material movement transactions such as put-away, transfers and shipping.
An illustration of all the PeopleSoft input requirements may be viewed in Table 4.3 below. Table 4.3 includes
the attributes that PeopleSoft requires for inventory items, the relevant source for acquiring the data and a
description of what the attribute entails.

27
Attribute Source Description Item no Unikom Each item is assigned an individual code in Unikom. Item description Unikom In Unikom, each item receives a description when creating the item Current status Active All of the current items are active, when no movement has occurred in
2 years the status becomes inactive or if the item is awaiting approval the status is pending.
Inventory item Report All of the items are inventory type items Standard UOM Unikom The standard unit of measure in which items are issued to customers Default category Report In this report each item is classified as A, B or C. PeopleSoft applies
different rules to each category. Item group Unikom All items are assembled in similar groups with unique identifying
codes Default average cost Report The default average cost is determined by averaging purchasing data
for one year. In PeopleSoft, this value automatically updates. Standard pack UOM Unikom Standard unit of measure in which items are purchased from suppliers Max quantity Unikom Maximum allowable quantity in storage for each item Shelf life Report Conducted study reveals certain stationary items have shelf life or
expiry dates Re-order point Report The level of inventory at which an order should be placed i.e. minimum
allowable amount of stock for each item Re-order quantity Report The optimal amount to purchase with each order Safety stock Report Amount of stock to keep in inventory to cover for variations in
demand Annual demand Report Determined by analysis of demand data for one year
Table 4.3 (Item requirements for PeopleSoft upload)
The current standard issuing method in PeopleSoft is illustrated in Figure 4.2 below. It pilots the execution
of business, however customizations to this method is required to portray the unique processes and
procedures of UP.
Figure 4.2 (Issuing process model)
A suggested preliminary issuing procedure may be viewed in Appendix B, Figure B2. The figure provides
minimal detail on the elements required however, places the above mentioned requirements in context with
the set-up requirements. The phase 2 implementation team may build on the basic process illustrated in
Figure B2.
Recieve stock request
Reserve inventory
Picking process
Ship inventory
28
Chapter 5
Conclusion
5.1 Objectives revised As stated in Chapter 1, the main objective of the project is to develop a revised inventory model to pilot the
phase 2 implementation of PeopleSoft Inventory at UP. The elements which forms the project are issues
such as re-order points, re-order quantities, shelf life, item mix etc. and the employment of the unique
processes and procedures of UP into a new ERP system.
The final model regarding all inventory aspects will be employed in PeopleSoft in order to optimize UP’s
inventory environments.
As pointed out in Chapter 1, studies are based on a single inventory environment at UP and proved that
industrial engineering concepts may be engaged in an inventory and ERP implementation environment.
The introduction of optimum strategies poses many benefits and in a competitive world institutions should
remain at the forefront.
5.2 Future research According to Edwin there are numerous documents required when planning for ERP implementation. Some
considerations for the future are a change impact analysis and a training plan. The first is used to facilitate
and overcome the aspect of resistance to change which follows the implementation of the new software. The
second is a necessity when implementing, and include technical training, functional training, end-user
training, management training and many more (Edwin, 2006). The post-implementation sequence described
by Edwin has the purpose of ensuring that objectives were met and to analyse the extent to which the
software is being used.
29
Bibliography Anon., 2004. Yahoo finance. [Online] Available at: www.finance.yahoo.com/q/pr?s=PSFT [Accessed 2001].
Anon., 2010. PeopleBooks. [Online] Available at: http://appupkpr01.up.ac.za/ODSContent/FSM_Inventory9/toc.html [Accessed March 2010].
Associates, R., n.d. [Online] REM Associates Available at: http://remass.com [Accessed August 2010].
Atkinson, C., 2005. Inventory Management Review. [Online] Available at: http://inventorymanagementreview.org/2005/09/a_simplified_lo.html [Accessed August 2010].
Ballentine, R., Ravin, R.L. & Gilbert, J.R., 1976. ABC inventory analysis and economic order quantity concept in hospital pharmacy purchasing. American Journal of Hospital Pharmacy, 33(33), pp.552-55.
Blackstone, J.H. & Cox, J.F., 2005. APICS Dictionary.
Cargal, J.M., Hadley, G. & Whiten, T.M., 1963. The EOQ Invenory Formula. Analysis of Inventory Systems.
Douglas, M.C. & Lynwood, J.A., 1976. Forecasting and Time Series Analysis. United States of America: McGraw Hill.
Edwin, T.C., 2006. Collegiate Project Services. [Online] Collegiate Project Services Available at: www.collegiateproject.com [Accessed August 2010].
Flores, B.E. & Whybark, D.C., 1987. Implementing Multiple Criteria ABC Analysis. 7(1 and 2).
Grant, D.B., Lambert, D.M., Stock, J.R. & Ellram, M.L., 2006. Fundamentals of Logistics Management. New York: McGraw Hill Education.
Jacobs, R.F. & Weston, T., 2006. Enterprise resource planning (ERP) - A brief history. Journal of Operations Management, 25, pp.357-63.
Kurtz, D., 2004. PeopleSoft for the Oracle DBA - A PeopleSoft survival guide or Oracle DBA's. Apress, 1-59059-422-3.
Lee, L. & Dobler, D., 1965. Purchasing and materials management: text and cases. In Purchasing and materials management: text and cases. New York: McGraw Hill. pp.196-99.
Lewis, C., 2001. Inventory Control. In LEWIS, C. Inventory Control. New York: Palgrave. pp.125-225.
Lung, W.N., 2007. A simple classifier for multiple criteria ABC analysis. European Journal of Operational Research, (177), pp.344-53.
Murdoch, C.C., 2006. Application of Theory of Constraints to Inventory Management in the Veterinary Academic Hospital (VAH) of the Faculty of Veterinary Science of the University of Pretoria. Dissertation. Pretoria: Faculty of Economics and Management Sciences University of Pretoria.
Naddor, E., 1982. Inventory Systems. Florida: Robert E. Krieger Publishing Company.

30
Oracle, 2010. Oracle. [Online] Available at: http://www.oracle.com/corporate/story.html?origref=http://www.oracle.com/us/corporate/index.html [Accessed March 2010].
Richardson, H., 1995. Control Your Costs then Cut Them. December.
Stock, R.J. & Lambert, M.D., 2001. Strategic Logistics Management. New York: McGraw-Hill.
Umble, E.J., Haft, R.R. & Umble, M.M., 2003. Enterprise resource planning: Implementation procedures and critical success factors. European Journal of Operational Research, 146, pp.241-57.
Wild, T., 2002. Best Practice in Inventory Management. Oxford: Elsevier Science Ltd.
Winston, W.L., 2004. Introduction to Probability Models. Canada: Curt Hinrichs.
Wylie, L., 1990. A vision of the next-generation MRP II. Scenario S.

31
Appendix
Appendix A Transformation calculations
Annual dollar usage Item1: (5840.64-25.38)/(5840.64-25.38) = 1.00 Item2: (5670-25.38)/(5840.64-25.38) = 0.97 Item3: (5037.12-25.38)/(5840.64-25.38) = 0.86
Average unit cost Item1: (49.92-5.12)/(210-5.12) = 0.22 Item2: (210-5.12)/(210-5.12) = 1.00 Item3: (23.76-5.12)/(210-5.12) = 0.09
Lead time Item1: (2-1)/(7-1) = 0.17 Item2: (5-1)/(7-1) = 0.67 Item3: (4-1)/(7-1) = 0.50
Table A1 (Transformation calculations)
Calculations of partial averages
Item1 1.00/1 = 1.00 (1.00/2 + 0.22/2) = 0.61 (1.00/3 + 0.22/3 + 0.17/3) = 0.46
Item2 0.97/1 = 0.97 (0.97/2 + 1.00/2) = 0.99 (0.97/3 + 1.00/3 + 0.67/3) = 0.88
Item3 0.86/1 = 0.86 (0.86/2 + 0.09/2) = 0.48 (0.86/3 + 0.09/3 + 0.50/3) = 0.48
Table A2 (Calculation of partial average)

32
Appendix B
Figure B1 (Current preliminary replenishing procedure)
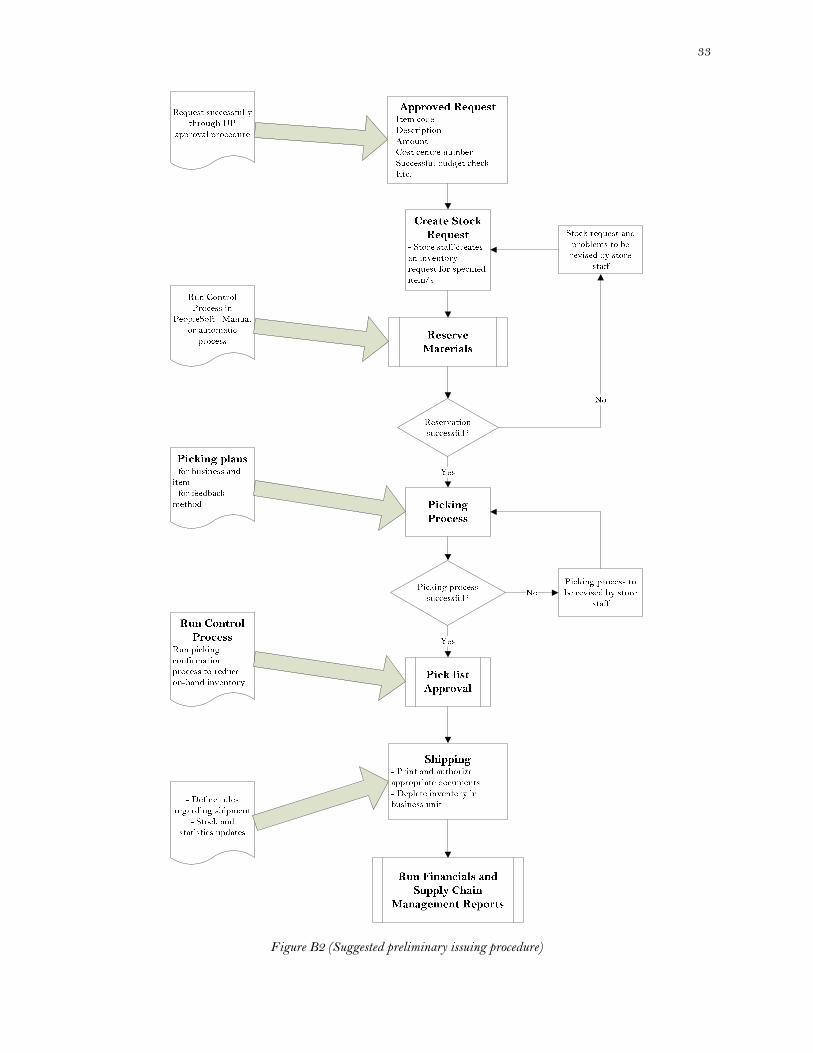
33
Figure B2 (Suggested preliminary issuing procedure)