introduction to the course and the techniques
TRANSCRIPT

Introduction to the Course and the Techniques
Jeffry R. Alger, PhD Ahmanson-Lovelace Brain Mapping Center
Department of Neurology ([email protected])
CTSI Neuroimaging April 2014

Rationale for the Course

Translational Clinical Science Cycle

Translational Clinical Science Cycle Using imaging to discover new information about human disease
Discovery of new approaches to image human anatomy and physiology (basic science bench to bedside)
Use of imaging to make clinical trials of drugs or devices more scientifically valid (imaging biomarkers) or less expensive (surrogate endpoints)
Clinical trials that test the diagnostic power of imaging
Routine clinical use of imaging (diagnosis and treatment response assessment)

Course Components • Discovery of new approaches to image human anatomy and physiology
– Nader Pouratian, MD – Danny JJ Wang, PhD
• Using imaging to discover new information about human disease
– Katherine Narr, PhD – Paul M. Vespa, MD
• Use of multimodal imaging in clinical trials
– David S. Liebeskind, MD – Nancy L. Sicotte, MD – Benjamin M. Ellingson, PhD

MRI 101 Laboratory • Friday April 11 at 11 AM
– Meet at the entrance to the Ahmanson-Lovelace Brain Mapping Center (660 CE Young Drive South)
• Content – MRI Safety – The ‘look and feel’ of MRI
• For patients and investigators
Medical Imaging
• Medical Imaging is based on the interaction between electromagnetic radiation and living tissue
• The brain is surrounded by bone – Ultrasonography does not play a major role in brain
imaging • Neuroimaging is equally based on interaction
between – Electromagnetic radiation and bone – Electromagnetic radiation and brain

Neuroimaging Requirements
• Brain imaging requires electromagnetic radiation that – is safe – penetrates bone – interacts with brain to produce contrast to
anatomy/function/physiology
Brain Components • Water • Salts • Metabolites • Neurotransmitters • Protein • Lipids • Membranes • Cells • Blood vessels • Hemoglobin

Electromagnetic radiation is composed on oscillating electric and magnetic fields
(wave frequency is inversely proportional to wavelength)

MRI
Near Infared Brain
Imaging
Poor Bone Penetration
Computed tomography
(CT)
Positron Emission
tomography (PET)
Brain Heating
Optical Brain
Imaging
Molecular Damage
EcoG/EEG
Bone penetration • Bone excludes
– Infrared Light – Visible Light – Ultraviolet Light
• Bone is penetrated by – High intensity Xrays
• Computed Tomography • Xray Angiography
– Radio frequency waves • Magnetic Resonance Imaging
– Microwaves – Gamma rays
• Positron Emission Tomography

Microwave Imaging?
Imaging with Microwaves? • Microwave-based imaging is impractical due to
– Tissue heating – Poor penetration
• Small charged particles (Na+, K+, Cl-) in tissue can move in resonance with the applied microwave field – Friction between the moving ions and medium
produces heat. • Beginning to be a factor for MRI because newest
MRI frequencies approach the microwave region of the electromagnetic spectrum
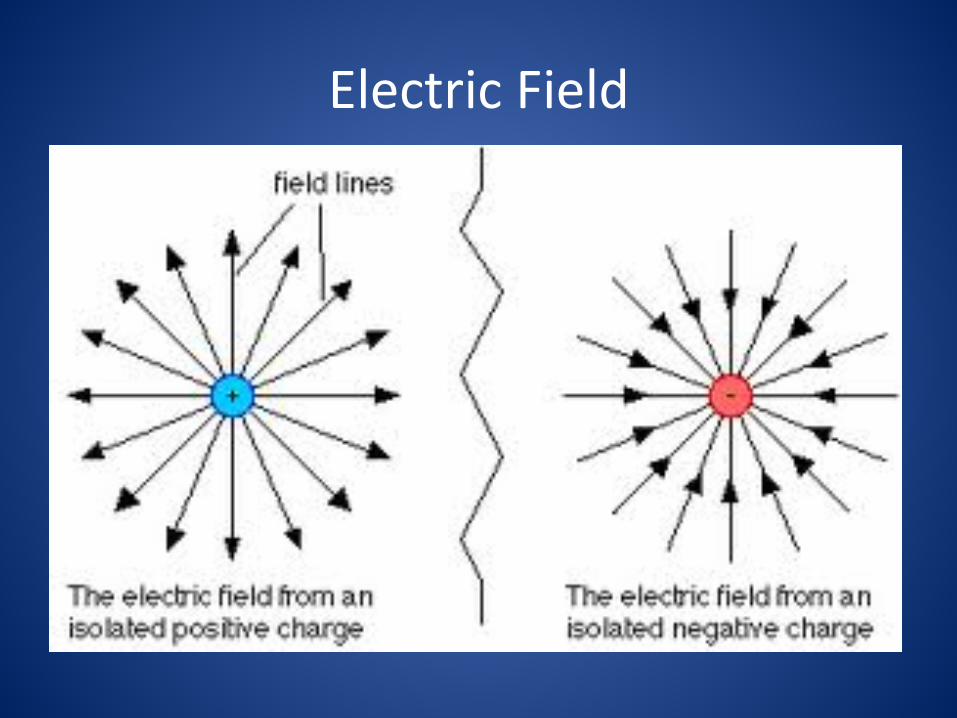
Electric Field

EcoG/EEG (very low frequency electric field
imaging)

Electrocortigraphy
Electrocortigraphy (EcoG)
• Uses electrodes placed on the brain cortex to detect time varying electric fields produced by neural activity – A functional brain imaging technique – Very low frequency
• Detection of E-fields is much enhanced if electrodes are placed directly on the brain surface – Bone is an electric insulator – Electric field strength decays rapidly with distance
• Safety – Requires neurosurgery – Applicable only to specific patient populations

Electroencephalagraphic Imaging

Magnetic Fields

Magnetic Fields
• Movement of electric charge (electric current) produces a dipole magnetic field
• Movement of a magnetic field produces electric current
• Magnetic fields always have two or more poles – All magnetism is fundamentally due to electric
current

Magnetic Resonance Imaging (low frequency magnetic field imaging)
Magnetic Resonance Imaging • MRI utilizes the magnetic resonance signal produced by
the protons (1H) of tissue water.
• MRI has become the “method of choice” for nondestructive visualization of brain anatomy – Anatomic contrast depends on microscopic biophysical
properties of tissue that (mostly) influence how fast water molecules can move
• Functional MRI techniques ‘trick’ the proton MR signal to depend on brain function – Usually indirect detection of blood flow or oxygenation
changes that accompany neural activity
B0
H
B0
H
H O
H
H O
H
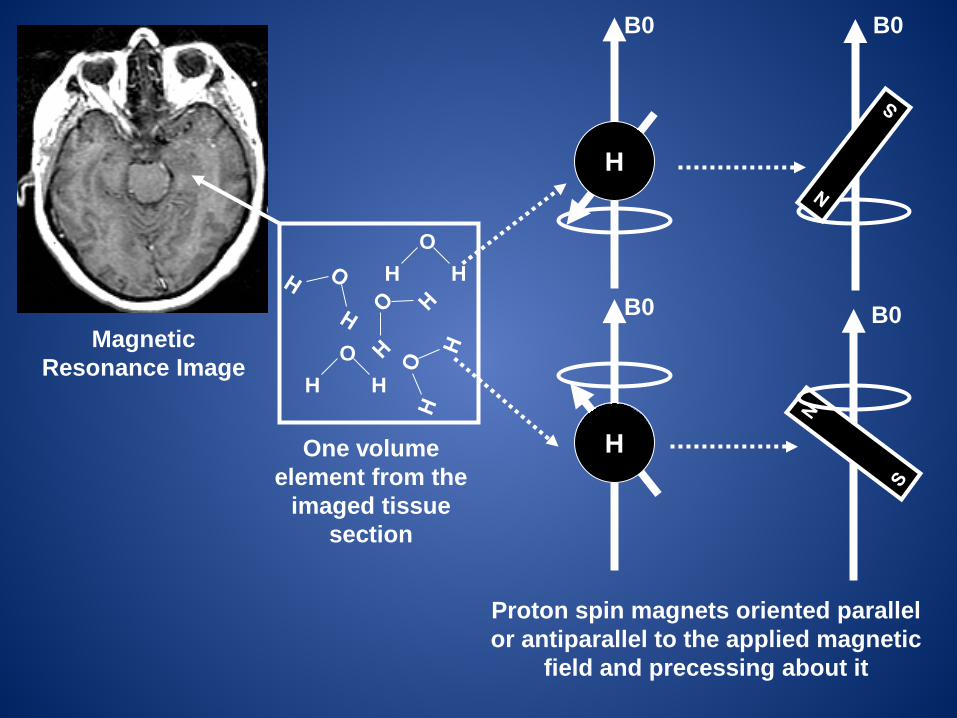
One volume element from the
imaged tissue section
Magnetic Resonance Image
Proton spin magnets oriented parallel or antiparallel to the applied magnetic
field and precessing about it
B0
B0
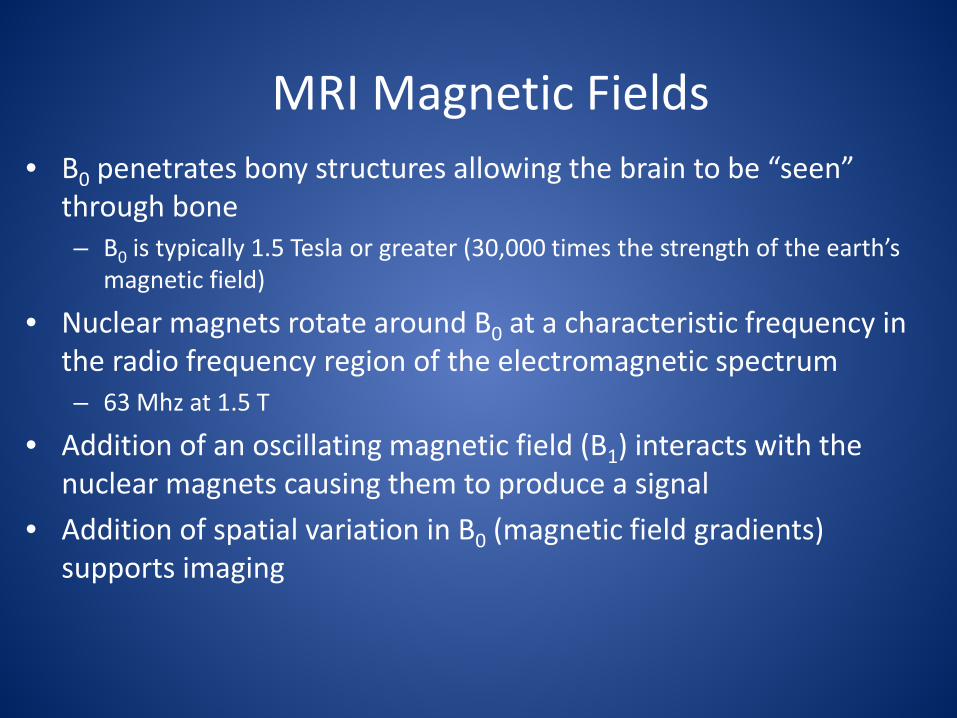
MRI Magnetic Fields • B0 penetrates bony structures allowing the brain to be “seen”
through bone – B0 is typically 1.5 Tesla or greater (30,000 times the strength of the earth’s
magnetic field)
• Nuclear magnets rotate around B0 at a characteristic frequency in the radio frequency region of the electromagnetic spectrum – 63 Mhz at 1.5 T
• Addition of an oscillating magnetic field (B1) interacts with the nuclear magnets causing them to produce a signal
• Addition of spatial variation in B0 (magnetic field gradients) supports imaging
Magnetic Field Gradient(s) and Imaging
• A magnetic field gradient is a smooth variation in B0 from one position to another position – Anterior-to-posterior variation – Superior-to-inferior variation – Left-to-right variation
• Gradients are purposefully applied as part of the imaging process
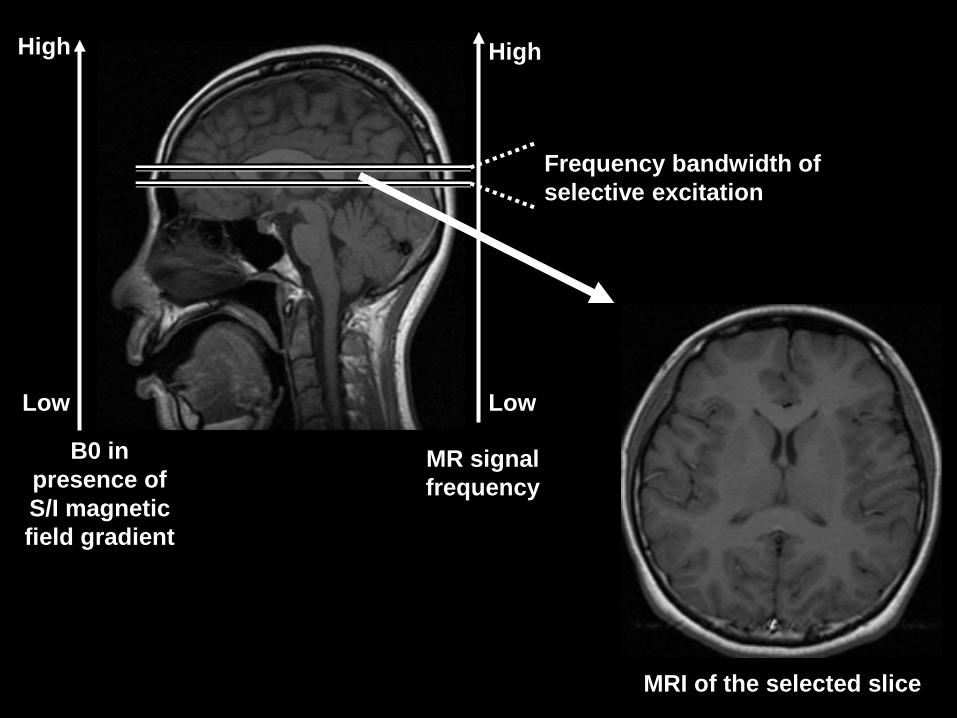
Frequency bandwidth of selective excitation
MRI of the selected slice
B0 in presence of S/I magnetic field gradient
Low
High
MR signal frequency
Low
High
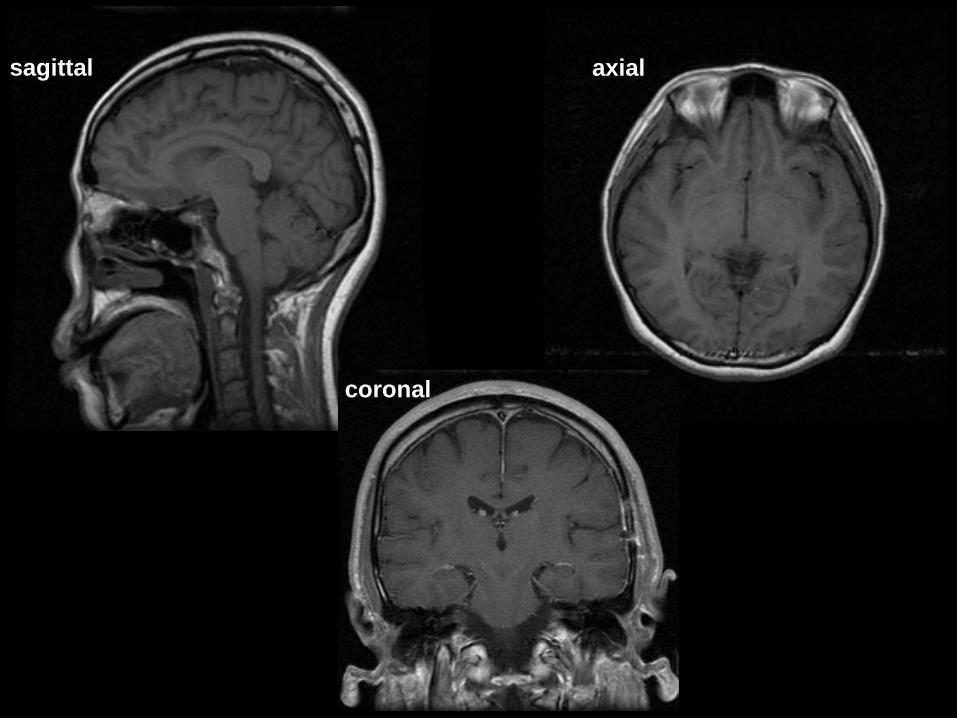
sagittal axial
coronal


The Image
• “Signal” discussed thus far is depicted as gray level of each element in the image – White = greater signal – Gray = less signal – Black = no signal
• MR Images usually have no absolute calibration

MRI Contrast • Signal/image creation in MRI uses a complex set of
pulses of the oscillating B1 magnetic field – A pulse sequence
• Adjustment of pulse sequence timing parameters can be used to create different types of signal contrast to cellular composition
• T1-weighted imaging: Gray matter, white matter and cerebrospinal fluid give unique signal intensities – Often used for brain morphometry studies
• T2-weighted imaging: Fluid produces prominent signals – Often used for evaluating different types of lesions
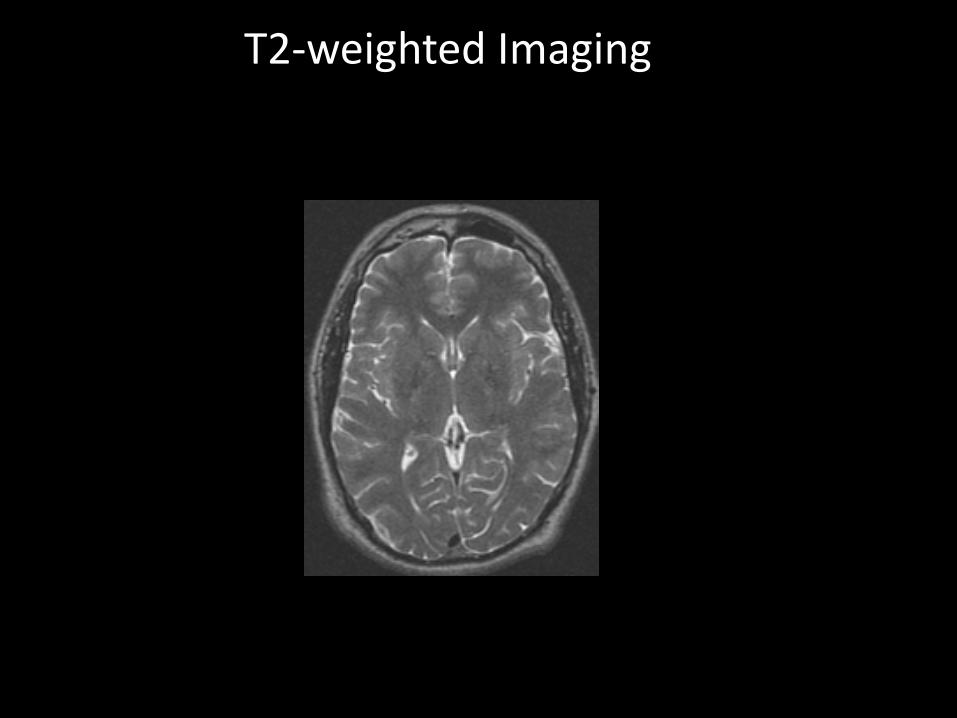
T2-weighted Imaging
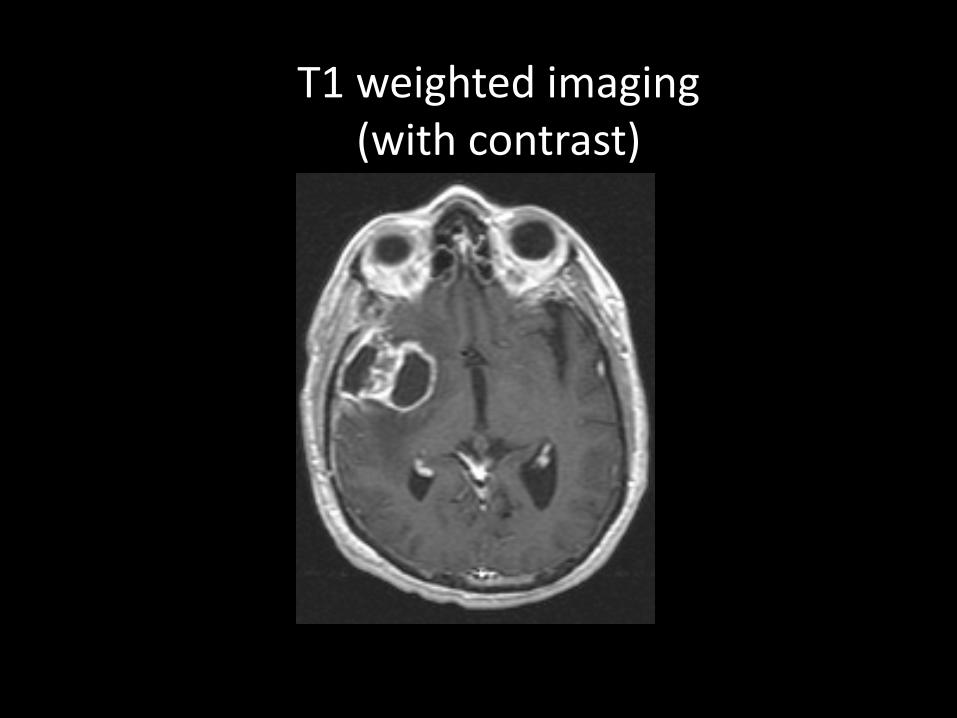
T1 weighted imaging (with contrast)

MRI Contrast Agents
• Typical contrast agents are chelates of metals ions (e.g. gadolinium) having unpaired electron spins
• Water molecules must “touch” the agent to enhance signal
• Typical contrast reagents are designed to not pass the blood brain barrier
• Signal is enhanced only where blood brain barrier is damaged
r
Computed Tomography
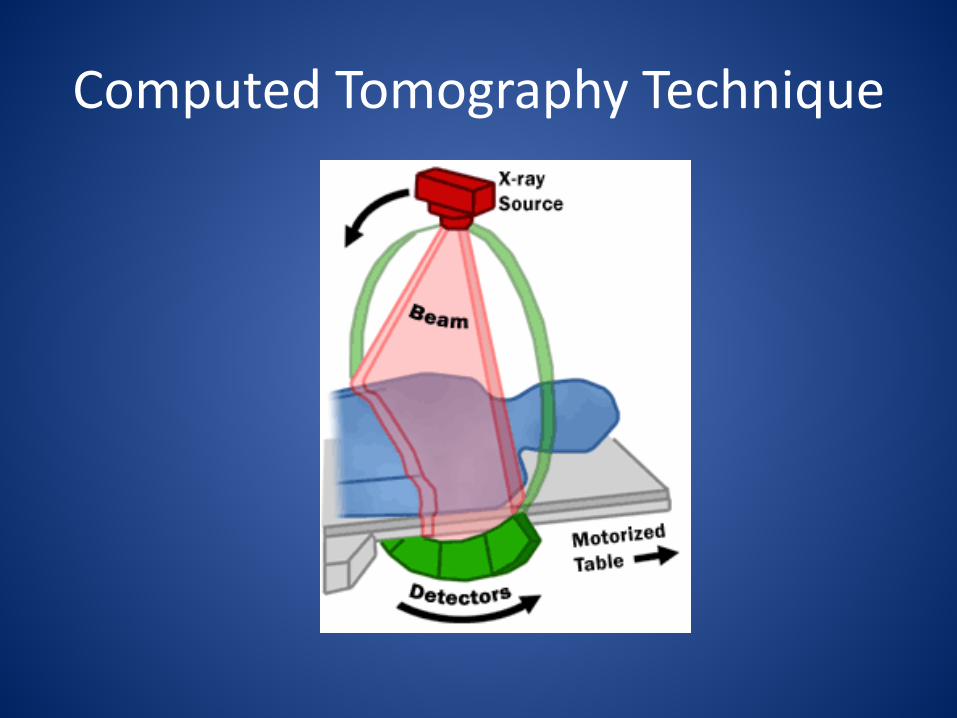
Computed Tomography Technique

CT Contrast
CT contrast
• Intrinsic CT contrast is within brain is limited – Gray matter, white matter and CSF can be
distinguished, but not as effectively as with MRI • CT neuroimaging often uses intravenous contrast
agent (iodinated materials) to create vascular contrast
• CT angiography (CTA) – Visualization of larger blood vessels (usually arteries)
• CT perfusion (CTP) – Dynamic measurement of contrast passage to
measure/image microvascular perfusion
CT Safety • Xrays strip electrons from molecules
– Ionizing radiation – Damages molecules
• In neuroimaging large xray intensity is used to overcome absorption by calcium in bone
• Xray exposure is sometimes a limiting factor – Dynamic studies such as CTP – Multiple studies on the same patient
• Allergic reaction to contrast agent • Renal insufficiency that results in poor clearance of
contrast agent
Positron Emission Tomography
Positron Emission Tomography
• Based on the existence of a subatomic particle called a positron (a positive electron)
• Certain unstable nuclear isotopes emit positrons – Requires an onsite cyclotron
• Emitted positrons move a small distance before encountering a negative electron causing decay to two gamma rays

PET Technique

PET Imaging
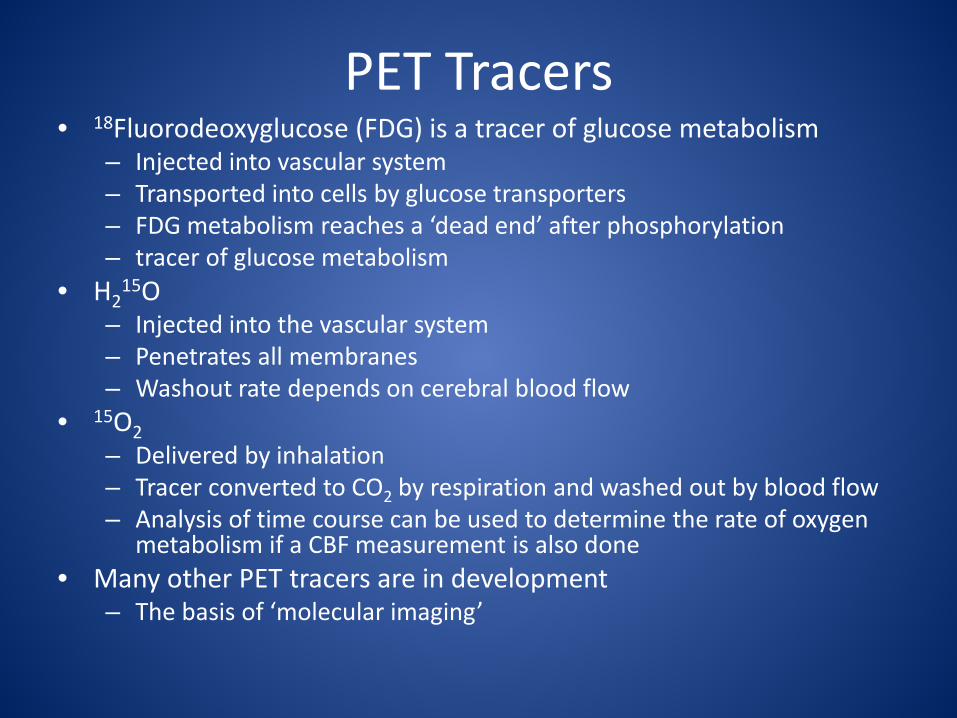
PET Tracers • 18Fluorodeoxyglucose (FDG) is a tracer of glucose metabolism
– Injected into vascular system – Transported into cells by glucose transporters – FDG metabolism reaches a ‘dead end’ after phosphorylation – tracer of glucose metabolism
• H215O
– Injected into the vascular system – Penetrates all membranes – Washout rate depends on cerebral blood flow
• 15O2 – Delivered by inhalation – Tracer converted to CO2 by respiration and washed out by blood flow – Analysis of time course can be used to determine the rate of oxygen
metabolism if a CBF measurement is also done • Many other PET tracers are in development
– The basis of ‘molecular imaging’

PET Tracers
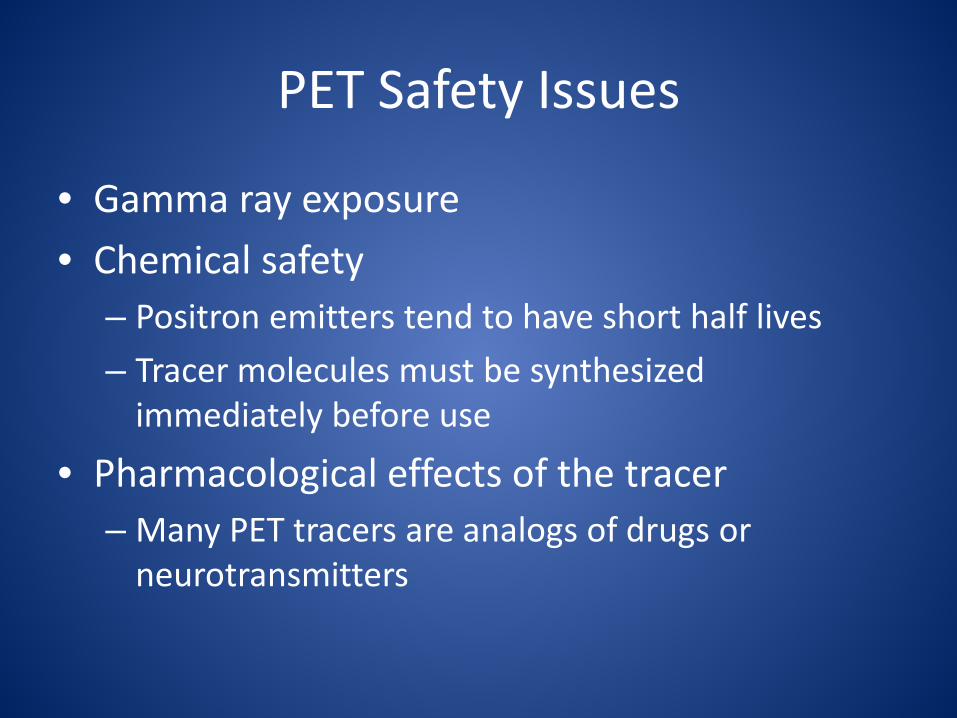
PET Safety Issues
• Gamma ray exposure • Chemical safety
– Positron emitters tend to have short half lives – Tracer molecules must be synthesized
immediately before use
• Pharmacological effects of the tracer – Many PET tracers are analogs of drugs or
neurotransmitters

Image Processing/Interpretation (be critical)
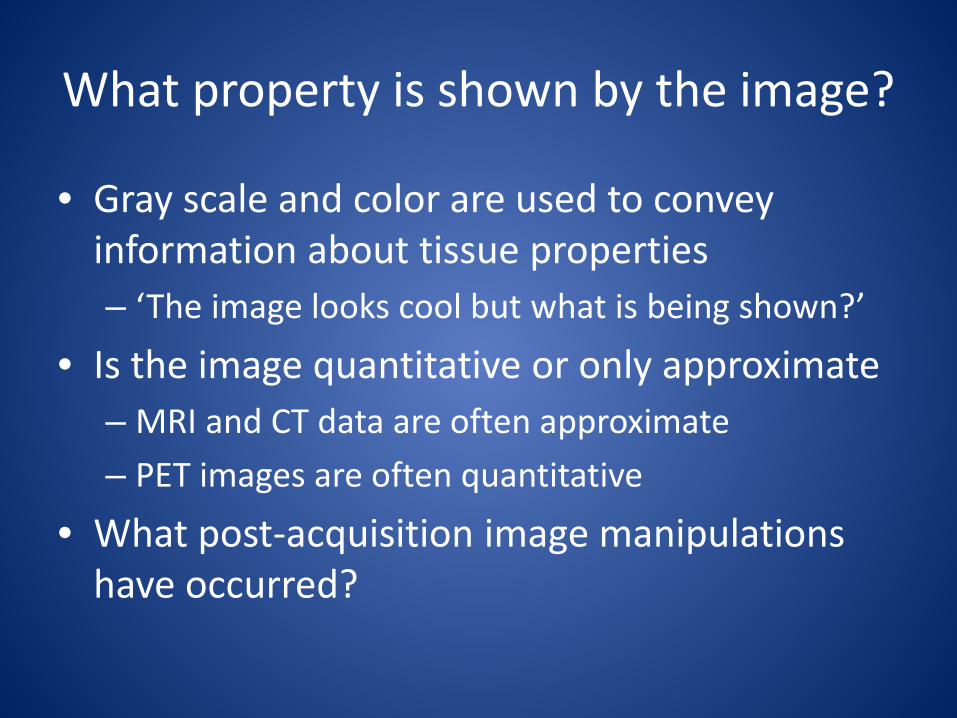
What property is shown by the image?
• Gray scale and color are used to convey information about tissue properties – ‘The image looks cool but what is being shown?’
• Is the image quantitative or only approximate – MRI and CT data are often approximate – PET images are often quantitative
• What post-acquisition image manipulations have occurred?
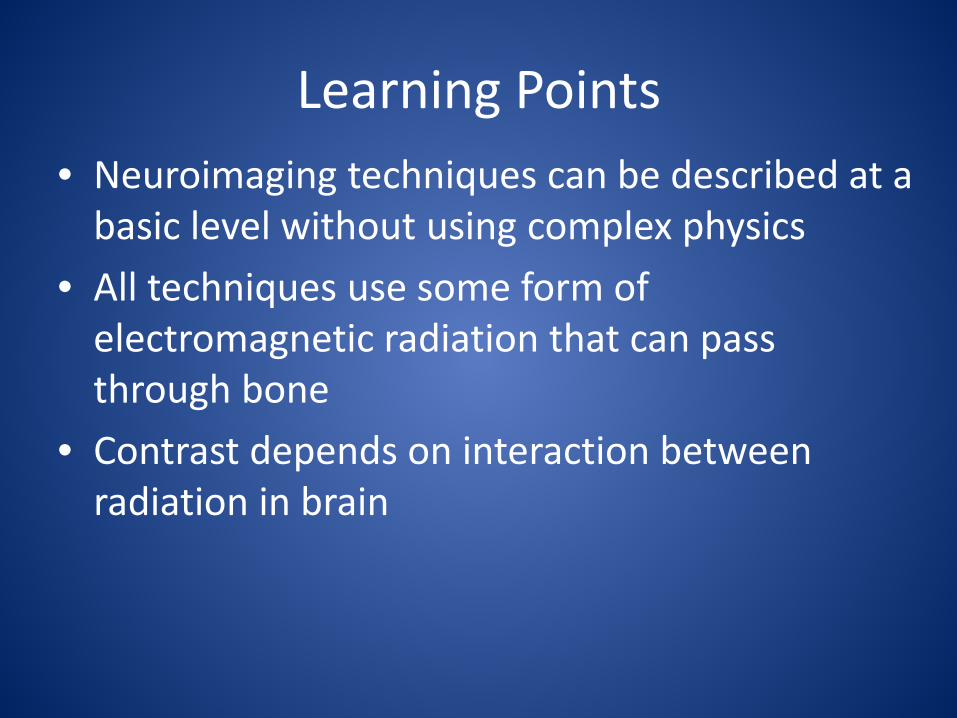
Learning Points • Neuroimaging techniques can be described at a
basic level without using complex physics • All techniques use some form of
electromagnetic radiation that can pass through bone
• Contrast depends on interaction between radiation in brain
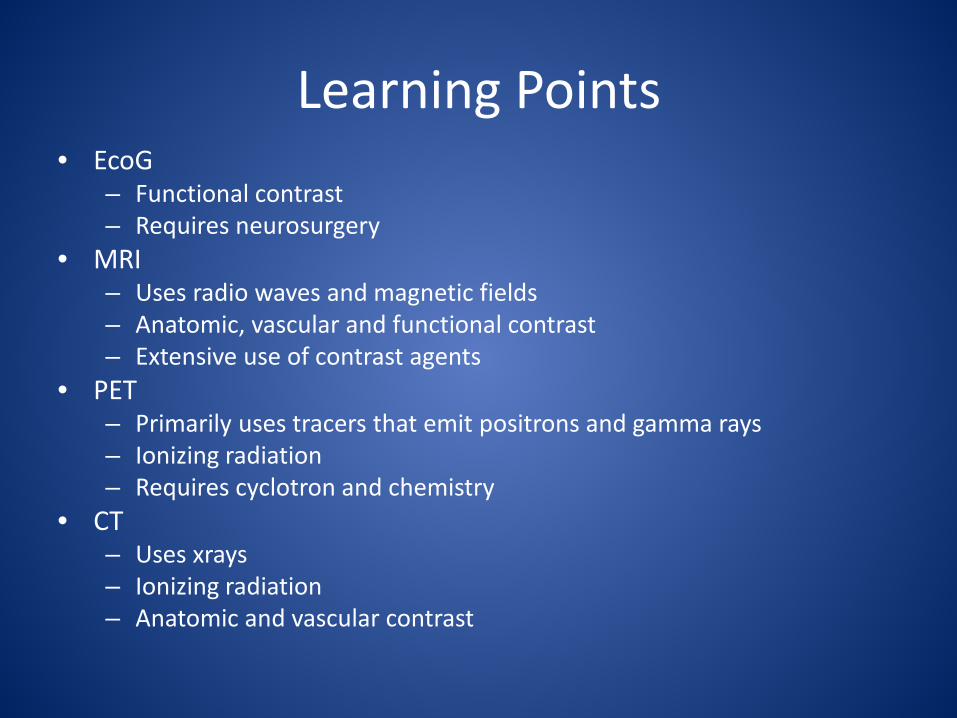
Learning Points • EcoG
– Functional contrast – Requires neurosurgery
• MRI – Uses radio waves and magnetic fields – Anatomic, vascular and functional contrast – Extensive use of contrast agents
• PET – Primarily uses tracers that emit positrons and gamma rays – Ionizing radiation – Requires cyclotron and chemistry
• CT – Uses xrays – Ionizing radiation – Anatomic and vascular contrast