introduction to networking monitoring and...
TRANSCRIPT

These materials are licensed under the Creative Commons Attribution-Noncommercial 3.0 Unported license (http://creativecommons.org/licenses/by-nc/3.0/) as part of the ICANN, ISOC and NSRC Registry Operations Curriculum.
Introduction to Networking Monitoring and Management
Network Monitoring and Management

Part I: Overview
Core concepts presented: – What is network monitoring – What is network management – Getting started – Why network management – The big three – Attack detection – Documentation – Consolidating the data – The big picture
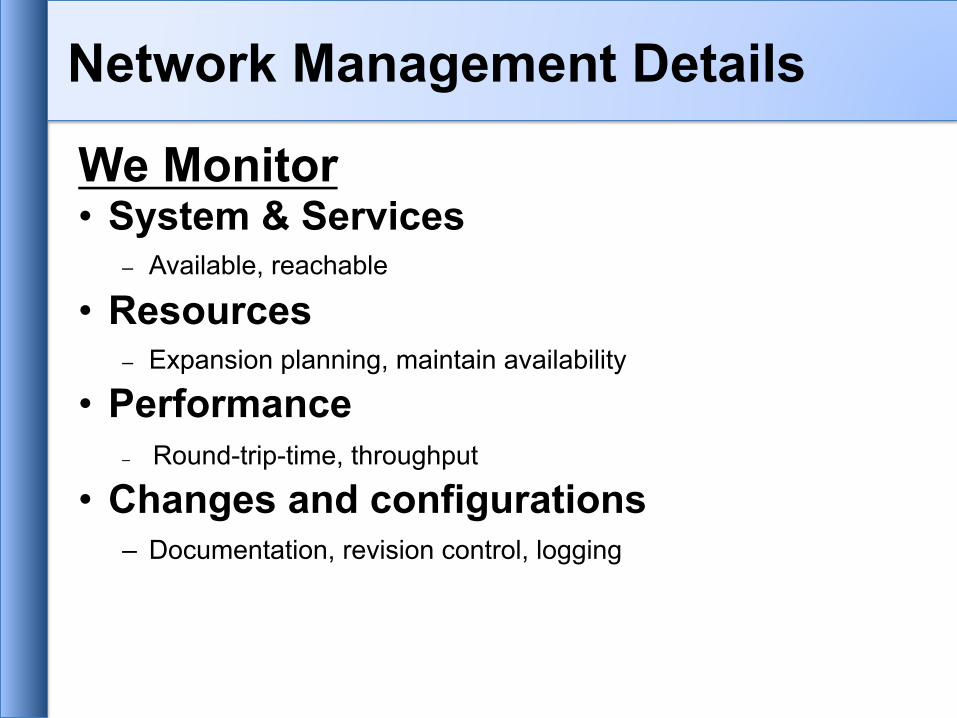
We Monitor • System & Services
– Available, reachable
• Resources – Expansion planning, maintain availability
• Performance – Round-trip-time, throughput
• Changes and configurations – Documentation, revision control, logging
Network Management Details

We Keep Track Of • Statistics
– For purposes of accounting and metering
• Faults (Intrusion Detection) – Detection of issues,
– Troubleshooting issues and tracking their history
• Ticketing systems are good at this
– Help Desks are a good place to create, update, troubleshoot and resolve issues between your staff and end-users using a ticketing system.
Network Management Details

A network in operation needs to be monitored in order to: - Deliver projected SLAs (Service Level
Agreements) - SLAs depend on policy
è What does your management expect?
è What do your users expect?
è What do your customers expect?
è What does the rest of the Internet expect?
- What’s good enough? 99.999% Uptime? è There's no such thing as 100% uptime (as we’ll see) à
Expectations

What does it take to deliver 99.9 % uptime? 30.5 days x 24 hours = 732 hours a month (732– (732 x .999)) x 60 = 44 minutes
only 44 minutes of downtime a month! Need to shutdown 1 hour / week?
(732 – 4) / 732x 100 = 99.4 % Remember to take planned maintenance into account in your
calculations, and inform your users/customers if they are included/excluded in the SLA
How is availability measured? In the core? End-to-end? From the Internet?
“Uptime” Expectations
Baselining
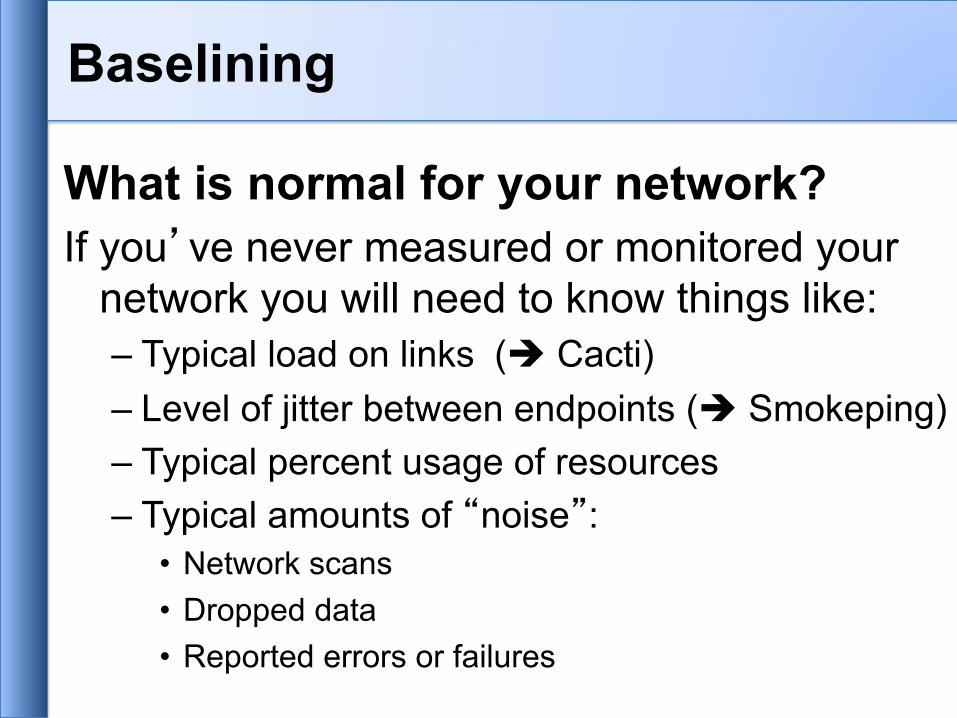
What is normal for your network? If you’ve never measured or monitored your
network you will need to know things like: – Typical load on links (è Cacti) – Level of jitter between endpoints (è Smokeping) – Typical percent usage of resources – Typical amounts of “noise”:
• Network scans • Dropped data • Reported errors or failures

Know when to upgrade - Is your bandwidth usage too high? - Where is your traffic going? - Do you need to get a faster line, or more providers? - Is the equipment too old?
Keep an audit trace of changes - Record all changes - Makes it easier to find cause of problems due to
upgrades and configuration changes Maintain history of network operations
– Using a ticket system lets you keep a history of events. – Allows you to defend yourself and verify what happened
Why do all this?

Accounting – Track usage of resources – Bill customers according to usage
Know when you have problems - Stay ahead of your users! Makes you look good. - Monitoring software can generate tickets and auto-
matically notify staff of issues. Trends
– All of this information can be used to view trends across your network.
– This is part of baselining, capacity planning and attack detection.
Why network management?
The “Big Three”?
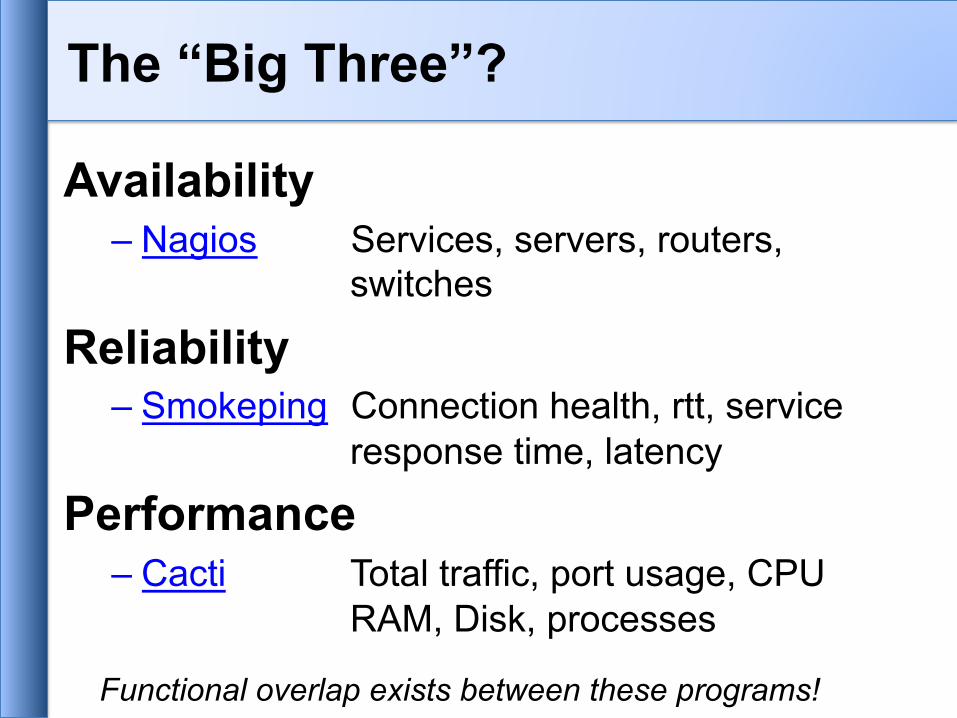
Availability – Nagios Services, servers, routers,
switches
Reliability – Smokeping Connection health, rtt, service
response time, latency
Performance – Cacti Total traffic, port usage, CPU
RAM, Disk, processes
Functional overlap exists between these programs!
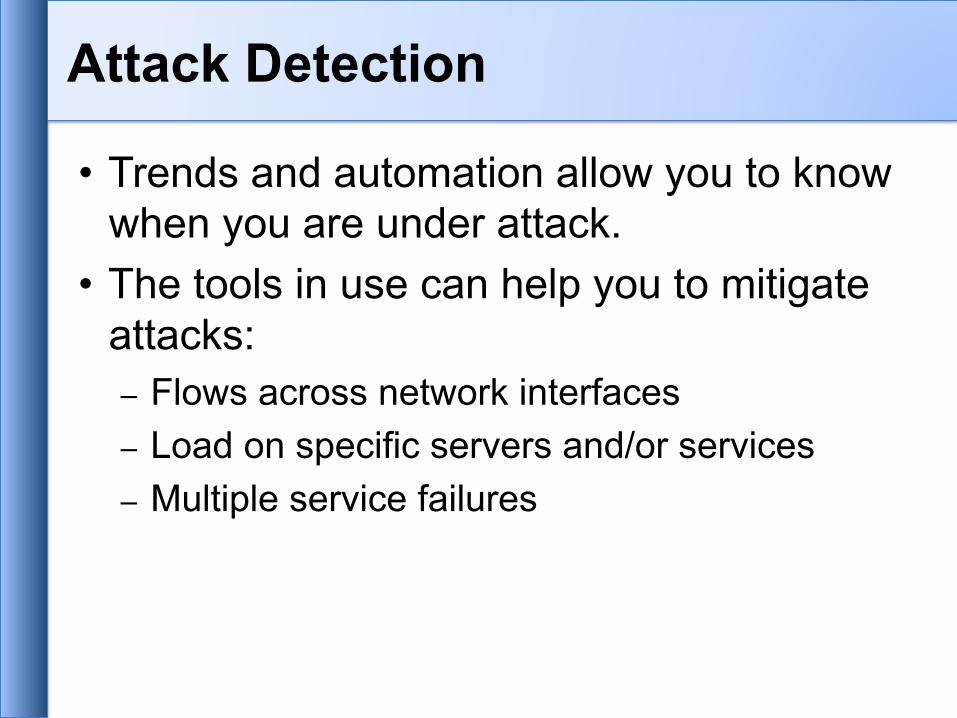
• Trends and automation allow you to know when you are under attack.
• The tools in use can help you to mitigate attacks: – Flows across network interfaces – Load on specific servers and/or services – Multiple service failures
Attack Detection
Consolidating the data
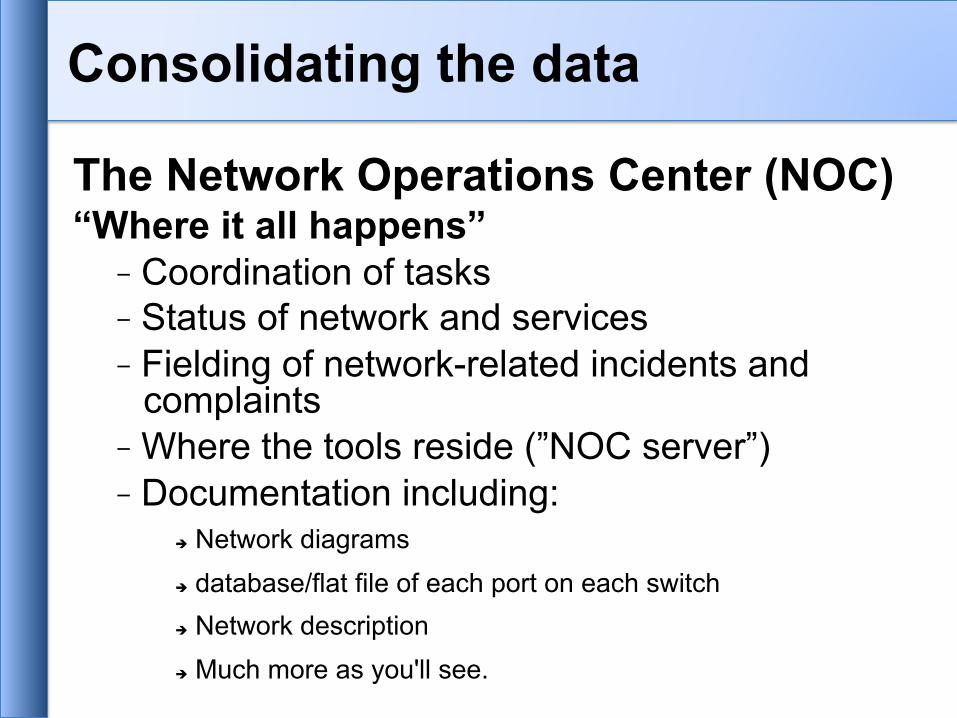
The Network Operations Center (NOC) “Where it all happens” - Coordination of tasks - Status of network and services - Fielding of network-related incidents and
complaints - Where the tools reside (”NOC server”) - Documentation including:
è Network diagrams è database/flat file of each port on each switch è Network description è Much more as you'll see.

- Monitoring - Data collection - Accounting
- Capacity planning - Availability (SLAs) - Trends - Detect problems
- Change control & monitoring
- Improvements - Upgrades
- Fix problems
- User complaints - Requests
- NOC Tools - Ticket system
Ticket
Ticket
Ticket
Ticket
Ticket
Notifications
The big picture

Performance l Cricket l IFPFM l flowc l mrtg* l NetFlow* l NfSen* l ntop l perfSONAR l pmacct l RRDtool* l SmokePing* Ticketing l RT* l Trac* l Redmine
Net Management l Big Brother l Cacti* l Hyperic l Munin l Nagios* l OpenNMS* l Observium* l Sysmon l Zabbix Documentation • IPplan • Netdisco • Netdot* • Rack Table Protocols/Utilities • SNMP*, Perl, ping
Change Mgmt l Mercurial l Rancid* (routers) l CVS* l Subversion* l git* Security/NIDS l Nessus l OSSEC l Prelude l Samhain l SNORT l Untangle Logging • swatch* • syslog-ng/rsyslog* • tenshi*
A few Open Source solutions…

Questions?
?
Part II: Details
Some details on the core concepts: • Network documentation continued • Diagnostic tools • Monitoring tools • Performance tools • Active and passive tools • SNMP • Ticket systems • Configuration and change management

Questions?
?

Part III: Details
Some details on the core concepts: • Diagnostic tools • Monitoring tools • Performance tools • Active and passive tools • SNMP • Ticket systems • Configuration and change management
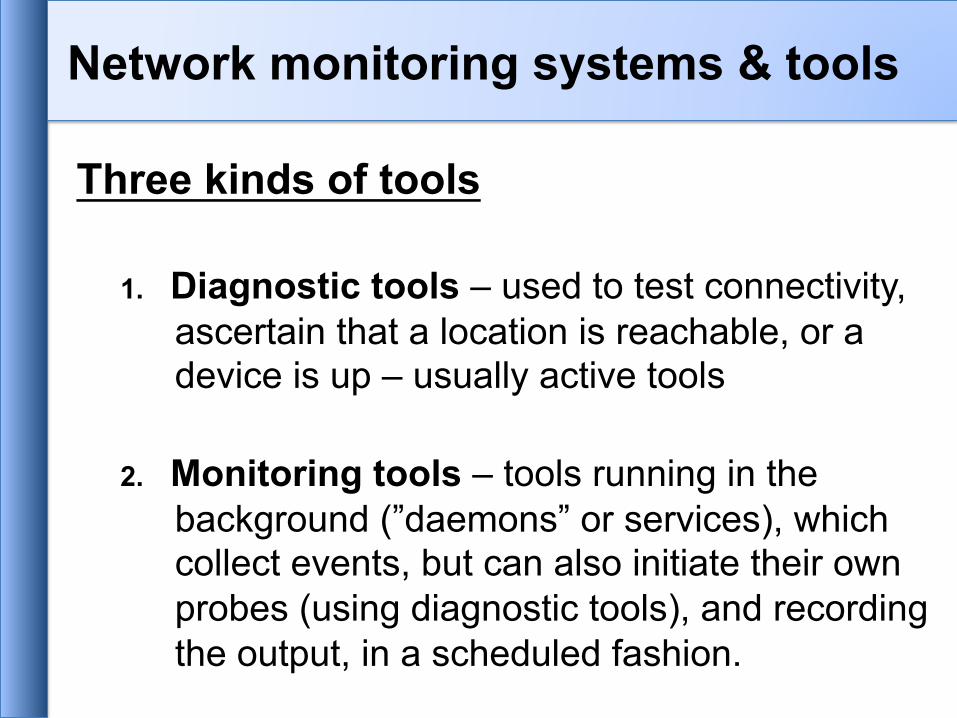
Three kinds of tools 1. Diagnostic tools – used to test connectivity,
ascertain that a location is reachable, or a device is up – usually active tools
2. Monitoring tools – tools running in the background (”daemons” or services), which collect events, but can also initiate their own probes (using diagnostic tools), and recording the output, in a scheduled fashion.
- Performance tools – tell us how our network is handling traffic flow.
Network monitoring systems & tools
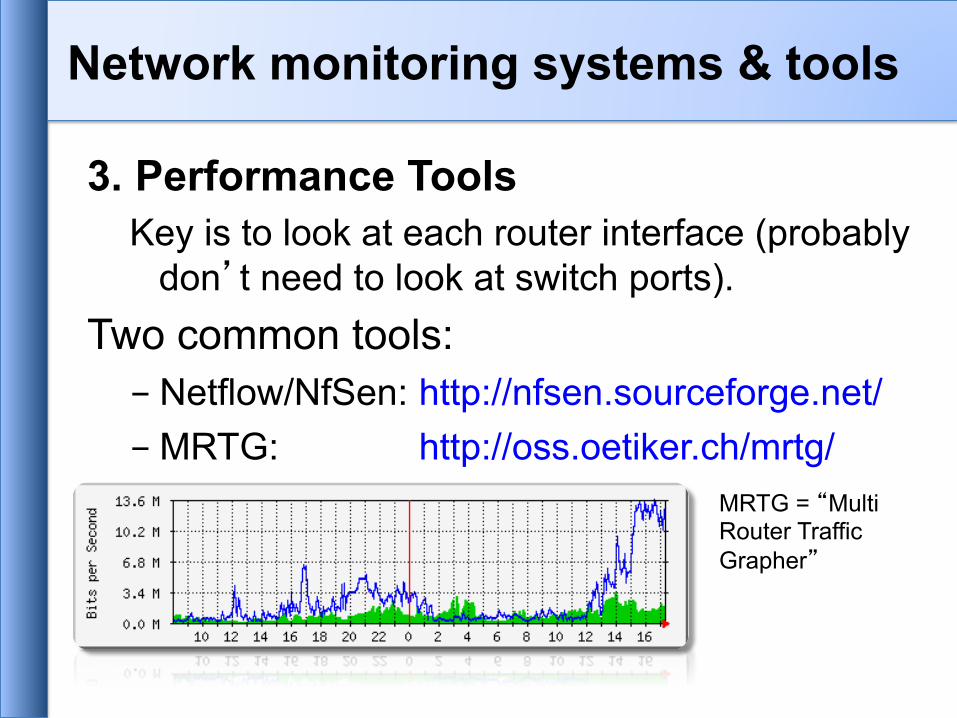
3. Performance Tools Key is to look at each router interface (probably
don’t need to look at switch ports). Two common tools: - Netflow/NfSen: http://nfsen.sourceforge.net/ - MRTG: http://oss.oetiker.ch/mrtg/
MRTG = “Multi Router Traffic Grapher”
Network monitoring systems & tools
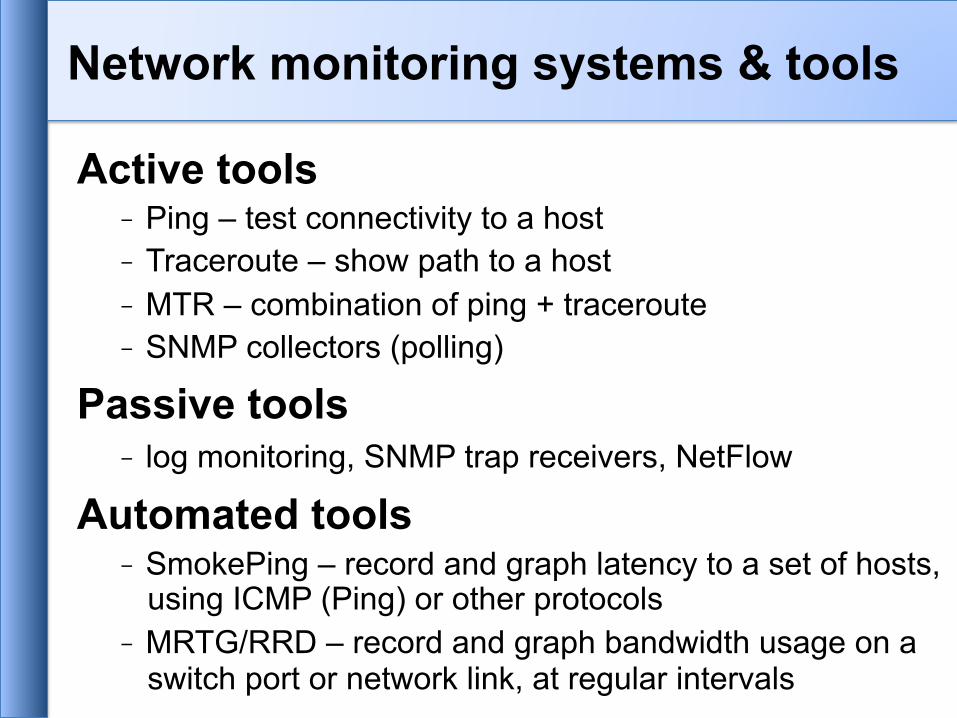
Active tools - Ping – test connectivity to a host - Traceroute – show path to a host - MTR – combination of ping + traceroute - SNMP collectors (polling)
Passive tools - log monitoring, SNMP trap receivers, NetFlow
Automated tools - SmokePing – record and graph latency to a set of hosts,
using ICMP (Ping) or other protocols - MRTG/RRD – record and graph bandwidth usage on a
switch port or network link, at regular intervals
Network monitoring systems & tools
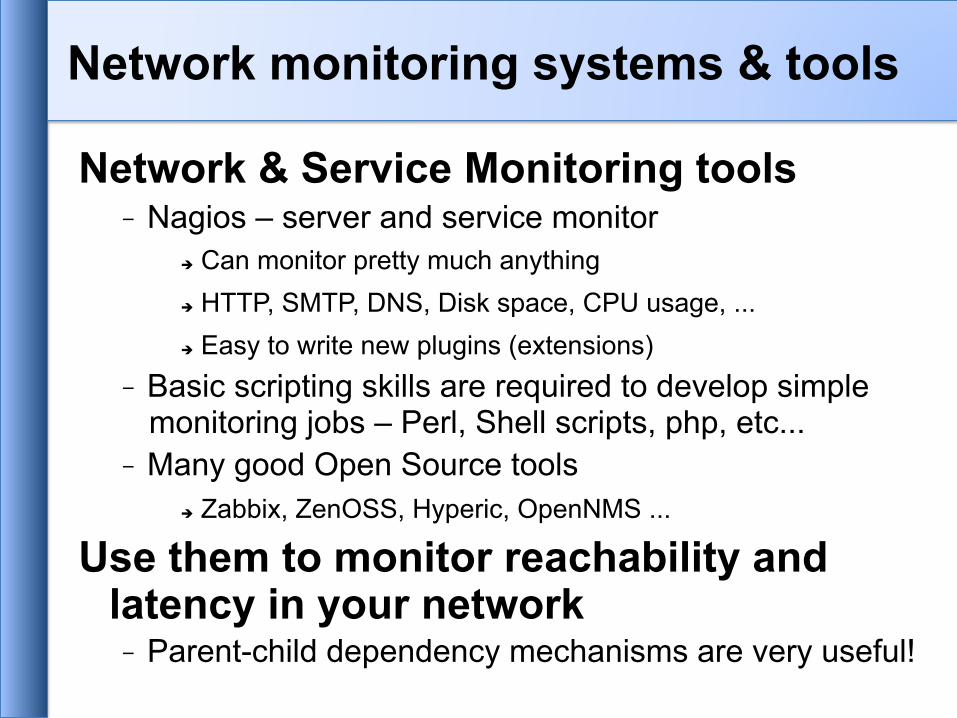
Network & Service Monitoring tools - Nagios – server and service monitor
è Can monitor pretty much anything è HTTP, SMTP, DNS, Disk space, CPU usage, ... è Easy to write new plugins (extensions)
- Basic scripting skills are required to develop simple monitoring jobs – Perl, Shell scripts, php, etc...
- Many good Open Source tools è Zabbix, ZenOSS, Hyperic, OpenNMS ...
Use them to monitor reachability and latency in your network - Parent-child dependency mechanisms are very useful!
Network monitoring systems & tools

Monitor your critical Network Services - DNS/Web/Email - Radius/LDAP/SQL - SSH to routers
How will you be notified? Don't forget log management! - Every network device (and UNIX and Windows servers
as well) can report system events using syslog - You MUST collect and monitor your logs! - Not doing so is one of the most common mistakes when
doing network monitoring
Network monitoring systems & tools
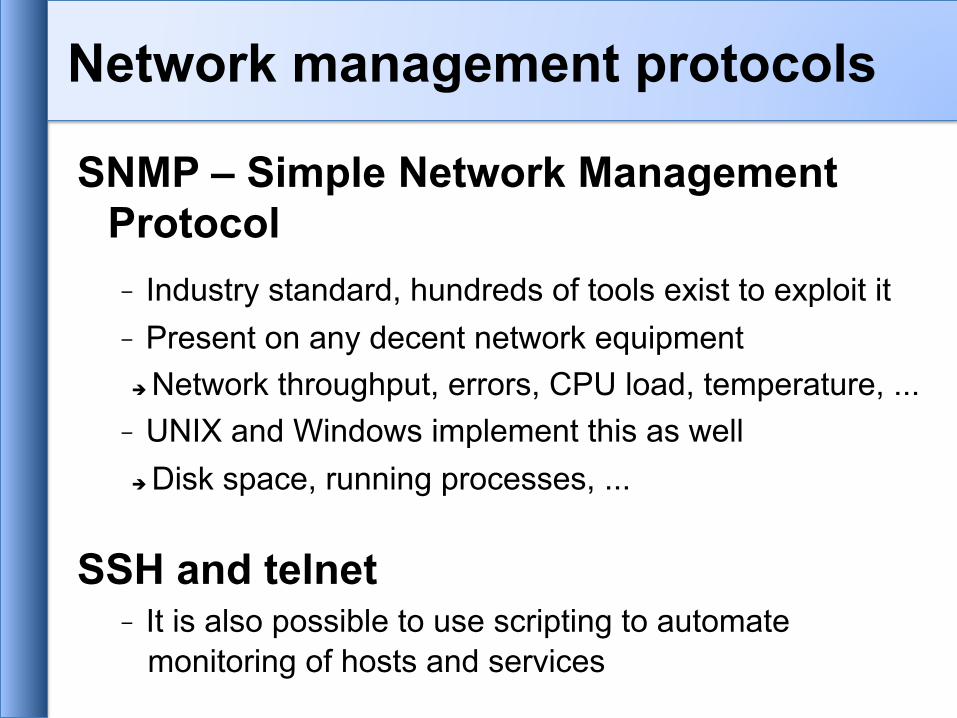
SNMP – Simple Network Management Protocol
- Industry standard, hundreds of tools exist to exploit it - Present on any decent network equipment è Network throughput, errors, CPU load, temperature, ... - UNIX and Windows implement this as well è Disk space, running processes, ...
SSH and telnet - It is also possible to use scripting to automate
monitoring of hosts and services
Network management protocols

Net SNMP tool set - http://net-snmp.sourceforge.net/
Very simple to build simple tools - One that builds snapshots of which IP is used by which
Ethernet address - Another that builds shapshots of which Ethernet
addresses exist on which port on which switch. - Query remote RAID array for state. - Query server, switches and routers for temperatures. - Etc…
SNMP tools

Traffic accounting and analysis - What is your network used for, and how much - Useful for Quality of Service, detecting abuses,
and billing (metering) - Dedicated protocol: NetFlow - Identify traffic ”flows”: protocol, source,
destination, bytes - Different tools exist to process the information
è Flowtools, flowc
è NFSen
è Many more: http://www.networkuptime.com/tools/netflow/
Statistics and accounting tools

Is the problem transient? - Overload, temporary resource shortage
Is the problem permanent? - Equipment failure, link down
How do you detect an error? - Monitoring! - Customer complaints
A ticket system is essential - Open ticket to track an event (planned or failure) - Define dispatch/escalation rules è Who handles the problem? è Who gets it next if no one is available?
Fault and problem management

Why are they important? - Track all events, failures and issues
Focal point for helpdesk communication Use it to track all communications - Both internal and external
Events originating from the outside: - customer complaints
Events originating from the inside: - System outages (direct or indirect) - Planned maintenances or upgrades – Remember to
notify your customers!
Ticketing systems
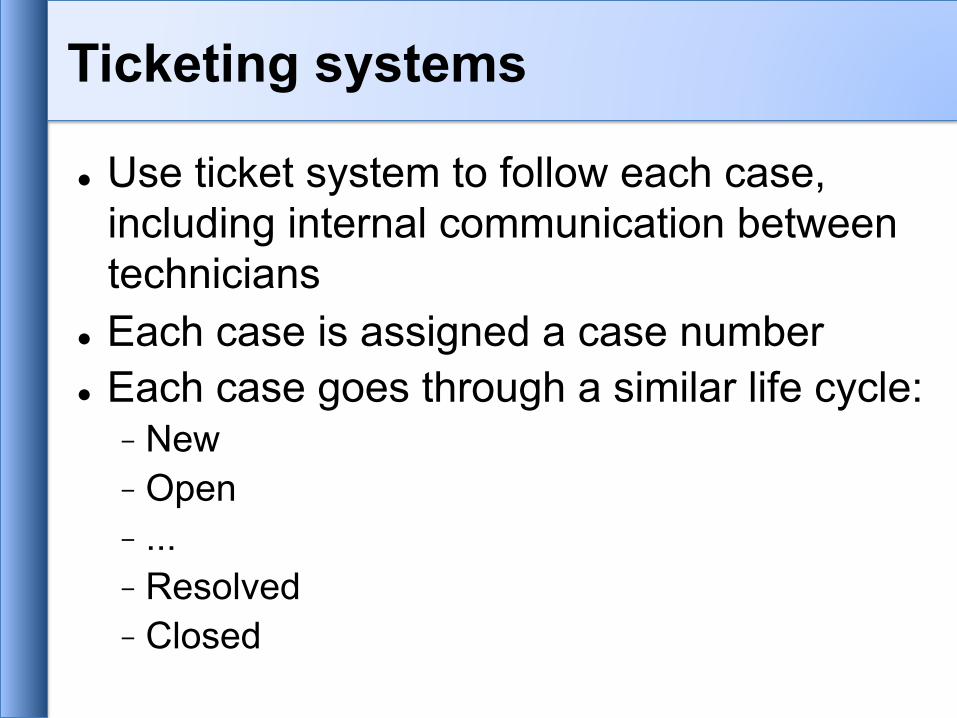
l Use ticket system to follow each case, including internal communication between technicians
l Each case is assigned a case number l Each case goes through a similar life cycle: - New - Open - ... - Resolved - Closed
Ticketing systems

Workflow: Ticket System Helpdesk Tech Eqpt ---------------------------------------------------------------- T T T T query | | | | from ---->| | | | customer |--- request --->| | | <- ack. -- | | | | | |<-- comm --> | | | | |- fix issue -> eqpt | |<- report fix -| | customer <-|<-- respond ----| | | | | | |
Ticketing systems
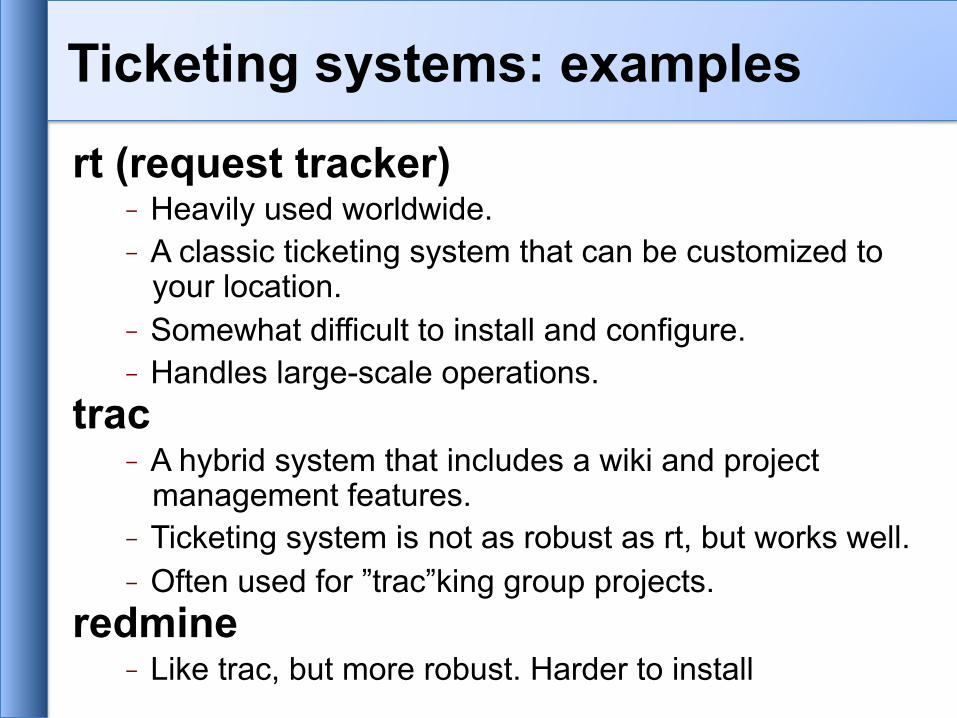
rt (request tracker) - Heavily used worldwide. - A classic ticketing system that can be customized to
your location. - Somewhat difficult to install and configure. - Handles large-scale operations.
trac - A hybrid system that includes a wiki and project
management features. - Ticketing system is not as robust as rt, but works well. - Often used for ”trac”king group projects.
redmine - Like trac, but more robust. Harder to install
Ticketing systems: examples

These are systems that observe all of your network traffic and report when it sees specific kinds of problems, such as: - hosts that are infected or are acting as spamming sources.
A few tools: - SNORT - a commonly used open source tool:
http://www.snort.org/ - Prelude – Security Information Management System
https://dev.prelude-technologies.com/ - Samhain – Centralized HIDS
http://la-samhna.de/samhain/ - Nessus - scan for vulnerabilities:
http://www.nessus.org/download/
Network Intrusion Detection Systems (NIDS)

l Record changes to equipment configuration using revision control (also for configuration files)
l Inventory management (equipment, IPs, interfaces)
l Use versioning control - As simple as:
”cp named.conf named.conf.20070827-01” l For plain configuration files: - CVS, Subversion (SVN) - Mercurial
• For routers: - RANCID
Configuration mgmt & monitoring
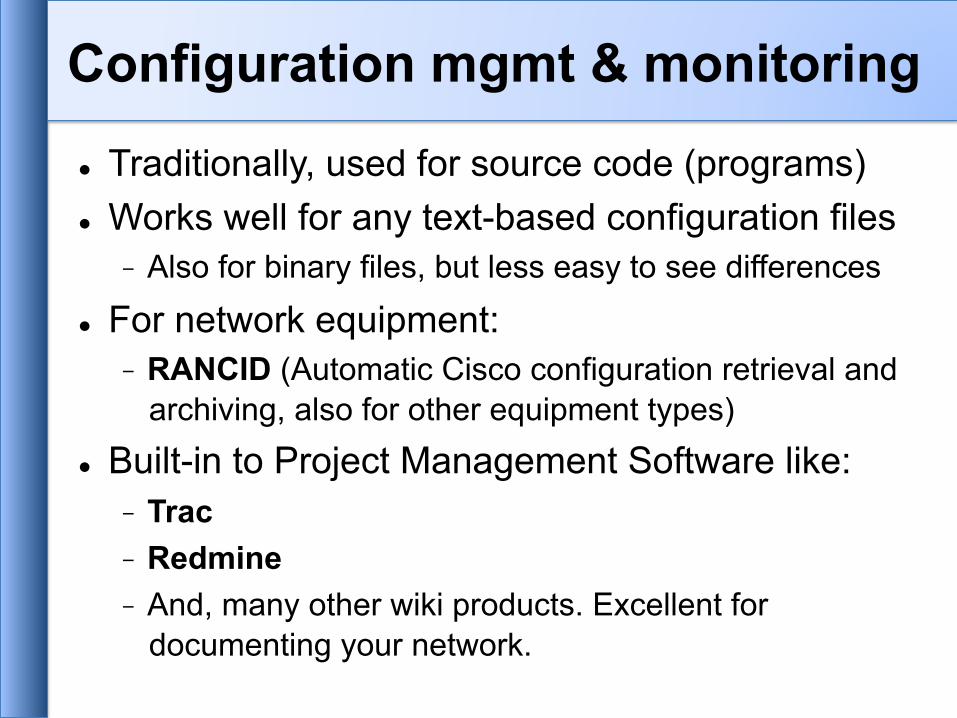
l Traditionally, used for source code (programs) l Works well for any text-based configuration files - Also for binary files, but less easy to see differences
l For network equipment: - RANCID (Automatic Cisco configuration retrieval and
archiving, also for other equipment types) l Built-in to Project Management Software like: - Trac - Redmine - And, many other wiki products. Excellent for
documenting your network.
Configuration mgmt & monitoring
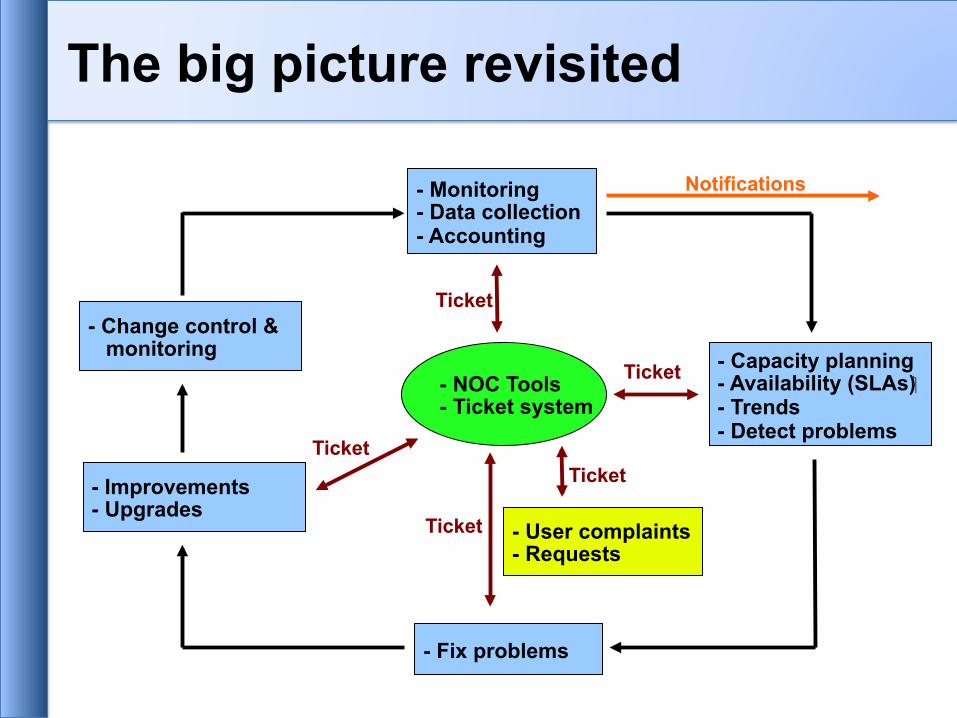
- Monitoring - Data collection - Accounting
- Capacity planning - Availability (SLAs) - Trends - Detect problems
- Change control & monitoring
- Improvements - Upgrades
- Fix problems
- User complaints - Requests
- NOC Tools - Ticket system
Ticket
Ticket
Ticket
Ticket
Ticket
Notifications
The big picture revisited

Questions
?