introduction to microarray analysis uma chandran phd, msis department of biomedical informatics...
TRANSCRIPT
Introduction to Microarray Analysis
Uma Chandran PhD, MSISDepartment of Biomedical Informatics
10/17/12
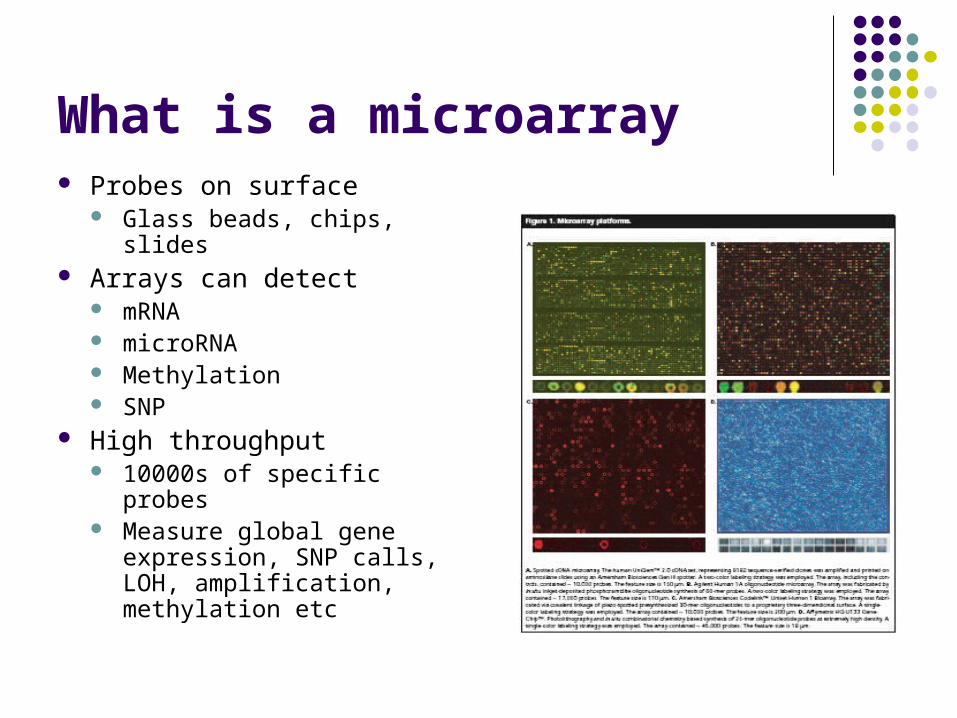
What is a microarray Probes on surface
Glass beads, chips, slides Arrays can detect
mRNA microRNA Methylation SNP
High throughput 10000s of specific probes Measure global gene
expression, SNP calls, LOH, amplification, methylation etc

Questions that can be asked
Can measure global changes Which mRNAs are high in disease versus
normal, i.e, out of the 1000s of mRNAs expressed in the cell at any time
Are there single nucleotide polymorphism that are markers for a disease – many studies on for example, autism, schizophrenia
Are there methylation changes in disease versus normal

ARRAY DESIGN

Affymetrix
Probes are synthesized on a chip Probes are oligonculeotides
of a specified length Generally 25 mers
At each x, y location a particular oligonucleotide is synthesized in 1000s of copies at that location
Insert oligo slide

Affymetrix
• Feature: a location on the array with a particular oligonucleotide sequence• Oligonucleotides are synthesized using a photolithographic manufacturing
• process• The oligo on the chip is called the probe and RNA (or DNA) that it hybridizes to
is called the target
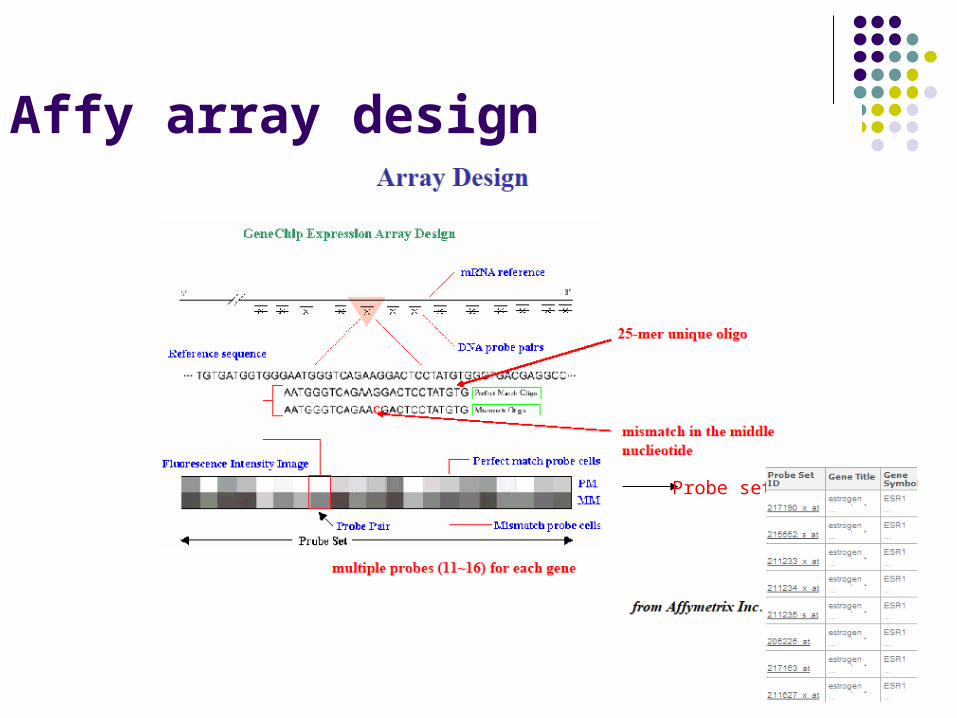
Affy array design
Probe set

Affymetrix

Probe design
Multiple probe sets/gene Probe sets are selected based on
GenBank dbEST RefSeq Bioinformatics approaches
Design at the time of chip design However, this may be incorrect as genome builds
update

Affymetrix data

Annotation The probe set id and
sequence are contained in reference files
This id never changes However, annotations
change with genome builds
Many software tools to annotate Some involve new BLAST
of the sequences Mask out probe sets

Affymetrix Chips for
Human HGU95, HGU133A, B, HGU133 set
54K probe sets on the HGU133, 30+ to known genes and ESTs Control probes like GAPDH Spike in bacterial probes
Mouse Rat Chimpanzee Plants Many other species
Dynamic range Very low ~ 10 units 20K +
Cannot compare genes within chips For example, a transcript that is expressed at 500 units may not be more abundant than one
that is expressed at 200 units This is due to probe binding affinities etc However, can compare the same probe across multiple chips
Difficulty in probe design makes it difficult to compare from one version to another

Affymetrix workflow
from: http://www-nmr.cabm.rutgers.edu/academics/biochem694/reading/Dalm
aWeiszhausz_2006.pdf

Illumina

Illumina
Each bead has one type of oligo and thousands of
these oligos/bead
Bead is deposited on wells in glass slides. The beads are decoded by a
step by proprietary technology

Microarray analysis objectivesData Preprocessing
Data Analysis

Analysis questions Class Comparison
Expression - Which genes/miRs are up or down in tumors v normal, untreated v treated
SNP – Which regions are amplified or deleted
Class Discovery Within the tumor samples, are
there subgroups that have a specific expression profile?
SNP – amplification or deletion common to subgroups?
Class prediction, pathway analysis etc Integrative analysis
Proteomic and genomic SNP and expression Methylation and expression
Treatment Normal

Challenges in microarray analysis Different platforms
Ilumina, Affymetrix, Agilent…. Many file types, many data formats Need to learn platform dependent methods and software required
Analysis How to get started? Which methods? Which software? Many freely available tools.
Some commercial Analysis software and methods will depend on platform.
SNP analysis is different from expression Software used may be very specific to SNP For example, Excel cannot open large SNP files
How to interpret results

Public databases
Many sources for public data – labs, consortia, government
Publications require that data files including raw files be made public
GEO –http://www.ncbi.nlm.nih.gov/geo/
Array Express - http://www.ebi.ac.uk/arrayexpress/#ae-main[0]

Hands on #1
Look at GEO Search Data Set with the term Exercise Exercise Heart Human Identify Platform by clicking on GSE record Try restricting by platform such as Affymetrix
or Illumina
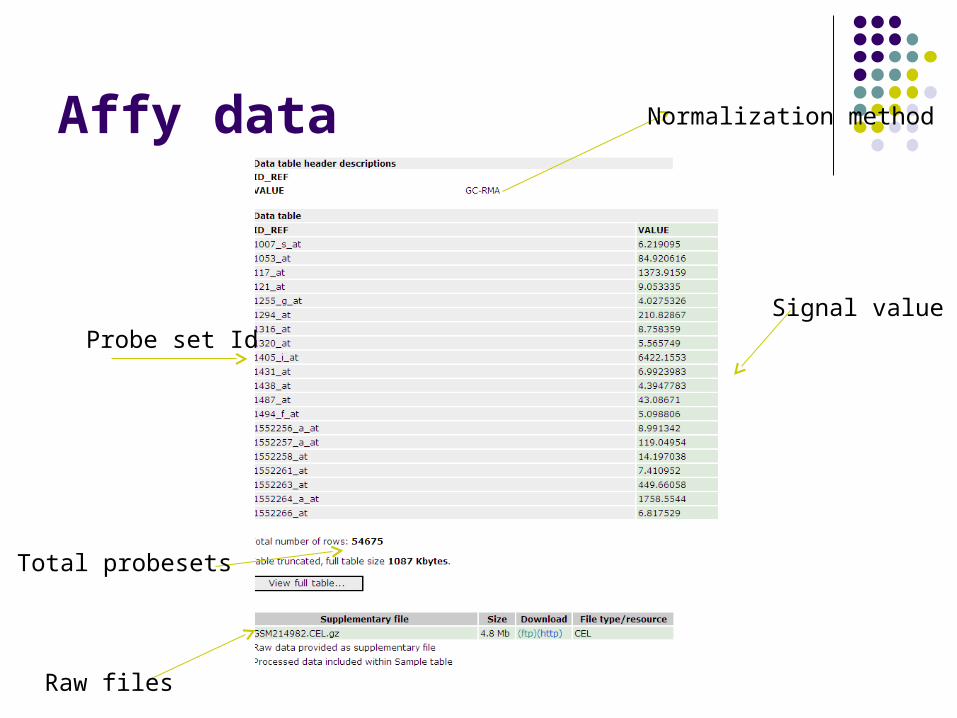
Affy data
Probe set IdSignal value
Normalization method
Total probesets
Raw files

Data pre-processing
Affy produces many files - .dat, .cel, .chp etc Process these to produce data that can be
opened in excel or .txt Illumina produces different file types

Data Preprocessing Objective
Convert image of thousands of signals to a a signal value for each gene or probe set
Multiple step Image analysis
Background and noise subtraction
Normalization Summarized expression
value for a probe set or gene
Gene 1 100Gene 2 150Gene 3 75.Gene10000 500

Data Pre-processing Go from .DAT file to feature
quantification The first step where .DAT file is
aligned to a grid and the features are quantified is usually performed by Affy’s proprietary algorithm
.DAT .CEL file .CEL file contains the feature
quantifications .CEL file still has probes
spread over the chip Values still need to be
summarized to probe set level; for example 90525_at = 250 units
250

Data Pre-processing – Step 1
Image processing Usually done using proprietary software Affy: convert .dat file to .cel file
May perform noise subtraction, background Illumina: Bead Studio software to convert bead
level data to next level of data

Data Preprocessing – Step 2 Normalization
Bring all the experiments up to the same scale
Multi-step process depending on technology
Summarized expression value for a probe set or gene
Affy: .cel to .chp; need .cdf file which describes the file layout
Ilumina: normalization option and background subtraction option using Bead Studio
Gene 1 100Gene 2 150Gene 3 75.Gene10000 500

.CEL +.CDF to .CHP
In going from .CEL to .CHP file to generate signal values, the multiple probes within a probe set are “averaged” to produce a single value for that gene/transcript

Normalization
Corrects for variation in hybridization etc
Important for all high throughput platforms
Assumption that no global change in gene expression
Without normalization Intensity value for gene will
be lower on Chip B Many genes will appear to
be downregulated when in reality they are not
Gene 1 100Gene 2 150Gene 3 75.Gene10000 500
507532
250
Treated Control

How to normalize? Many methods – Affy MAS5.0
Median scaling – median intensity for all chips should be the same
Known genes, house keeping, invariant genes
Quantile - RMA Normalization method may
differ depending on platform Illumina – cubic spline Affymetrix
Choose method .cel to .chp file
Which method to choose? Know the biology
After normalization from .cel .chp file .txt file
A B
Before 100 50 (down)After 200 200 (no change)

Normalization

Affy data
Probe set IdSignal value
Normalization method
Total probesets
Raw files

Workflows
Affy .dat file > .cel file > .chp file > .txt file
Affy software needed for .dat > cel The rest of the steps can be carried out by other tools
Illumina Through Bead Studio
Bkg subtraction > normalization with various options > background normalization > .txt file
Need bead studio to carry out these steps and raw files not necessarily given
normalization
cdf file

Illumina
Does not have .DAT, .CEL, .CDF and .CHP files
There is no chip definition or chip layout as in Affy
However, the identity of each bead has to be decoded vial proprietary software

Illumina
normalization
Data preprocessing
Signal
Probe id
Raw files are .txt files

Affy v Illumina Affy
25mer Probe synthesized on chips Multiple probes/probeset May have multiple
probes/transcript .dat, .cel, .cdf, .chp file
types Normalization methods
such as quantile Txt output can be used for
downstream data analysis Annotations can be
updated
Illumina Longer oligo Bead technology Single probe May have multiple
probes/transcript Image file processed by
Bead Studio Several normalization
methods Txt output can be used for
downstream data analysis Annotations can be
updated


Hands on #2 -Data analysis
Import data into BRB Which files to import
.cel file if performing normalization through BRB Or mport already normalized file as .txt file for
further analysis

Steps in analysis - Import Affy
Import all files into Affy tools such as Expression console Normalize and generate signal values using Affy MAS5.0 Assess QC using GAPDH, B-actin and control probes for
spike in and hybridization Then, import into other tools such as BRB for analysis
Illumina Depending on background subtraction/normalization, may
have generated negative values Check QC metrics, such as did chip pass? Remove negative values Import into tools such as BRB

Step in Data analysis – Normalization Import raw data into a tool Has data been normalized?
If not, which method to use? What is available for a particular platform
If not available in tools, is R code or package available After normalization, check distribution
Are there any batch effects? Is the data log transformed?
If not, should you log transform? When? After or before normalization?
Are there missing or negative values in data? What should be done? Impute? Remove rows

Steps in Data analysis – update Annotations
Very important step Annotations updated Annotations provided
may often be incorrect Multiple probe sets for
each gene

BRB – Array tools
Website Excel plug in; R and fortran Import, choose correct format
For Affy: .cel files
Process using GCRMA or MAS5.0 Or directly from processed files
Attaches annotation Create experiment labels

Class Discovery
Objective? Can data tell us which classes are similar? Are there subgroups? Do T-ALL, T-LL, B-ALL fall into distinct groups?
Methods Hierarchical clustering K-means, SOM etc These are Unsupervised Methods
Class Ids are not known to the algorithm For example, does not know which one is cancer or non cancer Do the expression values differentiate, does it discover new
classes
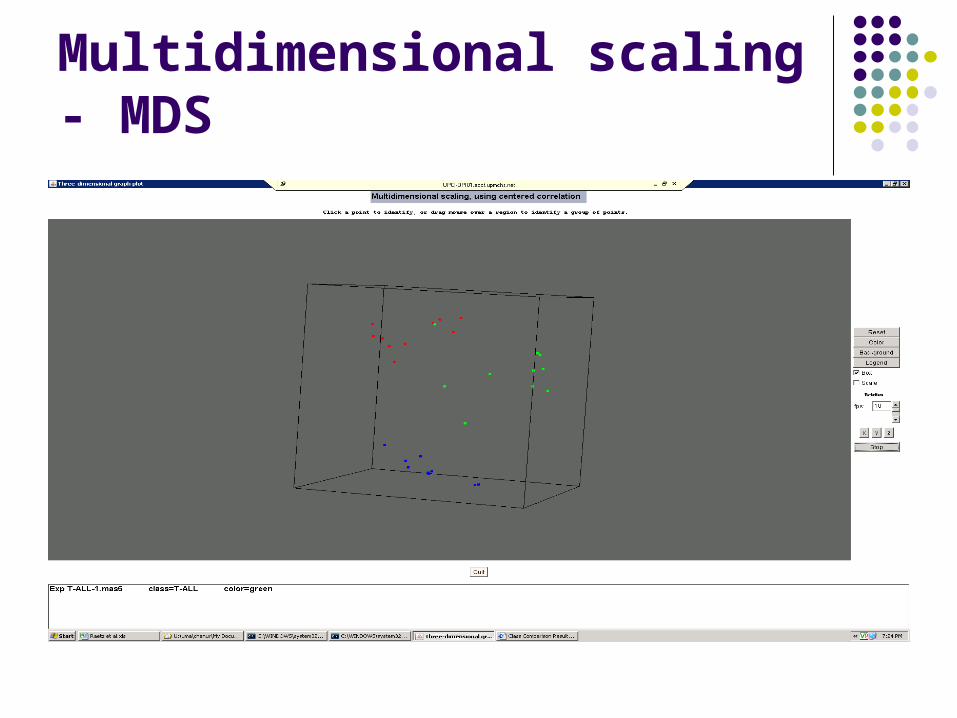
Multidimensional scaling - MDS

Class comparison – differential expression analysis
What genes are up regulated between control and test or multiple test conditions Normal v tumor Treated v untreated
Fold change Not sufficient, need
statistics Statistics
t test, non-parametric, fdr,

Class comparison Many analysis methods
May produce different results Different underlying statistics and methods
t test t test with permutations SAM Emperical bayesian
Depends on underlying assumptions about data High throughput data with many rows and few samples
What is the distribution Variance from gene to gene
Save raw data files to try different methods and compare results

Fold change does not take variation into account
lowvariability Differentially expressed gene
mediumvariability Differentially expressed gene.
A low-reliable estimate
highvariability
Differentially expressed gene. Powerful and exact statistical tests must be used
Modified from madB http://nciarray.nci.nih.gov/

Hypothesis Testing
Normal Tumor
d
Null hypothesis
Alternative hypotheses
mean1 mean2

Statistical power t test
Test hypothesis that the two means are not statistically different
Adding “confidence” to the fold change value Mean Standard deviation Sample size Calculates statistic You choose cutoff or
threshold Give me gene list at a cutoff of p
<0.05 95% confidence that the
mean for that gene between control are treated are different

Experimental Design – Very important!!! Sample size
How many samples in test and control Will depend on many
factors such as whether tissue culture or tissue sample
Power analysis
Replicates Technical v biological
Biological replicates is more important for more heterogenous samples Need replicates for statistical analysis
To pool or not to pool Depends on objective
Sample acquistion or extraction Laser captered or gross
dissected
All experimental steps from sample acquisition to hybridization Microarray experiments are
very expensive. So, plan experiments carefully

t tests
Results might look like At a p<0.05, there are
300 genes up and 200 genes downregulated 95% confidence that the
means of these genes in the two groups is different
At a p < 0.05, x genes up and y genes down with a fold change of at least 3.0
Multiple comparison
Microarrays have multiple comparison problem p <= 0.05 says that 95% confidence means are
different; therefore 5% due to chance 5% of 10000 is 500
500 genes are picked up by chance Suppose t tests selects 1000 genes at a p of 0.05 500/1000 ;Approximately 50% of the genes will be false Very high false discovery rate; need more confidence How to correct? Correction for multiple comparison p value and a corrected p value

Corrections for multiple comparisons
Involve corrections to the p value so that the actual p value is higher
Bonferroni Benjamin-Hochberg Significance Analysis of Microarrays
Tusher et al. at Stanford

Hands on BRB
Class comparison Choose comparison Which tests are available? P value cutoff How is multiple correction
testing being done? Stringent p value, fdr
How is the output reported? Can you figure out how many
genes are regulated at different p values and different cutoffs
How to interpret results Look at gene lists generated
by our analysis v those generated in the paper

BRB – Class Comparison
Output folder Check the .html file Look at results P value Fold change Annotation Click on annotation Cut and paste save into Excel

Issues
Annotation Multiple probe sets for a gene Annotation files will get updated Which one is correct? Where does it map? How to report the genes?
How to compare between platforms Different chips within same platform Biological annotation

Difficult to interpret experimental results
0
50
100
150
200
250
300
350
1 10 19 28 37 46 55 64 73 82 91 100 109 118 127 136
204253_s_at vitamin D (1,25-dihydroxyvitamin D3) receptorVDR
204254_s_at vitamin D (1,25-dihydroxyvitamin D3) receptorVDR
204255_s_at vitamin D (1,25-dihydroxyvitamin D3) receptorVDR
213692_s_at Vitamin D (1,25-dihydroxyvitamin D3) receptorVDR
0
500
1000
1500
2000
2500
3000
3500
4000
4500
1 10 19 28 37 46 55 64 73 82 91 100 109 118 127 136
201120_s_at progesteronereceptor membrane component 1PGRMC1
201121_s_at progesteronereceptor membrane component 1PGRMC1
201701_s_at progesteronereceptor membrane component 2PGRMC2
208305_at progesterone receptorPGR
213227_at progesterone receptormembrane component 2 PGRMC2
228554_at progesterone receptorPGR

Which probe/probe set is correctly aligned to the gene?
205225_at 211233_x_at 211234_x_at 211235_s_at 211627_x_at 215551_at 215552_s_at 217163_at 217190_x_at
01
00
20
03
00
Affymetrix probeset
Un
log
ge
d E
xpre
ssio
n v
alu
e

Probe set errors
Cross Hybridizati
on
Mismatched Probe Intron Probe
Types of Probe Error
SNPs

ESR1 probes in UCSC genome browser

How to manipulate Gene lists
Create gene lists Venn Diagram Can be done even though study done on different
platforms Compare MAS and RMA
Venn Diagram Compare B-ALL v T-LL and T-LL v B-ALL

Venn Diagramhttp://www.pangloss.com/seidel/Protocols/venn.cgi
http://ncrr.pnl.gov/software/VennDiagramPlotter.stm
Conclusion
Other analysis Class prediction Gene list from class comparison can be used in
pathway analysis HSLS pathway workshops on Ingenuity, DAVID,
Pathway Architect Future:
Integrate expression data with other data such as snp or microRNA
GEO has some data analysis features

ESR1 probes in UCSC genome browser

Next Gen Sequencing
Directly sequence DNA to determine SNP CN Expression, mRNA, microRNA Protein binding sites Methylation
Initial steps depend not on hybridization but also on base pairing or complementarity and DNA synthesis
Data analysis extremely challenging

Next Gen Sequencing Applications
Sequence varation – WGS, Exome Seq Structural rearrangements – WGS, Exome
Seq Copy number – WGS, Exome Seq Epigenetic changes such as methylation –
Methyl Seq DNA – protein binding – CHIP Seq mRNA expression – RNA Seq

Next Gen Sequencing

Read mapping Alignment
Denovo assembly Mapping to reference
genome Based on complementarity
of a given 35 nucleotide to the entire genome
Computationally intensive Million of 35 bp reads has to
search for alignment against the reference and align spefically to a given regions
Large file sizes Sequence files in the TB Aligned file BAM files
Several hundred GB
Reference genome

Sequence variation


Analysis pipeline- CHIP-Seq