introduction to magnetic resonance angiography geoffrey d. clarke, ph.d. division of radiological...
TRANSCRIPT

Introduction to Magnetic Resonance Angiography
Geoffrey D. Clarke, Ph.D.Division of Radiological Sciences
University of Texas Health Science Center at San Antonio

Overview
• Flow-Related Artifacts in MRI
• Time-of-Flight MR Angiography
• Contrast-Enhanced MR Angiography
• Phase-Contrast MR Angiography
• Quantitative Flow Imaging

Flow Voids & Enhancements• In spin echo imaging vessels appear as
signal voids – same volume of blood does not experience
both 90o and 180o pulses
• In flow effect – may cause unsaturated blood to appear
bright in slice that is most proximal to heart
• Saturation effects– cause diminished signals in blood flowing
parallel to image plane

Vessel Signal Voids
Early multi-slice spin echo images depicted vessels in the neck as signal voids

FlowingFlowingBloodBlood
Multi-slice Spin Echo
MRIMRISlicesSlices
StationaryTissue
Long TR90o-180o
Fast flow
Slice #1
Slice #2
Slice #3
Spins do not get
refocused by 180o pulse

Field Echoes & Bright Blood
• Partial Flip Angle/Field Echo Images
– Short TR, Short TE
– Only one TX RF pulse (o)
• Blood has Greater Proton Density than Stationary Tissues

Bright Blood Images
Using gradient (field) echo images
with partial flip angles allowed
blood which flowed through the 2D
image plane to be depicted as being
brighter than stationary tissue.

Motion Artifacts
• in read-out direction– data acquired in time short compared to
motion– blurring of edges
• in phase-encode direction– ghosting presenting as lines & smudges
• in slice-select direction– variable partial volume, difficult to detect

The MRI Signal: Amplitude & Phase
Net MagnetizationNet Magnetization
BBoo rf = Brf = B11
RealReal
ImaginaryImaginaryRealReal
ImaginaryImaginary

Dephasing Due to Motion
GGsliceslicetimetime
timetime
t = 0t = 0
BLOOD: phase not zeroBLOOD: phase not zero
TISSUE: phase equals zeroTISSUE: phase equals zero
Phase Shift Phase Shift Due to Motion Due to Motion
in a in a Gradient FieldGradient Field
PH
AS
EP
HA
SE
-180-180oo
+180+180oo

Pulsatile Motion Artifact
AortaAorta
ArtifactArtifact
ArtifactArtifact
ArtifactArtifact

Motion Compensation Gradients
GGsliceslicetimetime
timetime
t = 0t = 0
BLOOD: phase equals zeroBLOOD: phase equals zero
TISSUE: phase equals zeroTISSUE: phase equals zero
Phase Shift Phase Shift Due to Motion Due to Motion
in a in a Gradient FieldGradient Field
PH
AS
EP
HA
SE
-180-180oo
+180+180oo
*Only applies for constant flow. *Only applies for constant flow. More gradient lobes needed for acceleration.More gradient lobes needed for acceleration.

Flow Artifact Correction
• Spatial pre-saturation pulses prior to entry of the vessel into the slices
• Surface coil localization
• Shortened pulse sequences
• Cardiac & respiratory gating
• Motion Compensation Gradients

Magnetic Resonance Angiography (MRA)

MRA Properties
• Utilizes artifactual signal changes caused by flowing blood to depict vessel lumen
• May include spin preparation to suppress signal from stationary tissues or discriminate venous from arterial flow
• Does not require exogenous contrast administration, but contrast agents may be used to enhance MRA for fast imaging

Methods of Magnetic Methods of Magnetic Resonance AngiographyResonance Angiography
• Signal Amplitude MethodsSignal Amplitude Methods2D Time-of-Flight3D Time-of-Flight
• Signal Phase MethodsSignal Phase Methods 2D Phase Contrast
(Velocity Imaging = Q-flow)3D Phase Contrast
(Velocity Imaging = Q-flow)

Time-of-Flight MRA Method
RealRealImaginaryImaginary
BBoo
MM

Time of Flight Effect
• T1 of flowing water is effectively shorter than the T1 of stationary water
• Two contrast mechanisms are responsible:
– T1 saturation of the stationary tissue
– In-flow signal enhancement from moving spins

2D Time-of-Flight MRA2D Time-of-Flight MRAConditionsConditions
•Field Echo ImagingField Echo Imaging
•Short TEShort TE
•Partial Flip Angle Partial Flip Angle
•generally largegenerally large
•keeps stationary tissues saturatedkeeps stationary tissues saturated
•TR and flip angle TR and flip angle
•adjusted to minimize stationary tissue adjusted to minimize stationary tissue
•adjusted to maximize bloodadjusted to maximize blood
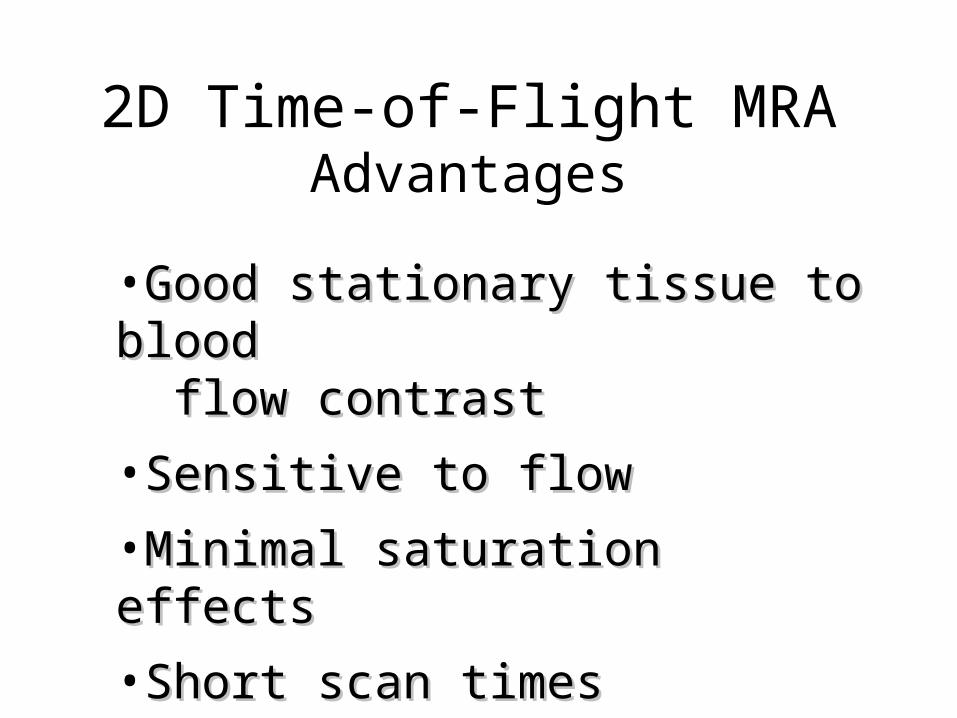
2D Time-of-Flight MRAAdvantages
•Good stationary tissue to bloodGood stationary tissue to blood flow contrastflow contrast
•Sensitive to flowSensitive to flow
•Minimal saturation effectsMinimal saturation effects
•Short scan times Short scan times
•Can be used with low flow rateCan be used with low flow rate

2D Time-of-Flight MRALimitations
•Relatively poor SNRRelatively poor SNR
•Poor in-plane flow sensitivityPoor in-plane flow sensitivity
•Relatively thick slicesRelatively thick slices
•Long echo times (TE)Long echo times (TE)
•Sensitive to short TSensitive to short T11 species species

Improving Contrast in Time-of-Flight MRA
1. Venous Pre-saturation 1. Venous Pre-saturation
(spatial suppression)(spatial suppression)
2. Magnetization Transfer Contrast 2. Magnetization Transfer Contrast
(frequency selective irradiation)(frequency selective irradiation)
3. Fat Saturation 3. Fat Saturation
(frequency selective irradiation)(frequency selective irradiation)
4. Cardiac Gated MRA4. Cardiac Gated MRA
5. Spatial variation of flip angle5. Spatial variation of flip angle

Spatial Pre-saturation in Time-of-Flight MRA
•Saturates and dephases spins before Saturates and dephases spins before they enter imaging slicethey enter imaging slice
•Can be used to isolate arteries or veinsCan be used to isolate arteries or veins
•Can be used to identify vessels feedingCan be used to identify vessels feeding
a given territorya given territory
•Can be used to establish the direction of Can be used to establish the direction of flow in a particular vessel flow in a particular vessel

Magnetization Transfer Contrast
““Free” WaterFree” Water
LipidsLipids ““Bound” WaterBound” Water
PROTON SPECTRUMPROTON SPECTRUM
Frequency (Hertz)Frequency (Hertz)
Frequency (Hertz)Frequency (Hertz)
217 Hz217 Hz 1500 Hz1500 Hz
00
00

Gradient Echo with MTC Pulse
TX
RX
Gsl
Gro
Gpe
RF excitation
Field Echo
Crushers or Spoilers
Phase Encode
Dephasing
Rephasing
Slice Select
Read Out
Digitizer On
Off-resonance rf pulse
Spoilers

Maximum Intensity Projections
MIP #1MIP #1
MIP #2MIP #2
OBJECTOBJECT

2D TOF Application
AbdominalAneurysm

3D Time-of-Flight MRAConditions
•Uses two phase encode gradients and volume excitation
•Maximum volume thickness limited by flow velocity
•Use minimum TR, adjust flip angle for best contrast

Three Dimensional Gradient Refocused Echo Imaging
TXRF pulse (short time)
Field Echo
RX
Gsl
Gro
Gpe
Crusher
Primary Phase
Encoding
Phase Rewinder
Dephasing
Rephasing
Slab Select
Read Out
Digitizer OnSecondary Phase Encoding

3D Time-of-Flight MRAAdvantagesAdvantages
• Higher resolution (thinner slices) Higher resolution (thinner slices) available allowing for delineation of available allowing for delineation of smoother edgessmoother edges
• Higher signal-to-noise than 2D methodsHigher signal-to-noise than 2D methods
• Lower slice select gradient amplitudes Lower slice select gradient amplitudes results in fewer phase effect artifacts results in fewer phase effect artifacts than 2D methodthan 2D method
• Short duration RF pulses can be used to excite slab – TE can be reduced

3D Time-of-Flight MRALimitationsLimitations
• Blood signal is easily saturated Blood signal is easily saturated with slow flowwith slow flow
• Relatively poor background Relatively poor background suppressionsuppression
• Short TShort T11 tissues may be mistaken tissues may be mistaken
for vesselsfor vessels

3D-TOF Application:Cerebral Arteries – Circle of WIllis
• TR /TE = 40 / 4.7 ms
• 64 partitions, 48 mm slab, 0.75 mm per partition
• Flip angle = 25o
• 256 x 256, 18 cm FOV, 0.78 x 1.56 mm pixel
• MTC contrast
• Venous Presaturation

Circle of Willis
Time of Flight MRA
90o

Cerebral Venous Angiogram
SaggitalSinus
Confluence Of Sinuses
TransverseSinus
StraightSinus
FRONT
TOP
Use of arterial presaturation
allows visualization of cerebral
venous vessels
Cerebven.mpeg

Multi-Slab 3D TOF MRA
Hybrid of 2D and 3D methods:• Thin 3D slabs used
– Good inflow enhancement
• Multiples slabs to cover volume of interest– High resolution– Short TE
• Relatively time inefficient

Gd Contrast Enhanced MRA
• Gd contrast agents decrease T1 and increase CNR of blood and soft tissue
• Along with ultra-fast 3D sequences, allow coverage of larger VOI’s
• Shorter acquisition times allow breath-holding for visualization of central and pulmonary vasculature

MRI Compatible Power Injectors
ProgrammableAutomatic Injection
MRI Compatible
Allows rapid arterial injection of
Gd-DTPA
www.medrad.com

3D CE-MRA of Aortic Aneurysm
DigitalSubtraction
X-rayAngiography
Phase 3 Phase 2 Phase 1
Phase 2 Phase 1
•44 slices•32 sec scan•TR/TE = 2.3/1.1 ms•1.5 x 1.8 x 1.8 mm pixel
Schoenberg SO, et al. JMRI 1999;10:347-356

Bolus Chase 3D MRA
Earlier venous enhancement noted with fast injection
Station 1 Station 2 Station 3
Ho VB et al. JMRI 1999; 10: 376-388

Normal Runoff MRA
Image of tissue surrounding vessel can be manually striped off
http://www.uth.tmc.edu/radiology/publish/mra/gallery.html

Phase-Contrast MRA Method
RealRealImaginaryImaginary
BBoo

Dephasing Due to Motion
GGsliceslicetimetime
timetime
t = 0t = 0
BLOOD: phase not zeroBLOOD: phase not zero
TISSUE: phase equals zeroTISSUE: phase equals zero
Phase Shift Phase Shift Due to Motion Due to Motion
in a in a Gradient FieldGradient Field
PH
AS
EP
HA
SE
-180-180oo
+180+180oo

Phase Contrast Imaging
timetimePH
AS
EP
HA
SE
-180-180oo
+180+180oo
timetime
BLOOD: phase is BLOOD: phase is DIFFERENTDIFFERENT in each image in each image
TISSUE: phase equals zeroTISSUE: phase equals zeroin in BOTHBOTH images images
PH
AS
EP
HA
SE
-180-180oo
+180+180oo Velocity Velocity Encoded ImageEncoded Image
Velocity Velocity Compensated Compensated
ImageImage
Phase DifferencePhase Difference
Velocity Velocity Encoded ImageEncoded Image
Motion Compensation
Gradient (Bipolar) Applied

Magnetic Field Gradients in MRI(Two More Functions)
• Slice Selection
• Phase Encoding
• Frequency Encoding
• Sequence Timing (Dephase/Rephase)
• Motion Compensation
• Motion Encoding

2D Phase Contrast MRAFeatures
•Can use minimum TR Can use minimum TR doesn’t rely on Tdoesn’t rely on T11 effects effects
•Good for slow flowGood for slow flow
• Motion is imaged in only one directionMotion is imaged in only one directionusually slice selectusually slice select
• Requires 2 imagesRequires 2 imagesVelocity compensated / velocity encodedVelocity compensated / velocity encoded

2D Phase Contrast MRA2D Phase Contrast MRAAdvantages
•Short acquisition times
•Variable velocity sensitivity
•Good background suppression
•Minimal saturation effects
•Short T1 tissues do not show up on images

2D Phase Contrast MRALimitations
•Single thick section projection
•Vessel overlap artifact
•Sensitive to flow in only one direction
•Unstructured flow may cause problems

3D Phase Contrast MRAFeatures
•Images obtained at higher spatial resolution than 2D PC
•3D PC requires at least four images:flow compensatedx-encodedy-encoded z-encoded
•Low velocity imaging in tortuous vessels
•Takes the most time

3D Phase-Contrast MRA Renal Circulation
Coronal, Gd enhancedTR/TE = 7/1.4 ms
40o flip, false renal stenosis (FP)
Coronal, 3D PCTR/TE = 33/6 ms
20o flip
FP

3D Phase Contrast MRAAdvantages
•Thin slices
•Quantitative flow velocity and direction
•Excellent background suppression
•Variable velocity sensitivity
•Short T1 tissues do not appear on images

3D Phase Contrast MRALimitations
•Long acquisition timesLong acquisition times
•Long TE valuesLong TE values

Flow Measurement with PC-MRI
• Typically uses 2DFT phase contrast method• Slice positioned perpindicular to axis of
vessel• ROI drawn to delineate vessel lumen
– Average value in ROI is mean velocity– Area of ROI is vessel cross-sectional area
• Flow = mean velocity * Area• For pulsatile flow, multi-phase cine required

Phase Contrast Velocity Images
No Flow
FlowVelocity29 cm/s
Magnitude Phase Contrast
StationaryIn Out In Out
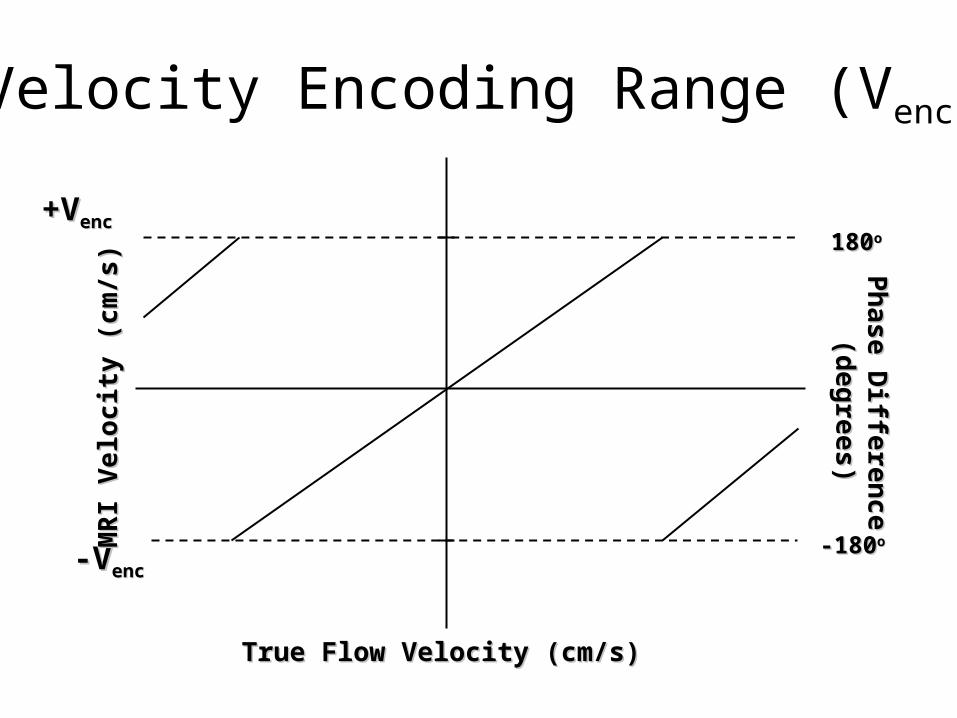
Velocity Encoding Range (Venc)
-V-Vencenc
+V+Vencenc
Ph
ase
Differen
ce
Ph
ase
Differen
ce
(de
gree
s)
(de
gree
s)
MR
I Ve
loc
ity
(cm
/s)
MR
I Ve
loc
ity
(cm
/s)
180180oo
-180-180oo
True Flow Velocity (cm/s)True Flow Velocity (cm/s)

3D Cerebrovascular Flow
Magnitude
Flow Encoding Cranial to
Caudal
Flow Encoding Right to
Left
Flow Encoding Anterior
to Posterior
Saggital Sinus
StraightSinus
Ant. Cerebral aa.
Basilar a.

Summary
1. Two different approaches to MRA are commonly used: Time-of-Flight (TOF-MRA) & Phase Contrast (PC-MRA)
2. TOF-MRA is easy to implement and is robust but has difficulty with slow flow
3. 3D TOF can be combined with fast imaging methods and Gd contrast agents to obtain improved depiction of vascular structures

Summary
4. PC-MRA requires more time to acquire more images but can result in high resolution, fewer flow related artifacts, and quantitative measurement of flow
5. Phase-contrast MRI may provide the most accurate, noninvasive method for measuring blood flow in vivo