introduction to fixed income securities - … investors in india can be said to be reasonably well...
TRANSCRIPT

1 © 2011 iFAST Financial India Private Limited. All Rights Reserved
INTRODUCTION TO FIXED INCOME SECURITIES
A PRIMER FROM FUNDSUPERMART.COM INDIA

2 © 2011 iFAST Financial India Private Limited. All Rights Reserved
Dear Investor,
Retail investors in India can be said to be reasonably well informed when it comes to investments in
equities, real estate or even assets like gold or silver. The Fixed Income asset class, however, is not so well
known. As a tool for diversification, and as a safe avenue for volatile times, understanding this class is
important. Even experts agree that greater retail participation in the fixed income market in India will make
it more robust.
Fundsupermart.com has always tried to draw notice to this asset class through various research and personal
finance articles on the website. Taking this initiative further, we bring you this handy primer that explains
the Fixed Income asset class as a whole, and introduces the various securities currently available in India.
Hope you find this a useful read!
Fundsupermart.com Editorial Team
3 © 2011 iFAST Financial India Private Limited. All Rights Reserved
CONTENTS
A. Introduction to the Fixed Income Asset Class
B. Understanding Yield
C. Securities That Debt Fund Managers Invest In
D. Introduction to Fixed Income Mutual Funds
E. Types of Risks
F. 4 Important Things That YTM Tell You
G. Factors That Make Fixed Income Funds Attractive
H. Things To Look In A Fact Sheet
I. Recommended Funds
4 © 2011 iFAST Financial India Private Limited. All Rights Reserved
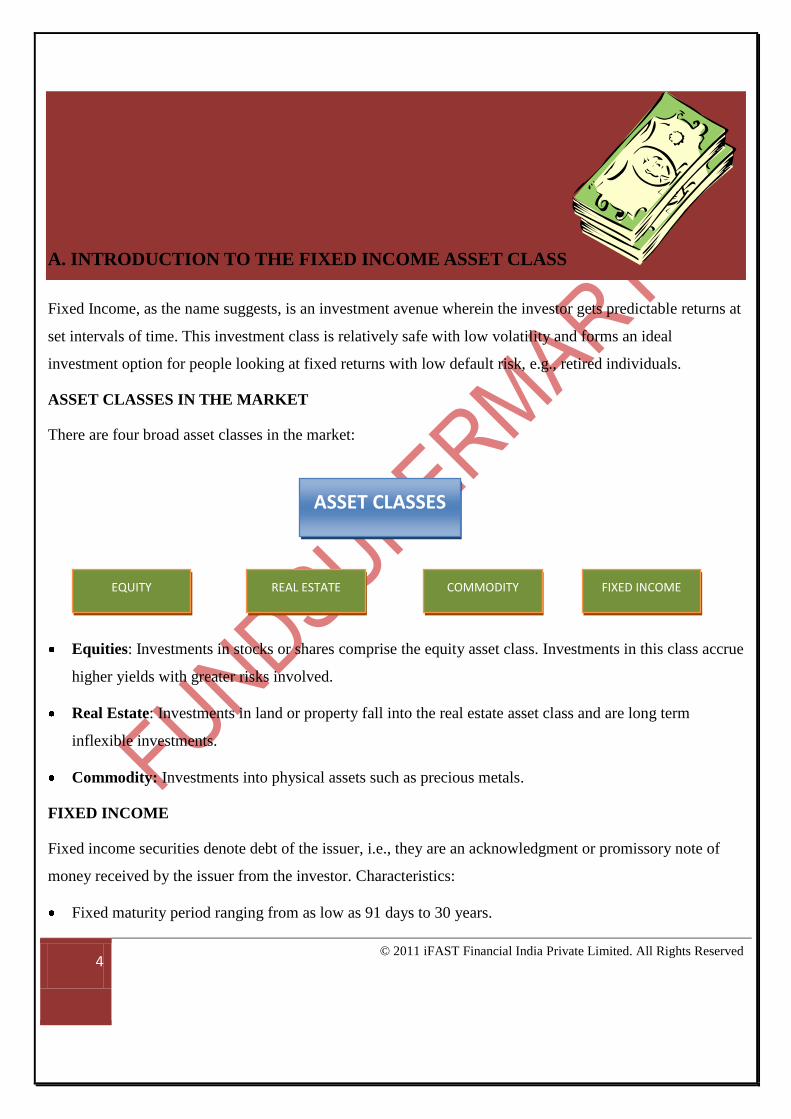
A. INTRODUCTION TO THE FIXED INCOME ASSET CLASS
Fixed Income, as the name suggests, is an investment avenue wherein the investor gets predictable returns at
set intervals of time. This investment class is relatively safe with low volatility and forms an ideal
investment option for people looking at fixed returns with low default risk, e.g., retired individuals.
ASSET CLASSES IN THE MARKET
There are four broad asset classes in the market:
Equities: Investments in stocks or shares comprise the equity asset class. Investments in this class accrue
higher yields with greater risks involved.
Real Estate: Investments in land or property fall into the real estate asset class and are long term
inflexible investments.
Commodity: Investments into physical assets such as precious metals.
FIXED INCOME
Fixed income securities denote debt of the issuer, i.e., they are an acknowledgment or promissory note of
money received by the issuer from the investor. Characteristics:
Fixed maturity period ranging from as low as 91 days to 30 years.
ASSET CLASSES
EQUITY REAL ESTATE COMMODITY FIXED INCOME
5 © 2011 iFAST Financial India Private Limited. All Rights Reserved
Specified „coupon‟ or interest rate.
Generally issued at a discount to face value and the investor profits from the difference in the issue and
redeemed price.
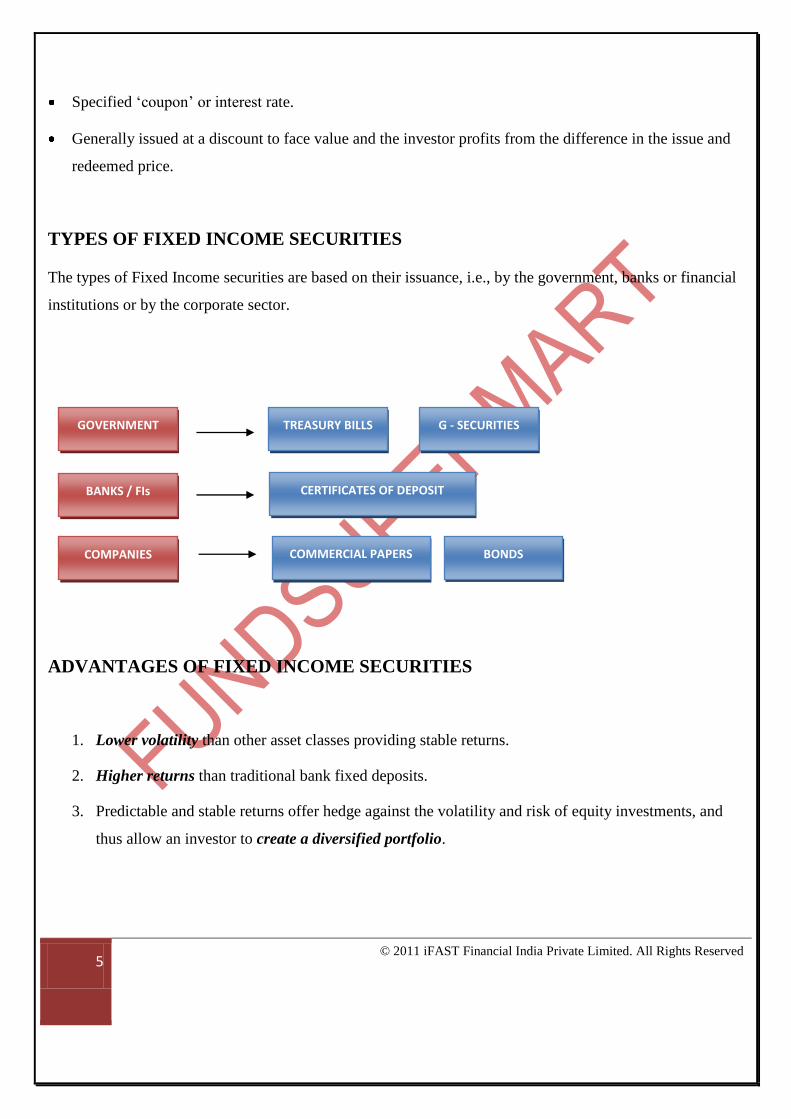
TYPES OF FIXED INCOME SECURITIES
The types of Fixed Income securities are based on their issuance, i.e., by the government, banks or financial
institutions or by the corporate sector.
ADVANTAGES OF FIXED INCOME SECURITIES
1. Lower volatility than other asset classes providing stable returns.
2. Higher returns than traditional bank fixed deposits.
3. Predictable and stable returns offer hedge against the volatility and risk of equity investments, and
thus allow an investor to create a diversified portfolio.
GOVERNMENT
BANKS / FIs
COMPANIES
TREASURY BILLS G - SECURITIES
CERTIFICATES OF DEPOSIT
COMMERCIAL PAPERS BONDS

6 © 2011 iFAST Financial India Private Limited. All Rights Reserved
DISADVANTAGES OF FIXED INCOME SECURITIES
1. Low liquidity: investors‟ money is locked for full maturity period unless the security is traded in the
secondary market.
2. Not actively traded: this lack of competition prevents their prices rising very high.
3. Sensitivity to market interest rate: change in market interest rate changes the yield on held securities.

7 © 2011 iFAST Financial India Private Limited. All Rights Reserved
B. UNDERSTANDING YIELD
Returns on a fixed income security are calculated differently from other asset classes. In most other
investments the market value is the parameter based on which we evaluate returns. For example, if you
purchased a stock in 2005 @ Rs. 200 per share and it is trading today @ Rs. 1000 a share, you would know
that you had made a 500% profit on your investment.
With fixed income securities, your total return on investment is denoted by its “yield” which depends on:
1. Face Value (how much you paid for it initially)
2. Coupon Value (rate of interest you receive periodically)
3. Duration (when will the security be redeemed if you wish to hold it to maturity)
4. Market Price (how much will you receive for the security if you were to sell it)
While the face value, coupon rate and duration of a security cannot change once issued, its market price
fluctuates with changes in market interest rates, which in turn affects the yield. The following sections
explain how.
CHANGING INTEREST RATES AND MARKET PRICES
Rising interest rates make the prices of fixed income securities fall, whereas when interest rates are falling,
the market prices of securities rise. Let‟s take an example:

8 © 2011 iFAST Financial India Private Limited. All Rights Reserved
A bond with face value Rs. 100, maturity of 3 years and a coupon rate of 10%is issued. The market interest
rate at the time of purchase is 8%, and falling. The investment in this scenario promises to be attractive for
the investor as it offers greater returns than the present market rate. The market price of this bond will
therefore be higher than the face value.
Now, if the market rate increases to 10% in the second year of the investment, the bond no longer remains
attractive and the market price drops down to Rs. 90.
Also note that the market prices of securities with longer time to maturity fluctuate more when interest rates
change.
MARKET PRICE AND YIELDS
We saw how changes in the interest rates affect the market price of a security. When the market price
changes, this affects the overall return on the security as well. With an increase in the market price, the yield
on a security comes down; conversely, when prices drop, yields increase.
We continue the previous example, of the 3 year bond, coupon rate of 10%, face value of Rs. 100. Let‟s
assume that in the first year, when interest rates are falling, the market price of the security is Rs. 120.
Interest income on the bond is Rs. 10 (based on coupon rate which does not change.)
The yield in the first year: 10/120*100 = 8.33%.
In the second year, the market price fell to Rs. 90. With interest income of Rs. 10, the yield is: 10/90*100 =
11.11%.
Bond Prices
Bond Yields

9 © 2011 iFAST Financial India Private Limited. All Rights Reserved
The following table clearly shows the inverse relationship between market price and yield:
Market Price Interest Income Yield
120 10 8.33%
100 10 10%
90 10 11.11%
10 © 2011 iFAST Financial India Private Limited. All Rights Reserved
C. SECURITIES THAT DEBT FUND MANAGERS INVEST IN
This section provides a brief overview of the available fixed income securities in the market. An awareness
of these securities, their tenures, riskiness and potential returns help you make informed decisions when
investing in fixed income mutual funds.
I. TREASURY BILLS
Treasury Bills are short-term money market instruments that finance the short term requirements of the
Government. They are offered at a discount on their face value and at the end of the maturity period, they
are repaid at their face value.
TYPES OF T-BILLS
The T-bills can be categorized according to their respective maturity periods:
Name of the T-Bill Maturity Period
3 Month T-Bill 91 days
6 Month T-Bill 182 days
12 Month T-Bill 364 days
Ad-hoc Treasury Bills are also present which are usually issued for a specific intended purpose.
T-BILL VALUES
T-bills are issued in denominations of Rs. 25,000 with the minimum amount being Rs. 25,000.
ISSUE OF T-BILLS
Treasury bills can be obtained both, in the primary and secondary markets.

11 © 2011 iFAST Financial India Private Limited. All Rights Reserved
In the primary market, T-bills are issued through auctions only at RBI. A cut-off price is set for the T-bill,
which is the benchmark during the auction. T-bills are also traded in the secondary market by institutional
investors like mutual funds.
SALIENT FEATURES OF TREASURY BILLS
- No default risk
- Ideal short-term investments which can also be traded in the secondary market
- Preferred securities for Liquid or Money Market and Ultra Short Term mutual funds for high
liquidity along with returns higher than traditional bank accounts
II. GOVERNMENT SECURITIES
Government Securities (G-Secs) are tradable sovereign securities issued by the Central and the State
Governments, indicating a debt obligation in order to finance government expenditure. G-Secs are long term
securities with maturities ranging up to 30 years.
TYPES OF GOVERNMENT SECURITIES
1. Fixed Rate Bonds: These securities have a fixed interest rate attached to them payable at regular
intervals throughout the maturity period. These are the most common form of government securities
available in the market today.
2. Floating Rate Bonds: These securities have a variable interest rate which is reset at fixed time
intervals. The interest rate on these bonds comprises of a base rate which is the weighted average
cut-off yield of 3 one year T-bills, and the reset rate is added on to the base rate to arrive at the
coupon rate for the bond.
3. Special Securities: These are untradeable government securities (unlike the other types) and are
issued to finance specific government projects.
Some other government securities that are not very commonly found in the markets are Call/Put Option
Securities, Capital Indexed Securities and State Development Loans.

12 © 2011 iFAST Financial India Private Limited. All Rights Reserved
ISSUE OF GOVERNMENT SECURITIES
Government securities are issued through auctions conducted by RBI on an electronic portal. Interested
investors place their respective bids through this portal. G-Secs are also actively traded in the secondary
markets.
SALIENT FEATURES OF GOVERNMENT SECURITIES
With long maturity periods and static interest rates, government securities are not a high growth investment
option. However, they are sovereign in nature and offer complete capital protection, making them attractive
to investors looking at no risk with stable income. Institutional investors like debt mutual funds invest
heavily in government securities to hedge their investments in securities of higher risk.
III. CERTIFICATES OF DEPOSIT
A „Certificate of Deposit‟ or CD is a financial instrument issued by banks or other financial institutions (FIs)
except Regional Rural Banks (RRBs) and Local Area Banks (LABs). CDs are an acknowledgement of the
deposit of funds with a bank or FI. They carry a fixed rate of interest which will be paid at the end of the
specified maturity period. They are different from a traditional bank deposit as they can be traded in the
secondary market. They also cannot be redeemed when needed as they have a maturity period attached to
them, or they carry very heavy penalties on early termination.
CDs issued by banks can have maturity period between 7 days and 1 year, and those issued by FIs can have
maturity from one to three years.
RETURNS ON CDs
Interest rates offered on CDs are generally higher than the rate on G-Secs, and depend on:
a. Credibility of the issuer: As discussed in our previous section on credit ratings, the lower the
credibility of the issuer, the higher the interest rate needs to be to compensate for risk.
b. Market interest rate: CDs generally match the current market rate to make the issue attractive to the
investors.

13 © 2011 iFAST Financial India Private Limited. All Rights Reserved
An important point to note is that CDs may offer either simple interest or compounded interest. In terms of
yields, compounded interest offers higher returns.
In CDs offering compounded interest, there may be variations in frequency of compounding, e.g., monthly,
quarterly, yearly. In this case, the more frequent the compounding, the higher the yield from the CD.
ISSUE OF CDs
Banks or FIs issuing CDs advertise the same and investors can fill in forms to invest in the issue. Minimum
investment amount is Rs. 1 lakh and incremental investments have to be in multiples of the same.
SALIENT FEATURES OF CDs
With returns higher than G-Secs and maturities ranging from short to medium term, CDs are attractive
investment options for retail as well as institutional investors. It is important for investors to be aware of
credit worthiness of bank/FI issuing the CD to understand the risk level of the same.
IV. COMMERCIAL PAPER
Commercial Papers (CPs) are issued by companies, Primary Dealers (PDs) and other Financial Institutions
(FIs) as an acknowledgement of borrowing from the public. CPs allows the companies to raise funds for
current or short- term expenses like inventories. According to RBI rules, the entity issuing CPs must have:
- Appreciable assets worth more than Rs. 4 crore as per the latest audited balance sheet
- Sanctioned working capital by banks or pan India FIs
- A borrowable account which is recognized as the Standard Asset of the lender banks or FIs
- Minimum credit rating of P-2 by various Credit Rating Agencies (CRAs) recognized by RBI
CPs have a maturity period ranging from 15 days to a maximum of one year, and they cannot be traded in
the secondary market. Interest rates offered on CPs are generally at par with market interest rates and may
be higher depending on the credit rating assigned to the issuer.
The minimum investment amount in CPs is Rs. 5 lakhs.

14 © 2011 iFAST Financial India Private Limited. All Rights Reserved
ISSUE AND REDEMPTION OF CPs
The issuance of CP involves the Issuer (company, PD or FI issuing the CP), the Credit Rating Agencies
(CRA) and the Issuing and Paying Agent (IPA). The IPA verifies the eligibility of the issuer, and handles the
subscription, issue and redemption of the CPs.
SALIENT FEATURES OF CPs
Like CDs, CPs offer higher returns than G-Secs and T-Bills and have a short term maturity period. Issues
carrying investment grade credit ratings make attractive investment options, and they are usually preferred
by short term debt funds. The only drawback is lack of liquidity since they cannot be traded on the
secondary markets.
V. BONDS
Bonds, or debentures, are issued by companies and financial institutions as a means of raising money from
the markets in the form of loans. The bond holder receives a certificate as an acknowledgment of the bond
purchase. The value and frequency of the coupon payment which is the interest on the bond is pre-
determined by the issuer.
Maturity period of bonds is generally between five to seven years. At the end of maturity the bondholder
receives the principal investment known as the par value of the bond. Some bonds may also carry additional
benefits like „call‟ or „conversion‟ options. The call option allows an investor to redeem the bond earlier
than its maturity. The „conversion‟ option allows the investor to convert his bond holdings into shares of the
issuer.
Bonds are also traded in the secondary markets, though the volumes are not very high as most investors hold
bonds up to maturity.
TYPES OF BONDS
1. Fixed rate bonds: This is a long-term debt paper that carries a predetermined interest rate. These
rates do not change during the maturity of the bond.

15 © 2011 iFAST Financial India Private Limited. All Rights Reserved
2. Floating rate bonds: They come with variable coupons, usually a spread with respect to a reference
rate. For example, in India, some floating bonds have a coupon rate of the Mumbai interbank offer
rate (MIBOR) + 45 basis points. It means that the coupon amount will change according to the
prevailing MIBOR at the time of coupon payment.
3. Zero Coupon Bonds: These bonds do not carry any interest rate; they are issued at a deep discount
to their face value and are redeemed at face value.
ISSUE OF BONDS
Public issue of bonds by a company is similar to equity IPOs. Advertisements and circulars are issued by the
company to inform investors of the upcoming issue. Banks or FIs function as intermediaries to manage the
subscription and allocation of the issue.
SALIENT FEATURES OF BONDS
Bonds offer investors higher returns than government securities. Bond issues by companies with high credit
ratings offer investors a stable and attractive long term investment option.

16 © 2011 iFAST Financial India Private Limited. All Rights Reserved
D. INTRODUCTION TO DEBT MUTUAL FUNDS
So far we have seen a detailed explanation of the Debt asset class, the potential risks and returns from it, as
well as the various securities that comprise this asset class. The objective has been to help you make an
educated choice when it comes to including debt mutual funds in your investment portfolio.
WHY DEBT MUTUAL FUNDS
Direct investment into debt securities is not really an option for retail investors as the debt market in India is
not very conducive. Retail investors usually face the following issues in the debt markets:
1. Minimum investment amounts for debt securities are usually very high
2. Primary market for debt securities is not as accessible as equity; also not very easy to evaluate
performance and risks
3. Many debt securities cannot be traded in the secondary markets making the investments illiquid
At the same time, debt investments form a critical part of portfolios as they hedge risks and offer stability.
This is where debt mutual funds form an ideal selection for retail investors. Debt mutual funds:
a. Offer investors lower initial investment amounts
b. Are easy to study, compare and buy
c. Can be easily exited at the current NAV price of the fund

17 © 2011 iFAST Financial India Private Limited. All Rights Reserved
Some more reasons why debt mutual funds are more appropriate for retail investors:
Debt Funds Debt Securities
Are professionally managed Require understanding of security type,
issuer credibility, interest regime, etc.
Invest in multiple debt securities of varying
maturities and coupons offering a
diversified and less risky portfolio
Require complete lumpsum investment in
one security offering less risk protection
Offer redemption at NAV May lead to losses on sale in case of
change in market price or on redemption in
the case of rising interest rates
Offer regular dividend income Offer regular interest payment
TYPES OF DEBT MUTUAL FUNDS
A. Liquid or Money Market Debt Funds
These funds offer an attractive avenue for parking funds for a few days or weeks as they can be exited at any
time and offer better returns than traditional bank accounts.
Liquid funds invest in short term securities like T-bills, CPs, etc., having a maturity of maximum 91 days.
They are therefore ideal for corporate entities looking at placing short term funds. Liquid funds are also well

18 © 2011 iFAST Financial India Private Limited. All Rights Reserved
suited to individuals earning more than Rs. 5 lakhs per annum as dividends earned from liquid funds are tax
free, whereas interest earned from savings bank accounts is taxed.
B. Ultra Short Term Funds
These funds invest money for one year. They have a higher degree of risk attached to them than the liquid
funds. Simultaneously, they provide higher returns to the investor. Investors with a time horizon of few
months can park their money in this category of funds.
C. Floating Rate Funds
These funds have a variable rate of interest attached to them as they invest in floating debt securities with a
maturity of one year. The rate of interest on these securities changes with respect to current market rates.
Therefore, Floating Rate funds prove to be a better investment option than other debt funds if market interest
rates are expected to go up.
D. Short Term Funds
Short Term Funds invest in debt securities rated as AAA or AA+ with maturity between 15-18 months. The
market rate hikes do not impact these funds greatly. They are suited for investors looking to invest for 1-2
years.
E. GILT Funds
These funds invest in government securities issued by the RBI. These securities carry no default risk as they
are backed by the sovereign and therefore, are rated as SOV. However, they do get mildly affected by
market rates.
GILT funds invest in short term or long term securities having a maturity of few days to 30 years depending
on the investment scheme.
F. Monthly Income Plans (MIPs)
MIPs are hybrid investment funds investing up to 15% in equities and the rest in debt securities. The
objective is to provide regular income to the investors. Therefore, they form an investment option for
investors looking for regular income rather than capital appreciation. However, the income in these funds is

19 © 2011 iFAST Financial India Private Limited. All Rights Reserved
not guaranteed and is dependent on the amount of distributable income present. Therefore, the fund is able
to provide returns only in the case of surplus distributable income present.
G. Dynamic Bond Funds
These are actively managed funds tapping into all the opportunities present in the market like inflation,
liquidity change or changes in monetary policy to obtain returns. They also use inefficiency and volatility in
the debt market to obtain returns. These funds invest in debt securities with any maturity and invest across
the yield curve.
Conclusion
In this section we see that mutual funds offer retail investors attractive options to invest in debt securities,
based on their preferred maturity, risk and desired return type (regular income or capital appreciation). Apart
from making debt securities accessible to investors, they also offer the advantages of professional
management making their investments safer and more diversified, tax free dividend income, and an overall
hedge to other risky investments.

20 © 2011 iFAST Financial India Private Limited. All Rights Reserved
E. TYPES OF RISKS
Risk can be defined as the possibility of incurring a loss on an investment. An investment is deemed as risk
if the returns are variable or may result in capital erosion.
In this section, we elaborate on the different risks associated with debt funds.
Interest Rate Risk:
The fluctuation in the bond price due to movement in interest rates.
As a rule of thumb, when interest rates go up, the value of a bond goes down.
We can illustrate this with an example:
Let us say, the interest rate stands at 4%. A bond with a coupon rate of 4% and face value of INR 1000 is
likely to sell at par value. This is because a buyer of this bond will be indifferent to buying this bond and
saving directly with a bank.
If the interest rate surges by 100 basis points (bps) to 5%, then bondholders with a 4% coupon rate are more
likely sell the bond and keep the money with a bank account instead. This selling pressure will adjust bond
prices downwards. Hence, at higher interest rates, bond prices will generally be lower.

21 © 2011 iFAST Financial India Private Limited. All Rights Reserved
Similarly, if interest rates drop to 3%, the 4% bond coupon rate is more attractive and buyers will start
purchasing this bond instead. The buying pressures will adjust the bond prices upwards. Hence, at lower
interest rates, bond prices will generally be higher.
Interest Rate Risk and Fixed Income Mutual Funds
Since a debt fund mainly consists of bonds as its underlying assets, the portfolio value of a debt mutual fund
will also react in a similar manner to interest rate changes. However, a debt mutual fund is diversified into
fixed income securities of varying maturities and coupon rate. Hence, a debt fund is less subject to interest
rate risk as compared to an individual bond.
Typically, long-term fixed income securities are affected more than the short natured ones if the interest
rates go up. This is because the holder of the bond will received lower coupon payments over an extended
period of time as compared to the short term bond which can be easily reinvested at higher rates. Thus,
investors should be cautious while investing in long-term debt funds such as GILT and Income funds in a
rising interest rate scenario. On the contrary, the bond price for a long-term bond will go up, resulting in
capital gain if the interest rates prevailing in the market fall.
Credit Risk:
The possibility of a bond issuer failing to repay the principal and interest in a timely manner is known as
credit or default risk. In India, there are few credit rating agencies that provide rating service for bonds. The
credit rating agency evaluates the credit worthiness of a company or an individual considering a variety of
factors like their assets, liabilities, past history etc.
A typical rating system is shown in the table below:

22 © 2011 iFAST Financial India Private Limited. All Rights Reserved
Typical Credit Rating System
AAA Highest Safety
AA High Safety
A Adequate Safety
BBB Moderate Safety
BB Inadequate Safety
B High Risk
C Substantial Risk
D Default or Expected to Default
Credit Risk and Fixed Income Mutual Funds
The debt funds provide a breakdown of their portfolio holding regularly in the monthly factsheets. Typically,
the fund should have minimal exposure to unrated securities. Sometimes, a particular fund generates
exceptionally high returns over other funds belonging to the same category. It may be due to higher
allocation to low rated papers. Hence, an investor can keep a tab of the credit portfolio of a fund while
investing for safety and stability.
Ratings Downgrade Risk:
The risk that the bonds would be downgraded by credit rating agencies.
It is also important for an investor to keep tab of the credit ratings issued by agencies as the returns are
proportional to the current rating of the bond.
For Example:
A triple-A rated bond with a 6% coupon currently sells at INR1000. Some investors may invest in the bond
because of its triple-A rating, considering the highest rating of safety.
The revised rating is triple-B, the risk-return ratio that was once attractive for current bondholders, will now
become unattractive as the risk has increased without any increase in returns. Holders of this bond will sell
the bond, causing downward pressure on the bond price.

23 © 2011 iFAST Financial India Private Limited. All Rights Reserved
Ratings downgrade and Fixed Income Funds
A debt fund portfolio is exposed to
this form of risk when the rating of the
underlying bonds forming a large
part of the portfolio is downgraded.
Downgrade risk can be offset partially by diversification.
Yield Curve Risk:
The yield curve shows the relationship between the cost of borrowing and the maturity of the debt papers of
equal credit quality. The expected yield of bonds of a particular credit quality is expected to follow the yield
curve. The risk here is depicted by the steepening or the flattening of the curve as a result of changing yield among
comparable bonds with different maturities.
A yield curve representing India Government Bonds is shown in the chart. The duration where the curve
becomes flattened (example: in red between the duration 3M-1Yr) the investor gets lower yields as the
market rates fall and the investors go in for long term instruments in comparison to short term. Similarly, in
the case of the duration where the curve steepens (example: between 5Y -9Y)with high market rates the
investors go in for shorter term instruments in comparison to long term ones which results in curve
steepening.

24 © 2011 iFAST Financial India Private Limited. All Rights Reserved
Yield Curve Risk and Fixed Income Funds
The shifts in a yield curve risk define the way the debt fund portfolio reacts to market rate fluctuations. This
reaction of the portfolio is indicative of the returns achieved by an investor on his portfolio. This happens as
the shift in a yield curve, simultaneously causes a change in the bond priced which are in accordance with
the former yield curve.
Therefore, with high market rates investors prefer shorter term debt instruments in comparison to long term.
At the same time, the issuer would try to sell long term instruments before the increase in market rates. This
results in an increase at the long end of the curve resulting in steepening the curve.
When the market rates are expected to fall investors prefer longer term instruments in order to safely lock in
their money. Therefore, the price of longer term instruments rise eroding yields. Similarly, the issuer wants
to sell shorter term instruments so that he has to pay the higher interest rates for a shorter duration. This
results in a flattened yield curve.
Reinvestment Risk:
The reinvestment risk applies to the risk of achieving lower returns on an investment than before. This risk
is apparent more in the case of callable bonds. As the issuer can call these bonds back before maturity and it
may happen that the reissued bond may not provide the same returns to the investor as the previous one.
This is more obvious in the case of bonds with lower credit rating. Therefore, it is necessary for an investor
to check the credit rating of the bonds before purchasing it. At the same time, the callable bonds provide
higher returns to an investor as a result of the reinvestment risk associated with them.
Reinvestment Risk and Fixed Income Funds
This happens when the debt fund has underlying bonds with varying maturities, coupon rates and yields.
Whenever, the fund receives coupon payments or proceeds from maturing bonds, the manager looks for
other similar alternatives to invest these proceeds. However, there lies a possibility that the fund manager is
unable to find an attractive alternative that provides similar yields than the previous one.
The fixed income funds having a short term maturity are more prone to this risk. As in this case, the time
horizon available to the fund manger to find an alternative is less. Similarly, bond funds carrying frequent
coupon payments like on quarterly basis are also prone to this risk as the fund manager has to frequently
look for alternatives.
Conclusion
It is imperative for investors of debt funds to be aware of these risks as bond funds are exposed to these five
main risks. An investor armed with this knowledge is capable to understand his investment and make better
decisions in order to capitalise on the opportunities to obtain better returns.

25 © 2011 iFAST Financial India Private Limited. All Rights Reserved
F. 4 IMPORTANT THINGS THAT YTM TELLS YOU
Yield-To-Maturity (YTM) is the measure of returns accrued by an investor when his investment is held till
maturity. Therefore, YTM is an indicator of total returns that an investor would receive at the end of the
maturity period.
I. YTM of an investment however undertakes certain assumptions which include:
The investment is held till maturity
The regular coupons before maturity are reinvested at the YTM rate as a lower rate would result in
lower returns. In practice, if the reinvestment rate happens to be lower than the YTM rate, then the
returns achieved are also lower.
II. Factors affecting YTM of a bond:
1. Coupon rate: Directly proportional to the yield. Higher coupon rate results in higher interest income
provided to the investor and vice versa.
2. Years until maturity: Directly proportional to yield. Greater the number of years to maturity, more
coupon payments to the investor and vice versa.
3. Bond price: Indirectly proportional to yield. More return i.e., yield is accrued by an investor at a
lower price and vice versa.
4. Difference between face value and price: On holding the bond till maturity, the investor receives
amount equal to the face value of the bond. However, the difference between the face value and the
price of the bond is paid by the investor. The discounted or premium on the price assumes
importance in return calculation.

26 © 2011 iFAST Financial India Private Limited. All Rights Reserved
III. YTM and Debt Funds
1. YTM of a bond acts as its benchmark. The investor after looking at the benchmark can decide
whether the bond accrues returns per his expectations because the YTM of a bond tells him the
amount received by him at bond‟s maturity.
2. Also, at the same time an investor can know if the bond being purchased by him is at a discount or
premium.
3. YTM helps investors compare returns from other securities. By knowing the YTM of a bond, an
investor gets an idea of the returns being accrued by him if he holds the particular bond till maturity.
Therefore, he gets an opportunity to compare returns from different securities and then invest in the
one matching his requirements.
4. YTM provides investors a chance to know their bond yields varying with current market prices. This
is so, as the prices fall the yields rise and vice versa. Thus, an investor can evaluate and foresee his
portfolio results.
IV. Points to note with YTM:
1. YTM and Bond Price: The bond‟s price is dependent on purchasing the bond at discount, par
or premium. The difference between the purchase price and the maturity price accounts for
the returns achieved by an investor on his investment.
2. Comparing YTM: Suppose an investor has to purchase a bond with a maturity of 5 years. There are
three bonds available in the market with 5 yrs maturity, carrying a 5% coupon rate on them at
different purchase price on them. All of them have an annual payment.
The 3 bonds carry different YTMs. Therefore, comparing the bond‟s price with the YTM of the bond, the
investor can know if he is getting the bond at a premium or discount. At the same time, he can anticipate his
Bond 1: INR 100(at par) YTM: 5.0%
Bond 2: INR 90(at discount) YTM: 7.5%
Bond 3: INR 110(at premium) YTM: 2.83%
27 © 2011 iFAST Financial India Private Limited. All Rights Reserved
returns at maturity. Also, he can take his call and invest in a bond with a 5 year or a 10 year maturity issued
to him at a premium or a discount.
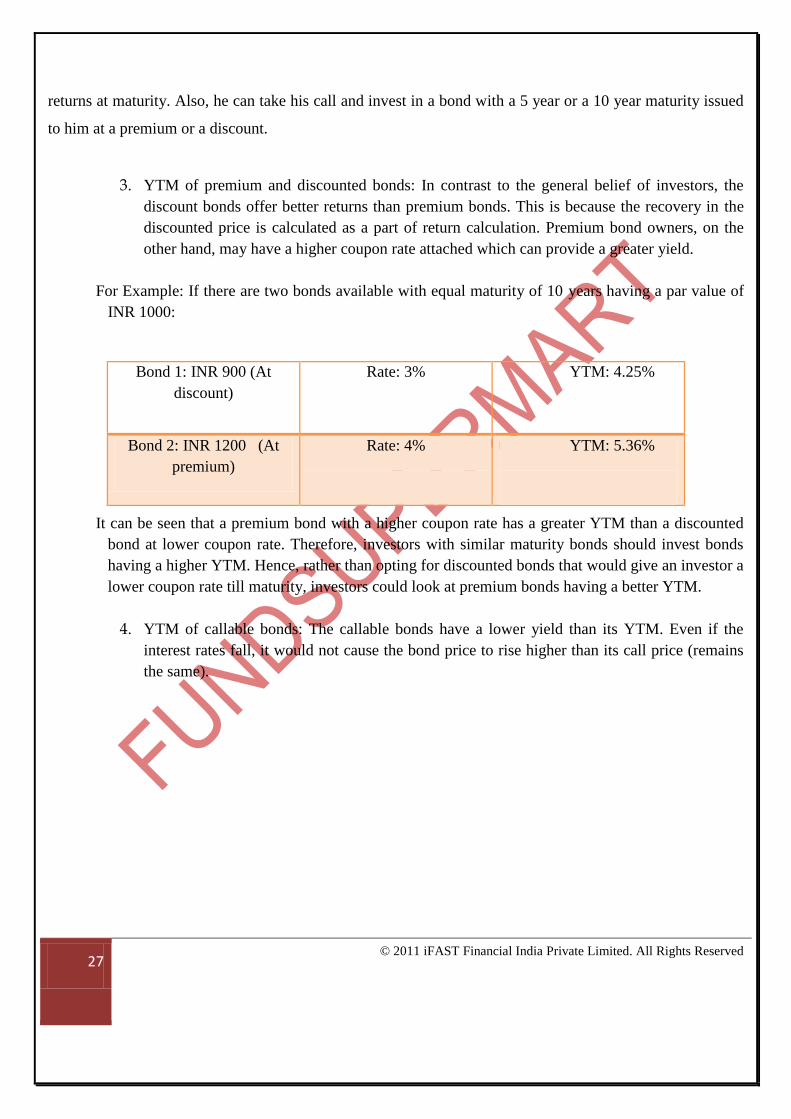
3. YTM of premium and discounted bonds: In contrast to the general belief of investors, the
discount bonds offer better returns than premium bonds. This is because the recovery in the
discounted price is calculated as a part of return calculation. Premium bond owners, on the
other hand, may have a higher coupon rate attached which can provide a greater yield.
For Example: If there are two bonds available with equal maturity of 10 years having a par value of
INR 1000:
It can be seen that a premium bond with a higher coupon rate has a greater YTM than a discounted
bond at lower coupon rate. Therefore, investors with similar maturity bonds should invest bonds
having a higher YTM. Hence, rather than opting for discounted bonds that would give an investor a
lower coupon rate till maturity, investors could look at premium bonds having a better YTM.
4. YTM of callable bonds: The callable bonds have a lower yield than its YTM. Even if the
interest rates fall, it would not cause the bond price to rise higher than its call price (remains
the same).
Bond 1: INR 900 (At
discount)
Rate: 3% YTM: 4.25%
Bond 2: INR 1200 (At
premium)
Rate: 4% YTM: 5.36%

28 © 2011 iFAST Financial India Private Limited. All Rights Reserved
G. FACTORS THAT MAKE FIXED INCOME ATTRACTIVE
Interest Rate
Interest rate is the first and the most significant factor determining the performance of fixed income assets.
However, there is no standard index, unlike the BSE Sensex for Equity, which would tell us how the fixed
income funds may be faring. Retail investors normally look at bank deposit rates whereas, economists watch
the monetary policy rates and the ten year government security, referred as the benchmark 10 year G-sec.
The Reserve Bank of India conducts a review meeting every quarter to decide on the policy rates. Based on
macro-economic situations, these rates are used as lever by the central bank to manage the economic
environment in the country.
Repo: Banks borrow from RBI at the Repurchase (Repo) rate. It is at 7.25% currently.
Reverse Repo: Banks park their idle cash with RBI at Reverse Repo Rate and presently, it is at 6.25%.
Bank Rate: This base rate is set by the central bank and stands at 6% currently. Any revision in this rate is an
indication for the banking industry to follow a similar action. So, an increase in the bank rate is a signal for
banks to raise their lending and deposit rates and vice versa.
The movement in the yield from the benchmark 10 year G-sec reflects the sentiment in the debt market. The
negative sentiment is emphasized by rise in yield; in contrast, the fall in yields causes a cheer in the market
as the bond prices go up.
Benchmark 10 Year G-sec: The 10 year coupon bearing government security. At present, the 7.80% 2021
bond is the benchmark.

29 © 2011 iFAST Financial India Private Limited. All Rights Reserved
Thus, the rates discussed above act as indicators for the banking and financial system and give direction to
the market.
With increase in interest rates, the fixed deposits become attractive for investing. However, one should be
careful while assessing fixed income funds.
A sharp rise in interest rates would improve the returns from fixed income mutual funds having low duration
such as Liquid Funds, Ultra Short Term and Short Term. These short-term funds generate accrual income to
the investors derived from investing in papers that offer high yields. But, the rising interest rates may cause
the performance of GILT and Income Funds to weaken.
On the contrary, with falling interest rates, GILT and Income Funds may provide better returns as they have
longer average maturity and higher coupon rates than the rest of the market. Thus, the fund manager can
book capital gains with the increase in the bond price, an outcome of fall in rates. Learn more>>
Liquidity
Liquidity or simply, the amount of cash available in the system impacts the fixed income instruments. If
there is surplus cash in the system, the borrowers would easily find lenders to satisfy their credit
requirements. Hence, there will be less fluctuation in the yield of debt securities. The overnight lending rates
would particularly come down when liquidity is flush in the system. During such period, the return from
liquid and liquid plus funds would be comparatively low and would reflect the call rates prevailing in the
market, unless the fund manager invest in unrated papers or pass through certificates.
But the interest rates applicable on loans would increase if the available funding resources are limited. The
borrowers thereby, would be willing to compensate the funding at higher rates for their immediate credit
needs, resulting in higher bond yields in the debt market. Consequently, the liquid, liquid plus, short term
and dynamic bond category funds would do well in times of liquidity squeeze.

30 © 2011 iFAST Financial India Private Limited. All Rights Reserved
Inflation
Presently, India deals with high
inflation and a reasonably good
growth. The increase in food and
fuel prices increases the input cost
of business for the corporate sector
as well as raises the household
expenses for individuals.
Moreover, when investment return
is lower, let‟s say 7-8% and the
prevailing inflation rate is at 10%,
the value of accumulated savings
for individuals gets reduced. As a result, the returns generated from your fixed income funds may not
compensate well for the inflation. Therefore, one can increase the allocation to equity asset class, as the
long-term returns from equity funds can surpass inflation.
Over a period of time, the sustained high prices may put pressure on the consumption driven economy like
ours and hamper growth. Therefore, the central bank hikes the policy rates resulting in a tight interest rate
regime as witnessed during the period 2010-2011 to control inflation. The high interest rates are expected to
work as a lever to decelerate growth and in due course, tame inflation too. Fixed Maturity Plans are less
sensitive to interest rate fluctuations. Thus, investors could consider FMPs and lock their money into high
yielding papers.
Government Borrowing
The fiscal policy of the government affects the bond market. When the government borrows more to fund
the infrastructure and development projects, there will be a larger supply of debt papers in the market. To
facilitate borrowing, the government would be willing to give a better rate on the papers. Subsequently, the
rate of borrowing in the economy goes up. Corporate and retail borrowers may face difficulty in availing
credit, cutting down liquidity in the market. Ultimately, high interest rates would prevail in the market. The
issuance of long-term debt papers by the government impacts the current yield on government securities.
Chart 1: Inflation in India (source: RBI)

31 © 2011 iFAST Financial India Private Limited. All Rights Reserved
With higher amount of government borrowing and less liquidity, the yield on long-term securities rises and
bond price falls. During such periods, conservative investors should avoid putting their money in Medium
Term, Dynamic Bond, Income Funds and GILT category funds.
When the macro-economic conditions get better, the RBI adopts a loose monetary policy and relaxes the key
policy rates. Consequently, the high bond yields start to ease off from their peak points and aggressive
investors can partly allocate money into Income and GILT funds. As the bond prices rise on account of
improving fiscal situation, the debt fund manager can book trading profit on those long duration bonds. For
example, yield on a ten year G-sec trading at 8.25% plus levels would gradually fall down to a lower range
resulting in higher bond price.
Conclusion
Generally, debt papers having a maturity of 180 days and above are traded in the market i.e., Marked-To-
Market (MTM) component in the debt funds is sensitive to the factors discussed above. When the factors are
favourable, the performance of the debt funds improves. However, the alpha return from a fund, the superior
performance over benchmark and other funds in the same category depends on the fund management style.
Therefore, before taking a call, you should browse through the fund factsheet to review the past
performance, exit load, average maturity and YTM of the fund.

32 © 2011 iFAST Financial India Private Limited. All Rights Reserved
H. Things to look in a Fact sheet
Average Maturity
Debt funds invest in securities with variable maturity period. Average maturity of a debt fund is the average
of different maturities of the securities which form a portfolio. Therefore, average maturity informs an
investor if the debt fund follows a long-term strategy or the short-term strategy. At the same time, it also
informs an investor whether the debt fund is in line with its investment objective or not.
Importance of Average Maturity
The average maturity of a bond determines its volatility:
Investors can look at average maturity to check whether the debt fund‟s portfolio is investing in long-term or
short-term securities.
High average maturity indicates that the bond fund has invested in long-term securities. On the other hand,
low average maturity indicates that the bond fund has invested in short-term securities. As long-term
securities are more prone to interest rate fluctuations, an investor while investing should compare the
average maturity of the debt funds, to get an idea about the interest rate sensitivity of the funds.
Misconceptions with Average Maturity
Average maturity of a bond does not qualify as the maturity of the bond:
An open-ended debt scheme can have a fixed average maturity but, this does not mean that the
portfolio has a fixed maturity. Instead, it defines the fixed maturity of the securities comprising the
debt fund.

33 © 2011 iFAST Financial India Private Limited. All Rights Reserved
Short term bonds can invest in long- term securities:
The statement does not mean that the short term bonds have long maturity instruments but, this
simply means that the short term bonds have invested in the residual maturity of long-term
instruments which is equal to the maturity of the short-term bond.
Average maturity of the debt portfolio changes only when it is churned:
The average maturity of the portfolio decreases with the maturity of the invested securities in the
portfolio. Therefore, the average maturity of a debt fund investing in these securities would also
keeps on reducing with the maturity of the security.
Modified Duration
Modified Duration is used to measure the change in bond prices as a result of change in interest rates. It can
help an investor understand the effect of 1% change in interest rate on the value of the fixed income
securities.
The modified duration works on the inverse relationship between bond prices and interest rates.
Modified Duration (approx) = the percent change in bond value/ the percent change in yield.
This ratio is represented as Modified Duration in percentage terms.
Factors affecting Modified Duration
Maturity:
Modified duration of a bond is directly proportional to its maturity. This is so, as modified duration
is a form of duration which in turn, tells an investor when his bond will mature. Therefore, with an
increase in bond maturity, the modified duration of a bond increases.
Coupon Rate:
A bond that provides higher coupon payments to the investor matures early compared to a bond with
lower coupon payments. Hence, coupon payments are inversely proportional to Modified Duration.
Coupon Payments:
Modified duration of a bond decreases till the time of a coupon payment after which it increases.
This is because till the time of coupon payment the duration of the bond decreases every day. After

34 © 2011 iFAST Financial India Private Limited. All Rights Reserved
the coupon payment has been made it is no longer a determining factor in the modified duration of
the bond. Thus, the modified duration increases after the coupon payment.
Coupon Frequency:
The modified duration of a bond decreases with an increase in coupon frequency because bonds
mature early with increased coupon payments. For example,
Coupon Frequency Modified Duration
Quarterly 0.05
Half- Yearly 0.09
Annually 0.12
It can be seen from the table above that a bond having a greater coupon frequency (quarterly) has a
lower modified duration (0.05) vis-à-vis the same bond having lesser coupon frequency (annually)
but with higher modified duration (0.12).
Yield:
Modified duration of a bond shares an inverse relationship with yield.
With the fall in bond yield, the modified duration of the bond increases and vice versa. As the rates
decline, the price of the bond goes up; thus, the cash flows from the bond increase in value. As a
result, modified duration of the bond also increases (see formula above). The greatest change in
Modified Duration would occur for the bond with longest maturity.
In contrast, the rising bond yield decreases the value of cash flows in turn, decreasing the modified
duration of the bond.
Importance of Modified Duration
Modified duration helps an investor understand the sensitivity of debt fund to market rates.
It helps the investor plan his investment strategy. For instance, investor can opt for debt funds with
longer modified duration in the case of declining yields (higher bond price value). At the same time,
in the case of increasing yields, the investor can opt for bonds with shorter modified duration.
Macaulay Duration

35 © 2011 iFAST Financial India Private Limited. All Rights Reserved
Macaulay Duration is the weighted average time remaining for receiving cash flows or repayment of the
bond. The weight in this case, is the present value of the cash flows divided by the price of the bond.
Macaulay duration is used by fund managers in order to understand the sensitivity of a bond with respect to
interest rate changes. Modified duration is derived from Macaulay Duration and holds importance for an
investor. In the case of Modified Duration, the change is expressed in percentage points and is therefore
different form Macaulay Duration.
Exit Load
Exit load can be described as a certain amount of fees charged or penalty borne by an investor if the investor
redeems or switches from his invested scheme before a stipulated time.
Exit load is levied on the percentage of the assets held by the investor rather than a fixed amount. Different
mutual fund schemes have different exit loads on them with some of the schemes carrying no exit loads too.
The exit load is present as a measure to discourage investors from withdrawing the investment prematurely.
It can also be present in the form of Contingency Deferred Sales Charge (CDSC) too in which the exit load
on the scheme changes after a fixed duration of time i.e., the exit load on the scheme decreases after a
stipulated period of time ultimately becoming nil.
For example,
Maturity of the Scheme – 5 years
Duration Exit Load
Within 1 year 1%
Within 2 to 3 years 0.5%
After 3 years Nil
In this case, the fund house is trying to lock in the investor with them as long as possible by decreasing the
exit load after 1 year, 3 years and ultimately removing it.
Importance of Exit Load
Exit Load eats away the returns

36 © 2011 iFAST Financial India Private Limited. All Rights Reserved
For example; if an investor redeems his 100 units prematurely at an exit load of 1%. With the current
NAV of INR 15 and an exit load of INR 0.15 per unit, the redemption value would be INR 1485.
Thus, investor would lose INR 15 on 100 units. This loss is proportional to the total amount invested
or the number of units held by the investor.
Exit load reduces the net yield on the debt fund
For example, If a fund has a gross portfolio yield of 8.3% and has an exit load of 1%. In the case of
early redemption, the investor would only get a net yield of 7.3%. Therefore, the actual returns from
the fund are reduced as a result of exit load. This difference in actual returns carries greater
importance for an investor of debt funds which provide low returns to him carrying low risk.
Note: Debt funds in the category of Ultra Short Term, Short Term Income Funds, etc. carry low
duration. So, the impact of exit load on returns would be more for UST and Short Term Income
funds.
Therefore, investor should look into exit load carried by a scheme before they invest into it. At the
same time, it is imperative that they should have a clear investment objective and time horizon
before investing. Also, they should calculate their actual returns in order to get an idea if their
investment objective is being met.
Benchmark Index
Benchmark index forms the standard against which the fund performance is matched and compared. It forms
a standard for measuring fund returns and evaluating them.
There are different benchmarks for different investments. The benchmark index against which a fund is
mapped shares the same characteristics as the fund - belonging to the same sector, style, etc.
Major Benchmark Indices (source: CRISIL)
37 © 2011 iFAST Financial India Private Limited. All Rights Reserved
Crisil Liquid Fund Index: It is a benchmark for debt portfolio consisting of commercial papers and
certificates of deposits.
Funds on our platform following this index:
Canara Robeco Floating Rate Short Term Plan
BSL Floating Rate Fund Long Term Plan
Reliance Short Term Fund
BSL Ultra Short Term Fund
DWS Ultra Short Term Fund
BNP Paribas Money Plus Fund
CRISIL Composite Bond Fund Index: It is a benchmark for composite debt portfolio consisting of
commercial papers, certificates of deposits and government securities and AAA and AA rated
instruments.
Funds on our platform following this index:
BSL Dynamic Bond Fund
Crisil Short –Term Bond Fund Index: It is a benchmark for short – term debt portfolio comprising of
commercial papers, certificates of deposits and government securities and AAA and AA rated
instruments. The maturity of the index is parallel to short- term debt funds.
Funds on our platform following this index:
Templeton India Short Term Income Plan

38 © 2011 iFAST Financial India Private Limited. All Rights Reserved
I. RECOMMENDED FUNDS
Recommended Ultra Short Term Funds
These funds follow the investment objective to provide easy liquidity to the investor and generate stable
returns by investing in short term debt instruments in the market.
Our recommended funds in this category include:
DWS UST Fund- Dividend**
BNP Paribas Money Plus Fund- Dividend**
Birla SunLife (BSL) Ultra Short Term Fund –Dividend**
Information on the Fund:
Fund Information DWS UST Fund
(as at May 2011)
BNP Paribas Money
Plus Fund
(as at May 2011)
BSL Ultra Short
Term Fund
(as at June 2011)
Modified Duration 0.09 0.11 0.12
Expense Ratio 0.50 0.70 _
AUM INR 1767.46 crores _ _
Exit Load Nil 0.15% (within 7 days
of allotment)
0.25% of NAV
(within 15 days of
allotment)

39 © 2011 iFAST Financial India Private Limited. All Rights Reserved
Average Maturity of the Funds:
Average Maturity
(in Months)
DWS UST Fund
BNP Paribas Money
Plus Fund
BSL Ultra Short
Term Fund
3 Months 1.92 2.68 2.16
6 Months 1.88 3.04 1.76
1 Year 2.21 3.60 1.98
3 Years 3.29 3.98 3.86
Since Inception 8.72 4.08 6.37
The table above shows the average maturity of the different funds. Low average maturity indicates that a
bond is least volatile to interest rate fluctuations and vice versa.
Using the table above, an investor can see the average maturities of the three funds on our platform and then
compare their returns with the risk associated with them.
**The Dividend option for all investors belonging to retail and HUF category have the applicable tax rate as
only 13.841%. So, debt funds are tax efficient for individuals who fall in higher tax brackets of 20% and
30%. The investor can also invest into monthly or fortnightly dividend scheme. Also, redemption should be
done after the declaration of the dividend for the month / fortnight. This way the investor avoids paying
short term capital gains tax.

40 © 2011 iFAST Financial India Private Limited. All Rights Reserved
DWS UST Fund
Fund Performance
The graph here compares the percentage returns of DWS UST Fund with the percentage returns of its
benchmark, Crisil Liquid Fund Index at definite periods of time.
From the graph it can be easily seen that the fund has managed to outperform its benchmark returns at 3
months, 6 months and 3 years period.
DWS UST Portfolio Composition and Credit Rating
The graphs here show the portfolio composition of the fund. It also shows the current credit rating of the
various instruments which comprise the portfolio.
For example, more than 50% of the portfolio in this case comprise of instruments having the best rating
(P1+) of CRISIL.

41 © 2011 iFAST Financial India Private Limited. All Rights Reserved
BNP Paribas Money Plus Fund
The graph here compares the percentage returns of BNP Paribas Money Plus Fund with the percentage
returns of its benchmark, Crisil Liquid Fund Index at definite periods of time.
From the graph it can be easily seen that the fund has managed to outperform its benchmark returns at all
periods.

42 © 2011 iFAST Financial India Private Limited. All Rights Reserved
BNP Paribas Money Plus Portfolio Composition and Credit Rating
The graphs here show the portfolio composition of the fund. It also shows the current credit rating of the
various instruments which comprise the portfolio.
For example, major part of the portfolio carry the best rating (PR1+) of CARE with 35%of the portfolio
investing in CDs and 34% of the portfolio investing in CPs.
BSL Ultra Short Term Fund
The graph above compares the percentage returns of BSL UST Fund with the percentage returns of its
benchmark, Crisil Liquid Fund Index at definite periods of time.
43 © 2011 iFAST Financial India Private Limited. All Rights Reserved
From the graph it can be easily seen that the fund has managed to outperform its benchmark returns at 3
months, 6 months and 1 year periods
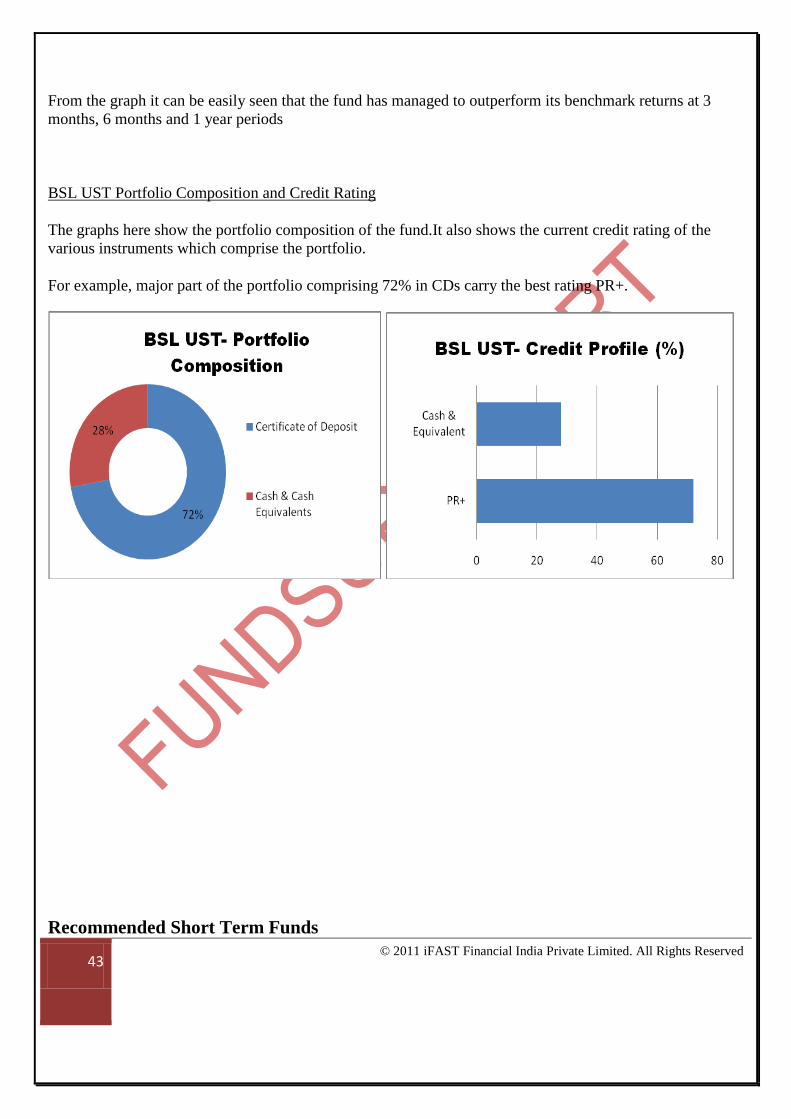
BSL UST Portfolio Composition and Credit Rating
The graphs here show the portfolio composition of the fund.It also shows the current credit rating of the
various instruments which comprise the portfolio.
For example, major part of the portfolio comprising 72% in CDs carry the best rating PR+.
Recommended Short Term Funds

44 © 2011 iFAST Financial India Private Limited. All Rights Reserved
These funds follow the investment objective to provide stable returns to
the investor by investing in short term debt instruments. They prove to be
suitable for the investor having a short-term investment horizon.
Our recommended funds in this category include:
Reliance Short Term Fund- Dividend**
Templeton India Short Term Income Plan- Dividend**
Information on the Fund:
Fund Information Reliance Short Term
Fund
(as on May, 2011)
Templeton India
Short Term Income
Plan
(as on May, 2011)
Modified Duration 1.42 0.98
Expense Ratio _ 1.30%
AUM _ INR 3722. 14 crores
Exit Load Nil 0.50% (within 9
months of allotment)
Average Maturity of the Funds:
Average Maturity
(in Months)
Reliance Short Term
Fund
Templeton India
Short Term Income
Plan
3 Months 18.54 12.20
6 Months 20.18 12.96
1 Year 21.20 13.85
3 Years 20.67 13.66
Since Inception 19.15 15.49

45 © 2011 iFAST Financial India Private Limited. All Rights Reserved
The table above shows the average maturity of the different funds. Low average maturity indicates that a
bond is least volatile to interest rate fluctuations and vice versa.
Using the table above, an investor can see the average maturities of the three funds on our platform and then
compare their returns with the risk associated with them.
**The Dividend option for all investors belonging to retail and HUF category have the applicable tax rate as
only 13.841%. So, debt funds are tax efficient for individuals who fall in higher tax brackets of 20% and
30%. The investor can also invest into monthly or fortnightly dividend scheme. Also, redemption should be
done after the declaration of the dividend for the month / fortnight. This way the investor avoids paying
short term capital gains tax.
Reliance Short Term Fund
The graph here compares the percentage returns of Reliance Short Term Fund with the percentage returns of
its benchmark, Crisil Liquid Fund Index at definite periods of time.
From the graph it can be easily seen that the fund has managed to outperform its benchmark returns for a
longer time span at a 3 year periods.
46 © 2011 iFAST Financial India Private Limited. All Rights Reserved
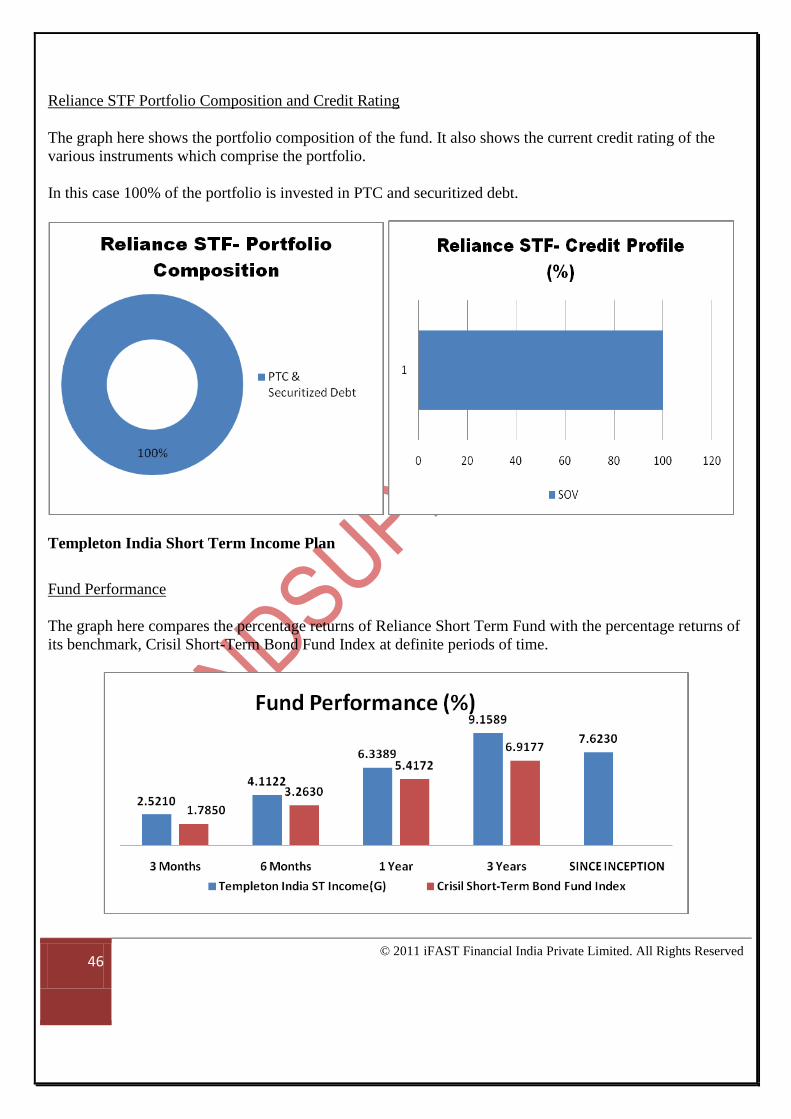
Reliance STF Portfolio Composition and Credit Rating
The graph here shows the portfolio composition of the fund. It also shows the current credit rating of the
various instruments which comprise the portfolio.
In this case 100% of the portfolio is invested in PTC and securitized debt.
Templeton India Short Term Income Plan
Fund Performance
The graph here compares the percentage returns of Reliance Short Term Fund with the percentage returns of
its benchmark, Crisil Short-Term Bond Fund Index at definite periods of time.

47 © 2011 iFAST Financial India Private Limited. All Rights Reserved
From the graph it can be easily seen that the fund has managed to outperform its benchmark returns at all
periods.
Templeton India ST Income Portfolio Composition and Credit Rating
The graph here shows the portfolio composition of the fund. It also shows the current credit rating of the
various instruments which comprise the portfolio.
Here, the major part of the portfolio that is, 51% of the portfolio is invested in Corporate Debt with a rating
of (PR1+ (SO)).
48 © 2011 iFAST Financial India Private Limited. All Rights Reserved
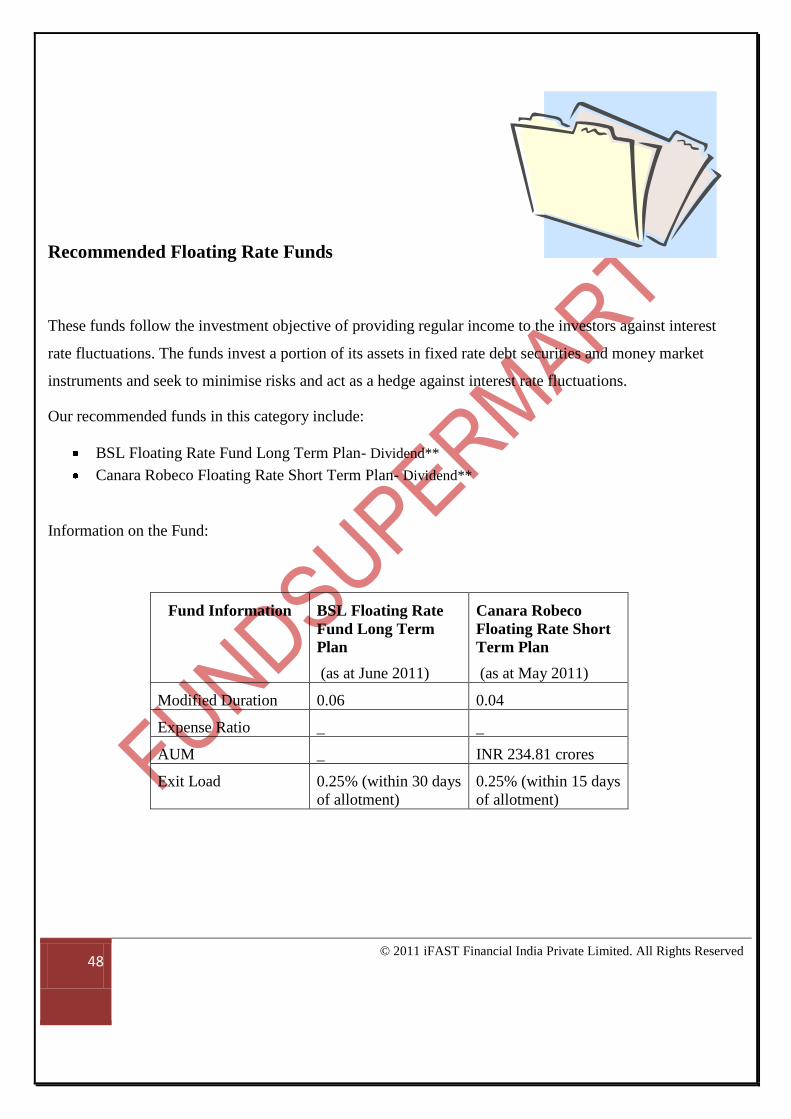
Recommended Floating Rate Funds
These funds follow the investment objective of providing regular income to the investors against interest
rate fluctuations. The funds invest a portion of its assets in fixed rate debt securities and money market
instruments and seek to minimise risks and act as a hedge against interest rate fluctuations.
Our recommended funds in this category include:
BSL Floating Rate Fund Long Term Plan- Dividend**
Canara Robeco Floating Rate Short Term Plan- Dividend**
Information on the Fund:
Fund Information BSL Floating Rate
Fund Long Term
Plan
(as at June 2011)
Canara Robeco
Floating Rate Short
Term Plan
(as at May 2011)
Modified Duration 0.06 0.04
Expense Ratio _ _
AUM _ INR 234.81 crores
Exit Load 0.25% (within 30 days
of allotment)
0.25% (within 15 days
of allotment)

49 © 2011 iFAST Financial India Private Limited. All Rights Reserved
Average Maturity of the Funds:
Average Maturity
(in Months)
BSL Floating Rate
Fund Long Term
Plan
Canara Robeco
Floating Rate Short
Term Plan
3 Months 1.68 1.40
6 Months 1.56 1.34
1 Year 2.29 1.42
3 Years 4.06 1.65
Since Inception 3.63 2.21
The table above shows the average maturity of the different funds. Low average maturity indicates that a
bond is least volatile to interest rate fluctuations and vice versa.
Using the table above, an investor can see the average maturities of the three funds on our platform and then
compare their returns with the risk associated with them.
**The Dividend option for all investors belonging to retail and HUF category have the applicable tax rate as
only 13.841%. So, debt funds are tax efficient for individuals who fall in higher tax brackets of 20% and
30%. The investor can also invest into monthly or fortnightly dividend scheme. Also, redemption should be
done after the declaration of the dividend for the month / fortnight. This way the investor avoids paying
short term capital gains tax.
BSL Floating Rate Fund Long Term Plan
Fund Performance
The graph here compares the percentage returns of BSL Floating Rate Fund Long Term Plan with
the percentage returns of its benchmark, Crisil Liquid Fund Index at definite periods of time.

50 © 2011 iFAST Financial India Private Limited. All Rights Reserved
From the graph it can be easily seen that the fund has managed to outperform its benchmark returns at all
periods.
BSL FRF Portfolio Composition and Credit Rating
The graph here shows the portfolio composition of the fund. It also shows the current credit rating of the
various instruments which comprise the portfolio.
In this case 100% of the portfolio is invested in CDs with the best rating of (PR+).
51 © 2011 iFAST Financial India Private Limited. All Rights Reserved
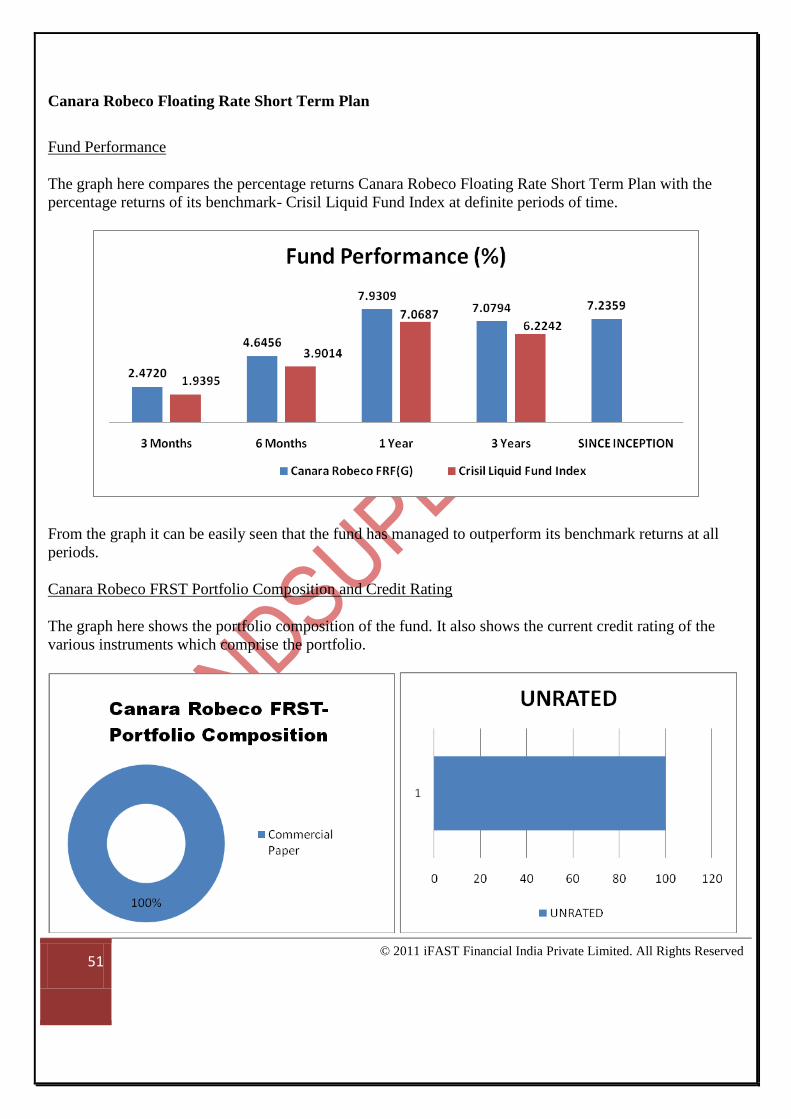
Canara Robeco Floating Rate Short Term Plan
Fund Performance
The graph here compares the percentage returns Canara Robeco Floating Rate Short Term Plan with the
percentage returns of its benchmark- Crisil Liquid Fund Index at definite periods of time.
From the graph it can be easily seen that the fund has managed to outperform its benchmark returns at all
periods.
Canara Robeco FRST Portfolio Composition and Credit Rating
The graph here shows the portfolio composition of the fund. It also shows the current credit rating of the
various instruments which comprise the portfolio.

52 © 2011 iFAST Financial India Private Limited. All Rights Reserved
Recommended Income Funds
These funds follow the investment objective to provide good returns to the investor maintaining high
liquidity. They are therefore, actively managed and invest in highly rated debt and money market
instruments.
Our recommended funds in this category include:
BSL Dynamic Bond Fund- Dividend**
Information on the Fund:
Fund Information BSL Dynamic Bond Fund
(as at June 2011)
Modified Duration 1.45
Expense Ratio _
AUM _
Exit Load 0.50% (within 180 days of
allotment)
Average Maturity of the Funds:
Average Maturity (in
Months)
BSL Dynamic Bond Fund
3 Months 18.60
6 Months 15.82
1 Year 20.05
3 Years 18.11
Since Inception 16.40
53 © 2011 iFAST Financial India Private Limited. All Rights Reserved
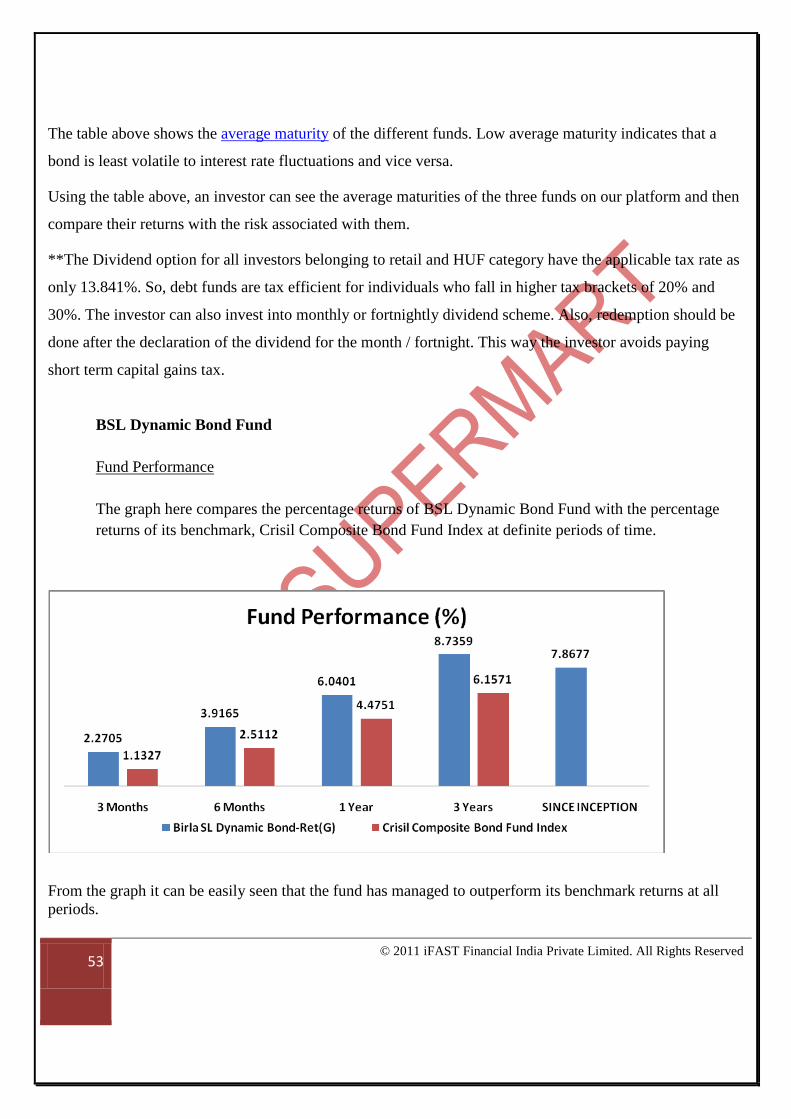
The table above shows the average maturity of the different funds. Low average maturity indicates that a
bond is least volatile to interest rate fluctuations and vice versa.
Using the table above, an investor can see the average maturities of the three funds on our platform and then
compare their returns with the risk associated with them.
**The Dividend option for all investors belonging to retail and HUF category have the applicable tax rate as
only 13.841%. So, debt funds are tax efficient for individuals who fall in higher tax brackets of 20% and
30%. The investor can also invest into monthly or fortnightly dividend scheme. Also, redemption should be
done after the declaration of the dividend for the month / fortnight. This way the investor avoids paying
short term capital gains tax.
BSL Dynamic Bond Fund
Fund Performance
The graph here compares the percentage returns of BSL Dynamic Bond Fund with the percentage
returns of its benchmark, Crisil Composite Bond Fund Index at definite periods of time.
From the graph it can be easily seen that the fund has managed to outperform its benchmark returns at all
periods.
54 © 2011 iFAST Financial India Private Limited. All Rights Reserved
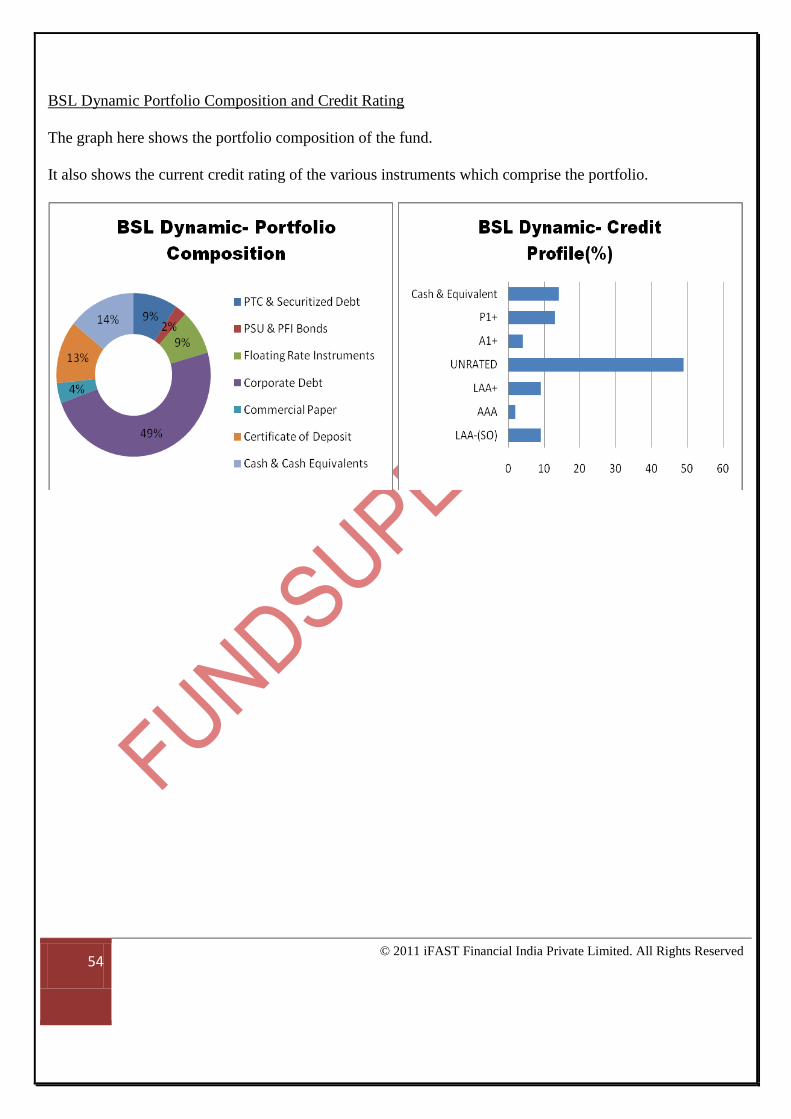
BSL Dynamic Portfolio Composition and Credit Rating
The graph here shows the portfolio composition of the fund.
It also shows the current credit rating of the various instruments which comprise the portfolio.

55 © 2011 iFAST Financial India Private Limited. All Rights Reserved
Tell Us What You Think!
Email : [email protected]
Mailing Address : iFAST Financial India Pvt. Ltd.
1 Ground Floor, Raheja Titanium,
Western Express Highway
Goregaon East,
Mumbai - 400063
India
------------------------------------------------------------------------------------------------------------------------------------------------------------------------
This document is for information purpose only. This document and information do not constitute a distribution, an endorsement, an investment
advice, an offer to buy or sell or the solicitation of an offer to buy or sell any securities/schemes or any other financial products /investment products
mentioned in this article or an attempt to influence the opinion or behavior of the investors /recipients. Any use of the information /any investment
and investment related decisions of the investors/recipients are at their sole discretion and risk. Any advice herein is made on a general basis and
does not take into account the specific investment objectives of the specific person or group of persons. Opinions expressed herein are subject to
change without notice.