introduction to census data and practical applications - geography skills aberdeenshire cpd event...
TRANSCRIPT
Introduction to Census data and practical applications
Aberdeenshire CPD, Inverurie Academy17 February 2015
Cecilia Macintyre, National Records of ScotlandTom Macintyre, University of Edinburgh

Introduction
What we will cover:
Background to the 2011 Census and some results
Practical using‘Census Data Explorer’
Links to Curricular frameworks
Discussion – future potential within Geography NQs

2011 Census in Scotland

Your average Scot
In the late 1850s– were called John Smith or Mary
Macdonald
– had a 1 in 7 chance of dying before their first birthday
– lived almost 2 to a room, with a 1 in 3 chance of sharing the room with the whole family
– got married at 27 (John) and 25 (Mary)
– had a 1 in 3 chance of being married in their 20s
– had a life expectancy at birth of 40 (John) and 44 (Mary)
At end of the 20th Century– were called Lewis Smith or Emma
Brown
– had a 1 in 200 chance of dying before their first birthday
– each had 2 rooms to live in
– got married at 32 (Lewis) and 29 (Emma)
– had a 1 in 7 chance of being married in their 20s
– had a life expectancy at birth of 76 (Lewis) or 81 (Emma)
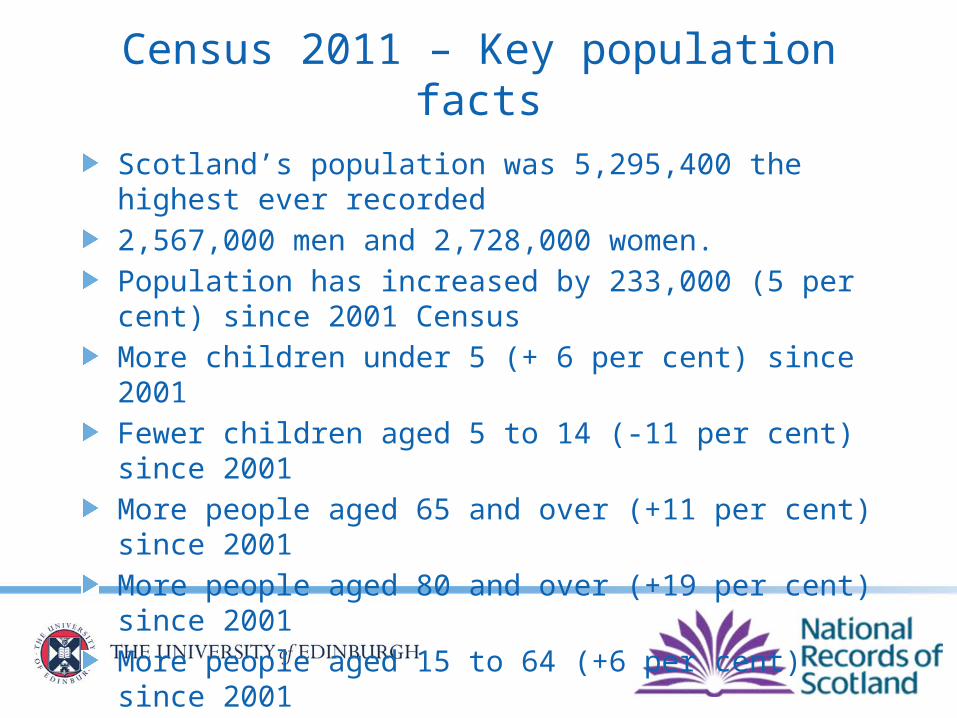
Census 2011 – Key population facts
Scotland’s population was 5,295,400 the highest ever recorded
2,567,000 men and 2,728,000 women.
Population has increased by 233,000 (5 per cent) since 2001 Census
More children under 5 (+ 6 per cent) since 2001
Fewer children aged 5 to 14 (-11 per cent) since 2001
More people aged 65 and over (+11 per cent) since 2001
More people aged 80 and over (+19 per cent) since 2001
More people aged 15 to 64 (+6 per cent) since 2001
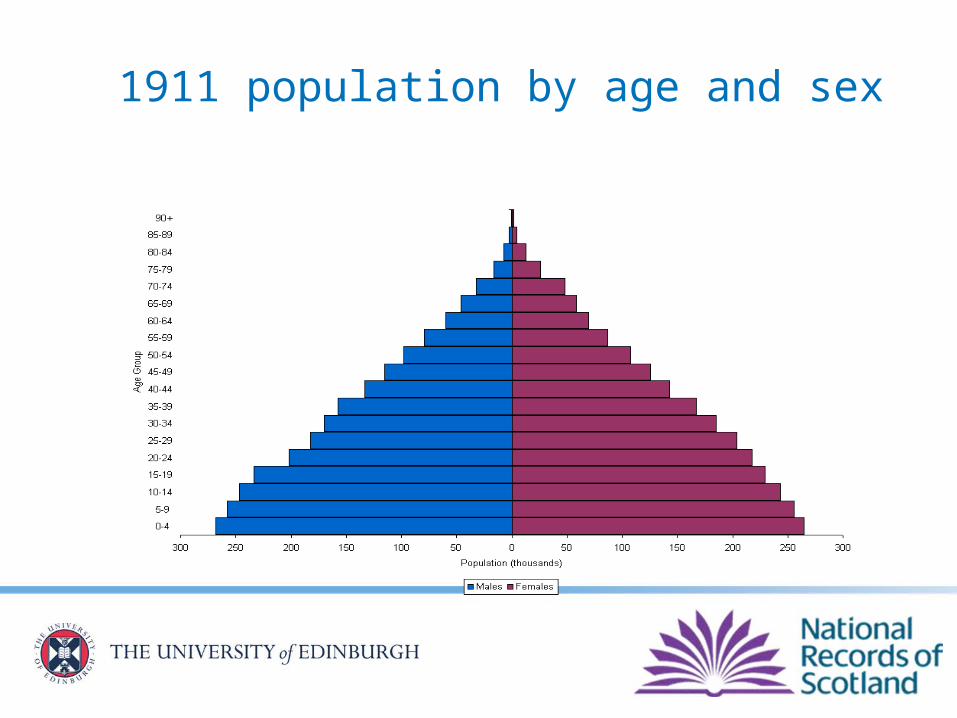
1911 population by age and sex

2011 population by age and sex

EthnicityProportion of population by ethnicity, 2011

Growing ethnic diversityProportion of people reported as belonging to minority ethnic group in 2011, Aberdeen City

National identity (New question in 2011)
Proportion of population by national identity, Scotland, 2011

Ethnic groups in Scotland and Aberdeen City – 2011 (as % of total population)
Ethnic Group Scotland Aberdeen City
White: Scottish 84.0% 75.3%
White: Other British 7.9% 7.6%
White: Irish 1.0% 1.0%
White: Gypsy/Traveller 0.1% 0.1%
White: Polish 1.2% 3.2%
White: Other White 1.9% 4.7%
Mixed/Multiple 0.4% 0.7%
Asian, Asian Scottish, Asian British
2.7% 4.3%
African, African Scottish, African British
0.6% 2.3%
Caribbean or Black 0.1% 0.3%
Other ethnic group 0.3% 0.6%

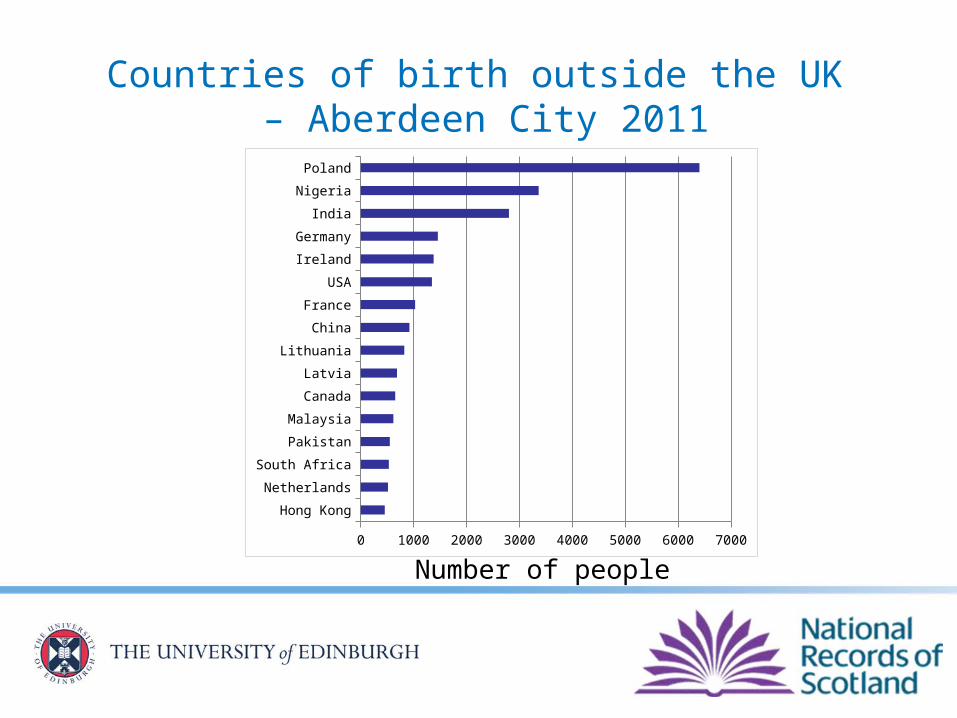
Countries of birth outside of the UK
Hong Kong
Netherlands
South Africa
Pakistan
Malaysia
Canada
Latvia
Lithuania
China
France
USA
Ireland
Germany
India
Nigeria
Poland
0 1000 2000 3000 4000 5000 6000 7000
Number of people
Countries of birth outside the UK – Aberdeen City 2011

Census 2011 - Key household results
The number of households in Scotland with at least one usual resident in 2011 was 2,372,780 - the highest ever.
In 2011, one-person households accounted for 35 per cent of all households in Scotland, ranging from 27 per cent in Aberdeenshire to 43 per cent in Glasgow City.
Between 2001 and 2011 average household size from 2.27 to 2.19 people per household.
In 1961, one-person households were the least common household type and accounted for 14 per cent of all households. By 2011 they had become the most common household type and accounted for 35 per cent of all households.

Long-term trends - Household size
One person households now most common household type – accounts for 35 per cent of all households.
Census Data Explorer
Quick, easy (and FREE!) online access to the results from Scotland’s 2011 Census
Area profiles
Data visualisations and maps online
All the standard output tables for all the available geographies
Range of supporting information
What Census data is available?
Tables of the following topics at all census geographies:
Population and Households
Housing and Accommodation
Health
Ethnicity, Identity, Language and Religion
Education
Labour Market
Transport

2011 Census Results
Release 1 – headline figures on census population and household estimates
Dec 2012 to Aug 2013
Release 2 – univariate tables: Key Statistics (KS) and Quick Statistics (QS)
Sep 2013 to Apr 2014
Release 3 – multi-variate tables: Local Characteristics (LC) and Detailed Characteristics (DC) tables
Feb 2014 to Jan 2015
LC tables provide less detail than DC tables but for lower geographies – down to output area
Those codes (DC, KS, LC & QS) prefix the code for any table called up in Standard Outputs of Census Data Explorer

2011 Census Results
Origin-destination (flow) statistics
Census microdata files (Samples of Anonymised Records)
Alternative population statistics: workplace and ‘daytime’ population
Commissioned tables service
Ongoing
Analytical reports
planned but …
depends on resources available

2011 Census GeographiesGeographical area types depend of level of data stored:
Area Profiles (7)
Council Area 2011
Health Board Area 2006
Locality 2010
Output Area 2011
Postcode (at Output Area 2011)
Scottish Parliamentary …
Constituency 2011
Region 2011

2011 Census GeographiesGeographical area types depend of level of data stored:
Maps and Charts
Only reported at Council Area 2011
Advantage is any or all Council Areas can be selected simultaneously
‘Scotland’ can be selected for comparative purposes, providing the National picture
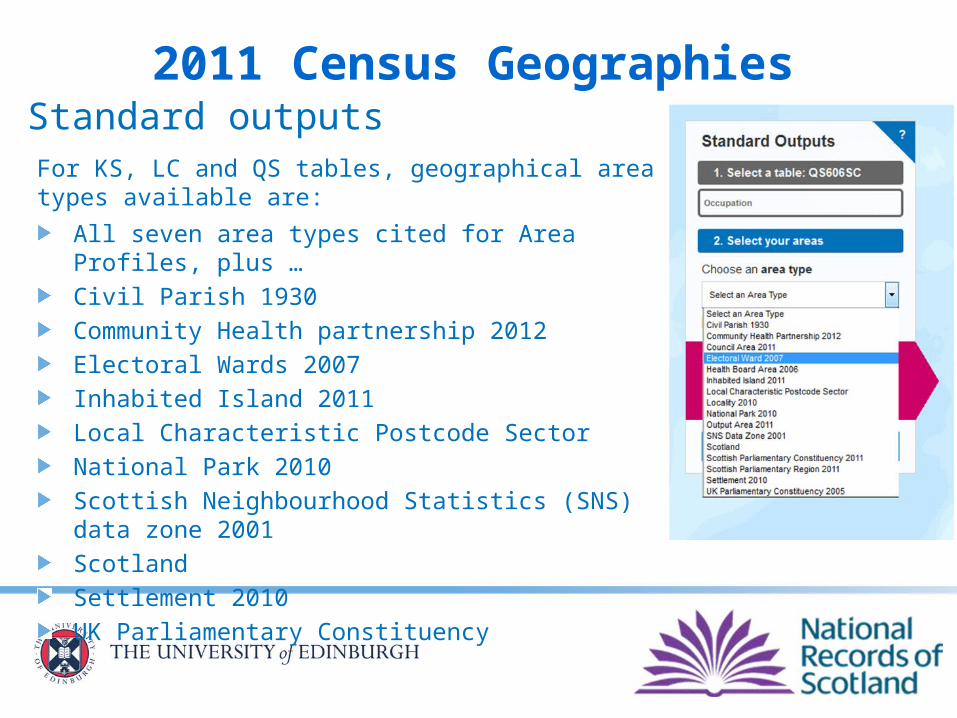
2011 Census GeographiesStandard outputs For KS, LC and QS tables, geographical area types available are:
All seven area types cited for Area Profiles, plus …
Civil Parish 1930
Community Health partnership 2012
Electoral Wards 2007
Inhabited Island 2011
Local Characteristic Postcode Sector
National Park 2010
Scottish Neighbourhood Statistics (SNS) data zone 2001
Scotland
Settlement 2010
UK Parliamentary Constituency
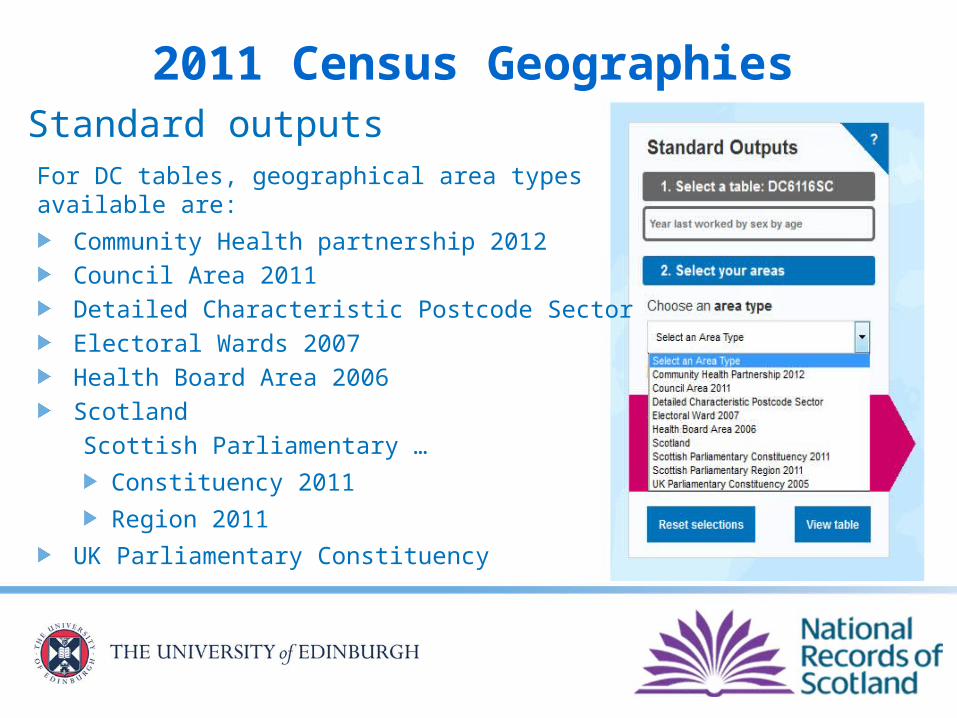
2011 Census GeographiesStandard outputs For DC tables, geographical area types available are:
Community Health partnership 2012
Council Area 2011
Detailed Characteristic Postcode Sector
Electoral Wards 2007
Health Board Area 2006
Scotland
Scottish Parliamentary …
Constituency 2011
Region 2011
UK Parliamentary Constituency
Census Data Explorer
Time for the practical session
www.scotlandscensus.gov.uk
Census Data Explorer
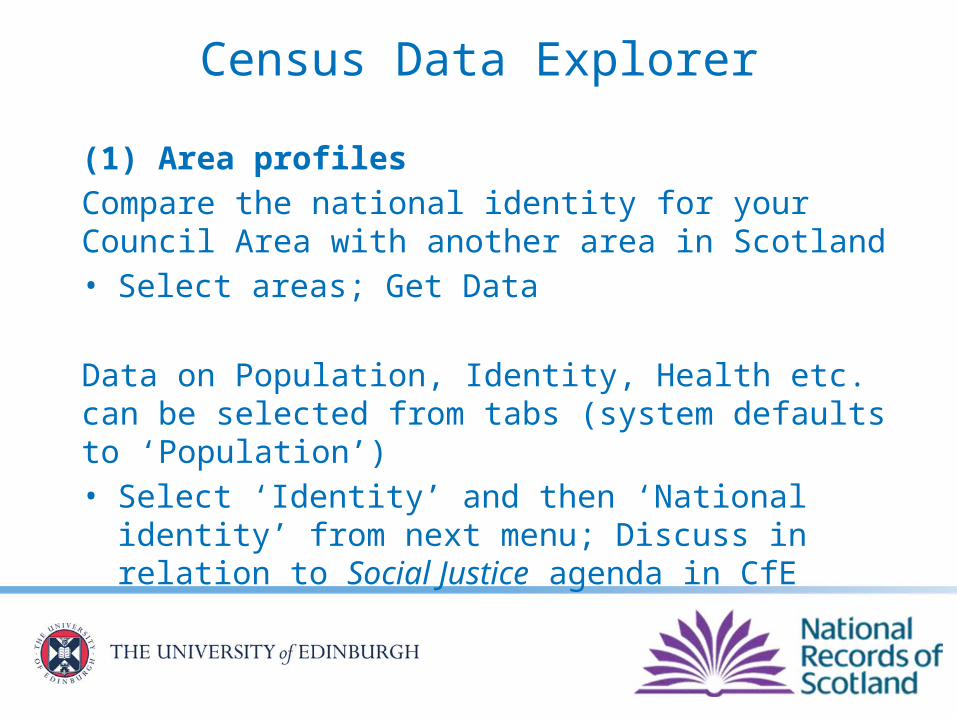
(1) Area profilesCompare the national identity for your Council Area with another area in Scotland• Select areas; Get Data
Data on Population, Identity, Health etc. can be selected from tabs (system defaults to ‘Population’)• Select ‘Identity’ and then ‘National identity’ from
next menu; Discuss in relation to Social Justice agenda in CfE

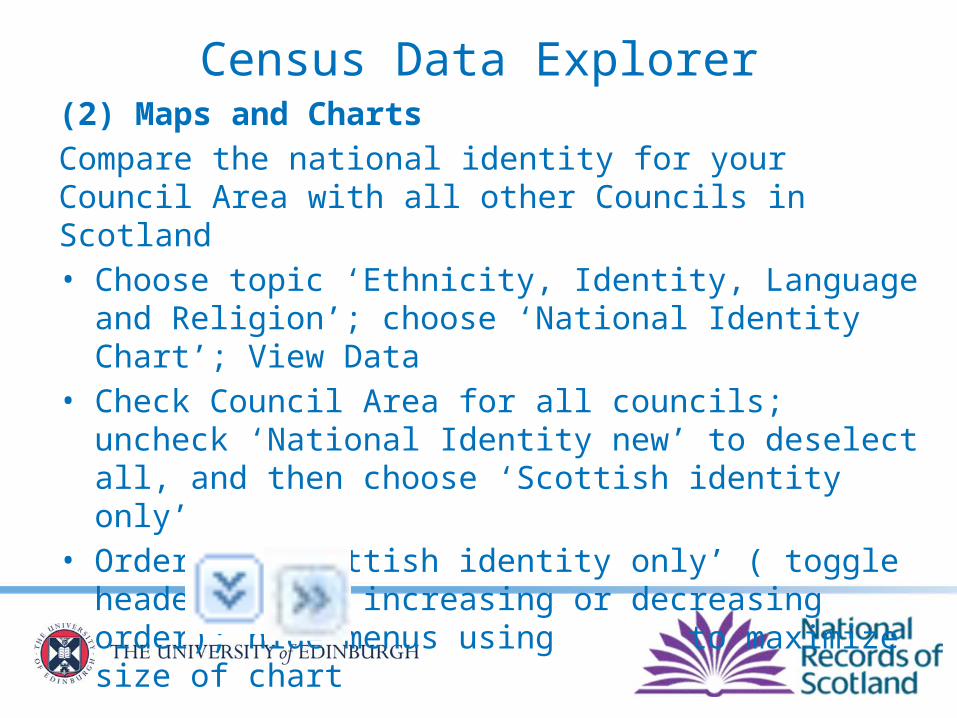
Census Data Explorer(2) Maps and ChartsCompare the national identity for your Council Area with all other Councils in Scotland• Choose topic ‘Ethnicity, Identity, Language and
Religion’; choose ‘National Identity Chart’; View Data
• Check Council Area for all councils; uncheck ‘National Identity new’ to deselect all, and then choose ‘Scottish identity only’
• Order by ‘Scottish identity only’ ( toggle header to get increasing or decreasing order); hide menus using to maximize size of chart

Links to National Outcomesand Numeracy Across Learning
MNU3-20A
I can work collaboratively, making appropriate use of technology, to source information presented in a range of ways, interpret what it conveys and discuss whether I believe the information to be robust, vague or misleading

MTH2-21A/3-21A
I can display data in a clear way using a suitable scale, by choosing appropriately from an extended range of tables, charts, diagrams and graphs, making effective use of technology
Links to National Outcomesand Numeracy Across Learning

National 5 and Higher GeographyGeography: Physical EnvironmentsUse of mapping skills and techniques including the use of Ordnance Survey maps
Geography: Human EnvironmentsUse of research skills and techniques which should include the use of fieldwork
Geography: Global IssuesUse of numerical and graphical information
Links to National Courses
Geography: Global Issues (N5)Population, Health, and Environmental hazards
Geographical skills (N5)Extracting, interpreting and presenting numerical and graphical information – statistical, graphical & tabular
Links to National Courses
Geographical skills (Higher)Extracting, interpreting and presenting numerical and graphical information – statistical, graphical & tabular
Geography: Human Environments (Higher)Population – collecting data; population structure; urban/rural issues
Geography: Global Issues (Higher)Health, Climate change (Transport)
Higher assignment (component 2) processing and using a range of information; analysing information from a range of sources; …
Links to National Courses
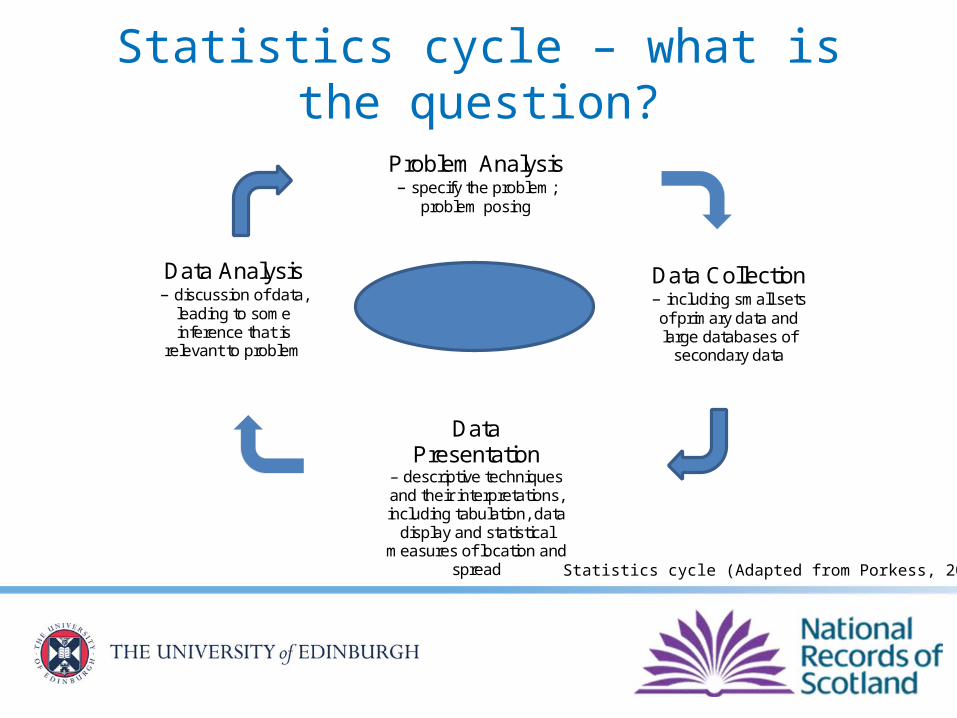
Statistics cycle – what is the question?
Problem Analysis – specify the problem;
problem posing
Data Presentation
– descriptive techniques and their interpretations, including tabulation, data
display and statistical measures of location and
spread
Data Collection – including small sets of primary data and large databases of
secondary data
Data Analysis – discussion of data,
leading to some inference that is
relevant to problem
Statistics Cycle
Statistics cycle (Adapted from Porkess, 2013)

Census Data Explorer(3) Standard OutputsCompare the national identity for neighbouring Council Areas using the map to select councils• Choose topic ‘Ethnicity, Identity, Language and
Religion’; select table KS202SC – National identity (Key Statistics); Select table
• Choose Council Areas as area type; click on map to select 4-5 neighbouring councils; View table
• Standard output has raw totals by default; choose Row percentages for discussion of findings
Example analysis of household composition + other Census data
Household composition by age and sex http://bit.ly/household_age_sex
Blog entry from Talking About Statistics www.celiamac58.blogspot.co.uk
@celiamac58
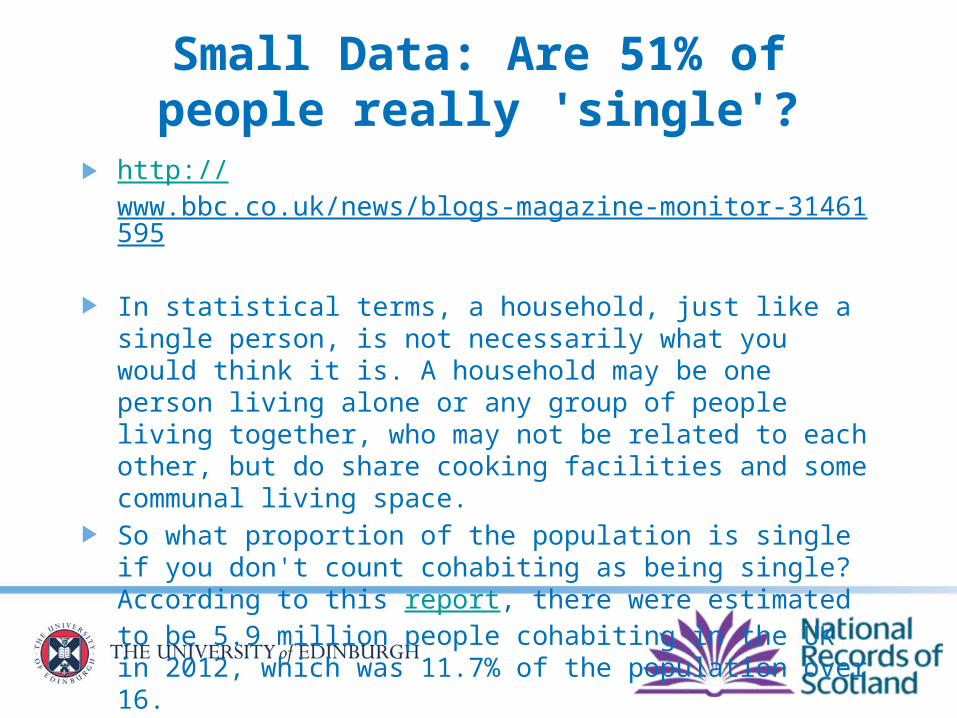
Small Data: Are 51% of people really 'single'?
http://www.bbc.co.uk/news/blogs-magazine-monitor-31461595 In statistical terms, a household, just like a single person, is not necessarily what you would think it is. A household may be one person living alone or any group of people living together, who may not be related to each other, but do share cooking facilities and some communal living space.So what proportion of the population is single if you don't count cohabiting as being single? According to this report, there were estimated to be 5.9 million people cohabiting in the UK in 2012, which was 11.7% of the population over 16.
Census Data Explorer
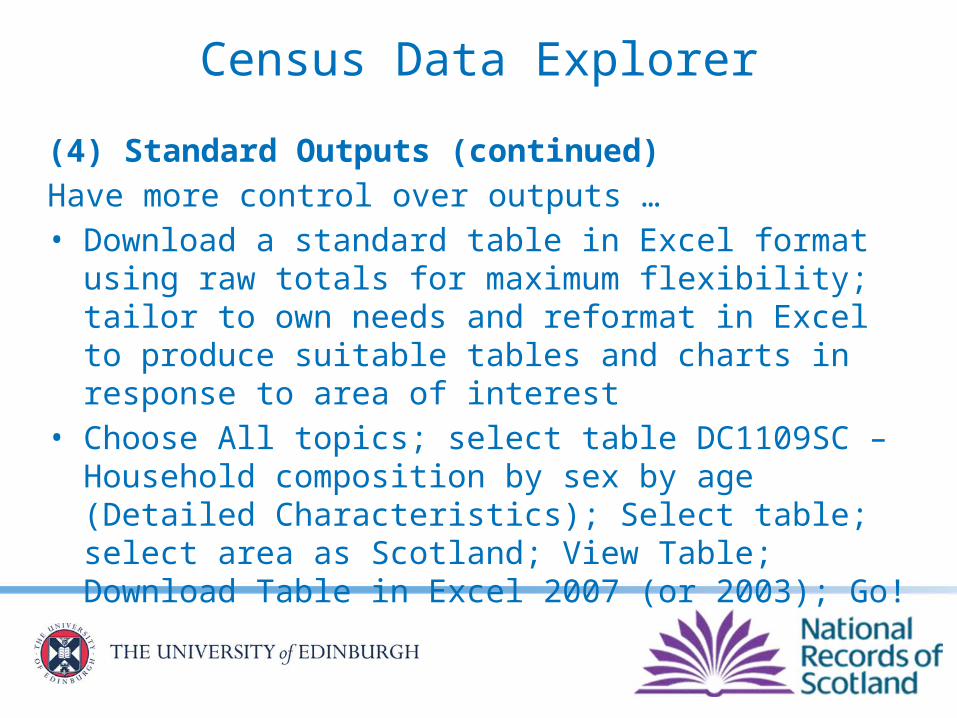
(4) Standard Outputs (continued)Have more control over outputs …• Download a standard table in Excel format using
raw totals for maximum flexibility; tailor to own needs and reformat in Excel to produce suitable tables and charts in response to area of interest
• Choose All topics; select table DC1109SC – Household composition by sex by age (Detailed Characteristics); Select table; select area as Scotland; View Table; Download Table in Excel 2007 (or 2003); Go!
Census Data Explorer
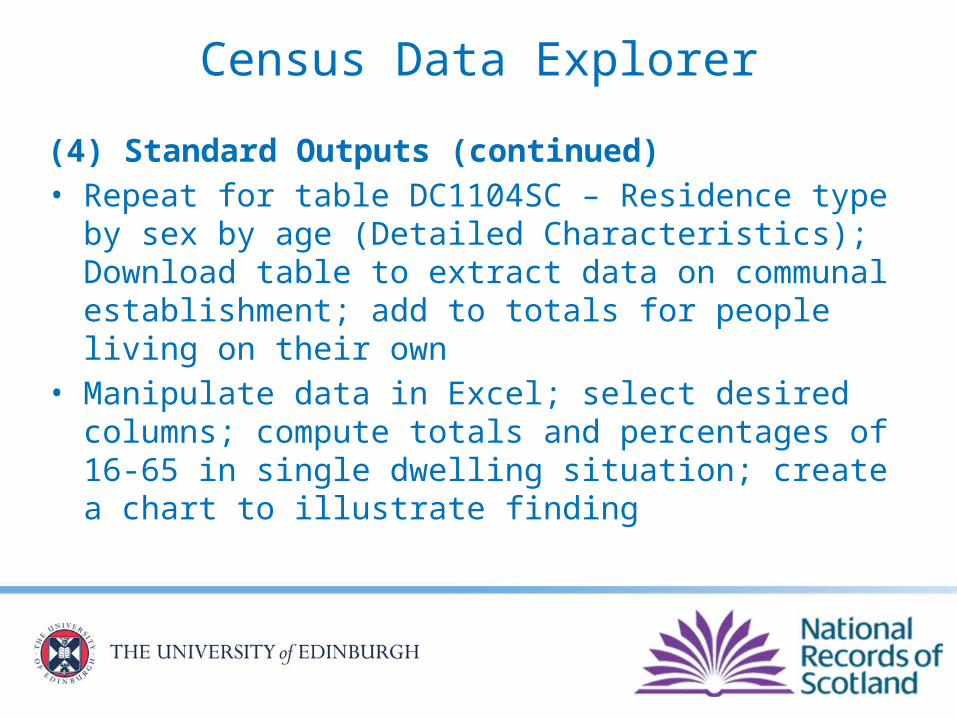
(4) Standard Outputs (continued)• Repeat for table DC1104SC – Residence type by sex
by age (Detailed Characteristics); Download table to extract data on communal establishment; add to totals for people living on their own
• Manipulate data in Excel; select desired columns; compute totals and percentages of 16-65 in single dwelling situation; create a chart to illustrate finding

Question received from AH pupilI am a final year student at *** School studying advanced higher geography. As part of my course I have to perform a study on a chosen issue. My study is on the areas of Pilton and Trinity within Edinburgh and why these two areas have such differing crime rates and types of crime, despite being so close to each other. I require information on the employment rates of the two areas and was wondering whether this information could be provided to me.
How would you support this pupil?What is the best way to access required data?

Further information
All data available at: http://www.scotlandscensus.gov.uk
Sign up there for our e-newsletter
Enquiries: [email protected]
@NatRecordsScot


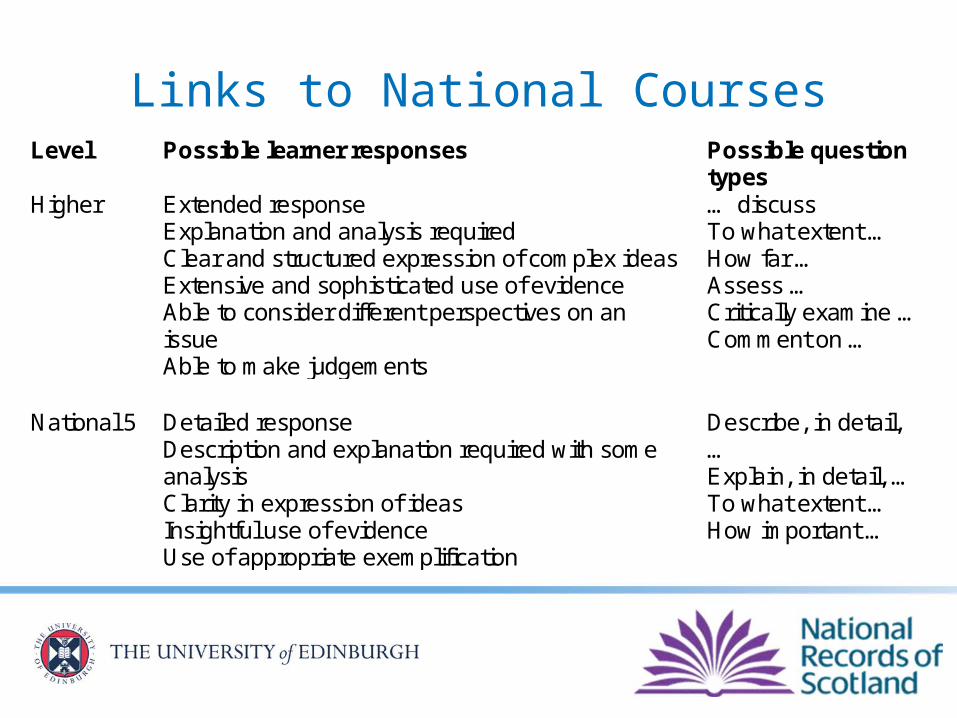
Links to National CoursesLevel Possible learner responses Possible question
types Higher Extended response
Explanation and analysis required Clear and structured expression of complex ideas Extensive and sophisticated use of evidence Able to consider different perspectives on an issue Able to make judgements
… discuss To what extent … How far … Assess … Critically examine … Comment on …
National 5 Detailed response
Description and explanation required with some analysis Clarity in expression of ideas Insightful use of evidence Use of appropriate exemplification
Describe, in detail, … Explain, in detail, … To what extent … How important …
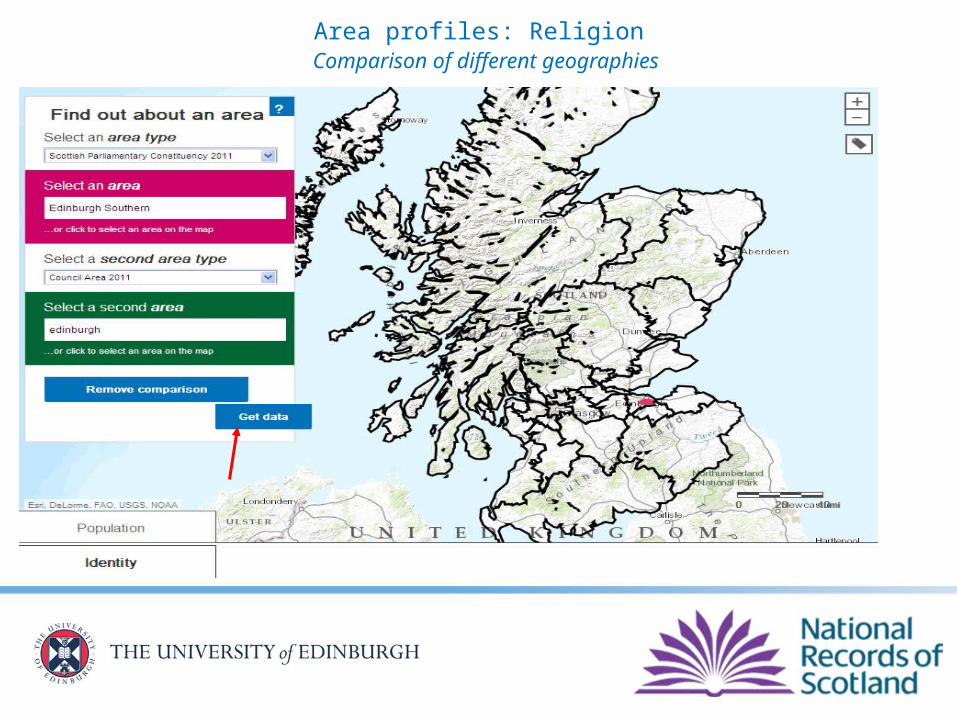
Area profiles: Religion Comparison of different geographies
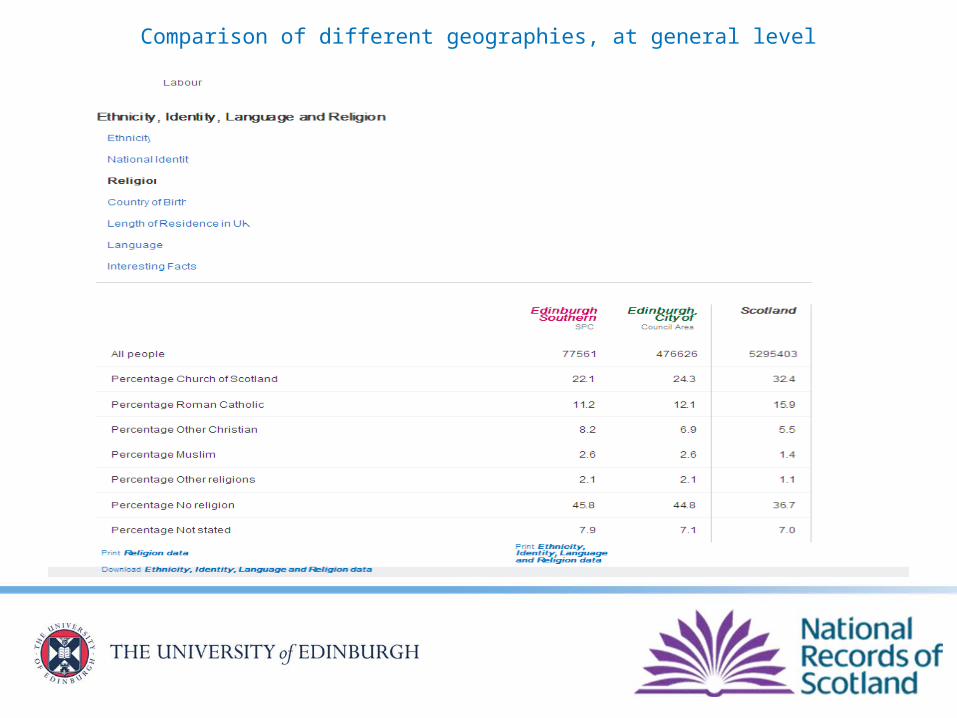
Comparison of different geographies, at general level


Maps and Charts: Map of Religion
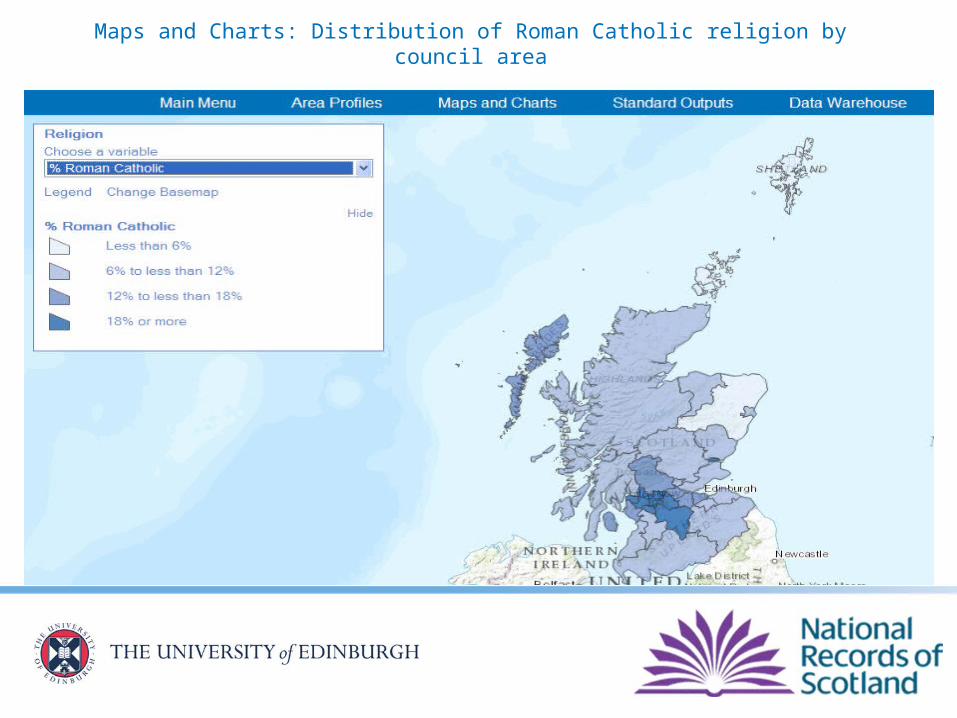
Maps and Charts: Distribution of Roman Catholic religion by council area

Maps & Charts: Religion chart
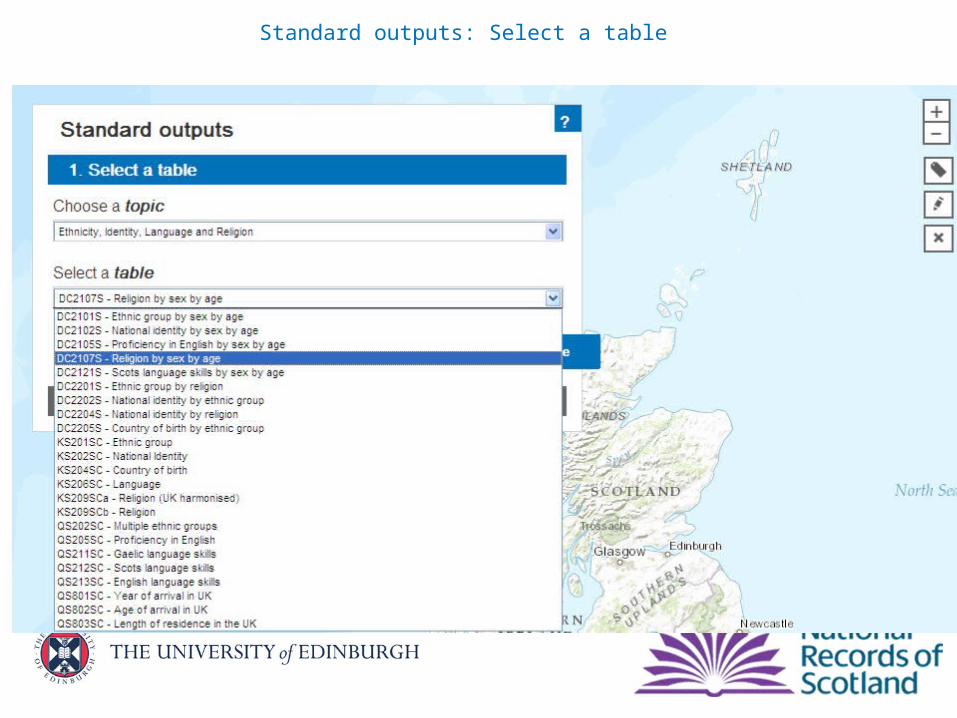
Standard outputs: Select a table
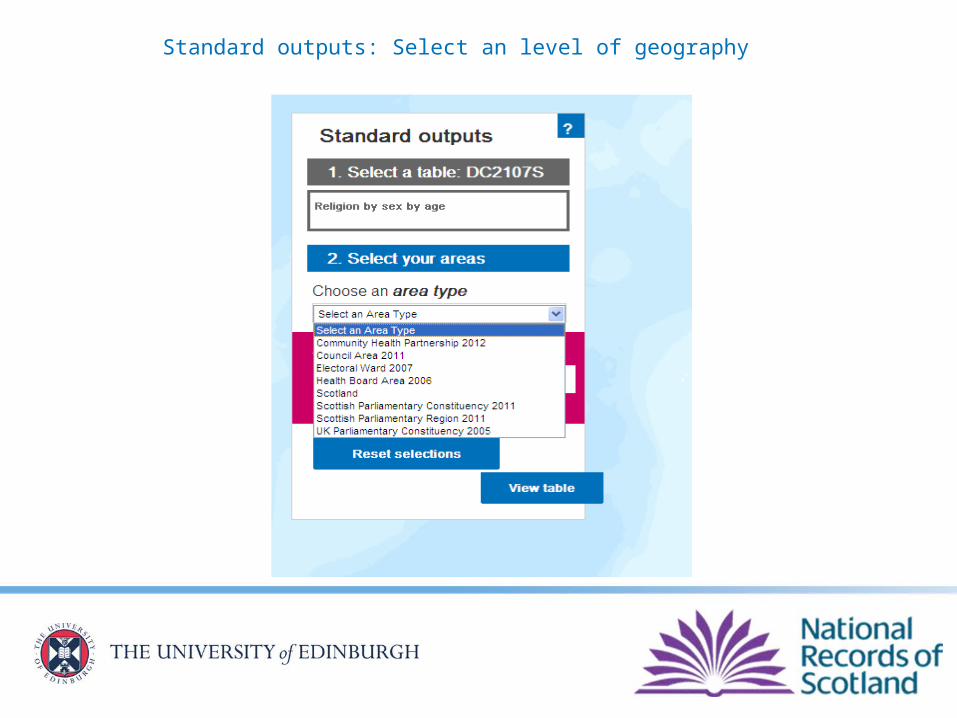
Standard outputs: Select an level of geography
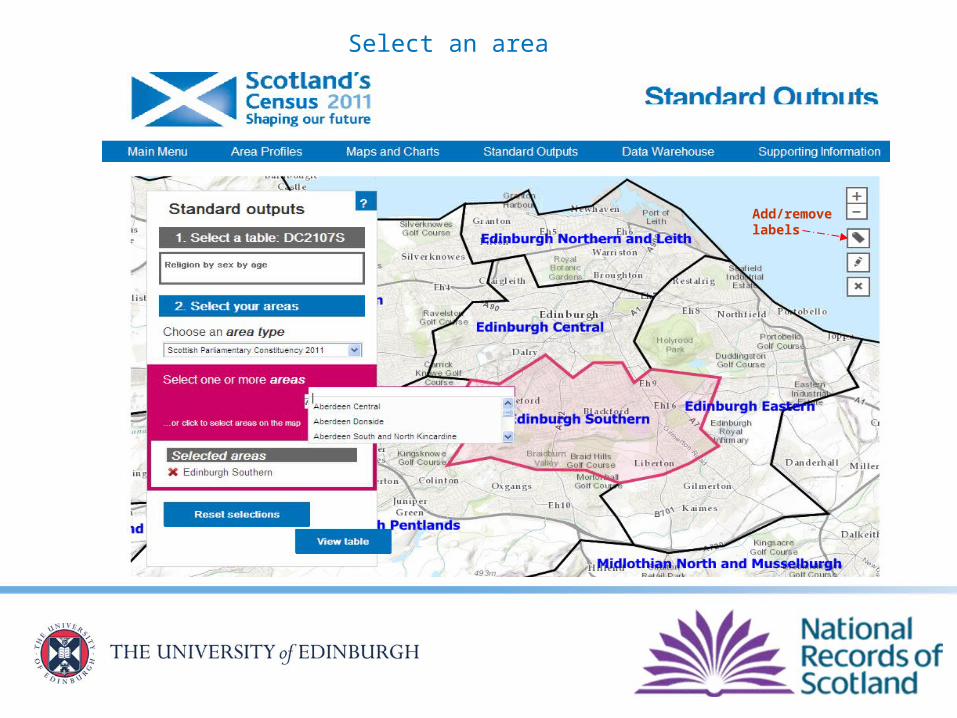
Select an area
Add/remove labels

Select area/s of interest and view or download data
Aim of Government Statistics
The primary aim of official statistics in Scotland is to provide an accurate and up-to-date picture of the economy and society. All official statistics produced by Scottish Government are freely available.
Most of the statistics produced are national statistics which mean that they are produced according to the Code of Practice for Official Statistics and meet with standards of integrity, accuracy, impartiality

Who produces statistics on Scotland
Learning
Health
Social care
Justice
Economy
Transport
Population & migration
Farming & fisheries
Census
Spending
Produced in Scotland Produced about Scotland
Labour market
Welfare
Tax
Economy
Higher education
The major Scottish social surveys
Cross Cutting: • Census • Scottish Household Survey (incorporates the Scottish House
Conditions Survey)
Business Area Specific:• Scottish Health Survey• Scottish Crime and Justice Survey• Growing Up in Scotland• GP Survey Scotland• The Scottish Survey of Literacy and Numeracy

UK Surveys with Scottish data
Cross Sectional • Labour Force Survey• Family Resources Survey• General Lifestyle Survey• Expenditure and Food in Scotland• Opinions Survey
Longtitudinal:• Millenium Cohort Study• Wealth and Assets Survey• Life Opportunities Survey
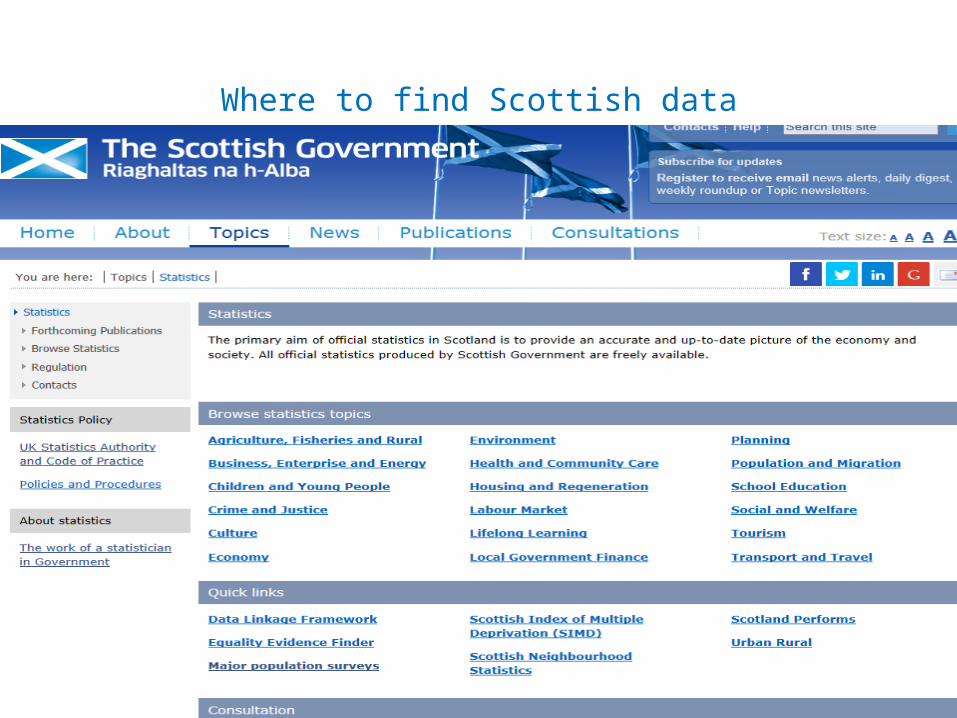
Where to find Scottish data
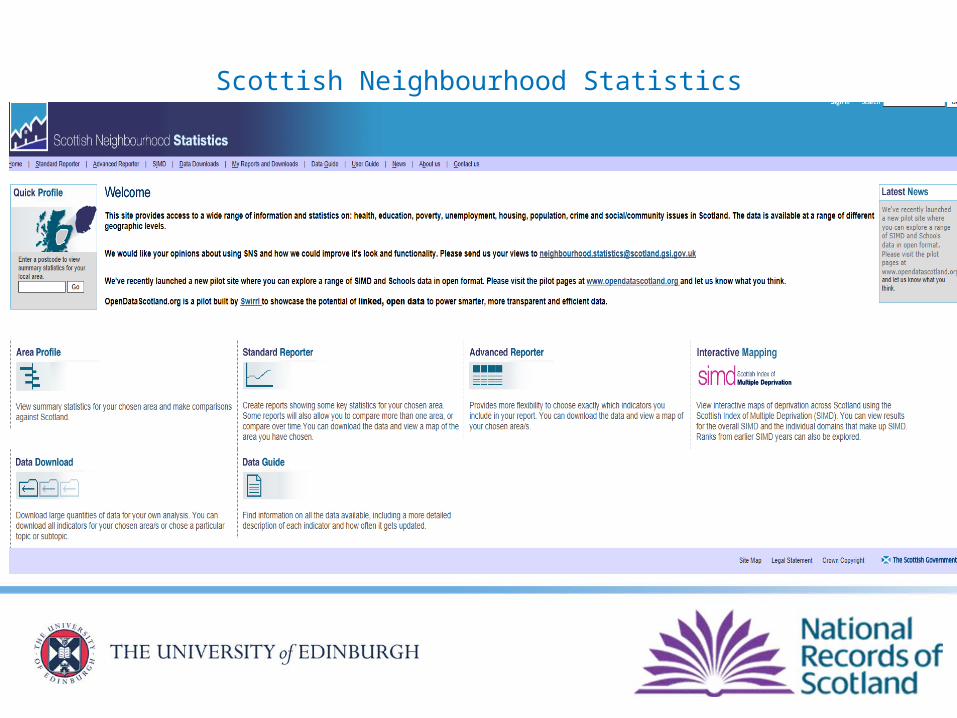
Scottish Neighbourhood Statistics

What type of data can you find?
HealthEducationPovertyUnemploymentHousingPopulationCrimeSocial/community

Scottish Index of Multiple DeprivationThe Scottish Index of Multiple Deprivation (SIMD) 2012 identifies small area concentrations of multiple deprivation across all of Scotland in a fair way.
SIMD 2012 is an update with improvements on the SIMD 2009 and uses the same geographical base (datazones) as previous versions of the SIMD.
The SIMD provides a relative measure of deprivation which means that the main output from SIMD - the SIMD ranks - can be used to compare data zones by providing a relative ranking from most deprived (rank 1) to least deprived (rank 6,505). The SIMD cannot be used to determine 'how much' more deprived one data zone is than another e.g. it is not possible to say that data zone X, ranked 50, is twice as deprived as data zone Y, ranked 100.
The SIMD can be used to identify Scotland's most deprived small areas on the overall index and each individual domain, commonly by applying a cut off such as 10%, 15% or 20%. The cut off should be informed by whether it aims to target areas with the very highest concentrations of deprivation or to be wider ranging.