introduction - meteo.fr · bhati and mohan iit delhi, india introduction role of land use/land...
TRANSCRIPT

Bhati and Mohan IIT Delhi, India
Introduction
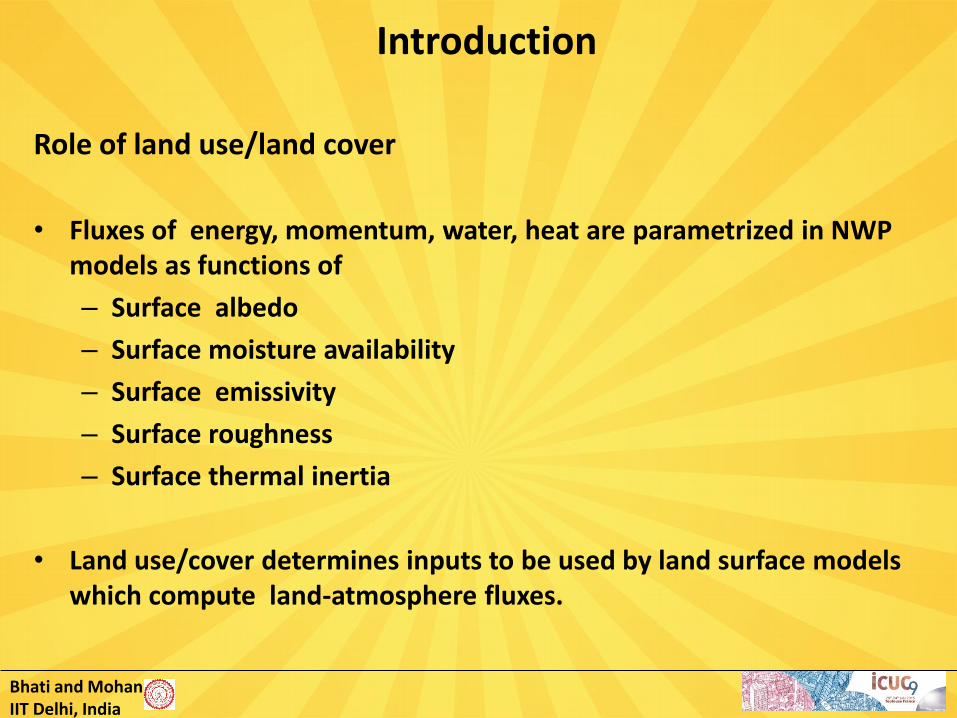
Role of land use/land cover
• Fluxes of energy, momentum, water, heat are parametrized in NWP models as functions of
– Surface albedo
– Surface moisture availability
– Surface emissivity
– Surface roughness
– Surface thermal inertia
• Land use/cover determines inputs to be used by land surface models which compute land-atmosphere fluxes.

Bhati and Mohan IIT Delhi, India
Introduction (contd..)
• The built-in USGS 24 category land-use data in WRF is based on AVHRR satellite data spanning April 1992 through March 1993 using a resolution of ~ 1 km (Schicker, 2011; Sertel et al, 2009).
• Major differences, specially in terms of urban land cover, have been observed in USGS data and present LULC.
• Present study is aimed at analyzing impact of change in input land cover on model outputs of surface parameters viz. near surface temperature, wind and relative humidity.
• MODIS IGBP is a 20 category land use data based on MODIS satellite data collected during years 2001-2005.
• Urban areas are more dominant in MODIS data.

Bhati and Mohan IIT Delhi, India
Study Area
• The city of National Capital Region of Delhi lies in the subtropical climate zone (Koppen classification: Cwa).
• Geologically, this region is bounded by the Indo-Gangetic alluvial plains in the North and East, by Thar Desert in the West and by old Aravalli hill ranges in the South. There is a ridge trending along NNE-SSW direction which constitutes a small area of Delhi’s terrain which is otherwise generally flat.
• Seasonally, the year can be divided into four main periods. Summer is experienced in the months of March–June followed by monsoon months of July, August, and September. Postmonsoon months are October and November while the period of December–February constitutes the winter season.
• The maximum temperature ranges from 41 to 45°C in peak summer season and the minimum temperature in winter season is in the range of 3–6°C in coldest period of Dec.-Jan.

Bhati and Mohan IIT Delhi, India
Delhi
Map Source: http://www.indiamapssite.com/

Bhati and Mohan IIT Delhi, India
Simulation Details
• Simulations over the study area of Delhi were carried out using WRF modeling system (v 3.5).
• Simulation Details
– Time Period: 24 May 2008 0000 UTC – 28 May 1800 UTC
– Analysis: 25 May 2008 0600 UTC – 28 May 1800 UTC
– No. of Domains: 3 ; Resolution: 18 km, 6km, 2km
• Physical Schemes (Ref: Mohan and Bhati, 2011, Adv Meteorol)
– Microphysics: Lin
– Pleim Xiu LSM
– ACM 2 Boundary Layer
– Kain Fritsch cumulus parametrisation

Bhati and Mohan IIT Delhi, India
Model Domains
Bhati and Mohan IIT Delhi, India
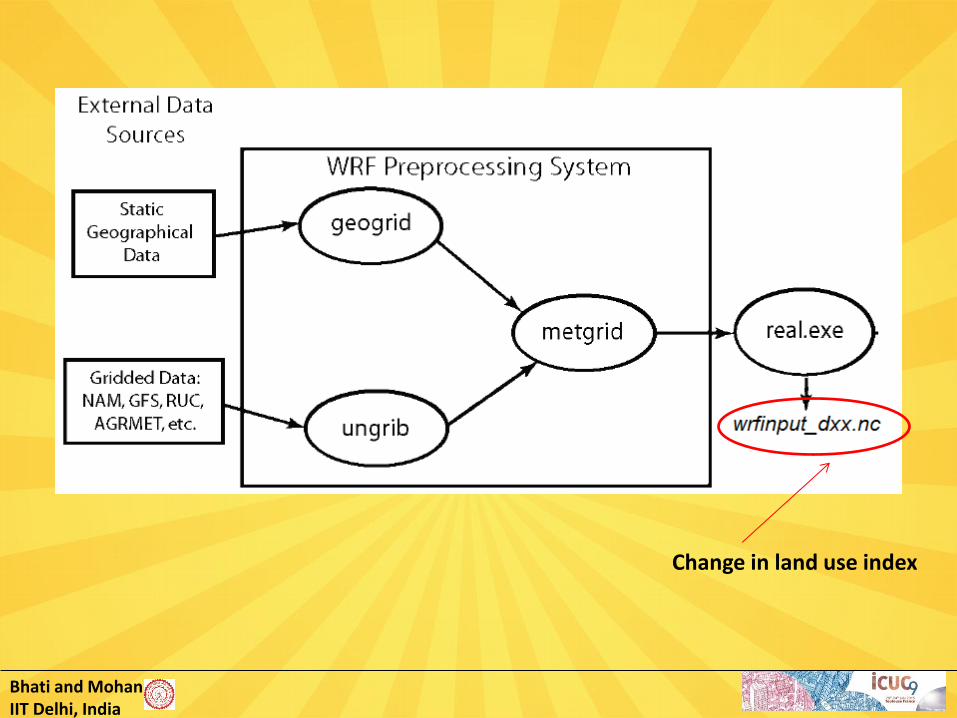
Change in land use index

Bhati and Mohan IIT Delhi, India
LULC Datasets
– USGS Land use data • generated by the United States Geological Survey's (USGS) National Center
for Earth Resources Observation and Science (EROS), the University of Nebraska-Lincoln (UNL) and the Joint Research Centre of the European Commission.
• Global land cover characteristics data base with a resolution of 1-km. • The data set is derived from 1-km Advanced Very High Resolution
Radiometer (AVHRR) data spanning a 12-month period (April 1992-March 1993) (http://edc2.usgs.gov/glcc/globdoc2_0.php).
• There are 24 categories of different land use in this dataset is the default land use dataset in WRF model. – MODIS–based land use data
• Derived from observations spanning a year input of Terra and Aqua data. • 20 land cover classes defined by the International Geosphere Biosphere
Programme (IGBP). • The dataset that comes with WRF (upto v3.5) is based on year 2001 (Ran et
al, 2012). • Recently, with WRF version 3.6 release, MODIS land use dataset is also
available at resolution of 15 sec (~ 500 m)

Bhati and Mohan IIT Delhi, India
– Modified-USGS land use data
• Major differences, especially in terms of urban land cover, have been observed in USGS data and present LULC.
• Though Modis land use data is comparatively more recent than USGS, it has been designed to couple with only Noah land surface model (LSM). Thus it has limitations in terms of compatibility with various land surface model schemes in WRF model while USGS land use data can be used with all LSM schemes.
• Hence in the present study, the USGS data set has been modified according to present land use scenario.
• The source of present land use data include surveys in field study campaigns carried out for urban heat island analysis in the study domain in May 2008 (Mohan et al, 2012) and March 2010 ( Mohan et al, 2013), classified satellite data (Mohan et al, 2011) and satellite data of the commercial mapping and GIS program, Google Earth.

USGS
Comparison of Satellite and USGS simulated Landuse/Landcover
USGS
#
# Mohan et al, 2011, J Env Prot

MODIS
Comparison of Satellite and MODIS simulated Landuse/Landcover

USGS-Modified
Comparison of Satellite and USGS simulated Landuse/Landcover
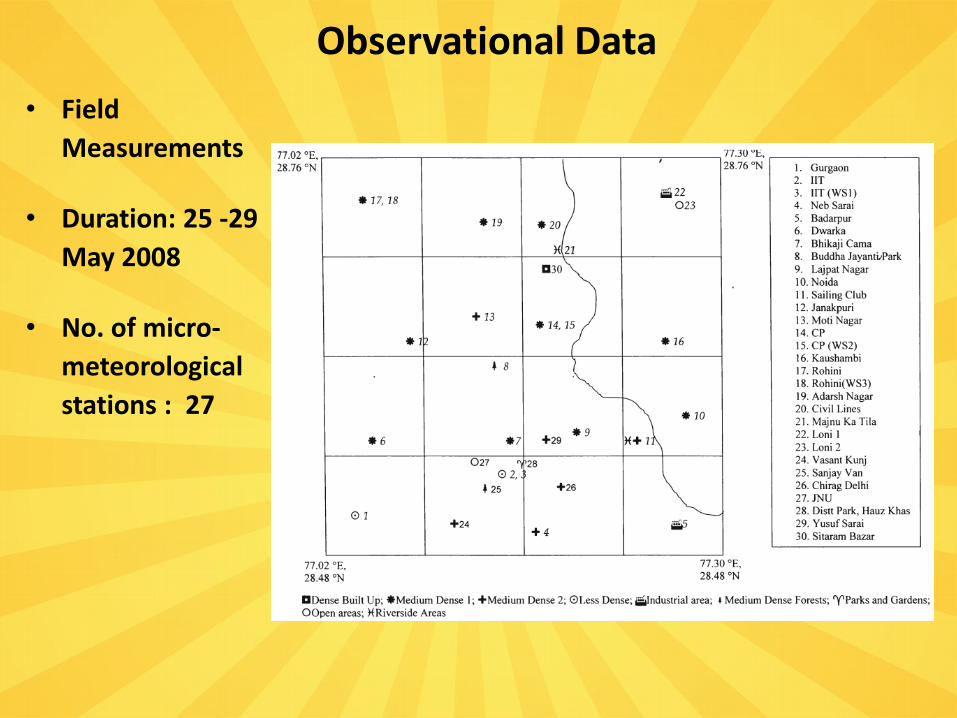
Observational Data
• Field
Measurements
• Duration: 25 -29
May 2008
• No. of micro-
meteorological
stations : 27

Station–wise statistics for near surface temperature (Stations highlighted in grey color have different LULC from original USGS/MODIS dataset)
Bhati and Mohan IIT Delhi, India
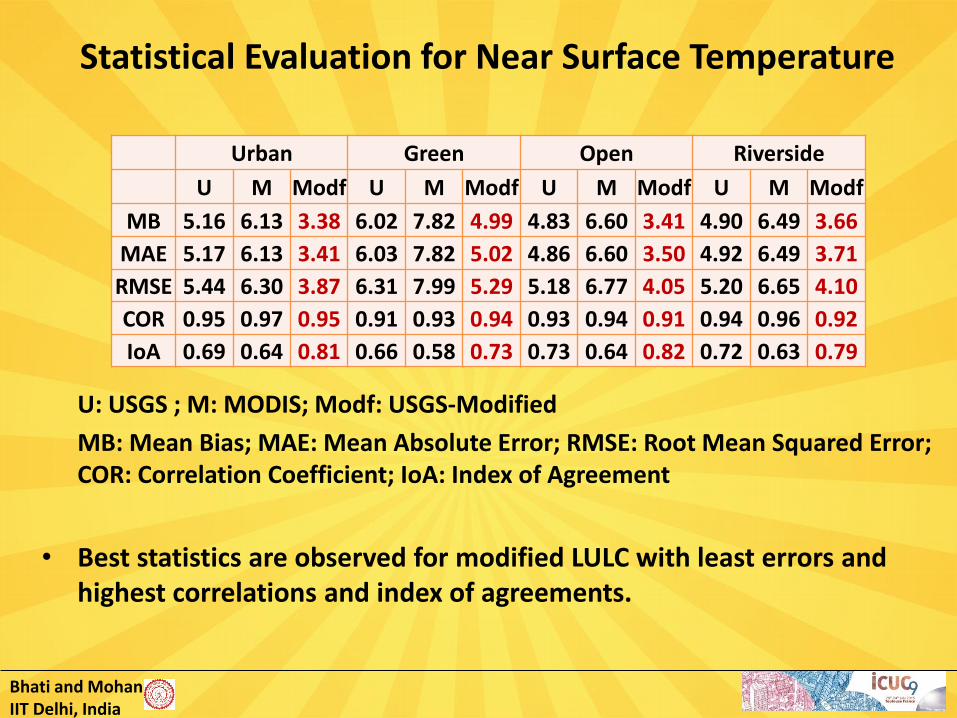
Statistical Evaluation for Near Surface Temperature
U: USGS ; M: MODIS; Modf: USGS-Modified
MB: Mean Bias; MAE: Mean Absolute Error; RMSE: Root Mean Squared Error; COR: Correlation Coefficient; IoA: Index of Agreement
• Best statistics are observed for modified LULC with least errors and highest correlations and index of agreements.
Urban Green Open Riverside
U M Modf U M Modf U M Modf U M Modf
MB 5.16 6.13 3.38 6.02 7.82 4.99 4.83 6.60 3.41 4.90 6.49 3.66
MAE 5.17 6.13 3.41 6.03 7.82 5.02 4.86 6.60 3.50 4.92 6.49 3.71
RMSE 5.44 6.30 3.87 6.31 7.99 5.29 5.18 6.77 4.05 5.20 6.65 4.10
COR 0.95 0.97 0.95 0.91 0.93 0.94 0.93 0.94 0.91 0.94 0.96 0.92
IoA 0.69 0.64 0.81 0.66 0.58 0.73 0.73 0.64 0.82 0.72 0.63 0.79

Station–wise statistics for near surface relative humidity (Stations highlighted in grey color have different LULC from original USGS/MODIS dataset)

Bhati and Mohan IIT Delhi, India
Statistical Evaluation for Near Surface Relative Humidity
Urban Green Open River
U M Modf U M Modf U M Modf U M Modf
ME -24.10 -28.49 -22.28 -29.16 -33.32 -27.35 -31.71 -36.10 -30.86 -30.31 -34.85 -29.56
MAE 24.12 28.68 22.30 29.26 33.39 27.58 31.88 36.10 30.21 31.56 34.85 30.32
RMSE 25.88 32.87 22.98 30.64 38.21 29.96 33.12 39.80 31.29 31.79 38.15 30.06
COR 0.78 0.17 0.78 0.79 0.15 0.81 0.79 0.28 0.79 0.77 0.27 0.78
IoA 0.56 0.40 0.61 0.54 0.40 0.59 0.52 0.40 0.62 0.49 0.38 0.52
U: USGS ; M: MODIS; Modf: USGS-Modified
MB: Mean Bias; MAE: Mean Absolute Error; RMSE: Root Mean Squared Error; COR: Correlation Coefficient; IoA: Index of Agreement
• As in case of temperature, best statistics are observed for modified LULC with least errors and highest correlations and index of agreements.
Bhati and Mohan IIT Delhi, India
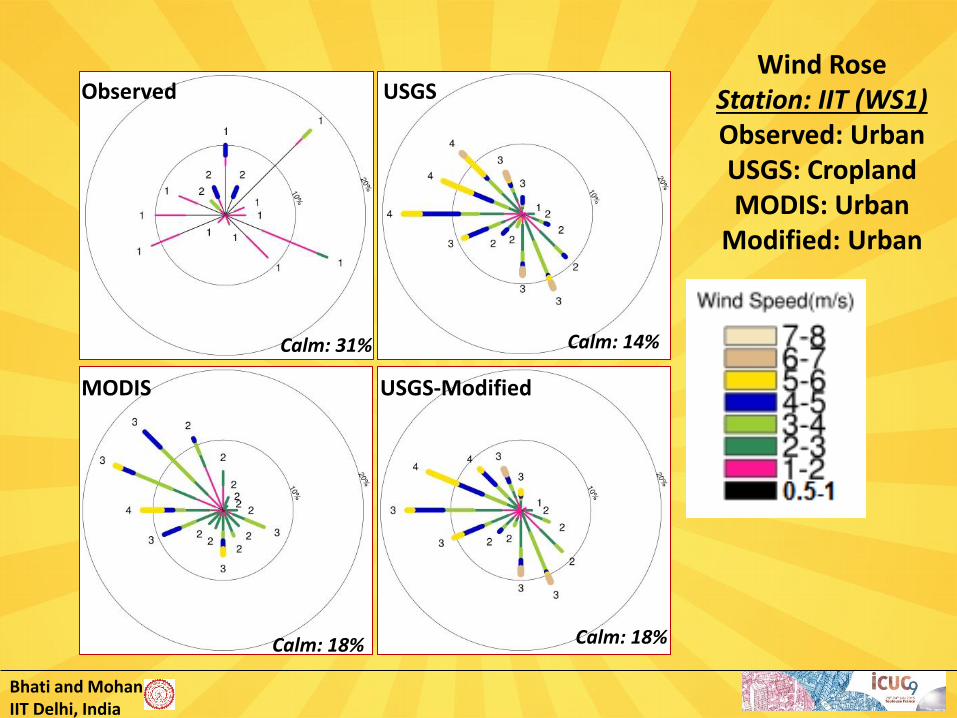
Wind Rose Station: IIT (WS1) Observed: Urban USGS: Cropland MODIS: Urban
Modified: Urban
Observed USGS
MODIS USGS-Modified
Calm: 31% Calm: 14%
Calm: 18% Calm: 18%
Bhati and Mohan IIT Delhi, India
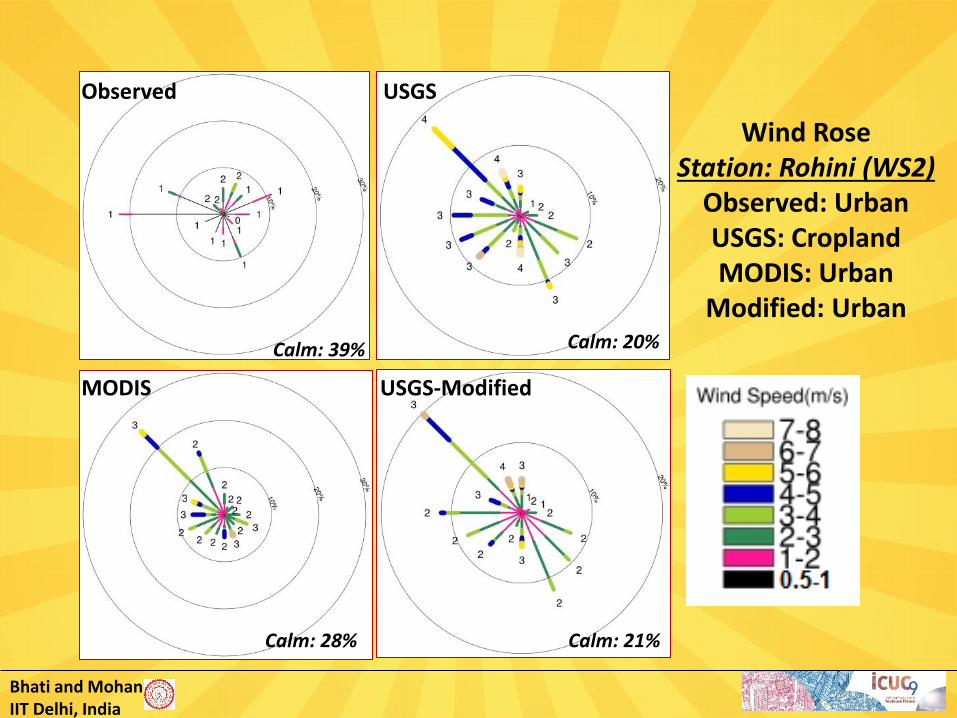
Wind Rose Station: Rohini (WS2)
Observed: Urban USGS: Cropland MODIS: Urban
Modified: Urban
Observed USGS
MODIS USGS-Modified
Calm: 28% Calm: 21%
Calm: 39% Calm: 20%

Bhati and Mohan IIT Delhi, India
Comparison of Wind Flow
• Surface roughness length associated with MODIS land use is higher leading to more surface drag (Anantharaj et al, 2010). This accounts for lower wind speeds in MODIS simulation.
• LULC has not found to have any impact on wind directions.
• All simulations, however, overestimate wind speeds as compared to observed speeds.

Bhati and Mohan IIT Delhi, India
UHI
Distribution of daytime near surface temperature (T2m) ,
A. Simulation with USGS LULC (UHI max= 2.8°C)
B. Simulation with modified LULC (UHI max= 4.9°C)
C. Observed (UHI max= 5.7°C)
A.USGS B. Modified-USGS
C. Observed
35.0 °C
42.0 °C
Bhati and Mohan IIT Delhi, India
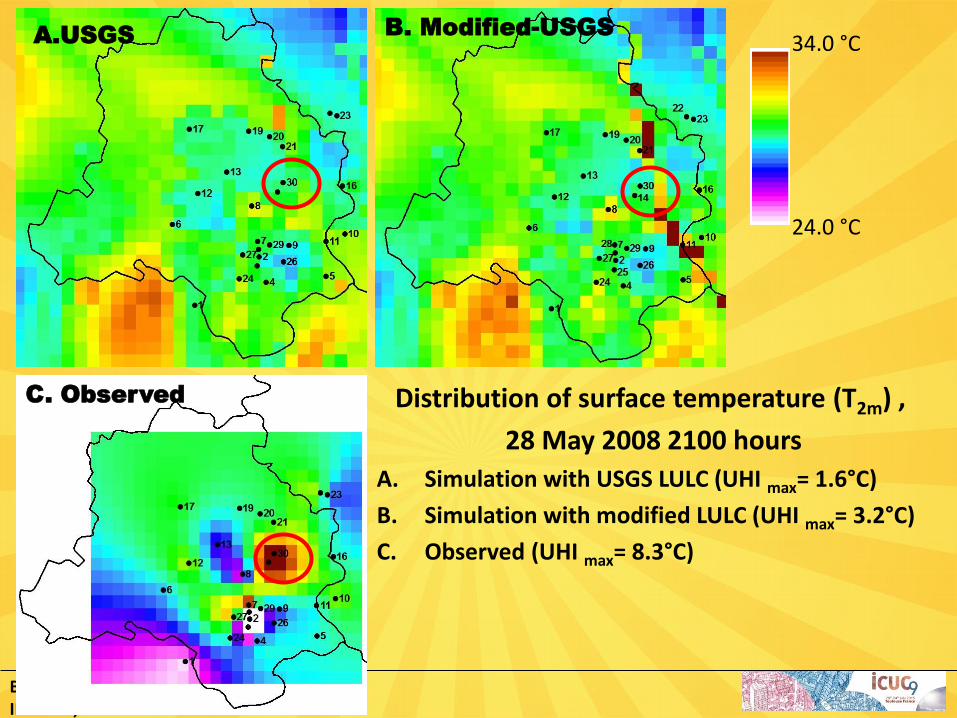
Distribution of surface temperature (T2m) ,
28 May 2008 2100 hours
A. Simulation with USGS LULC (UHI max= 1.6°C)
B. Simulation with modified LULC (UHI max= 3.2°C)
C. Observed (UHI max= 8.3°C)
24.0 °C
34.0 °C A.USGS B. Modified-USGS
C. Observed

Bhati and Mohan IIT Delhi, India
Distribution of Land Surface Temperature
28 May 2008 Daytime (1100 hours)
A. Simulation with USGS LULC (UHI max= 5.1°C )
B. Simulation with modified LULC (UHI max= 8.2°C)
C. MODIS (UHI max= 7.9°C)
27.0 °C
43.0 °C
A.USGS B. Modified-USGS
C. Observed

Bhati and Mohan IIT Delhi, India
Distribution of Land Surface Temperature
28 May 2008 Night-time (2230 hours)
A. Simulation with USGS LULC (UHI max= 2.4°C )
B. Simulation with modified LULC (UHI max= 5.6°C)
C. MODIS (UHI max= 4.8°C)
C
22.0 °C
30.0 °C A.USGS B. Modified-USGS
C. Observed

Bhati and Mohan IIT Delhi, India
Discussions
• UHI intensity obtained based on simulated T2m is closer to observed UHI with modification in LULC during daytime. Temperature hotspots are also captured well.
• However, there is not much improvement in overall UHI intensity for night-time with LULC changes.
• For LST, there is marked improvement in both daytime and nighttime UHI intensity with reference to satellite LST data. However, there is poor correlation between temperature hotspots for both daytime and night-time.
• Observed temperatures are influenced by urban canopy effects which are not yet captured by model. Urban canopy effects are more prevalent during night-time which could be the reason for poor performance during night-time.


Bhati and Mohan IIT Delhi, India
Relative Heat Island Intensity
• Relative Heat Island Intensity is defined as
ΔTrel(x,y)=(ΔT(x,y))/D
– where ΔTrel(x,y) is relative HI of a point x,y in a domain and is estimated by dividing heat island intensity at that point with a standardizing factor D.
– D is the maximum of absolute values of ΔT of all points (xi,yi) in the given domain.
• By using relative heat island intensity, a uniform scale of -1 to +1 can be applied to the spatial distribution. A negative value of relative UHI implies cool islands.

Bhati and Mohan IIT Delhi, India
Spatial Distribution of UHI: Nighttime
Max UHI
Observed: 4.9°C
USGS: 3.1°C
MODIS: 2.8°C
USGS-Modified: 3.6°C
Observed USGS
USGS-Modified
Relative UHI
Bhati and Mohan IIT Delhi, India
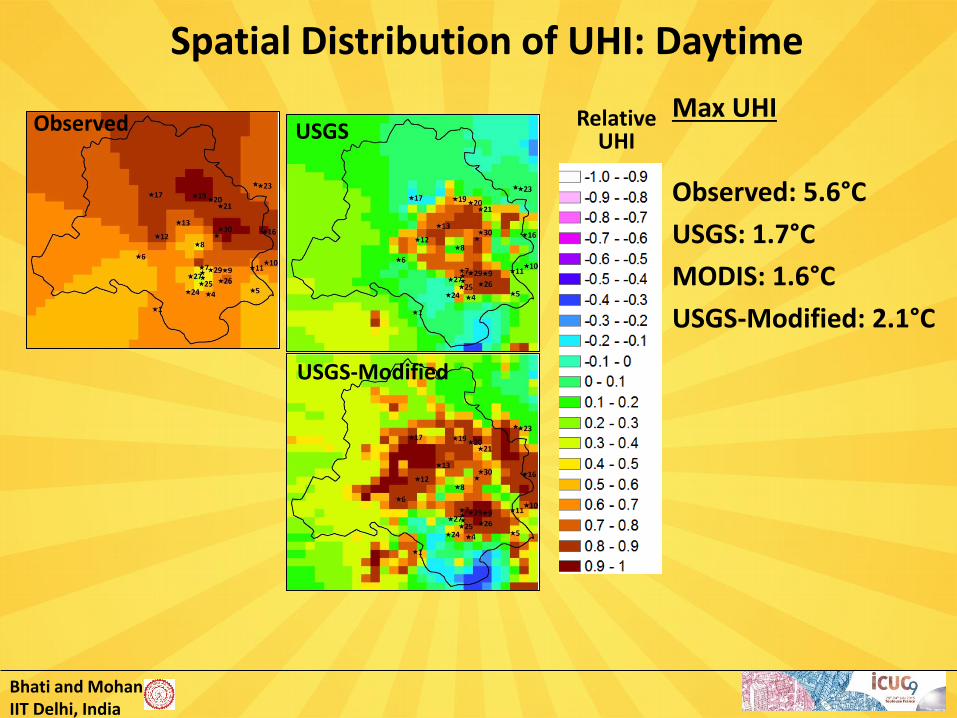
Spatial Distribution of UHI: Daytime
Max UHI
Observed: 5.6°C
USGS: 1.7°C
MODIS: 1.6°C
USGS-Modified: 2.1°C
Observed USGS
USGS-Modified
Relative UHI

Bhati and Mohan IIT Delhi, India
Discussions
• UHI intensity obtained based on simulated T2m is closer to observed UHI with modification in LULC during daytime. Temperature hotspots are also captured well.
• However, there is not much improvement in overall UHI intensity for night-time with LULC changes.
• Observed temperatures are influenced by urban canopy effects which are not yet switched on in the model. Urban canopy effects are more prevalent during night-time which could be the reason for poor performance during night-time.

Bhati and Mohan IIT Delhi, India
Conclusions
• Impact of change in LULC on WRF model performance has been analyzed for Delhi city.
• Surface temperature and relative humidity are better estimated by simulation using modified LULC in accordance with ground truth.
• Significant improvement is seen in stations which have different LULC from the original dataset.
• UHI is better estimated during daytime as compared to nightime which could probably be due to absence of urban geometry in the model.

Bhati and Mohan IIT Delhi, India
Solar Radiation
• Changes in LULC has not been found to downward solar radiation. This could be because radiation received is also a function of urban geometry which is not included in model at present.