introduction john boyce (2v) – from san jose, ca air sailing nut / devotee / disciple cfig...
TRANSCRIPT
Introduction
• John Boyce (2V) – From San Jose, CA
• Air Sailing Nut / Devotee / Disciple
• CFIG #2195961
• Retired Meteorologist: Jay Sumpter
2
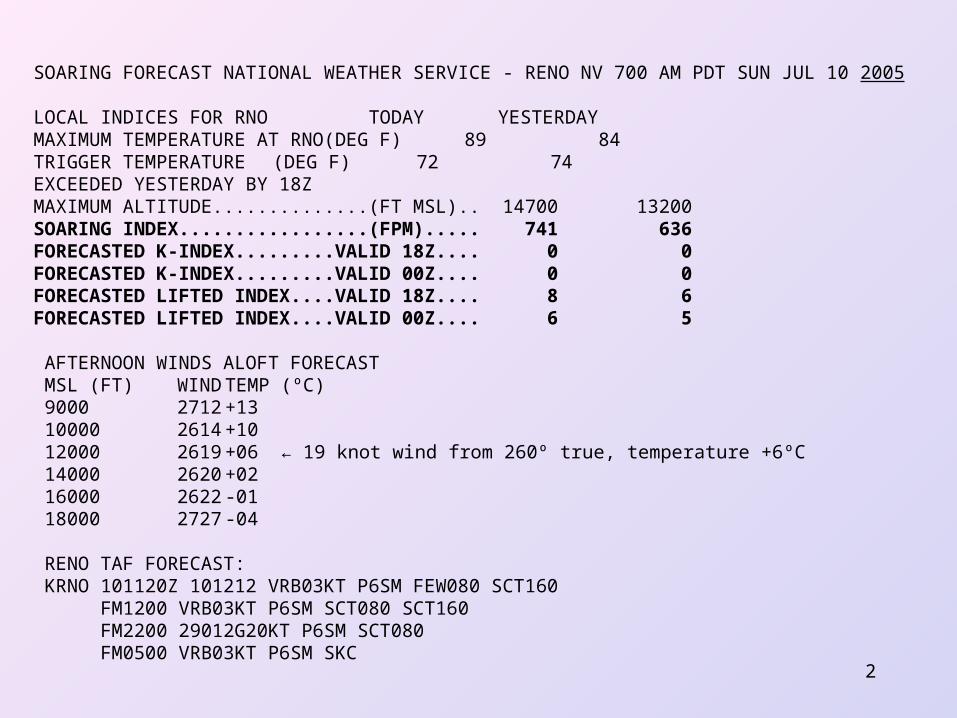
SOARING FORECAST NATIONAL WEATHER SERVICE - RENO NV 700 AM PDT SUN JUL 10 2005 LOCAL INDICES FOR RNO TODAY YESTERDAYMAXIMUM TEMPERATURE AT RNO(DEG F) 89 84TRIGGER TEMPERATURE (DEG F) 72 74EXCEEDED YESTERDAY BY 18ZMAXIMUM ALTITUDE..............(FT MSL).. 14700 13200SOARING INDEX.................(FPM)..... 741 636FORECASTED K-INDEX.........VALID 18Z.... 0 0FORECASTED K-INDEX.........VALID 00Z.... 0 0FORECASTED LIFTED INDEX....VALID 18Z.... 8 6FORECASTED LIFTED INDEX....VALID 00Z.... 6 5 AFTERNOON WINDS ALOFT FORECAST MSL (FT) WIND TEMP (ºC) 9000 2712 +13 10000 2614 +10 12000 2619 +06 ← 19 knot wind from 260º true, temperature +6ºC 14000 2620 +02 16000 2622 -01 18000 2727 -04 RENO TAF FORECAST: KRNO 101120Z 101212 VRB03KT P6SM FEW080 SCT160 FM1200 VRB03KT P6SM SCT080 SCT160 FM2200 29012G20KT P6SM SCT080 FM0500 VRB03KT P6SM SKC
3
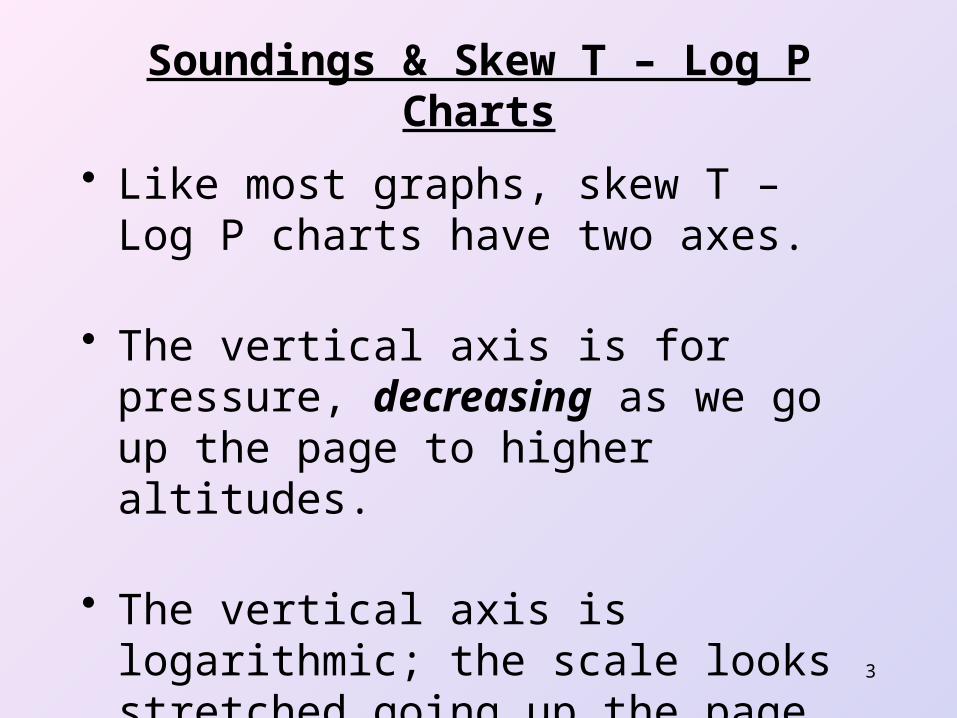
Soundings & Skew T – Log P Charts
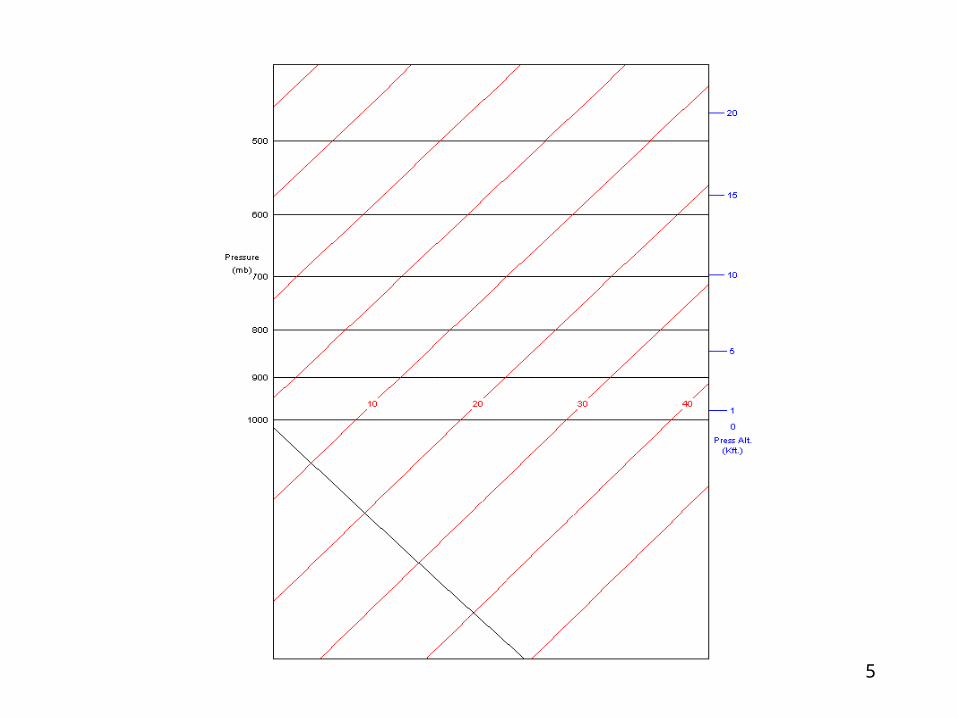
• Like most graphs, skew T – Log P charts have two axes.
• The vertical axis is for pressure, decreasing as we go up the page to higher altitudes.
• The vertical axis is logarithmic; the scale looks stretched going up the page.
4
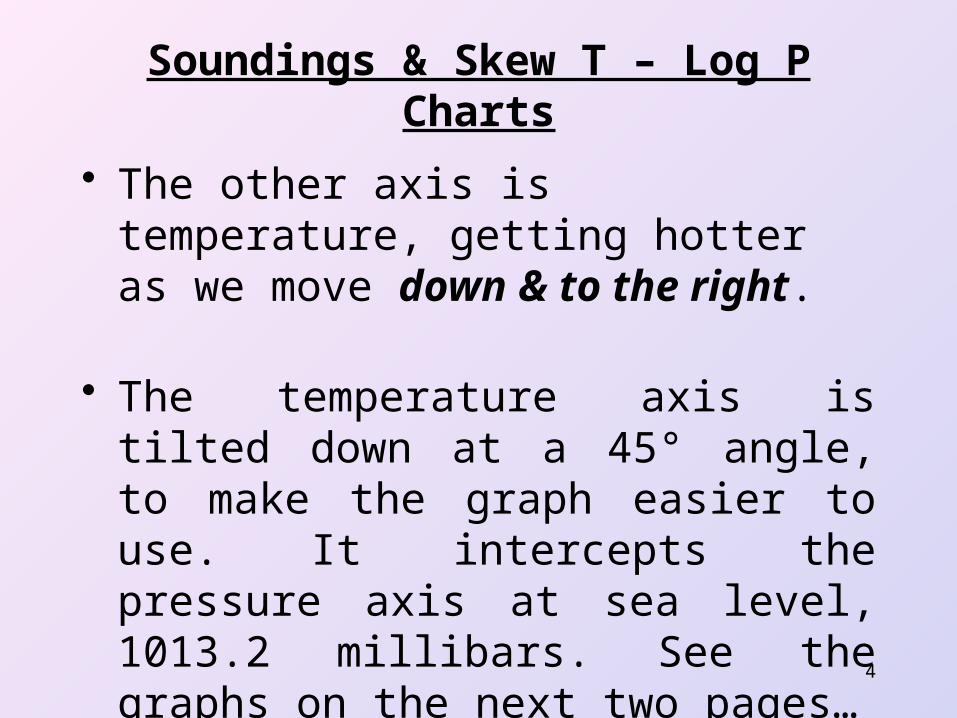
Soundings & Skew T – Log P Charts
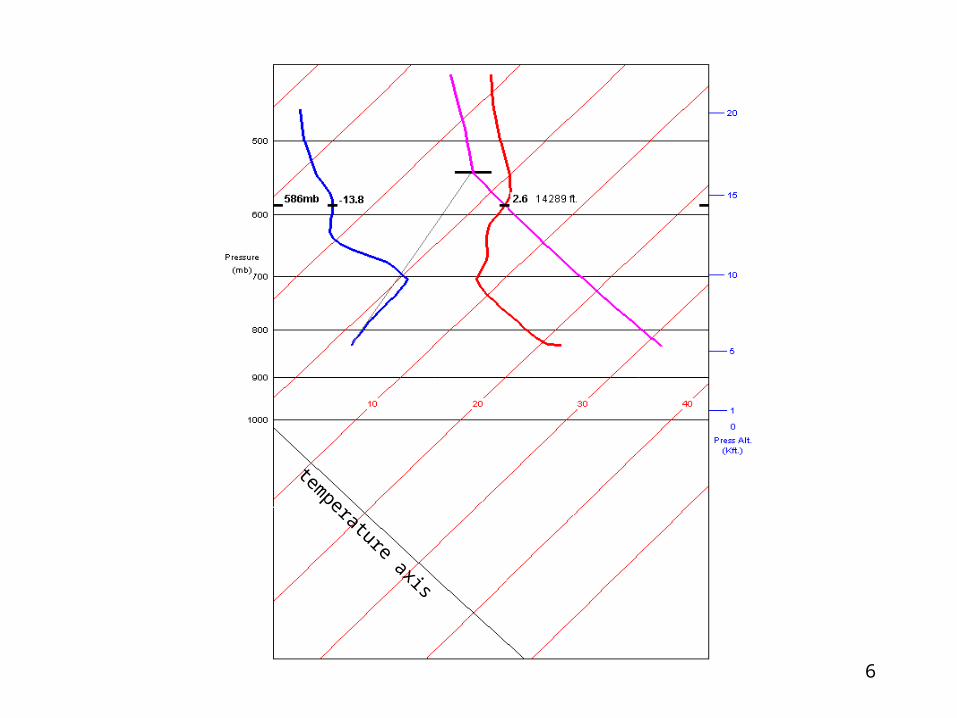
• The other axis is temperature, getting hotter as we move down & to the right.
• The temperature axis is tilted down at a 45° angle, to make the graph easier to use. It intercepts the pressure axis at sea level, 1013.2 millibars. See the graphs on the next two pages…
5
6
temperature axis
7
Soundings & Skew T – Log P Charts
• A sounding is air temperature & dew point versus pressure, and therefore versus pressure altitude. Data are obtained from instruments carried aloft by weather balloons.
• With today’s advanced technology, soundings can be forecast as well as measured directly.
8
Soundings & Skew T – Log P Charts
• The soundings in this presentation are forecasts, from NOAA’s Earth Systems Research Lab:
www-frd.fsl.noaa.gov/mab/soundings/java/
9
Soundings & Skew T – Log P Charts
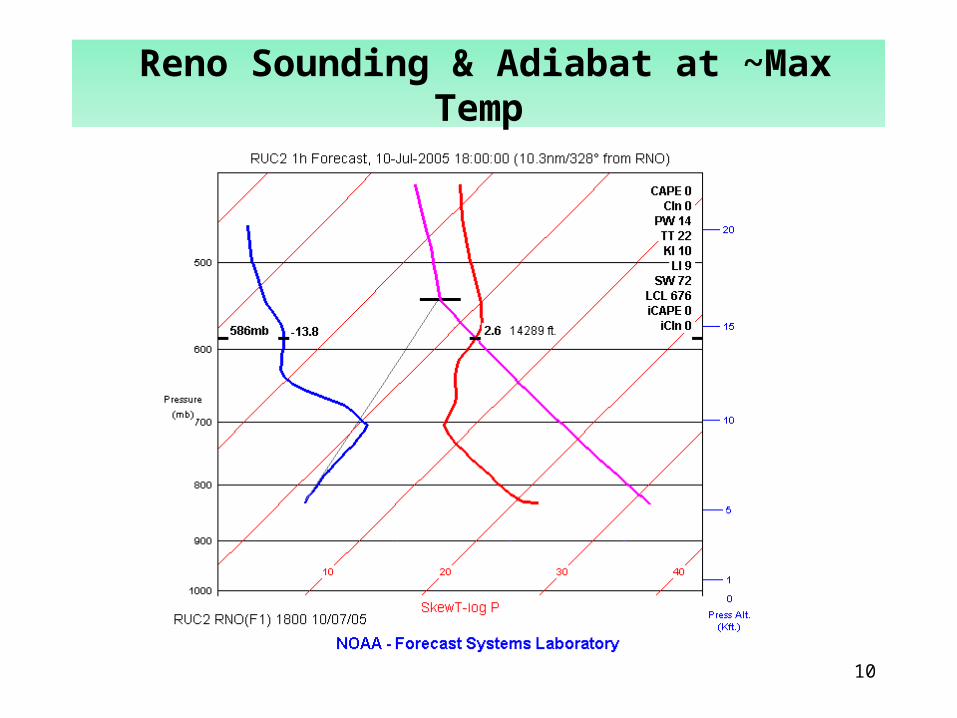
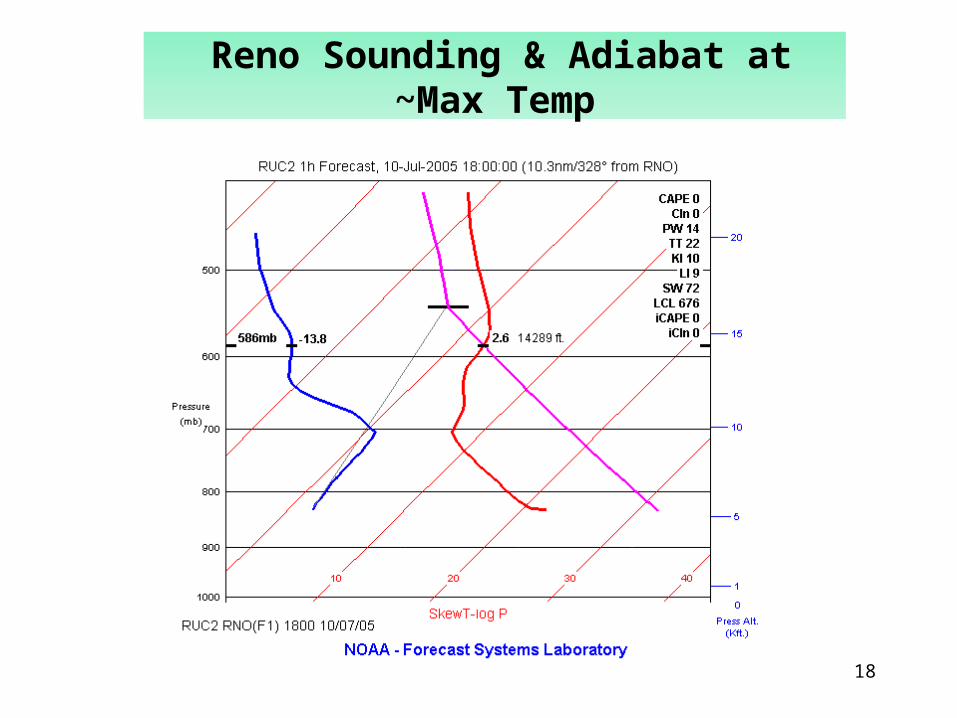
• Temperature data are plotted versus pressure on Skew T – Log P charts
• The thick red line is the temperature of the air.
• The thick blue line is the dew point of the air.
• The thick pink line is an adiabat, constructed by the meteorologist.
10
Reno Sounding & Adiabat at ~Max Temp
11
Skew T – Log P Charts: The Gory Details
• The thin red and black lines allow us to plot temperature versus pressure.
• The diagonal blue lines are called dry adiabats.
• The orange lines are called wet adiabats.
12
Skew T – Log P Charts: The Gory Details
• As parcels of air move up (lift) and down (sink) in the atmosphere, their temperatures and pressures follow the adiabats.
13
Skew T – Log P Charts: The Gory Details
• As parcels of air rise and fall, we assume that they do not share energy with the surroundings. We assume that they are well-insulated.
• We start with a parcel of air near the ground, using the prevailing temperature and dew point.
14
Skew T – Log P Charts: The Gory Details
• When the air parcel (thermal) launches from the ground, its temperature first follows a dry adiabat. It cools off as it rises to lower pressures and higher altitudes.
15
Skew T – Log P Charts: The Gory Details
• If the parcel cools off enough to reach its dew point, a cloud forms. The parcel usually keeps going up into the cloud.
• The parcel’s temperature now follows a wet adiabat; it continues to cools off, but more slowly because heat of condensation is now being liberated.
16
Skew T – Log P Charts: The Gory Details
• What about the gray lines? These are lines of constant moisture content, and they tell us about the dew point of an air parcel as it rises.
• The parcel’s dew point follows the gray lines.
• Note that these lines do not make a right angle with the temperature axis. They are tilted a little.
17
Skew T – Log P Charts: The Gory Details
• As an air parcel rises, its dew point goes down, even though its absolute humidity has not changed. Dew point depends on pressure, and therefore on altitude.
• Dew point also depends on water content.
• We want to know the parcel’s dew point at altitude, so that clouds can be predicted.
18
Reno Sounding & Adiabat at ~Max Temp
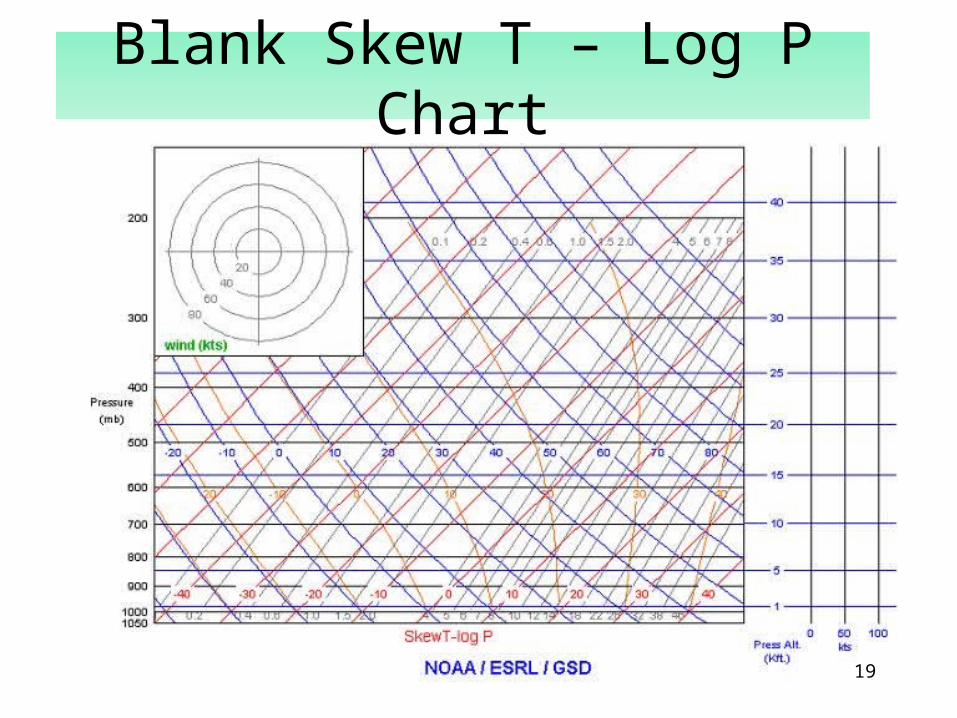
Blank Skew T – Log P Chart
19
How High Will the Parcel Rise??Will a Cloud Form at the Top??
• Our fearless parcel of air continues to rise as long as it is warmer than the surrounding air. As soon as its temperature is the same as the surroundings, the parcel is no longer buoyant and will rise no further.
20
How High Will the Parcel Rise??Will a Cloud Form at the Top??
• If our parcel has cooled off enough to reach its dew point, the water vapor it contains condenses out and forms a cloud. If the parcel is still warmer than the surroundings, it will keep rising, up into the cloud
21
How High Will the Parcel Rise??Will a Cloud Form at the Top??
• If our parcel reaches the temperature of the surroundings before it reaches its dew point, it can’t rise any farther.
• Since the parcel can’t rise any further, it can’t cool off any more. No condensation will occur, no cloud will form, and we have a blue day.
22
Why the Big Mess?
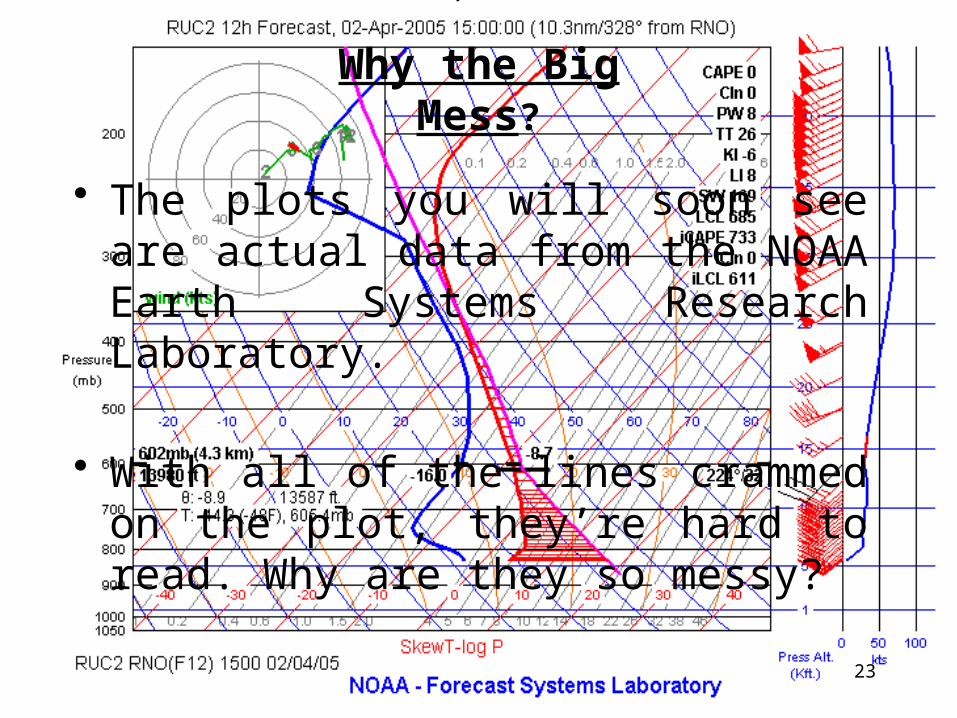
• The plots you will soon see are actual data from the NOAA Earth Systems Research Laboratory.
• With all of the lines crammed on the plot, they’re hard to read. Why are they so messy?
23
Why the Big Mess?
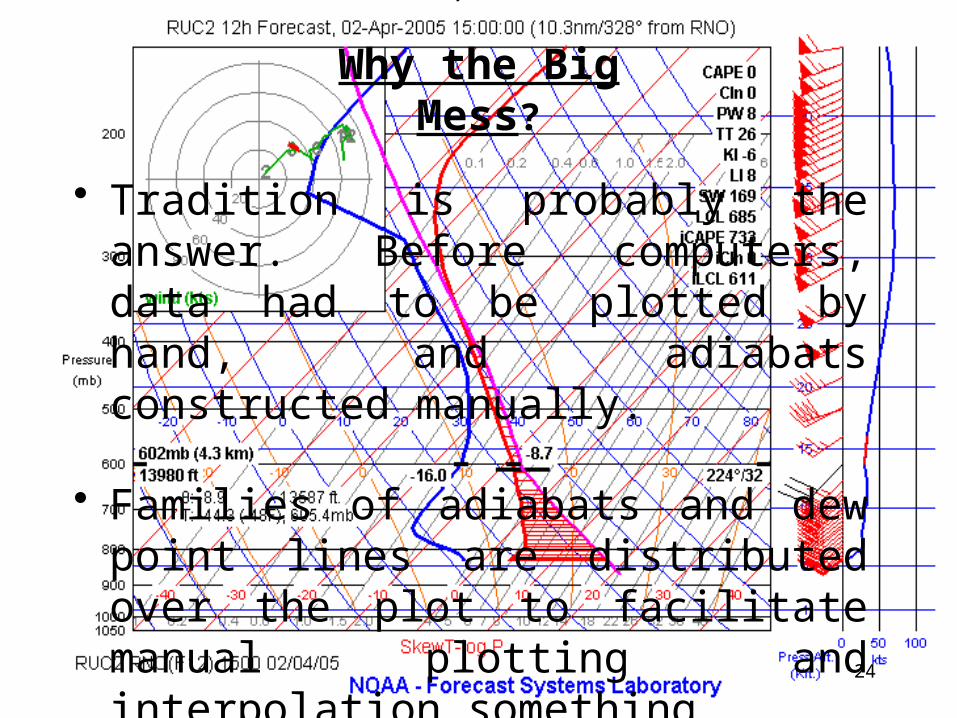
• Tradition is probably the answer. Before computers, data had to be plotted by hand, and adiabats constructed manually.
• Families of adiabats and dew point lines are distributed over the plot to facilitate manual plotting and interpolation…something that’s not necessary any more.
24
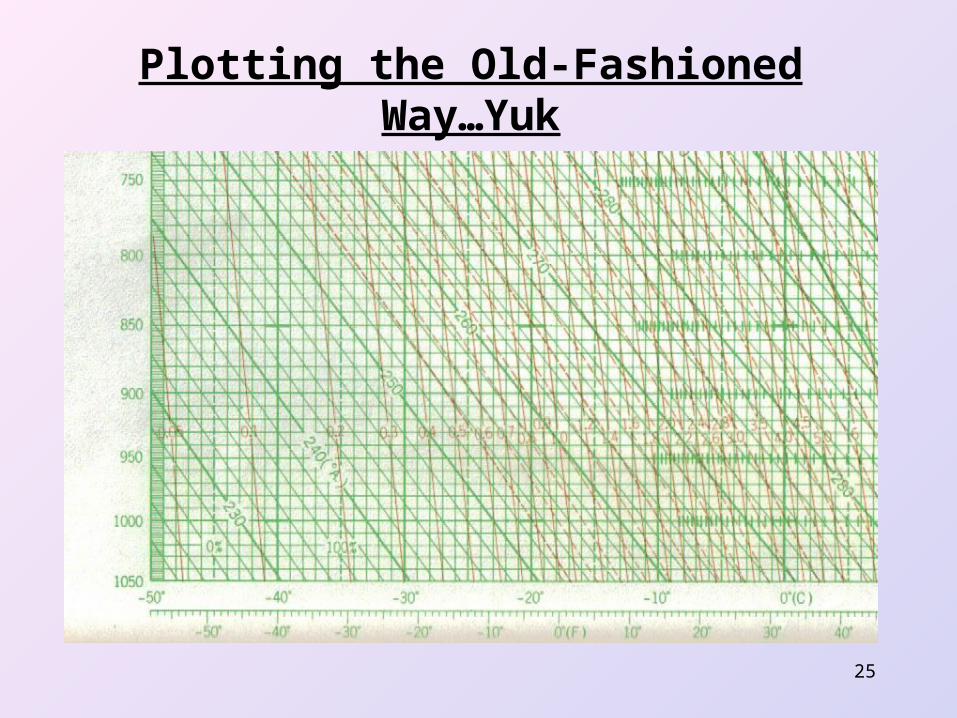
Plotting the Old-Fashioned Way…Yuk
25
26
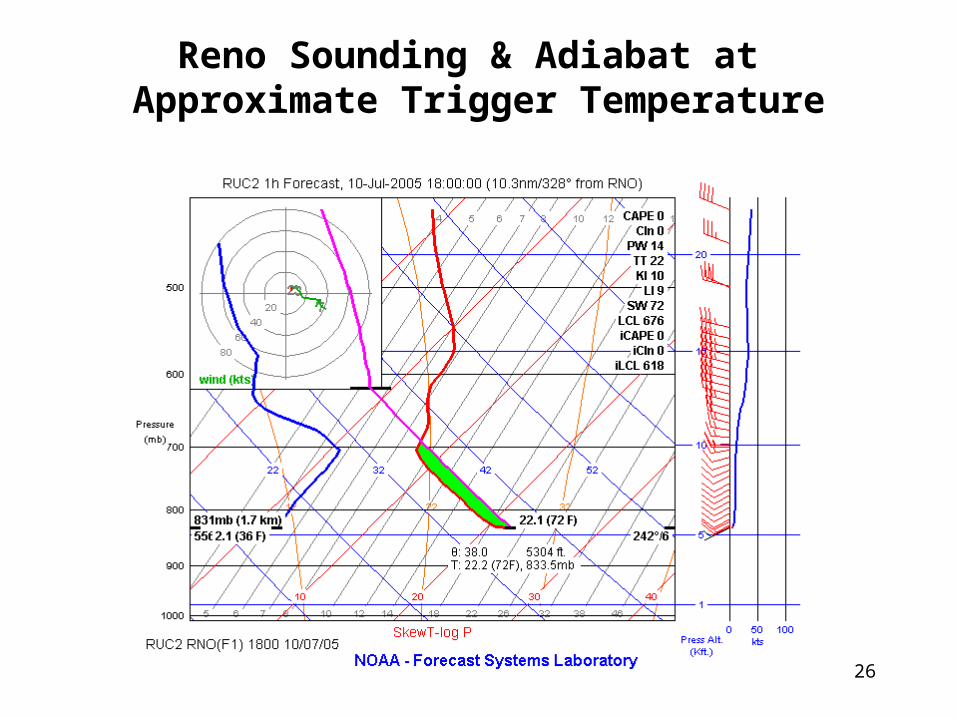
Reno Sounding & Adiabat at Approximate Trigger Temperature
27
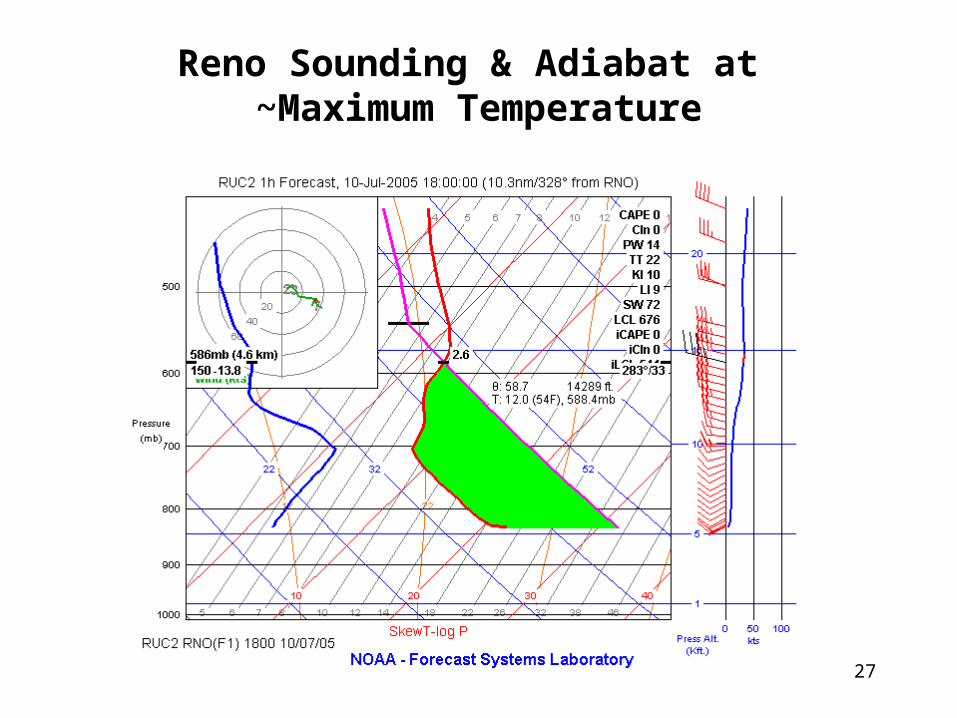
Reno Sounding & Adiabat at ~Maximum Temperature
28
The Lifted Index – A Measure of Atmospheric Stability
• A parcel of air not too far from the ground is “lifted” along an adiabat on the Skew – T chart to 18,000 MSL
• Since the parcel of air is being lifted to lower pressure, it expands and cools down.
• We assume that as the parcel of air rises, it does not share energy with the surroundings
29
The Lifted Index – A Measure of Atmospheric Stability
• The temperature of the lifted parcel is compared to the surroundings at 18,000 MSL.
• If the parcel is warmer than the surroundings, the LI is < 0 and we are pleased.
• If the parcel is cooler than the surroundings, the LI is > 0 but we might not be unhappy.
• Lifted Index = surrounding temp @ 500 mb minus lifted parcel temp @ 500 mb.
30
The Lifted Index – A Measure of Atmospheric Stability
• A rule of thumb for soaring:LI > 2 could mean marginal to poor soaring-2 LI +2 is supposedly idealLI < -2 could mean overdevelopment
• A rule of thumb for atomoshperic stability:LI > 0 means stable-4 LI 0 means marginally unstableLI < -8 means a very unstable
31
The Lifted Index – A Measure of Atmospheric Stability
• A stable atmosphere doesn’t necessarily mean that we can’t soar, especially here at Air Sailing.
• The lifted index has the units of temperature, and is calculated with dry temperatures only. No dew points are used.
32
The K Index – The Potential for Convection & Thunderstorms
• To obtain the K Index:
- start with the air temperature at 850 mb (~4500 feet MSL)
- subtract off the air temperature at 500 mb (~18,000 MSL)
- add the dew point of the air at 850 mb - subtract the temperature of the air at 700 mb
(~9800 MSL) - add the dew point of the air at 700 mb
33
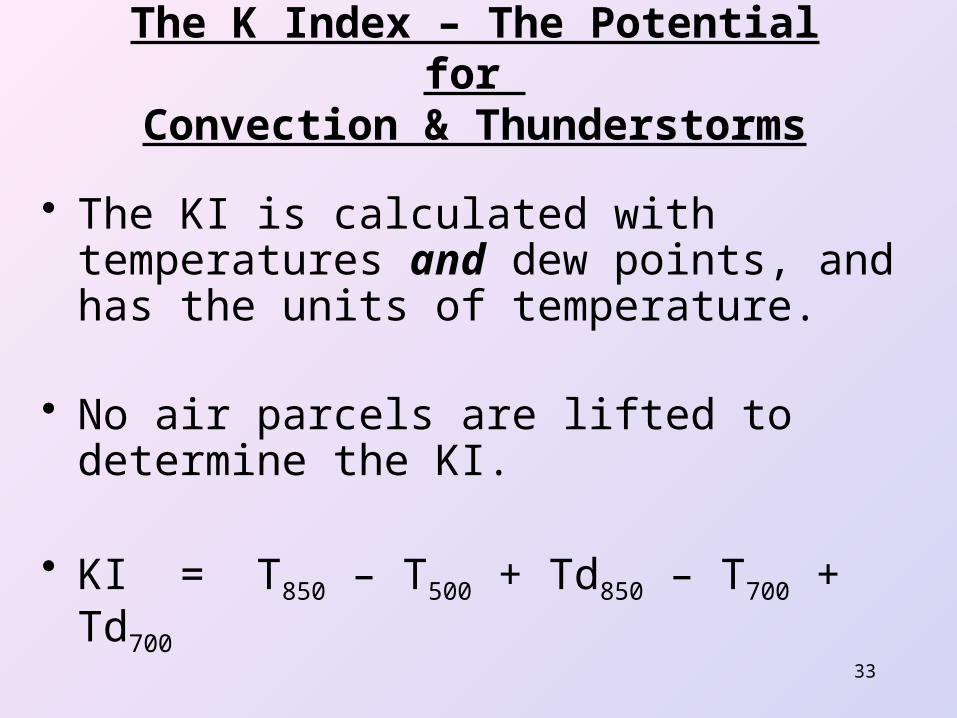
The K Index – The Potential for Convection & Thunderstorms
• The KI is calculated with temperatures and dew points, and has the units of temperature.
• No air parcels are lifted to determine the KI.
• KI = T850 – T500 + Td850 – T700 + Td700
34
The K Index – The Potential for Convection & Thunderstorms
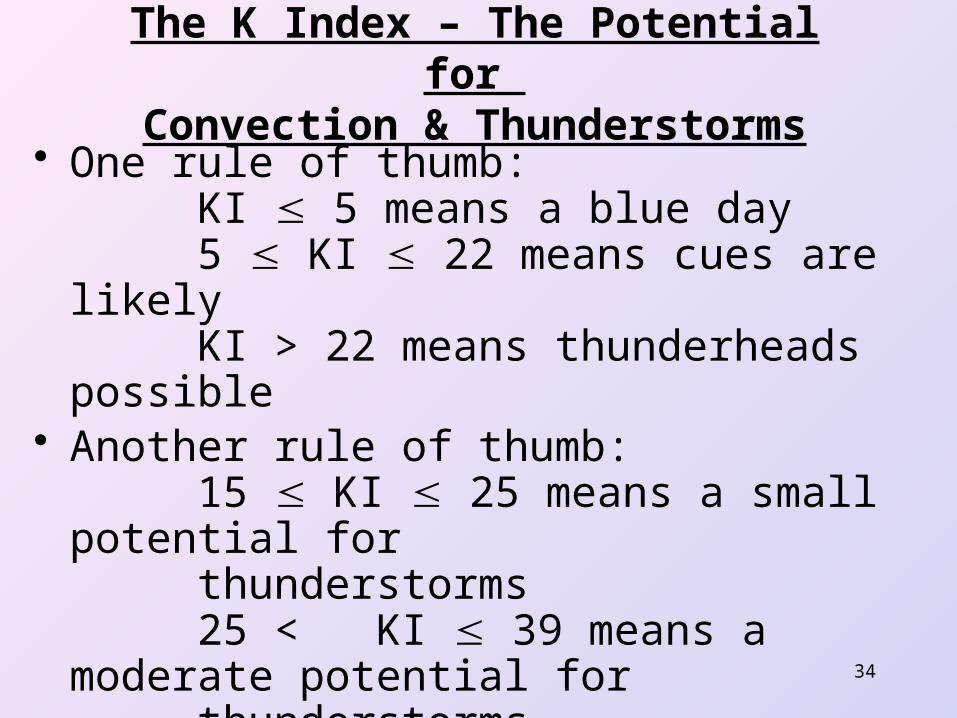
• One rule of thumb: KI 5 means a blue day 5 KI 22 means cues are likely KI > 22 means thunderheads possible
• Another rule of thumb: 15 KI 25 means a small potential for thunderstorms 25 < KI 39 means a moderate potential for thunderstorms KI > 39 means a high potential for thunderstorms
35
CAPE and the Soaring Index
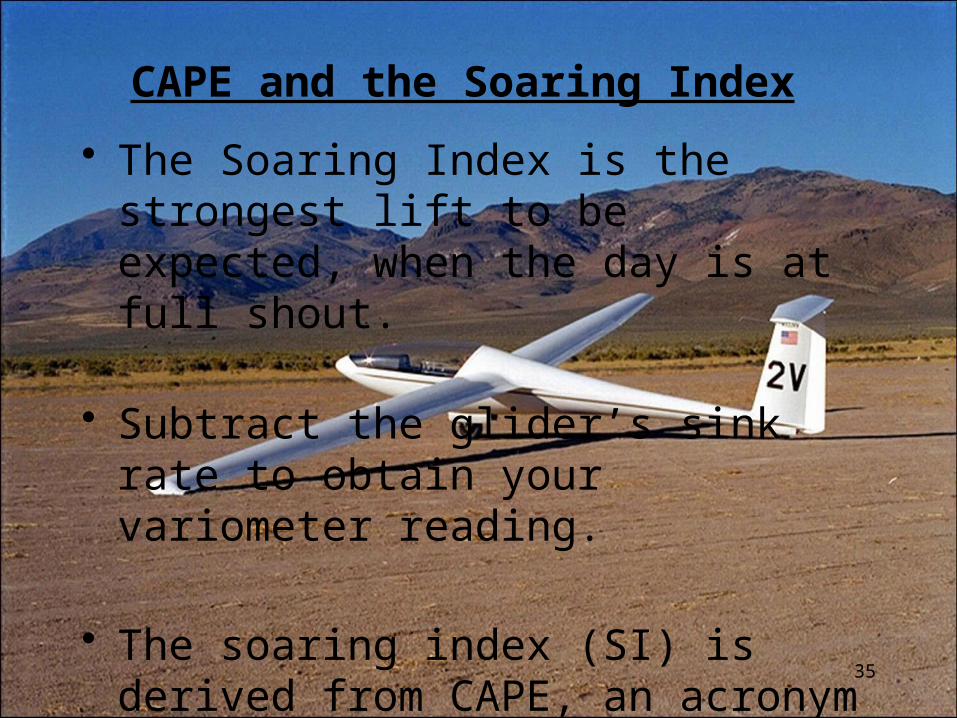
• The Soaring Index is the strongest lift to be expected, when the day is at full shout.
• Subtract the glider’s sink rate to obtain your variometer reading.
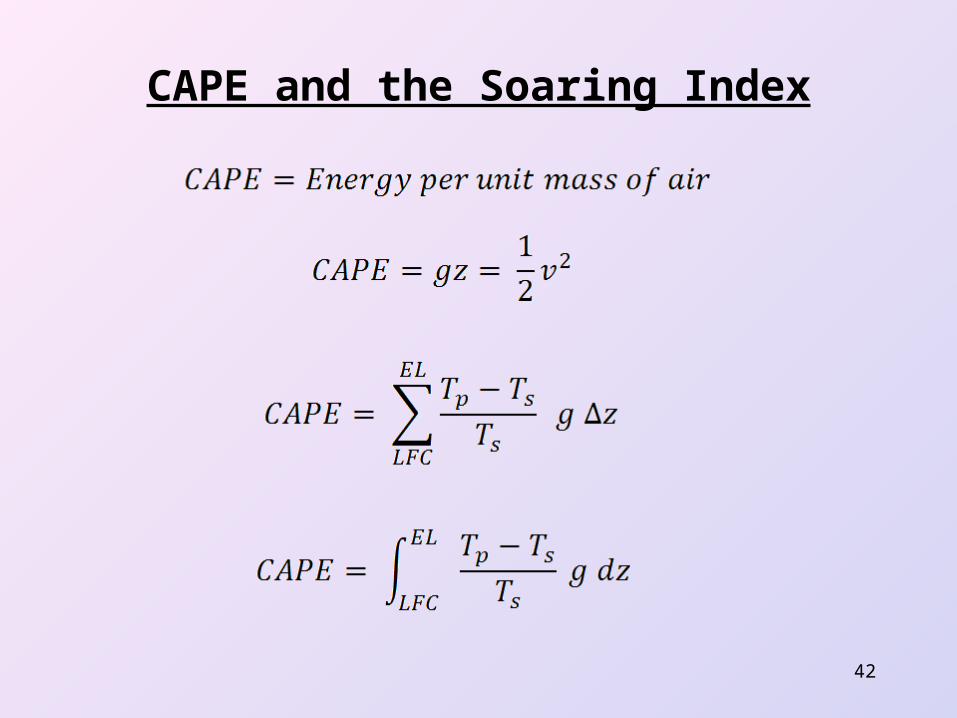
• The soaring index (SI) is derived from CAPE, an acronym for Convective Available Potential Energy.
36
CAPE and the Soaring Index
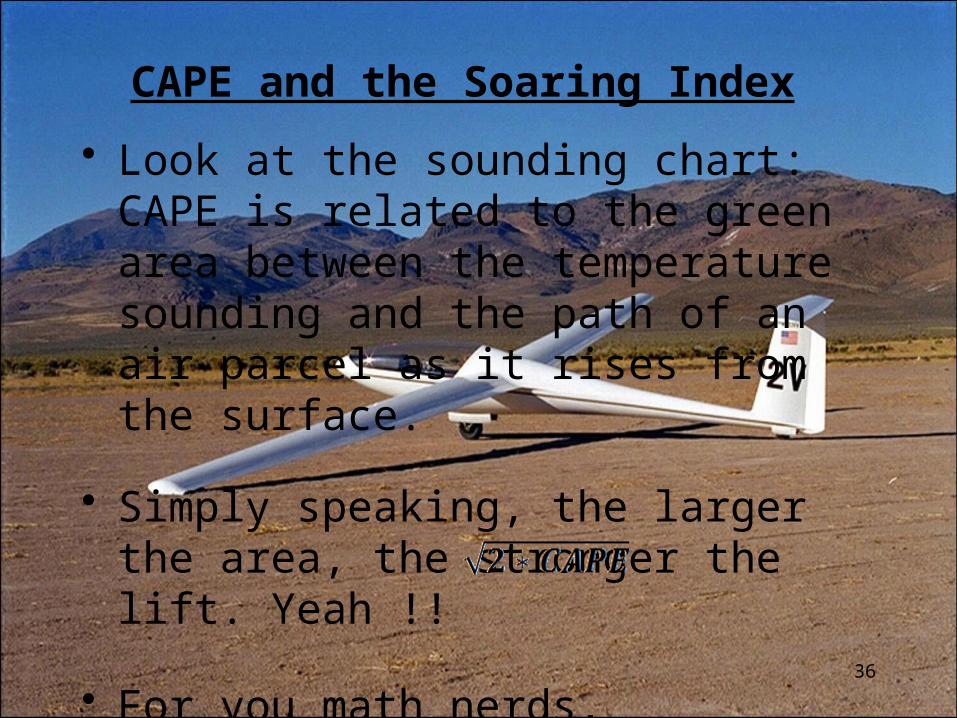
• Look at the sounding chart: CAPE is related to the green area between the temperature sounding and the path of an air parcel as it rises from the surface.
• Simply speaking, the larger the area, the stronger the lift. Yeah !!
• For you math nerds, is used to estimate vertical velocity.
CAPE and the Soaring Index
37
• The soaring index is determined by evaluating the green area between the sounding and the adiabat, and applying various correction factors.
• The correction factors are way beyond the scope of this presentation, so a very crude version of the method will be presented here.
CAPE and the Soaring Index
38
• The green area is sliced up into sections, one on top of the other.
• Buoyancy and Kinetic Energy principles are used to calculate CAPE for each slice, then all the slices are added together.
• The velocities are theoretical and much larger than reality, so in this presentation, the results are divided by 10 as a very crude correction.
CAPE and the Soaring Index
39
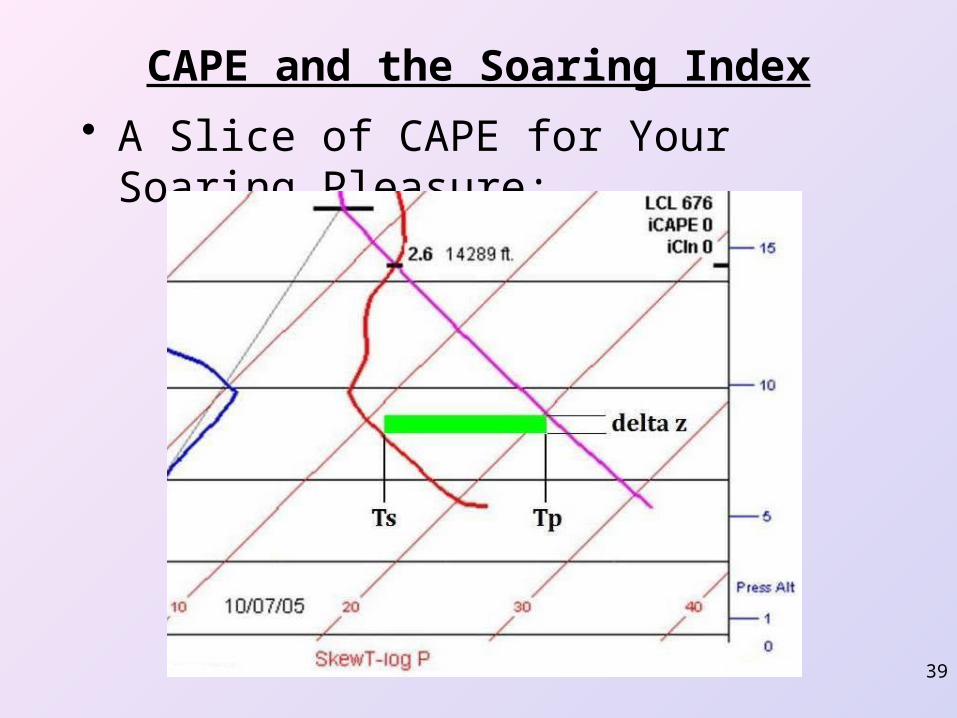
• A Slice of CAPE for Your Soaring Pleasure:
CAPE and the Soaring Index
40
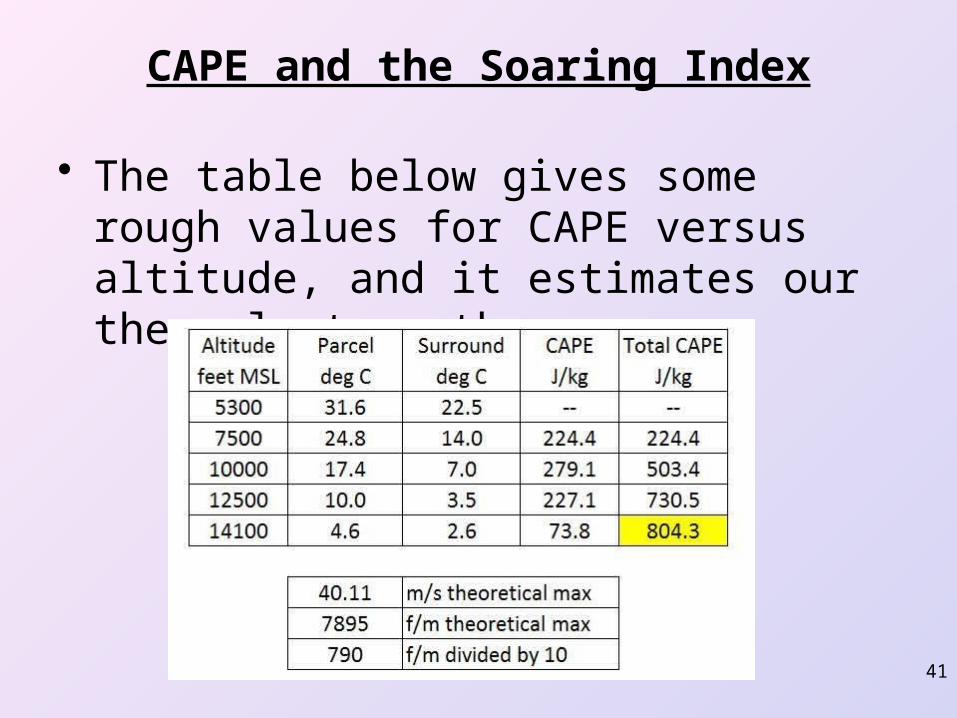
• Add up all the slices to get the total CAPE, then solve for updraft velocity v, remembering that v =
• We get a huge updraft velocity, and this represents a theoretical maximum velocity for the air parcel. Reality will be much less.
• To approximate reality, divide the velocity by 10, and obtain a reasonable value of 790 f/m.
• Is this correct? I hope so. Comments, ideas?
CAPE and the Soaring Index
41
• The table below gives some rough values for CAPE versus altitude, and it estimates our thermal strength:
42
CAPE and the Soaring Index
43
Technical Definitions Directly From the RNO Soaring Forecast
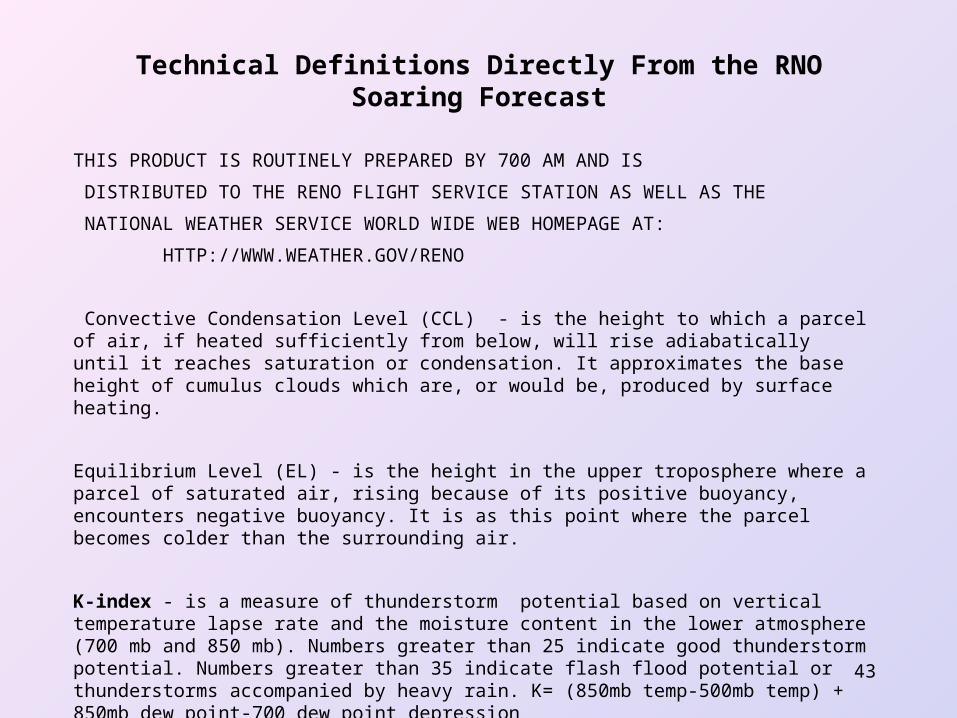
THIS PRODUCT IS ROUTINELY PREPARED BY 700 AM AND IS
DISTRIBUTED TO THE RENO FLIGHT SERVICE STATION AS WELL AS THE
NATIONAL WEATHER SERVICE WORLD WIDE WEB HOMEPAGE AT:
HTTP://WWW.WEATHER.GOV/RENO
Convective Condensation Level (CCL) - is the height to which a parcel of air, if heated sufficiently from below, will rise adiabatically until it reaches saturation or condensation. It approximates the base height of cumulus clouds which are, or would be, produced by surface heating.
Equilibrium Level (EL) - is the height in the upper troposphere where a parcel of saturated air, rising because of its positive buoyancy, encounters negative buoyancy. It is as this point where the parcel becomes colder than the surrounding air.
K-index - is a measure of thunderstorm potential based on vertical temperature lapse rate and the moisture content in the lower atmosphere (700 mb and 850 mb). Numbers greater than 25 indicate good thunderstorm potential. Numbers greater than 35 indicate flash flood potential or thunderstorms accompanied by heavy rain. K= (850mb temp-500mb temp) + 850mb dew point-700 dew point depression
44
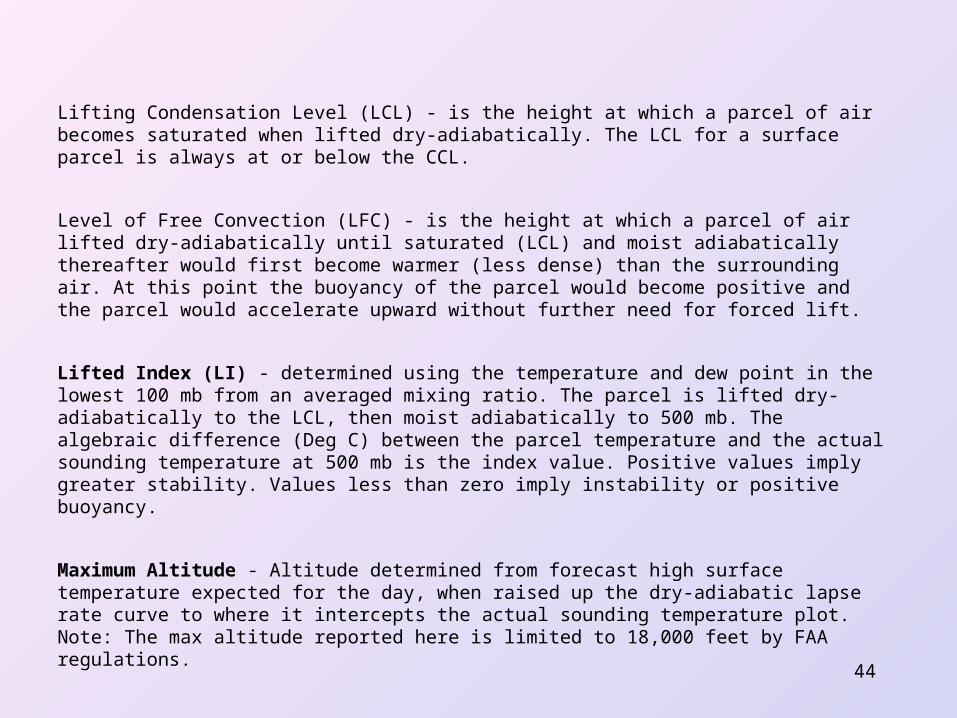
Lifting Condensation Level (LCL) - is the height at which a parcel of air becomes saturated when lifted dry-adiabatically. The LCL for a surface parcel is always at or below the CCL.
Level of Free Convection (LFC) - is the height at which a parcel of air lifted dry-adiabatically until saturated (LCL) and moist adiabatically thereafter would first become warmer (less dense) than the surrounding air. At this point the buoyancy of the parcel would become positive and the parcel would accelerate upward without further need for forced lift.
Lifted Index (LI) - determined using the temperature and dew point in the lowest 100 mb from an averaged mixing ratio. The parcel is lifted dry-adiabatically to the LCL, then moist adiabatically to 500 mb. The algebraic difference (Deg C) between the parcel temperature and the actual sounding temperature at 500 mb is the index value. Positive values imply greater stability. Values less than zero imply instability or positive buoyancy.
Maximum Altitude - Altitude determined from forecast high surface temperature expected for the day, when raised up the dry-adiabatic lapse rate curve to where it intercepts the actual sounding temperature plot. Note: The max altitude reported here is limited to 18,000 feet by FAA regulations.
45
Showalter Index (SI) - determined by lifting a parcel of air using the 850 mb temperature and dew point dry-adiabatically to the LCL, then moist-adiabatically to 500 mb. The algebraic difference between the parcel temperature and actual sounding temperature is the index value. Positive values imply greater stability.
Soaring Index - A forecast of maximum lift rate in feet per minute (fpm) by thermals expected at the time of maximum temperature. This empirical formula is based on maximum altitude of thermals and the lapse rate from the trigger altitude 4000 feet above the surface.
Trigger Temperature - The surface temperature reached when the temperature from the morning upper air sounding at 4000 feet above the surface is lowered dry-adiabatically to the surface.
Trigger time - The local time the trigger temperature is reached. A minimum lift rate of 260 fpm would be obtained at this time up to 4000 feet.