intro to logging modo de compatibilidad1
DESCRIPTION
presentacionTRANSCRIPT

Introduction to Logging
Intro to Logging
Objectives:
• Identify the information needed for oil reserves estimation and the purpose of well logging
• Define Porosity: total and effective
• Define water saturation and hydrocarbon saturation: for both clean and shaly formations
• Define reservoir thickness and geometry
• Define recovery factor
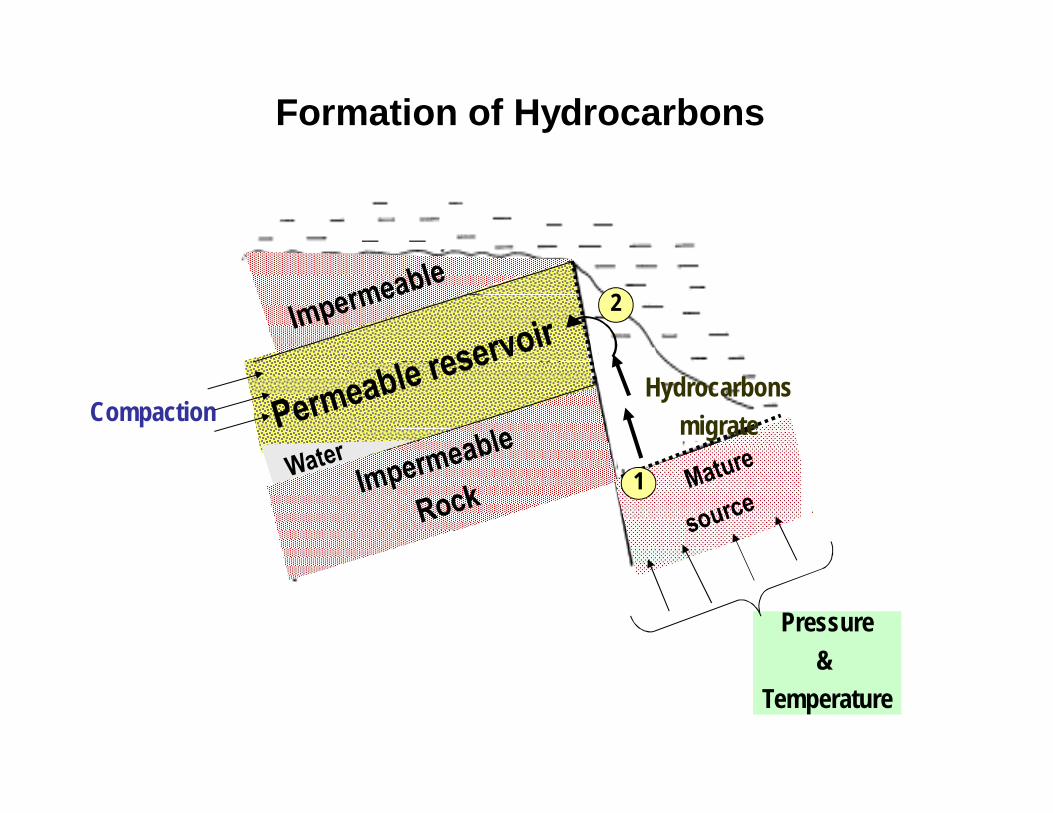
Formation of Hydrocarbons
Compaction
2
1
Hydrocarbonsmigrate
Pressure&
Temperature
___ ___

Properties of Sediments
Rock Abundanceby type
Hydrocarbon productionby rock type
Example of a formation Bedding structure
Shale
Sandstone
Limestone
Dolomite
Salt
Granite
Conglomerate
Coal
Gypsum
carbonates

Locations of drilled wellsLocations of drilled wells
• Remote Frontier Wildcats
• Conventional Exploration
• Confirmation Wells
• Development Wells
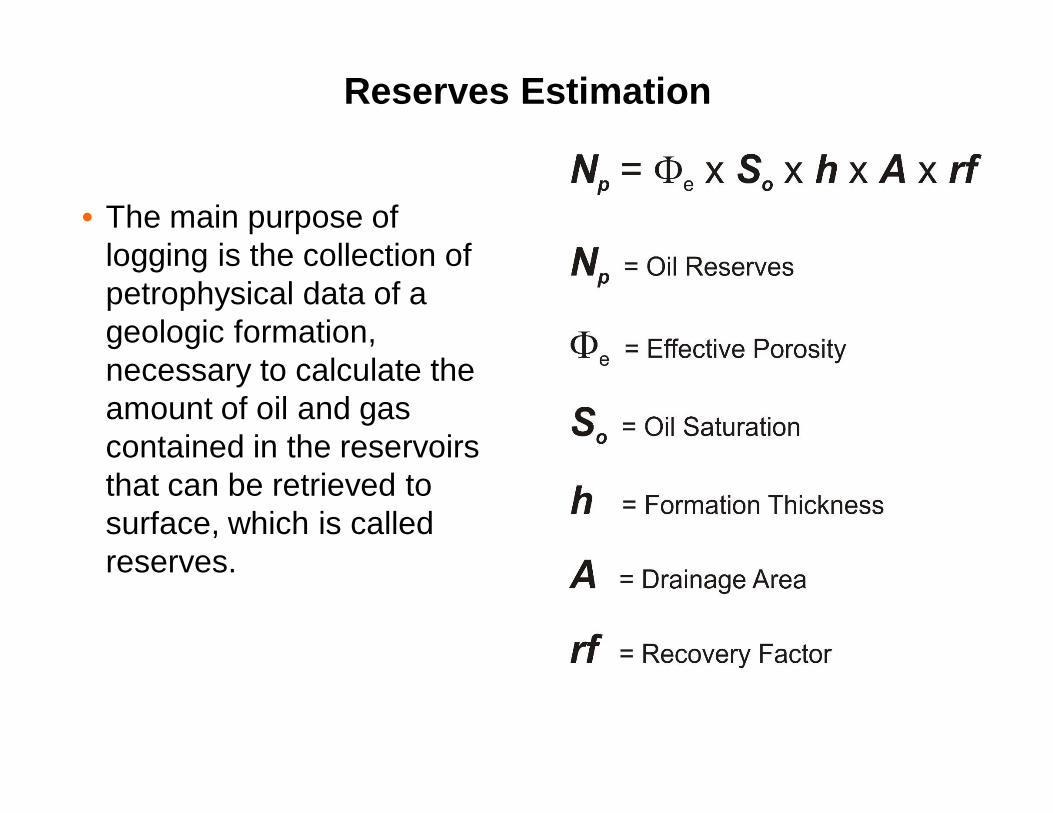
Reserves Estimation
• The main purpose of logging is the collection of petrophysical data of a geologic formation, necessary to calculate the amount of oil and gas contained in the reservoirs that can be retrieved to surface, which is called reserves.

Reserves Estimation
• From the reserves estimation equation we can see that economic evaluation of a reservoir requires knowledge of certain fundamental reservoir properties:
– Porosity F– Oil Saturation So
– Reservoir Thickness h– Reservoir Geometry A– Recovery Factor rf
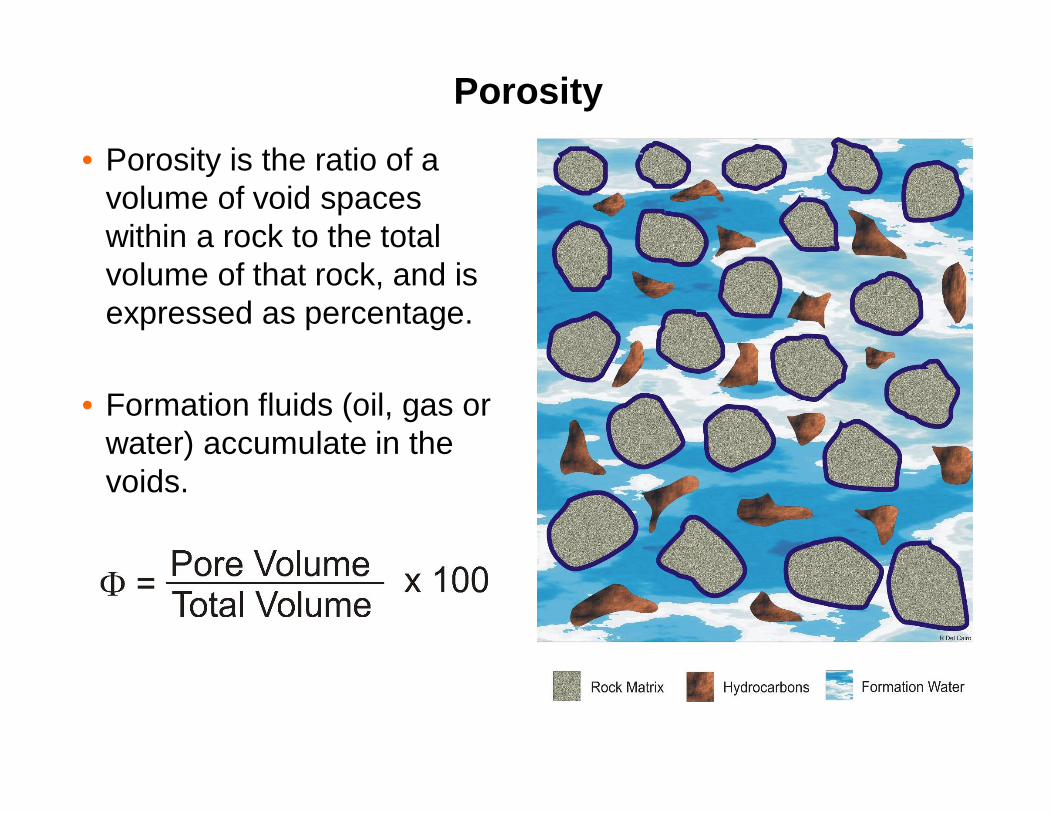
Porosity• Porosity is the ratio of a
volume of void spaces within a rock to the total volume of that rock, and is expressed as percentage.
• Formation fluids (oil, gas or water) accumulate in the voids.

Big grains
Big pores
Small grains
Small pores
Small pores
Different sorting
Porosity profiling with respect to grain size& grain arrangement
Porosity

e
matrixCleanSand =
e
matrixLaminar
Shale =
e
matrixDispersed
Shale =
StructuralShale
e
matrix=
Effective Porosity
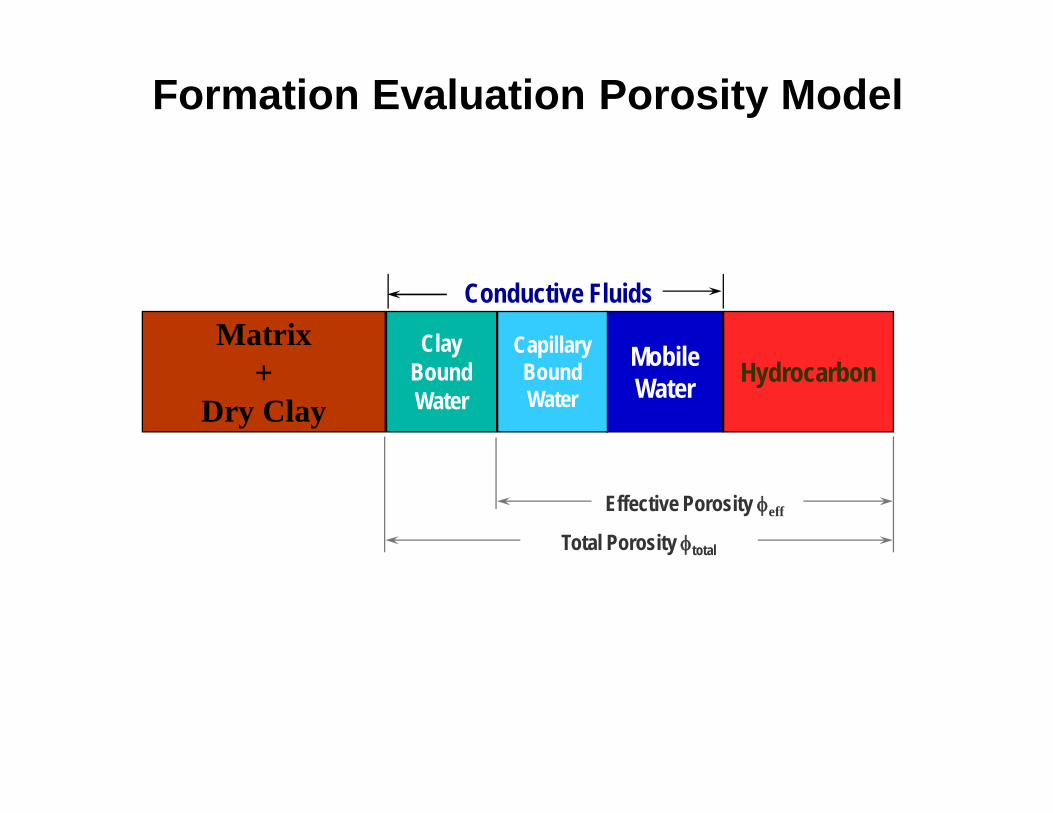
MobileWater
Matrix+
Dry Clay
ClayBoundWater
CapillaryBoundWater
Hydrocarbon
Effective Porosity eff
Total Porosity total
Conductive Fluids
Formation Evaluation Porosity Model
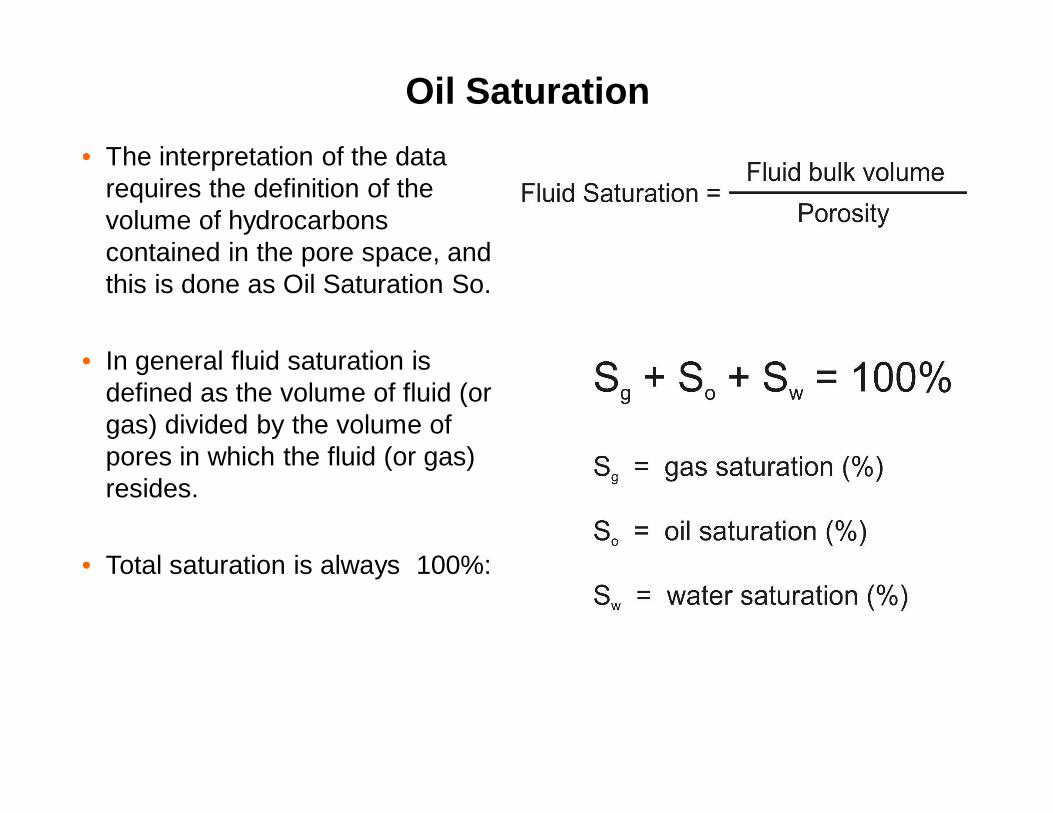
Oil Saturation• The interpretation of the data
requires the definition of the volume of hydrocarbons contained in the pore space, and this is done as Oil Saturation So.
• In general fluid saturation is defined as the volume of fluid (or gas) divided by the volume of pores in which the fluid (or gas) resides.
• Total saturation is always 100%:

Oil Saturation in “clean” formationsOil Saturation in “clean” formations
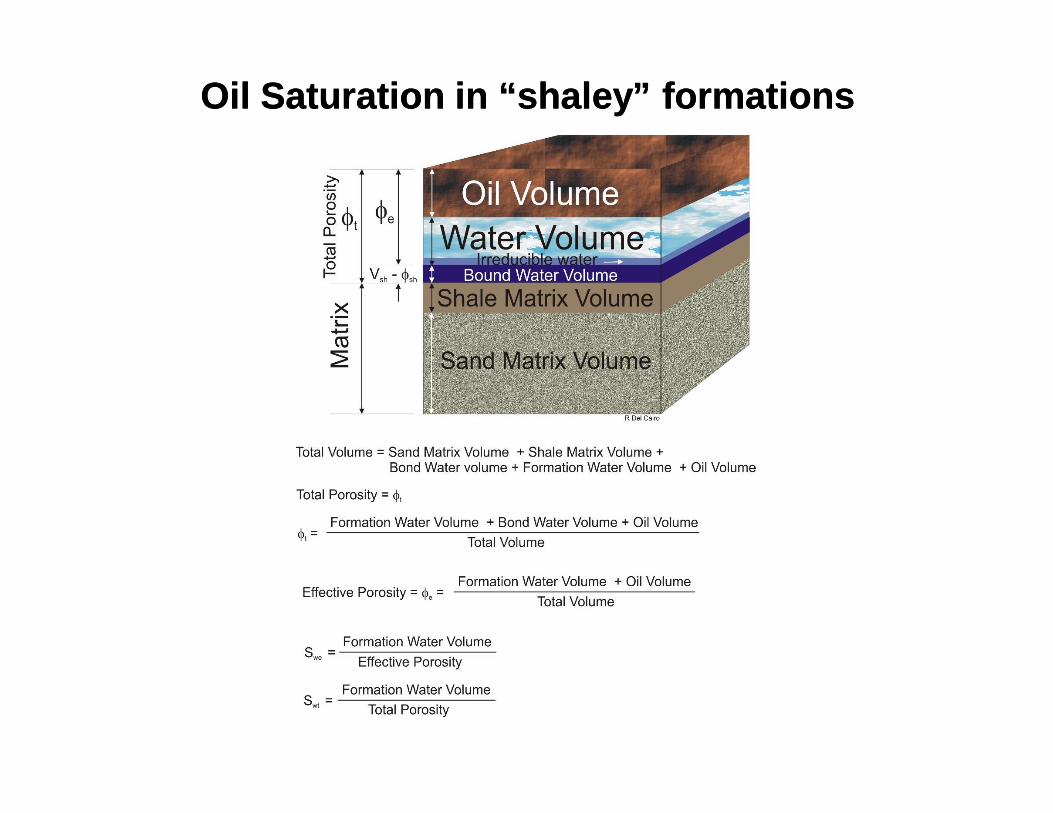
Oil Saturation in “shaley” formationsOil Saturation in “shaley” formations

Reservoir Thickness• Reservoir Thickness the current true vertical thickness of the
reservoir rock in place.
• The most basic information provided by wireline logging is measured well depth and identifiable top and bottom depths of traversed geological formations.
• When wells are deviated more than about 5°, it becomes necessary to correct the measured reservoir thickness to true vertical thickness by utilizing measurements of the borehole drift angle and directions.
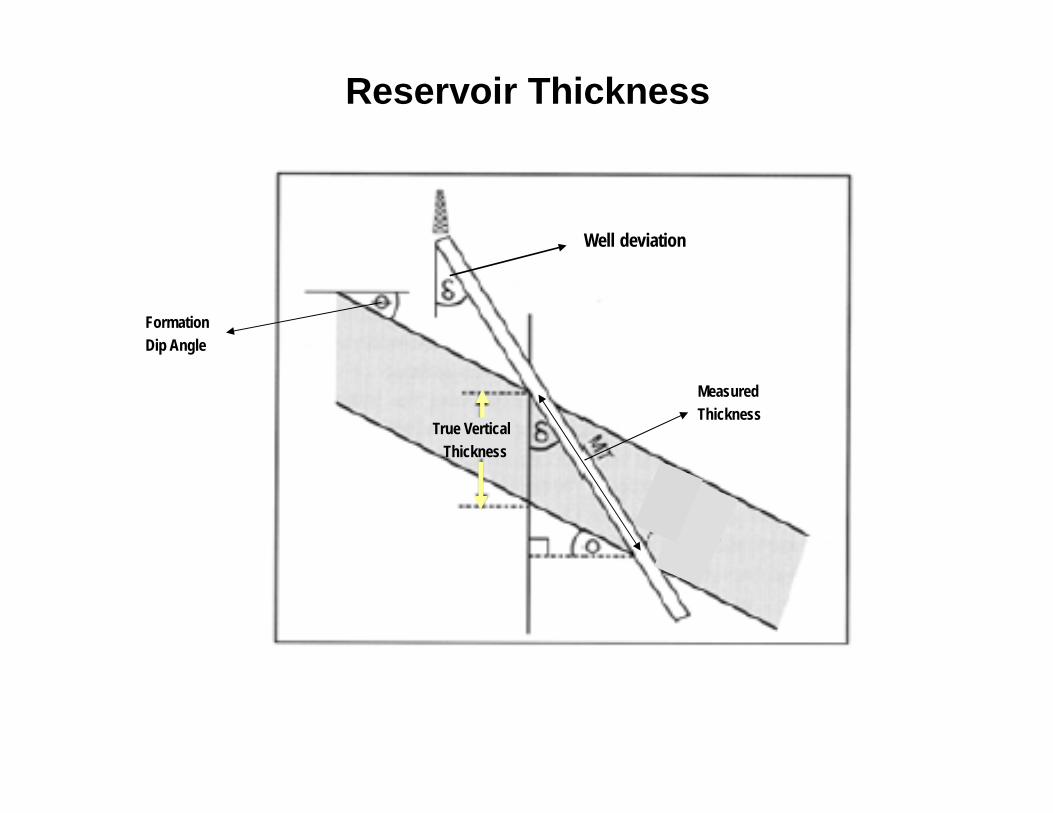
Reservoir Thickness
True Vertical Thickness
Measured Thickness
Formation Dip Angle
Well deviation

Reservoir Geometry
• The reservoir engineer must know the reservoir's areal extent and shape in addition to its thickness.
• Surface seismic data provide horizontal stratigraphic coverage
• The combined data from a number of wells allow inference of the outlying limits of the reservoir.
Recovery Factor
• The recovery factor is the proportion of resources which can be recovered from a deposit to the resources originally in place.
• Rf = Extracted fluid / Original volume of the fluid
• Recovery Factor = Reserves / Volume in Place
Recovery factor is often associated to the formation pressure, temperature and permeability
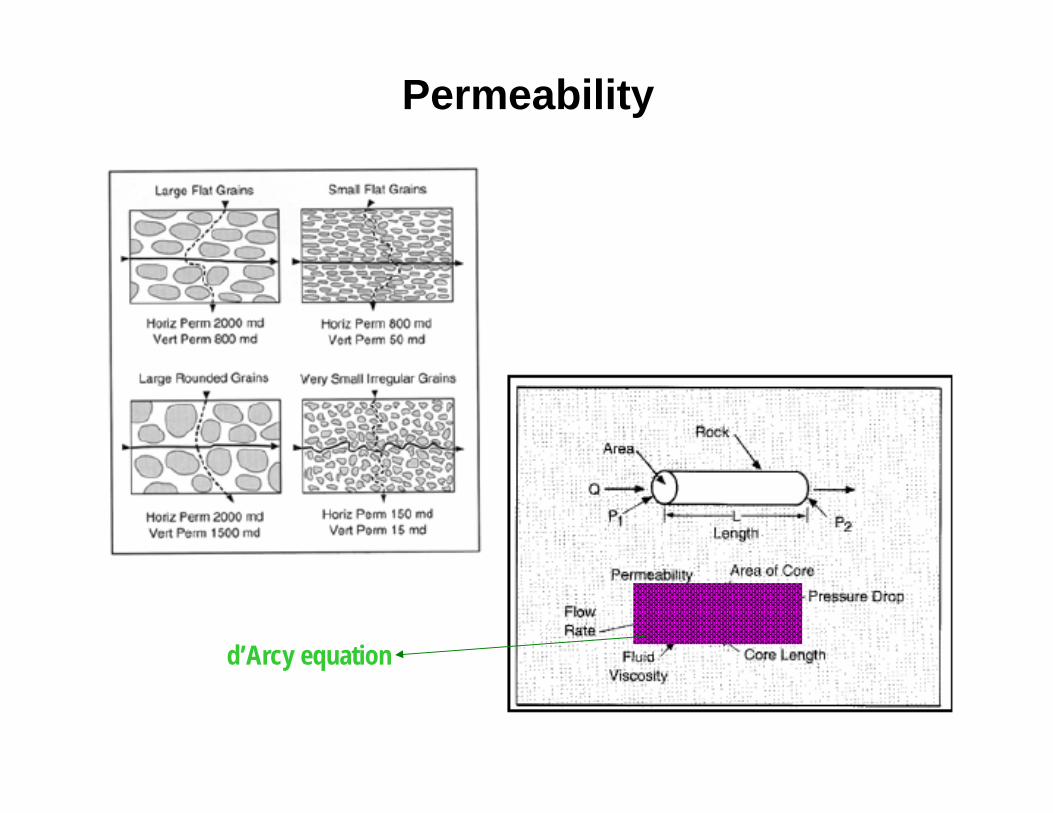
d’Arcy equation
Permeability
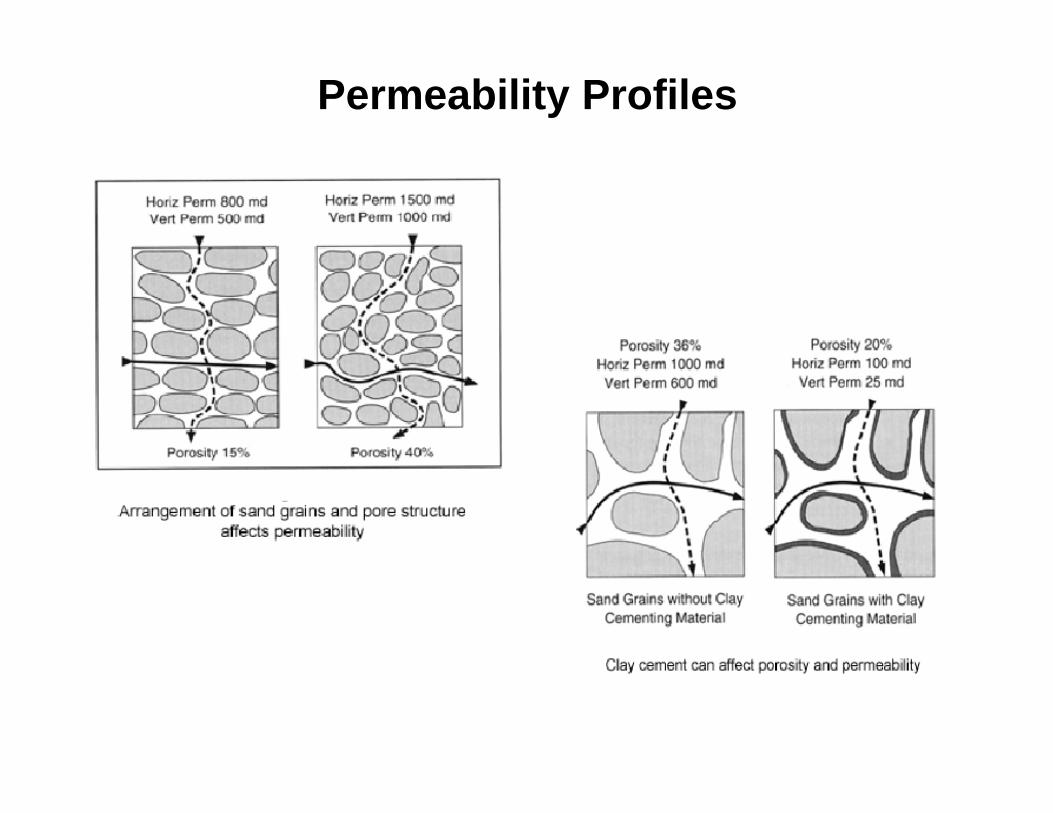
Permeability Profiles
Well Logging
• Well log data is the result of measurements of the physical properties of rock matrix material and the fluids occupying the pores.
• Log measurements can define or at least infer petrophysical properties such as
– porosity, – permeability, – lithology, and – water, oil or gas saturation.
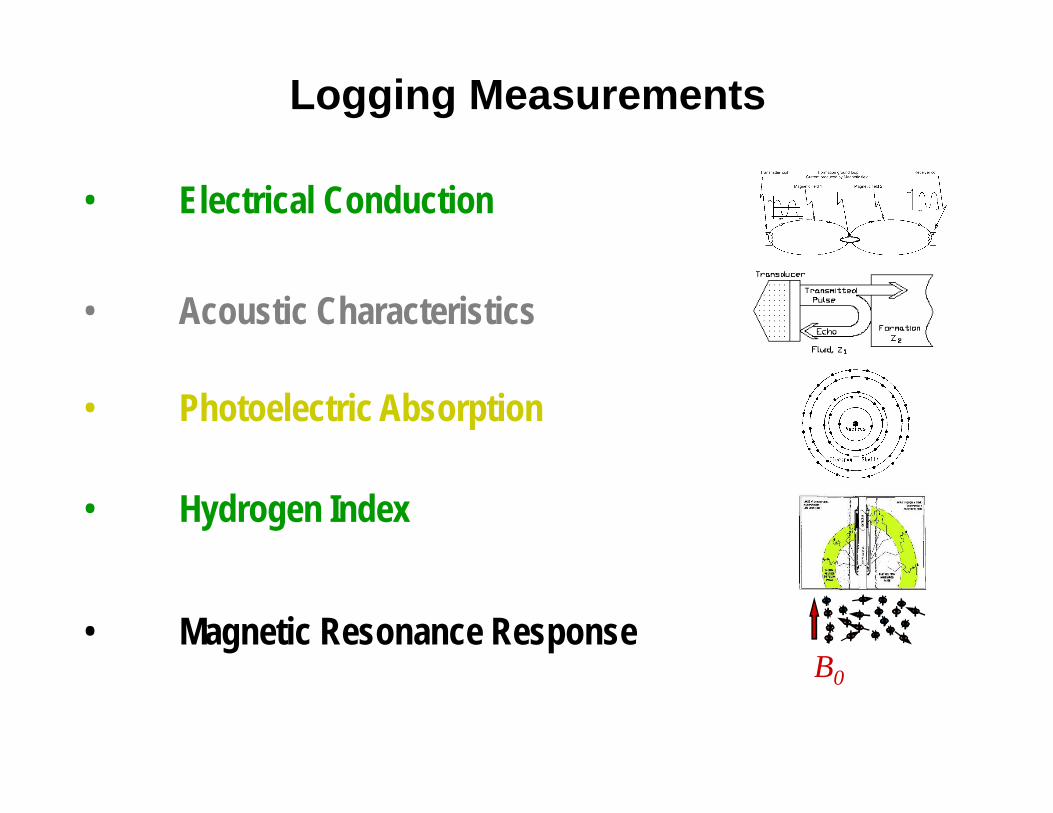
• Electrical Conduction
• Acoustic Characteristicsf
• Photoelectric Absorption
• Hydrogen Index
B0
• Magnetic Resonance Response
Logging Measurements

Formation Evaluation

Formation Evaluation
Objectives:
• Explain how hydrocarbon saturation can be inferred by mean of resistivity measurements
• Explain how water salinity concentration effects on its resistivity
• Identify what formation parameters and how they effect on the formation resistivity
• Define formation factor, constant a and porosity exponent (m)
• Define resistivity index and the saturation exponent (n)
• Define Archie’s General Equation for Saturation
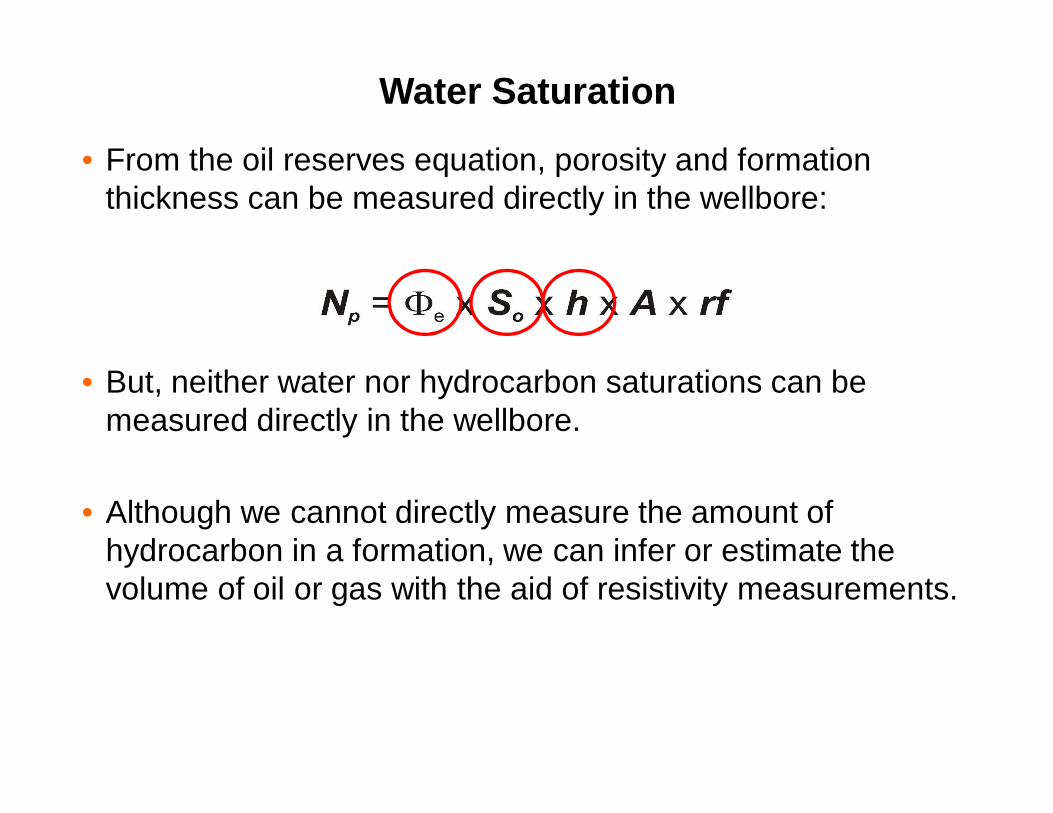
Water Saturation• From the oil reserves equation, porosity and formation
thickness can be measured directly in the wellbore:
• But, neither water nor hydrocarbon saturations can be measured directly in the wellbore.
• Although we cannot directly measure the amount of hydrocarbon in a formation, we can infer or estimate the volume of oil or gas with the aid of resistivity measurements.

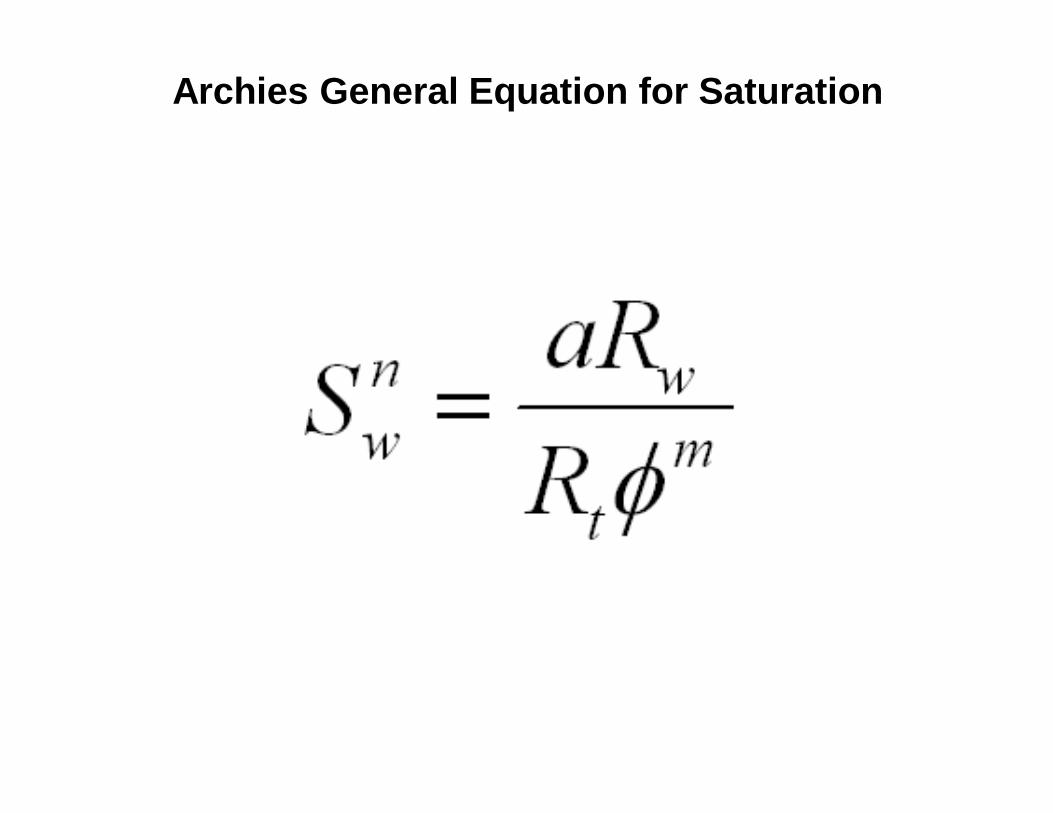
Archies General Equation for Saturation
Sw= water saturationn= saturation exponenta= constantRw= water resistivityRt= true formation resistivityΦ= formation total porositym= porosity exponent
Resistivity• Resistivity is a property of a material just like density and it’s
related to electrical resistance by length and cross-sectional area.
• Resistance determines the amount of voltage necessary to cause a particular current to flow (Ohm’s law).
• Resistivity is measured in ohm-meters2/meter; simplified to ohm-meters, or ohms.
• Conductivity is the opposite of resistivity (conductivity is measured in siemens per meter S/m or mhos).

Resistivity
Geometric Factor
Formation resistivity
• Formation resistivity varies with porosity, formation water salinity and content.
• The dissolved salts that are generally found in formation water in different amounts lower the resistivity of the water.
• If we measure the resistivity of distilled water, we find it has extremely high resistivity.

Distilled water resistivity
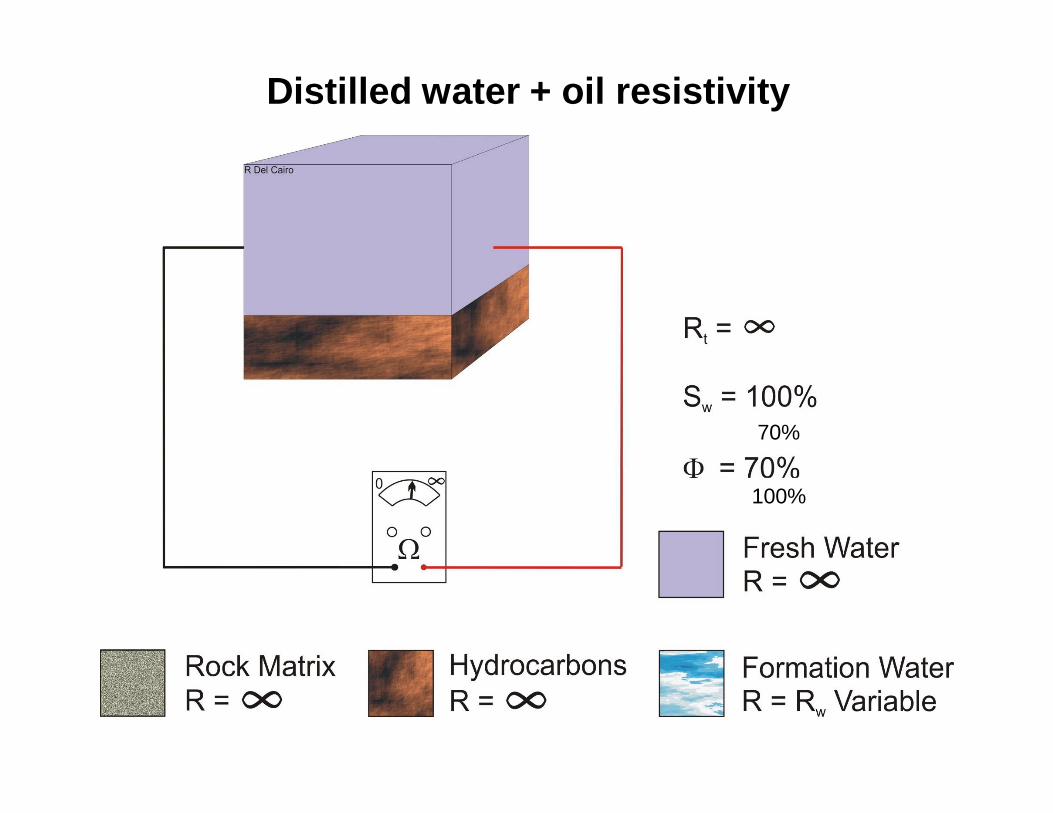
Distilled water + oil resistivity
100%
70%
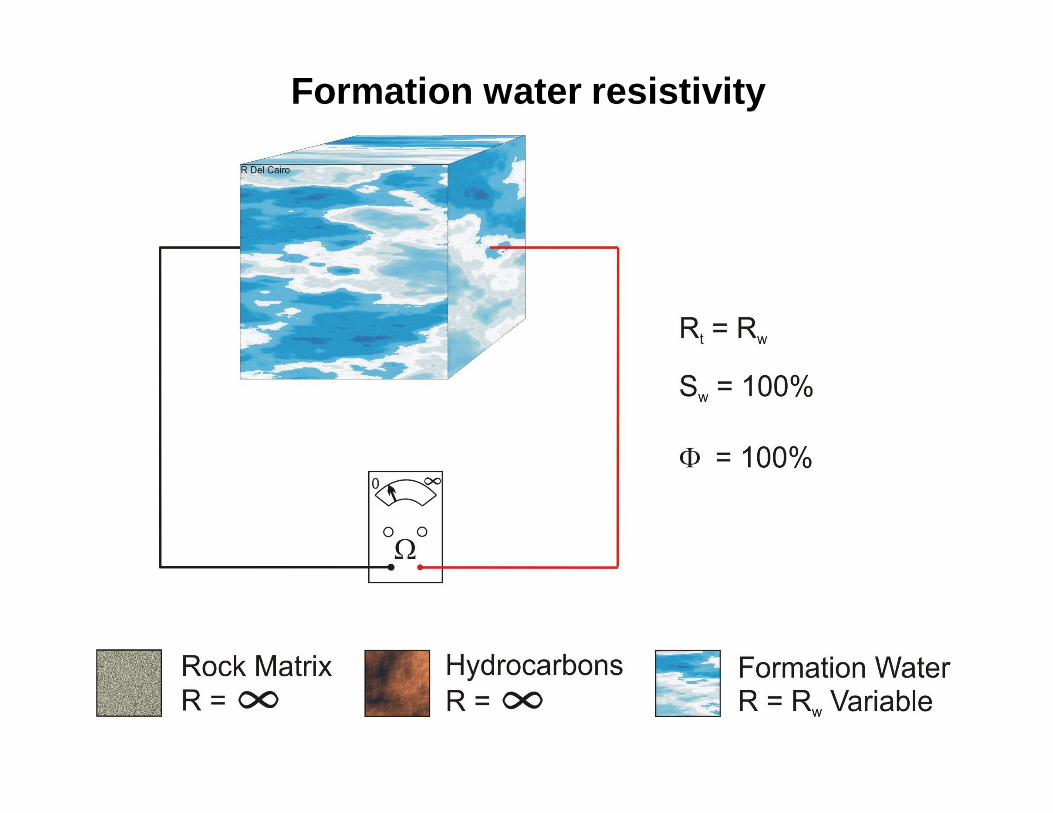
Formation water resistivity
Formation resistivity
• Since sandstones are essentially glass (silicon oxide), it would seem that sandstones have very high resistivity.
• Downhole sandstones show lower resistivity because of the resistivity of the formation water they contain.
• When we measure the resistivity of our block of sandstone, its resistivity will vary with the amount of water and the salinity of the water contained within the pore space.
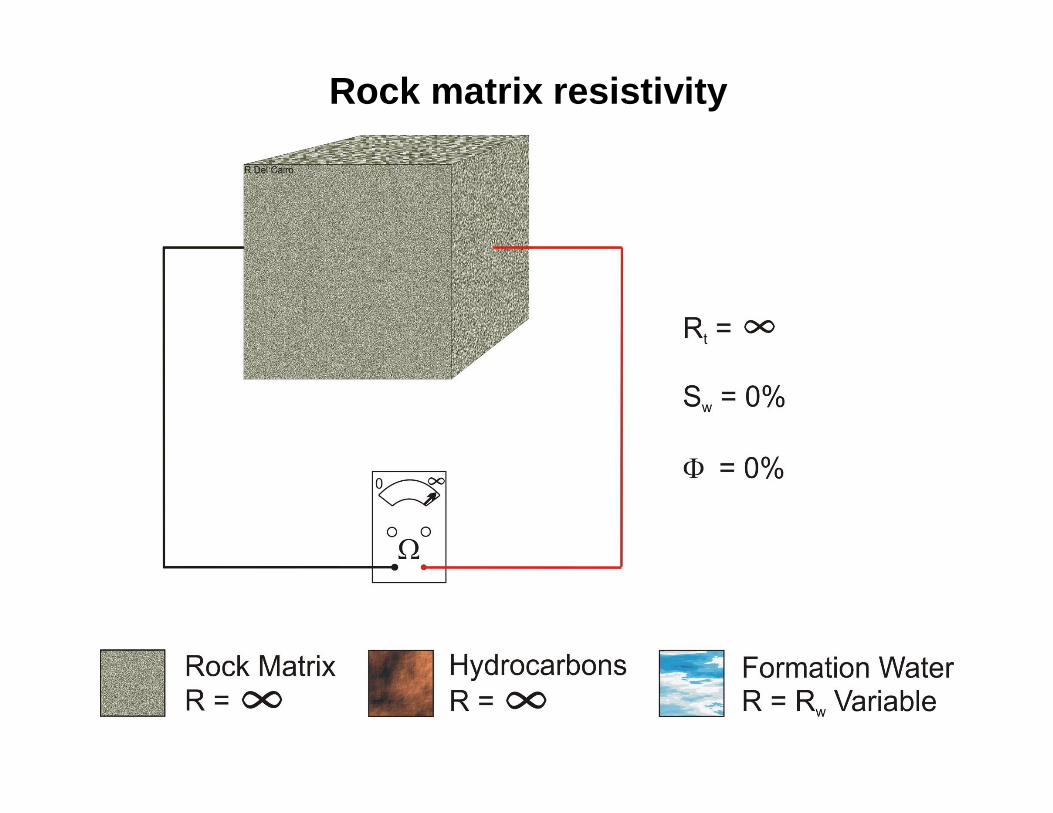
Rock matrix resistivity
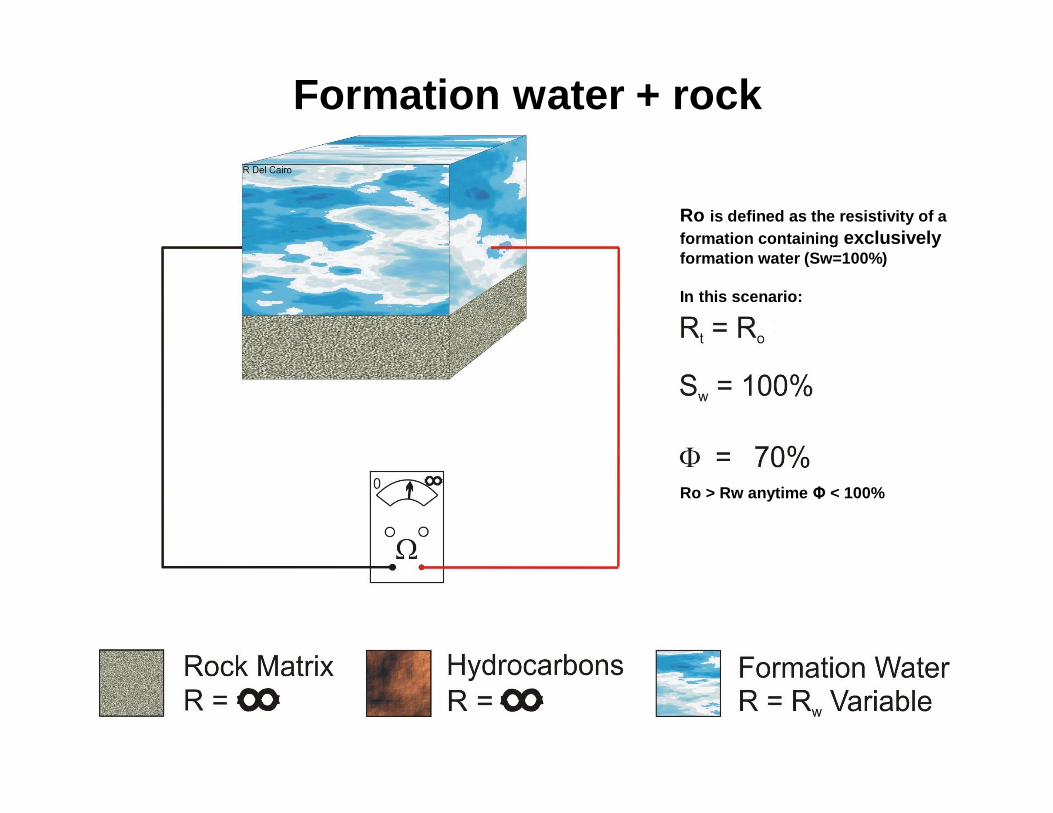
Formation water + rock
Ro is defined as the resistivity of a formation containing exclusively formation water (Sw=100%)
In this scenario:
Ro > Rw anytime Φ < 100%

Formation Factor
a

Formation factor
• Archie’s general equation:• F = a / Fm
• Humble equation for sandstones:• F = 0.62 / F2.15
• Archie equation for carbonates• F = 1 / F2

Formation factor chart

Porosity exponent m
Based on the compaction of the formation:
• 1.3 unconsolidated sandstone • 1.4 – 1.5 very slightly cemented • 1.6 – 1.7 slightly cemented • 1.8 – 1.9 moderately cemented • 2.0 – 2.2 highly cemented
Porosity exponent m
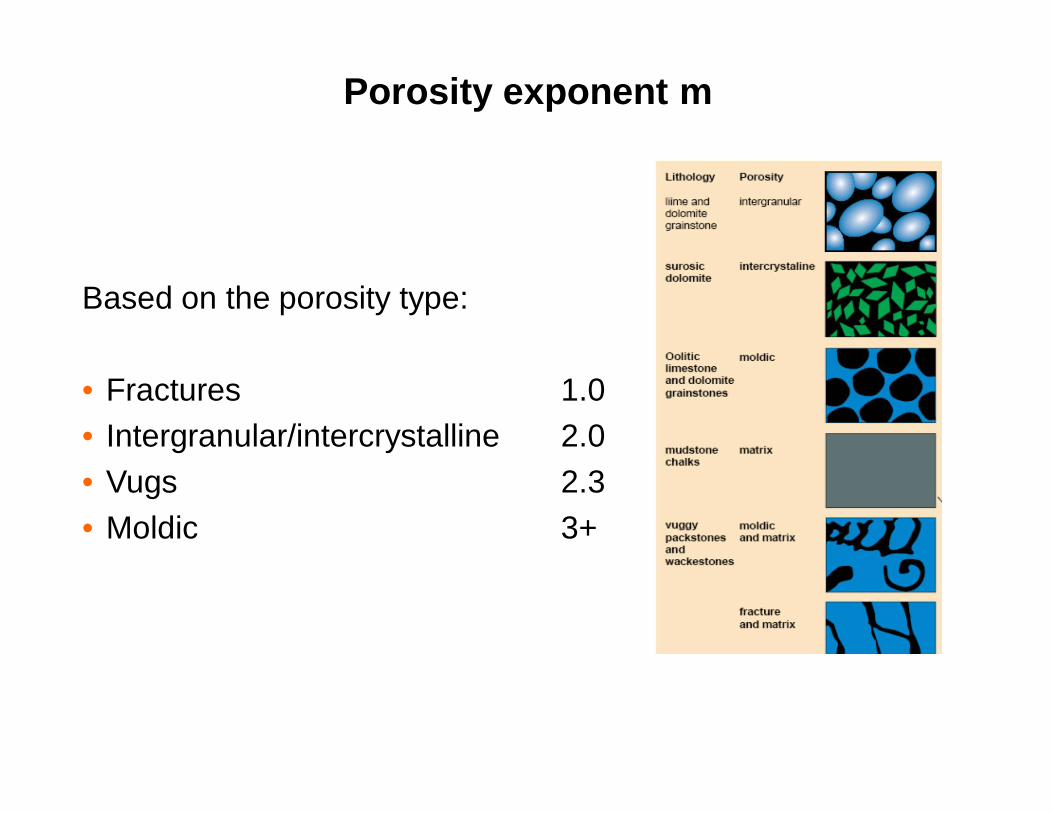
Based on the porosity type:
• Fractures 1.0• Intergranular/intercrystalline 2.0• Vugs 2.3• Moldic 3+

Formation resistivity
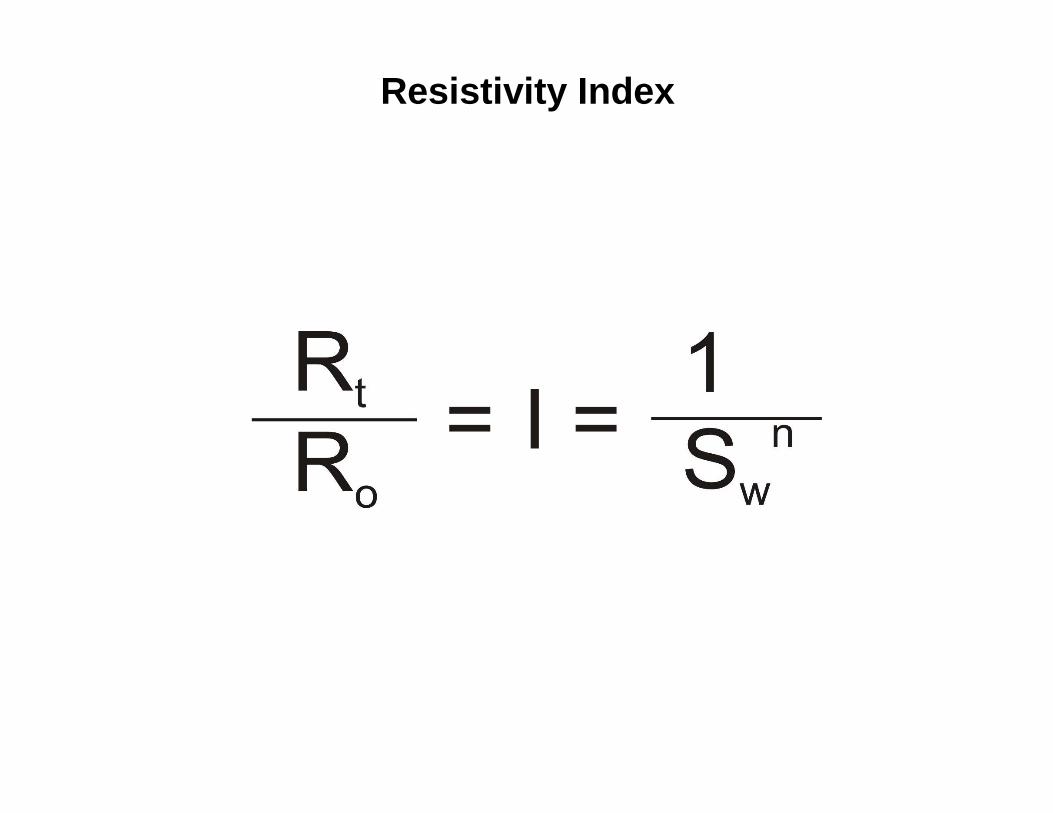
Resistivity Index
Saturation exponent n
• Laboratory measurements of the resistivity index in water-wet rocks show that an n value of 2 is typical in most cases.
• However, lab measurements also show that an equivalent rule-of- thumb figure for oil-wet rocks would be about 9.
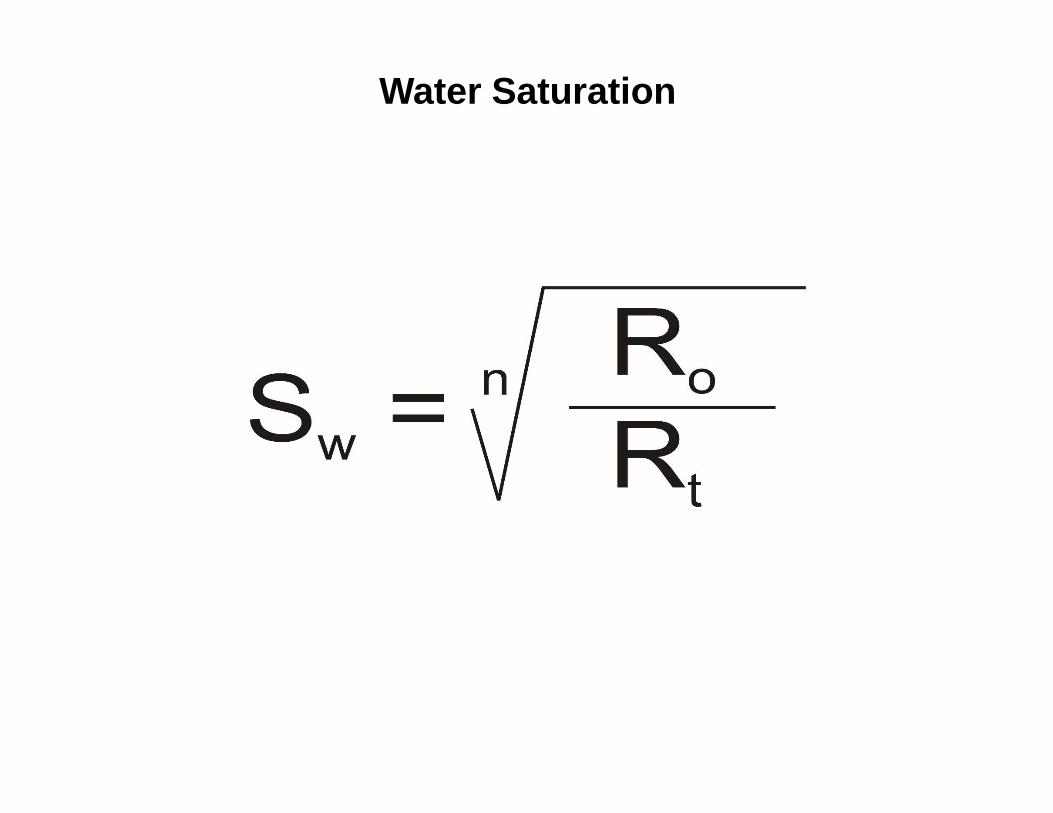
Water Saturation
Archies General Equation for Saturation

The Invasion Process

The Invasion Process
Objectives:
• Explain the invasion process
• Identify parameters associated with the borehole, flushed zone and undisturbed zone
• Define resistivity profile: normal and inverse
Invasion profile
• Almost from the beginning, engineers realized that more than one resistivity measurement was needed because of the effects of invasion
– Drilling fluid normally has a different resistivity than the formation matrix, the formation water and any hydrocarbons that may exist in the formation.
• Fresh Water-based Mud
• Salt-based Mud
• Oil-based Mud
• Potassium Chloride Mud
• Air or Gas drilled holes
Drilling Fluids
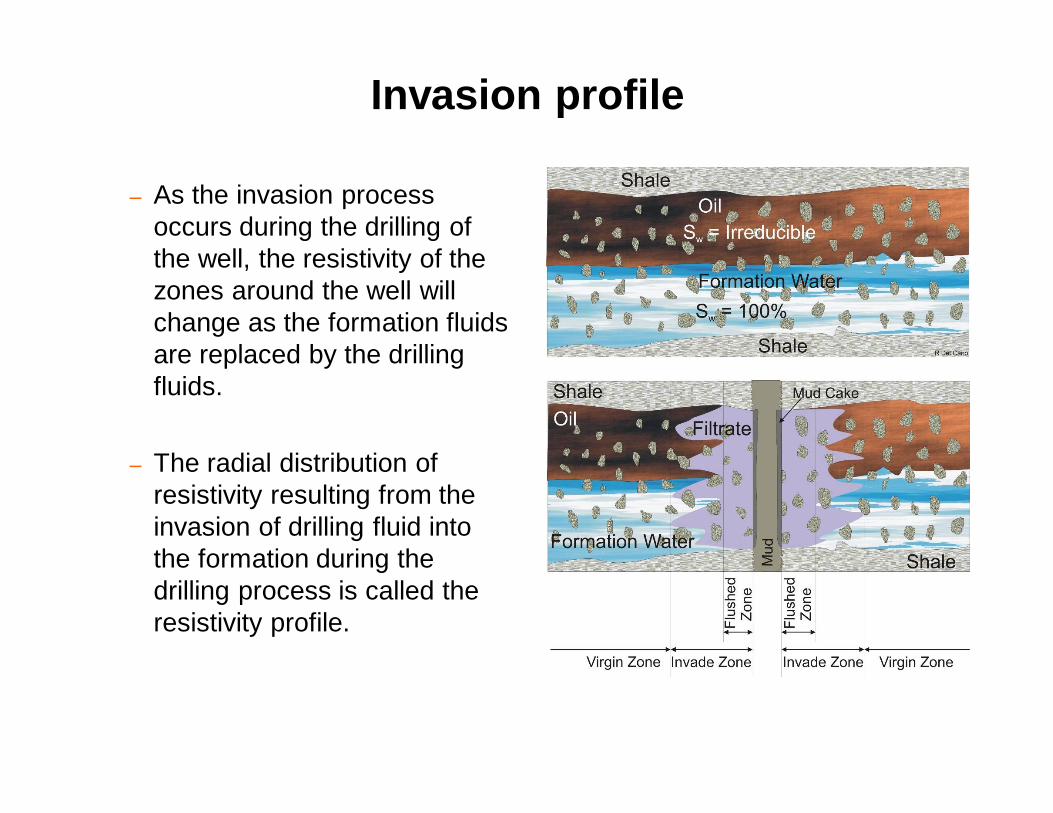
Invasion profile
– As the invasion process occurs during the drilling of the well, the resistivity of the zones around the well will change as the formation fluids are replaced by the drilling fluids.
– The radial distribution of resistivity resulting from the invasion of drilling fluid into the formation during the drilling process is called the resistivity profile.
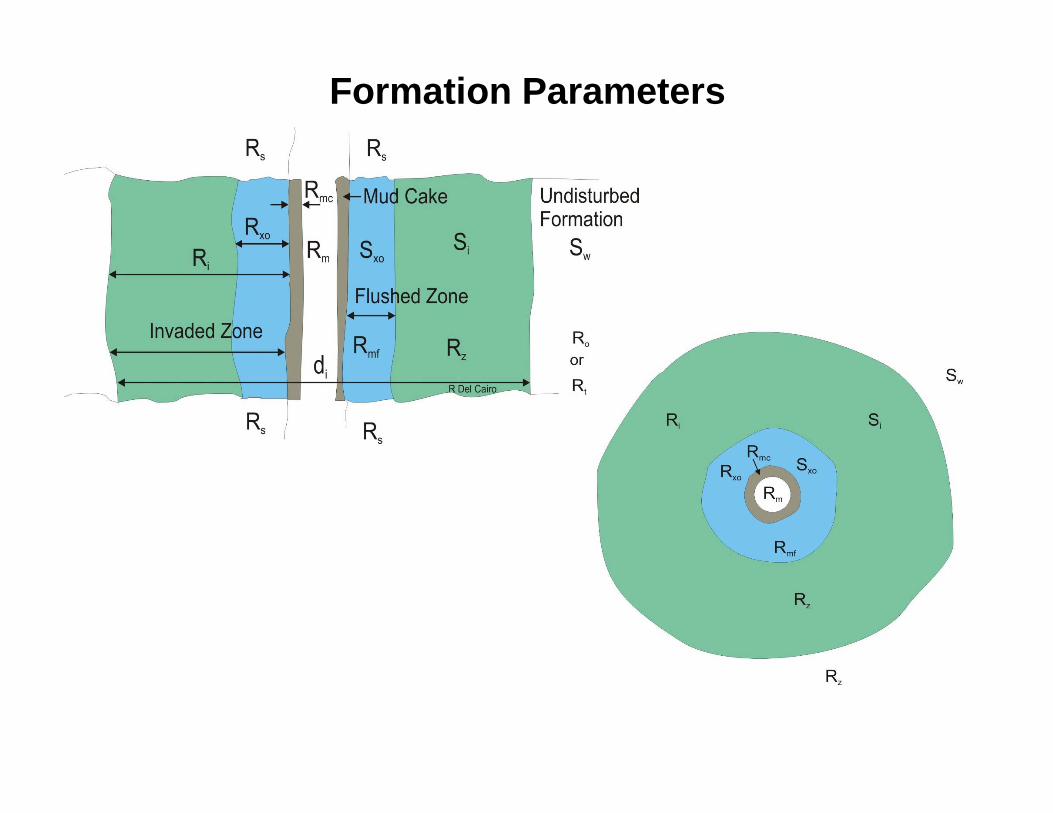
Formation Parameters

Water Saturation
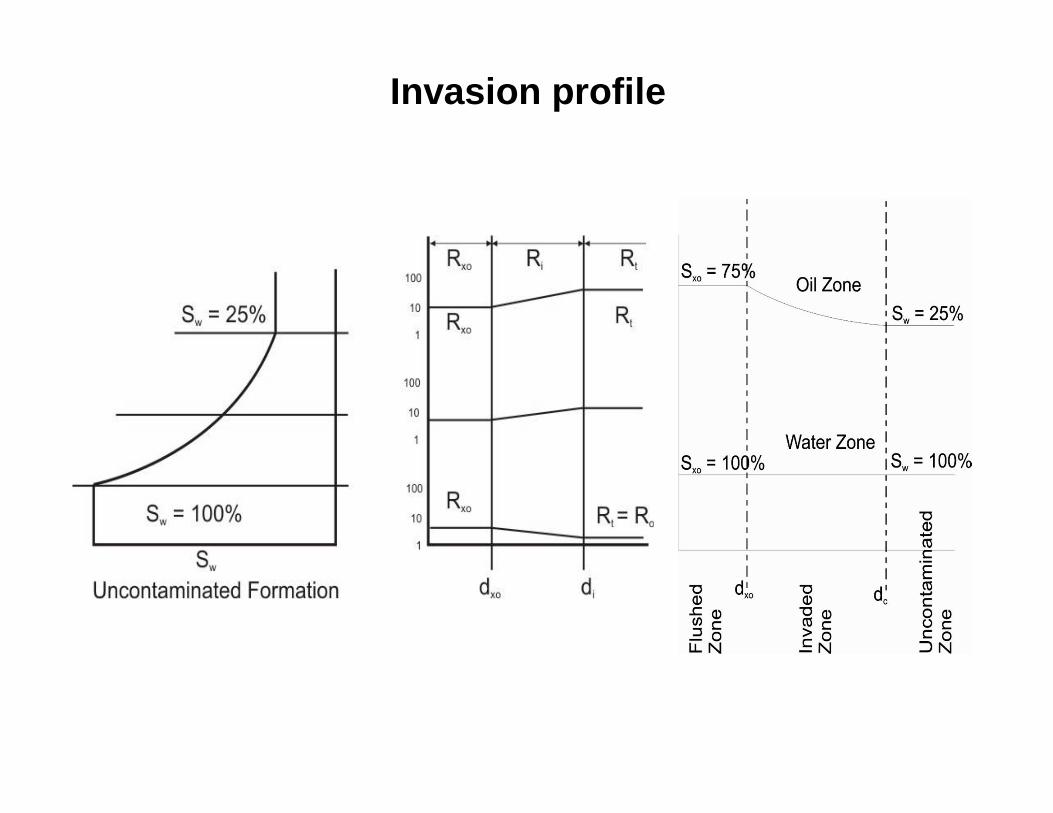
Invasion profile