intersecting dynamics of agricultural structural change and urbanisation within european rural...
TRANSCRIPT

This article was downloaded by: [University of Winnipeg]On: 11 September 2014, At: 15:09Publisher: RoutledgeInforma Ltd Registered in England and Wales Registered Number: 1072954 Registeredoffice: Mortimer House, 37-41 Mortimer Street, London W1T 3JH, UK
Landscape ResearchPublication details, including instructions for authors andsubscription information:http://www.tandfonline.com/loi/clar20
Intersecting Dynamics of AgriculturalStructural Change and Urbanisationwithin European Rural Landscapes:Change Patterns and Policy ImplicationsJørgen Primdahla, Erling Andersena, Simon Swaffieldb & LoneKristensena
a Department of Geosciences and Natural Resource Management,University of Copenhagen, Denmark.b School of Landscape Architecture, Lincoln University, NewZealand.Published online: 09 May 2013.
To cite this article: Jørgen Primdahl, Erling Andersen, Simon Swaffield & Lone Kristensen (2013)Intersecting Dynamics of Agricultural Structural Change and Urbanisation within European RuralLandscapes: Change Patterns and Policy Implications, Landscape Research, 38:6, 799-817, DOI:10.1080/01426397.2013.772959
To link to this article: http://dx.doi.org/10.1080/01426397.2013.772959
PLEASE SCROLL DOWN FOR ARTICLE
Taylor & Francis makes every effort to ensure the accuracy of all the information (the“Content”) contained in the publications on our platform. However, Taylor & Francis,our agents, and our licensors make no representations or warranties whatsoever as tothe accuracy, completeness, or suitability for any purpose of the Content. Any opinionsand views expressed in this publication are the opinions and views of the authors,and are not the views of or endorsed by Taylor & Francis. The accuracy of the Contentshould not be relied upon and should be independently verified with primary sourcesof information. Taylor and Francis shall not be liable for any losses, actions, claims,proceedings, demands, costs, expenses, damages, and other liabilities whatsoever orhowsoever caused arising directly or indirectly in connection with, in relation to or arisingout of the use of the Content.
This article may be used for research, teaching, and private study purposes. Anysubstantial or systematic reproduction, redistribution, reselling, loan, sub-licensing,systematic supply, or distribution in any form to anyone is expressly forbidden. Terms &

Conditions of access and use can be found at http://www.tandfonline.com/page/terms-and-conditions
Dow
nloa
ded
by [
Uni
vers
ity o
f W
inni
peg]
at 1
5:09
11
Sept
embe
r 20
14

Intersecting Dynamics of AgriculturalStructural Change and Urbanisation withinEuropean Rural Landscapes: ChangePatterns and Policy Implications
JØRGEN PRIMDAHL*, ERLING ANDERSEN*, SIMON SWAFFIELD** &LONE KRISTENSEN**Department of Geosciences and Natural Resource Management, University of Copenhagen, Denmark**School of Landscape Architecture, Lincoln University, New Zealand
ABSTRACT European rural landscapes are, with few exceptions, characterised by farming andforestry as key functions. Whilst farming has been dominant historically and is still a significantdynamic in most regions, urbanisation is also a vital factor. This involves rural–urban emigra-tion, urban expansion and migration from cities into the countryside (counter-urbanisation). Aconceptual framework for the analysis and understanding of change patterns in European rurallandscapes is presented and then applied at two spatial scales. First, the combined effect on locallandscapes of agricultural structural changes and counter-urbanisation is analysed using datafrom two Danish case studies. Second, their expression at a wider European scale is exploredusing available regional statistics. Research and policy implications of the change patterns areidentified and discussed, highlighting data limitations and challenges of managing the organisa-tional and regulatory interface between local landscapes and international market policy institu-tions.
KEY WORDS: European landscapes, dynamic interrelationship, changing functions, structuraladjustment, counter-urbanisation
Introduction
Historically, the political and socio-economic factors shaping European landscapesexpress differentiation by region and by state—particularly in law and policy (Olwig,1996). Resulting rural landscapes also reflected natural conditions for agriculture anddifferent regional traditions of agriculture and forestry. However, cheap energy,combined with agricultural modernisation, to a large extent supported by the CommonAgricultural Policy (CAP) (or equivalent national policies), became important factorsreducing regional differences during the second half of the twentieth century (Jongman,2002). Over the past few decades, globalisation of finance and information (Harvey,2000) and creation of global systems of food production, processing and distribution
Correspondence Address: Jørgen Primdahl, Department of Geosciences and Natural Resource Management,University of Copenhagen, Rolighedsvej 23, Frederiksberg 1958, Denmark. Email: [email protected]
Landscape Research, 2013Vol. 38, No. 6, 799–817, http://dx.doi.org/10.1080/01426397.2013.772959
� 2013 Landscape Research Group Ltd
Dow
nloa
ded
by [
Uni
vers
ity o
f W
inni
peg]
at 1
5:09
11
Sept
embe
r 20
14

(Morgan et al., 2007; Watts & Goodman, 1997) have further synchronised the nature,extent, intensity, velocity, and impacts (Held et al., 1999) of rural landscape change.
However, despite the cross-cutting dynamics that affect rural landscapes, currentresearch on rural landscape change tends to fall into three broad areas of investigation,which each correspond with different public policy discourses concerning rurallandscapes: 1) analysis of landscape character, both cultural and biophysical, and itsimplications for landscape planning and protection (Fry et al., 2009; Pedroli et al.,2007; Wascher, 2005); 2) analysis of agricultural structural change and its socio-economic and landscape ecological consequences (Brouwer et al., 2008; Evans et al.,2002; Ilbery & Bowler, 1998); and 3) critique of urbanisation and counter-urbanisationprocesses and their implications for rural–urban relationships and periurban landscapes(Antrop, 2004; Busck et al., 2006; European Environment Agency, 2006; Wilson,2007). These different perspectives reflect contrasting disciplinary traditions and differ-ent public policy orientations, and are largely discrete realms of academic and policydiscourse. However, in order to understand and better manage rural landscape change inthe context of global trade and sustainability imperatives, and in order to implementlandscape specific imperatives such as the European Landscape Convention, it isnecessary to analyse and interpret the landscape effects of structural change inagriculture and urbanisation in combination.
This paper therefore asks the question: how are the complex dynamics at the intersec-tion of agricultural structural change and urbanisation expressed within European rurallandscapes? The analysis is undertaken at two scales: first at the local scale, with afocus on the agents who manage change, and second at the wider regional scale,focused on key indicators of change. At the local scale, agricultural landscapes areproduced, maintained and changed by farmers as the primary agent, and we analysehow different types of farmers are affecting two contrasting Danish landscapes. We usethe actions of full-time farmers as indicators of commercial imperatives for structuralchange, and hobby farmers as indicators of counter-urbanisation (Primdahl, 1999;Primdahl & Kristensen, 2011). In order to supplement this agent-focused analysis witha more general, structural investigation we also present a study of 168 Western andSouthern European regions in which we focus on patterns of intensive agriculture (andintensification) seen in relation to simple indicators of agricultural conditions and thedegree of urbanisation. The approach is exploratory (rather than hypothesis testing), andcombines both inductive and deductive elements of analysis (Overmars et al., 2007) inorder to analyse the intersecting dynamics at two spatial scales. Implications fordeveloping an integrated policy approach to the management of landscape change arethen briefly discussed.
Changing Agricultural Landscapes: Key Concepts and Analytical Framework
This section introduces concepts that underpin the investigation, and outlines twocomplementary frameworks of analysis. One focuses upon the conditions of agriculturalproduction and their relationship with urbanisation (Figure 1), the other on public policyand the farmer as a landscape manager (Figure 2).
Basic natural conditions for agricultural production include soil, water, drainage,terrain, and climate, which establish the suitability of landscapes for production (Tivy,
800 J. Primdahl et al.
Dow
nloa
ded
by [
Uni
vers
ity o
f W
inni
peg]
at 1
5:09
11
Sept
embe
r 20
14

1990). Conditions vary greatly in space. Their significance may also change over time,as technological innovation changes the opportunities to produce, and thus thecomparative advantage of different areas for agriculture (Munton, 1992). However, inthe long term and on the large spatial scale these conditions are relatively stable (setting
Poor conditions foragriculture
High levels of‘urbanisation’
Low levels of‘urbanisation’
Good conditions foragriculture
Figure 1. Two main drivers of agricultural landscapes – agriculture and urbanisation includingcounter urbanization and general influence of ‘urban’ investments and ‘urban’ values. (Modifiedfrom Primdahl and Swaffield 2010, p7).
Agricultural structural
developments
Sustainability policy agenda
Farmer as local agent
Producer-owner-citizen
Urbanisation (including counter-
urbanisation)
Land suitability Management
Local landscapes
Open market policy agenda
Figure 2. The two important policy agendas affecting rural landscape and the other key drivers.(Moderated from Primdahl and Swaffield 2010 with inspirations from Dwyer and Hodge 2001).
European Rural Landscapes: Change Patterns and Policy Implications 801
Dow
nloa
ded
by [
Uni
vers
ity o
f W
inni
peg]
at 1
5:09
11
Sept
embe
r 20
14

aside for the moment issues of long-term climate change). Most of the regions inEurope with good conditions for agriculture currently were also considered favourableregions a century ago (Grigg, 1974).
Intensity of production is a critical variable in determining the character of agricul-tural landscapes. It can be analysed in several dimensions, such as labour, capital,energy, stock units, inputs and outputs. Agricultural intensification occurs where there isneed or potential to increase production due to market changes and/or technologicalinnovations. Intensification has a range of consequences, particularly upon ecosystemsand biodiversity (Tilman et al., 2002). Extensification is the reverse process, in whichinputs to agriculture are reduced, often as a response to declining prices or as partof land retirement (Brouwer et al., 2008). One key feature of the current phase ofglobalisation of agricultural systems is the intensification of particular systems in partic-ular types of location, and the counter trend of extensification in others (Pinto-Correia,2010; Primdahl, 2010).
Urbanisation is a complex phenomenon which historically has been closely linked toagricultural development (Rosen & Tarr, 1994). Rural–urban migration is a dominantdriving force of urbanisation globally and remains significant even in developed coun-tries. Urbanisation competes for rural resources, as cities offer jobs, higher wages andsocial opportunity (Champion, 2001). This process has been documented in manymarginal regions of Europe and is a major public policy issue (Brouwer et al., 2008).Counter-urbanisation is an opposite movement of people and capital, as urban peoplemove to the country in search of a ‘rural’ lifestyle (Champion, 2001; Kontuly, 1998),for retirement, as commuters, or as IT-based home workers. Counter-urbanisation hasalso been well documented in Europe (Fielding, 1982), and can lead to ‘gentrification’of formerly agricultural settlements and increased part-time or ‘hobby’ farming (Buscket al., 2006; Primdahl, 1999). Here the challenge for landscape policy is different, butstill relates to changing agricultural function and landscape patterns, combined with theeffects of new development in rural settlements.
Urban expansion into formerly rural land as suburbs and new towns represents athird dimension of urbanisation (Antrop, 2004). Although the absolute land areaconverted to urban uses may not be large in proportion to the region as a whole, theeffects can be extensive, for example through land values. Introduction of urban relatedfunctions into rural areas such as water storage, transportation infrastructure, distributioncentres, high-tech factories and recreational facilities, all contribute to disorganised‘urban sprawl’ (European Environment Agency, 2006).
Figure 1 illustrates possible relationships between agricultural conditions andurbanisation. The vertical axis shows conditions for agriculture as a gradient from verygood (fertile, well drained soils with favourable climate and well functioning agricul-tural structures) to very poor (poor soils, unfavourable climate, inadequate structures orcombinations of these). The second axis indicates the proximity to urban centres,ranging from urban fringe to remote rural landscapes.
The ‘position’ of the regions in this matrix will—to a significant extent—frame thedynamics and change forces affecting landscape. However, these relationships are notpredetermined, as urbanisation and agricultural structural changes are not the onlychange factors of importance to agricultural landscapes. Rural communities also initiatechange (van der Ploeg et al., 2002). Furthermore, relationships between urban and rural
802 J. Primdahl et al.
Dow
nloa
ded
by [
Uni
vers
ity o
f W
inni
peg]
at 1
5:09
11
Sept
embe
r 20
14

areas are not geographically simple, with various dynamics typically expressed throughlayered networks (Murdoch, 2000).
Public Policy Agendas
The location of a region in the matrix of suitability and urbanisation and its characteris-tic intensity is more than a tool to compare and contrast regions. It is also an indicatorof needs and relevance of various public policy interventions that provide the regula-tory, incentive and ‘advisory’ frameworks for agricultural landscape change. Two setsof policies in particular affect rural landscapes in Europe. First, there is the CommonAgricultural Policy (CAP) and other market policies related to land, food and energy.The CAP is under reform through progressive decoupling of payments to farmers fromproduction, shifting support and incentives towards broader Rural DevelopmentProgramme goals. This shift is part of the obligations of Europe towards a wider marketpolicy promoted by the WTO framework (Potter, 2010). The CAP reform represents aliberalisation of the CAP, making European agricultural structure more open to marketconditions in an increasingly globalised economy, in which a significant proportion ofthe farms will have difficulty in competing. Reforms have also increased agri-environmental measures, which by 2002 covered about 25% of the total farmland inEU (European Environment Agency, 2005). Cross-compliance measures attached to thenew de-coupled direct payments mean that the CAP as a whole is getting greener.
The other critical policy settings affecting local rural landscapes come from thesustainability agenda (World Commission on Environment and Development, 1987).These aim at managing the environmental and landscape consequences of marketdynamics, technological developments, and urbanisation. Policies include the EuropeanLandscape Convention (ELC) and EU Environmental Directives. Whereas EU direc-tives represent the development of a strong regulatory framework at the Europeanlevel, the ELC (functioning through the European Council) is focused on local land-scapes as ‘perceived’ by people in their everyday life (Council of Europe, 2000). TheELC encourages the signatory countries to implement legislation and educationalpractices that raise awareness of well functioning and attractive landscapes, andinvolve people in policy and planning (Jones, 2007). At member state, provincial, andlocal levels, physical planning also belongs largely within the sustainability agenda—together with other national, regional and local environmental policies of variouskinds.
Whereas market policies are determined largely at EU level, sustainability policies aredesigned and implemented at all levels (Primdahl & Swaffield, 2010). CAP rural develop-ment programmes and cross-compliance requirements to some degree ‘bridge’ between themarket policy agenda and the sustainability agenda (Brouwer, 2004). However, although aclear majority of EU member states have signed the ELC there are no institutional linksbetween ELC and EU legislation. There are unrealised opportunities to develop an innova-tive, efficient and integrated (economically, socially and environmentally) landscape policydomain in Europe by better connecting the CAP, EU environmental directives, and theELC—particularly if the EU itself decides to sign the convention (Jones et al., 2007). Suchinstitutional combinations could continue the long European tradition of combining territo-rial policies with market policies, in contrast with the more sectoral policy approach torural landscape in many new world countries such as the US, Australia and New Zealand.
European Rural Landscapes: Change Patterns and Policy Implications 803
Dow
nloa
ded
by [
Uni
vers
ity o
f W
inni
peg]
at 1
5:09
11
Sept
embe
r 20
14

The farmer is the key local agent in landscape change (Kristensen et al., 2004).Although corporate farming and investment in agricultural land by non-farmers isincreasing worldwide (Morgan et al., 2007; Nassauer, 2010) the European farmerremains the central figure shaping local rural landscape change. He or she functions asa landscape manager through three distinct roles: as producer, property owner and citi-zen (Primdahl, 2010). As a producer a farmer makes decisions concerning crop andlivestock farming practices which are crucial for the ecological condition of landscape.As a property owner the farmer decides on major and longer-term changes of land use,and upon the future of non-productive landscape elements. In situations where producerand owner are different persons it is typically the owner who is legally responsible formanaging change linked to ‘landscape legislation’ such as nature conservation, land useand planning law. Finally, the farmer is also a citizen, a member of a local community,and in this role may participate in various collective decisions relating to landscape.Figure 2 illustrates relationships between the two main policy agendas and the farmeras agent in responding to diverse drivers of change. It highlights the need to incorporatea range of considerations in interpreting landscape change at the intersection of differentpolicy agendas and different functional drivers.
The following sections present empirical analyses framed by the two models (Figure 1and 2), starting at the local level with a focus on the farmer as landscape manager.
Rural Landscape Changes: Current Change Patterns in Two Danish Areas
Agricultural functions, socio-economic characteristics of farmers and indicators of land-scape change for two agricultural landscapes in Denmark have been analysed over theperiod 1995/1996–2008. The Hvorslev area is characterised by relatively good agricul-tural conditions (typical for eastern Denmark). Sønder Omme is dominated by sandysoils representing relatively poor conditions. Both areas are located between 30 and 50km from urban centres. Table 1 summarises their changing functional characteristics.Key indicators include land area, land tenure (owned, leased), the type of farmer(full-time, part-time, etc.) and stock density.
The first notable feature is that the proportion of full-time farmers is declining in bothcases, in line with wider structural changes in Danish agriculture that concentrateproduction on fewer and bigger full-time farms. However, this common trend disguisestwo different patterns of change. In Sønder Omme the share of land owned by full-timefarmers declined by nearly a quarter 1995/1996–2008, whilst that owned by part-timeand hobby farmers increased. In terms of ownership therefore, urban interests havebecome more significant. However, the area of land leased by full-time farmers and thenumber of farmers with leasehold land have both increased, indicating that part-timeand hobby farmers are actually farming their own land less than in the mid-1990s. Thatis, on the less favoured land, a greater proportion of the land is being managed by full-time farmers, even though it may be owned by others. This may indicate an increasingscale of farming operations in order to remain viable on the poorer soils and isexpressed in stock numbers: cattle density has been stable but a change has taken placefrom dairy production to less labour-intensive beef production. Pig density hasincreased, but still remains much lower than on the better soils in the Hvorslev area,and horse density has increased, reflecting the lifestyle choices of the hobby farmers.
804 J. Primdahl et al.
Dow
nloa
ded
by [
Uni
vers
ity o
f W
inni
peg]
at 1
5:09
11
Sept
embe
r 20
14

In Hvorslev on better soils the proportion of land owned by full-time farmers hasalso decreased, whereas the share of land belonging to hobby farmers and part-timershas increased indicating that hobby farmers are buying more land from pensioners (andother farmers who sell) than do full-time farmers. Furthermore, the figures indicatecontinuing specialisation and concentration of production, with fewer farmers havinglivestock, a decline in the number of cattle (all types) and pigs.
The different trends in husbandry may indicate different adaptation strategies to risingland prices (driven by urbanisation) and greater price competition in agriculturalcommodities (from market liberalisation). On poorer soils full-time farmers respond byexpanding the scale of their operations, and in so doing also provide a form of‘management service’ for the hobby farmers. On better soils they may intensify produc-tion within the given area, but this area is going down, together with the overallhusbandry production.
In terms of landscape change, the proportion of arable land has declined in bothareas—more so on the lower suitability land in Sønder Omme. Land formerly in rota-tion has converted to permanent grassland, forest or just been abandoned (Table 2). It ismainly hobby and pensioner farmers who convert arable land into more extensive uses,in contrast to the full-time farmers who are intensifying. This is also expressed in otherlandscape changes, as full-time farmers remove more hedgerows than they are establish-ing. On the higher suitability land in Hvorslev, all farmer types have established more
Table 1. Development of agriculture and socio-economic characteristics of farmers in SønderOmme and Hvorslev in the period 1995/96-2008
Sønder Omme Hvorslev
1995 2008 1996 2008
Size of area included in the interview, ha 5102 3975 12636 11314Agricultural property, numbers 168 132 591 382Average size of the agricultural property, ha 30 30 21 30Land leased out, % (percentage of owned land) 19 26 16 16Share of farmers with land leased out, % 37 50 34 37Cattle density, number per 100 ha 65 67 60 32Pig density, number per 100 ha 72 80 572 558Horse density, numbers per 100 ha 2,1 4,8 4,2 4,3Farmers without any husbandry, % 49 59 32 56Farmer types (F)a and their share of land (L), % F L F L Fb L Fb L- full-time (35) (42) 12 32 27 51 15 49- part-time (7) (9) 11 14 3 4 6 8- hobby (38) (30) 55 39 43 25 53 26- pensioners (17) (14) 19 13 23 17 25 15- others (4) (5) 3 3 3 3 1 2
aFor Sønder Omme in 1995 the definition of the farmer type was based on the farmer’s own per-ception (figures in bracket). For Hvorslev in 1996 and the 2008 survey the famer type was basedon a fixed definition: Full-time = no additional income, part-time = 50% or less than 50% ofincome from outside farming, hobby = more than 50% of the income from outside farming. Theincome is only based on farmer’s income, not on the household income.bX2 test for the Fb column cells (distribution among farm types and change over time): p <0.001. As the definition for farmer types in the Sdr. Omme area differ in the two years a test hasnot been carried out for this area.
European Rural Landscapes: Change Patterns and Policy Implications 805
Dow
nloa
ded
by [
Uni
vers
ity o
f W
inni
peg]
at 1
5:09
11
Sept
embe
r 20
14

permanent landscape elements than they have removed, and there is also a clear ten-dency that hobby farmers are much more active than full-time farmers in undertakinglandscape change, both by taking land out of rotation and in establishing new hedge-rows (measured per land unit).
In sum, these detailed studies indicate that the rural landscape is changing as a resultof both agricultural structural developments and urbanisation processes, working incombination. Full-time farmers are intensifying production on higher suitability land,and enlarging the scale of operations on lower suitability land. The process is influ-enced by the increasing number of hobby and part-time farmers who typically bringurban capital and incomes, and are increasingly significant as land owners, and alsobring urban ideals of country living which they express through landscape enhancementand increasing numbers of horses for recreation.
Regional Change Patterns in Western European Rural Landscapes
In this section we shift the scale of analysis. Using the framework outlined in Figure 1,the intensity of agricultural production in Western and Southern Europe is analysed at aregional scale in relation to the level of urbanisation and suitability for agriculturalproduction in each region. The analyses cover the regions of EU-15; that is, the15 Member States of the Union before the enlargement in 2004. The regions are
Table 2. Landscape changes in Sønder Omme and Hvorslev in the period 1995/96-2008
Farmer type LocationChange of land in
rotationa (%)Change inhedgerows
Landscapeindexb
Estab. Removed Estab. Removed
Ha or m change/100 ha/yearFull-time Hvorslev -0.1 15 2 0.16 0.04
SønderOmme
0.5 51 68 0.27 0.26
Part-time Hvorslev -2.4 38 13 0.51 0.07SønderOmme
-5.4 77 43 0.32 0.18
Hobby Hvorslev -6.2 70 11 1.07 0.18SønderOmme
-17.2 64 27 0.94 0.30
Pensioners Hvorslev -6.8 8 4 1.07 0.17SønderOmme
-12.6 20 22 0.38 0.22
Others Hvorslev 0.3 0 0 0.07 0.04SønderOmme
-13.3 47 108 0.68 0.61
All areas (Δ %)Total, ha
Hvorslev (-3.1) -215 30 5 0.46 0.10SønderOmme
(-8.0) -214 56 44 0.56 0.27
aIf there has been an increase in the total amount of permanent grassland, forest and nature area,the share of land in rotation has declined and vice versa.bAn index reflecting the overall changes of uncultivated landscape elements (hedgerows, ponds,woodlots, permanant grasslands etc) recorded at the farm level – the higher the index, the morechanges.
806 J. Primdahl et al.
Dow
nloa
ded
by [
Uni
vers
ity o
f W
inni
peg]
at 1
5:09
11
Sept
embe
r 20
14
administrative regions, municipalities, counties, countries, etc., in most cases theso-called level 2 in the common European Nomenclature of Units for Territorial Statis-tics (Eurostat, 2010). The analysis was limited to the EU-15 due to data limitations andthe figures therefore reflect trends in Western Europe only and do not include the newmember states in Central and Eastern Europe, where agricultural land and enterpriseshave been re-privatised in recent decades.
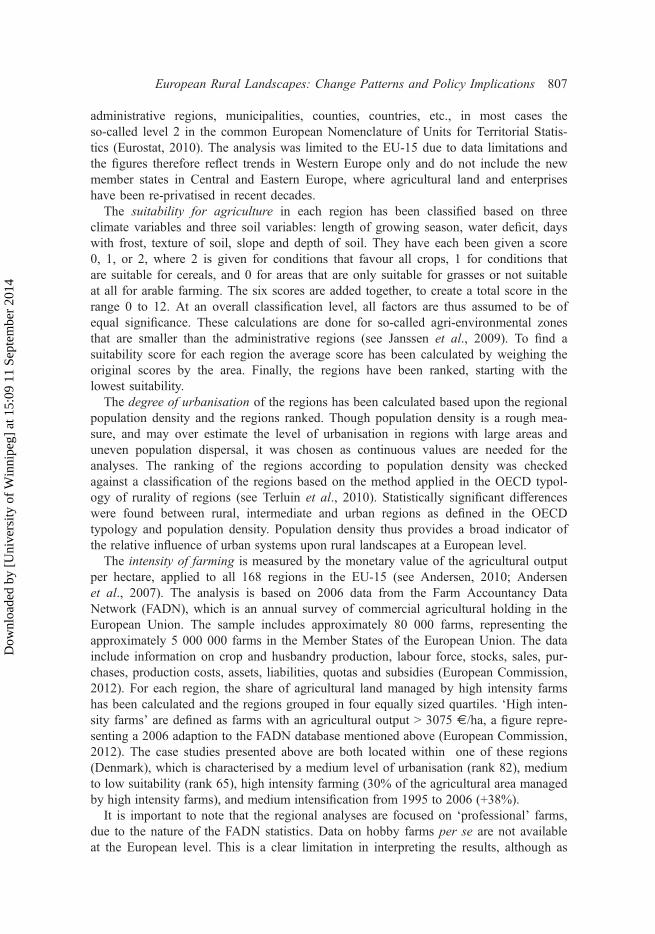
The suitability for agriculture in each region has been classified based on threeclimate variables and three soil variables: length of growing season, water deficit, dayswith frost, texture of soil, slope and depth of soil. They have each been given a score0, 1, or 2, where 2 is given for conditions that favour all crops, 1 for conditions thatare suitable for cereals, and 0 for areas that are only suitable for grasses or not suitableat all for arable farming. The six scores are added together, to create a total score in therange 0 to 12. At an overall classification level, all factors are thus assumed to be ofequal significance. These calculations are done for so-called agri-environmental zonesthat are smaller than the administrative regions (see Janssen et al., 2009). To find asuitability score for each region the average score has been calculated by weighing theoriginal scores by the area. Finally, the regions have been ranked, starting with thelowest suitability.
The degree of urbanisation of the regions has been calculated based upon the regionalpopulation density and the regions ranked. Though population density is a rough mea-sure, and may over estimate the level of urbanisation in regions with large areas anduneven population dispersal, it was chosen as continuous values are needed for theanalyses. The ranking of the regions according to population density was checkedagainst a classification of the regions based on the method applied in the OECD typol-ogy of rurality of regions (see Terluin et al., 2010). Statistically significant differenceswere found between rural, intermediate and urban regions as defined in the OECDtypology and population density. Population density thus provides a broad indicator ofthe relative influence of urban systems upon rural landscapes at a European level.
The intensity of farming is measured by the monetary value of the agricultural outputper hectare, applied to all 168 regions in the EU-15 (see Andersen, 2010; Andersenet al., 2007). The analysis is based on 2006 data from the Farm Accountancy DataNetwork (FADN), which is an annual survey of commercial agricultural holding in theEuropean Union. The sample includes approximately 80 000 farms, representing theapproximately 5 000 000 farms in the Member States of the European Union. The datainclude information on crop and husbandry production, labour force, stocks, sales, pur-chases, production costs, assets, liabilities, quotas and subsidies (European Commission,2012). For each region, the share of agricultural land managed by high intensity farmshas been calculated and the regions grouped in four equally sized quartiles. ‘High inten-sity farms’ are defined as farms with an agricultural output > 3075 e/ha, a figure repre-senting a 2006 adaption to the FADN database mentioned above (European Commission,2012). The case studies presented above are both located within one of these regions(Denmark), which is characterised by a medium level of urbanisation (rank 82), mediumto low suitability (rank 65), high intensity farming (30% of the agricultural area managedby high intensity farms), and medium intensification from 1995 to 2006 (+38%).
It is important to note that the regional analyses are focused on ‘professional’ farms,due to the nature of the FADN statistics. Data on hobby farms per se are not availableat the European level. This is a clear limitation in interpreting the results, although as
European Rural Landscapes: Change Patterns and Policy Implications 807
Dow
nloa
ded
by [
Uni
vers
ity o
f W
inni
peg]
at 1
5:09
11
Sept
embe
r 20
14

noted in the previous section, there is frequently a close functional connection betweenthe so-called hobby farms and adjoining ‘professional’ farms, through land beingleased, or other arrangements. Notwithstanding the limitation, several features stand out:1) the majority of European regions (64%) are characterised by a combination of eitherhigh agricultural suitability and high degrees of urbanisation or low suitability and lowdegrees of urbanisation (the zones in the upper right or lower left of Figure 3); 2)proportionally fewer regions have high urbanisation and low suitability (bottom right),or high suitability and low urbanisation (upper left), confirming the close historicalassociation of urbanisation with better soils; 3) although the majority of regions lie onthe urbanisation–suitability axis described above, there are regions in all four classes ofintensity present across all urbanisation and suitability rankings, illustrating the widerange of combinations of regional landscape conditions; 4) most regions with a highproportion of intensive farming also have high ranking of both urbanisation and ofsuitability (68% of that category, see Table 3); 5) most regions with a lower share ofintensive agriculture also have a low suitability and/or a low urbanisation ranking(upper left of Figure 3).
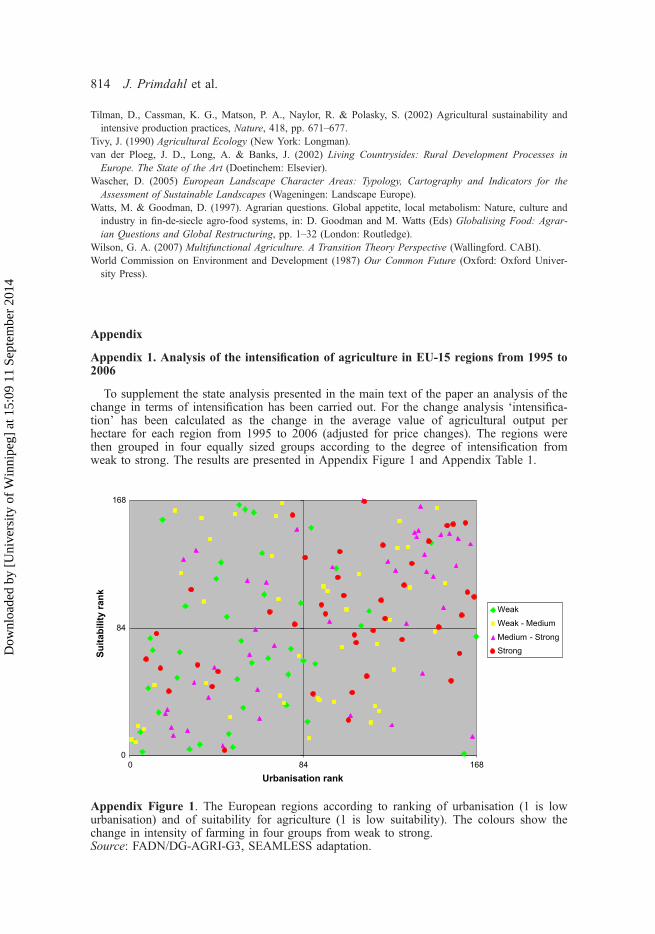
To supplement the statistical analysis presented here an analysis of change trends interms of rates of intensification has been undertaken (see Appendix 1). Four observa-tions can be made: 1) a majority of regions have intensified over the study period; 2) amedium level of suitability for production appears to be a necessary precondition forstrong intensification; 3) the highest rates of intensification are also associated withhigher levels of urbanisation. However, high levels of urbanisation are not a necessary
Figure 3. The European regions according to ranking of urbanisation (1 is low urbanisation) andof suitability for agriculture (1 is low suitability). The colours show the share of the agriculturalarea in the region managed by high intensity farms in four groups from low to high. Source:FADN/DG-AGRI-G3, SEAMLESS adaptation. (See online colour version for full interpretation).
808 J. Primdahl et al.
Dow
nloa
ded
by [
Uni
vers
ity o
f W
inni
peg]
at 1
5:09
11
Sept
embe
r 20
14

precondition for strong intensification; 4) regions that experience the weakestintensification are most likely to have lower levels of urbanisation, although there areexceptions.
It is difficult to find distinct spatial patterns at a European level in the results. Forexample, the Italian regions are placed in all four quadrants combining urbanisation andsuitability (Figure 3), in three of the four the intensity of farming classes of Table 3,and in all four intensification classes in the analyses in Appendix 1. The results forFrance, United Kingdom and Sweden are similar. This indicates a very diverse patternacross the territory of EU-15 regarding both the urbanisation, suitability and the inten-sity and change processes of farming. Further details on the results for the individualregions are presented in Appendix 2.
The absence of hobby farmers in the statistics means the data presented in Appendix1 is likely to be distorted in regard to changes in intensity in respect to area—or totalland use within the regions. Nonetheless, at a European level, changes in productionintensity, and hence in rural landscape character, are clearly being driven by a combina-tion of structural change (due to more open market policies and the reform of CAP),and various forces of urbanisation (including counter-urbanisation).
Discussion of Results
The detailed case studies showed the dynamics of structural change and urbanisation intwo different types of landscape. In the area with good conditions there is a tendencyfor full-time farmers to concentrate and specialise as part of agricultural structuraladjustments, with relatively few impacts on the landscape pattern. A counter-urbanisation process is also evident with clear landscape impacts, as hobby farmersextensify land use and establish new landscape elements such as hedgerows, ponds,wood lots, etc., to a much larger degree than full-time farmers. In the area with moremarginal land there are also indications of counter-urbanisation and clear differencesbetween the ‘landscape practices’ of full-time and hobby/part-time farmers. Despite therelatively poor conditions there is some indication of intensification among full-timefarmers through increased stock numbers and expansion of operations on leased land
Table 3. The share of the regions in the different groupings of intensity of agriculture combinedwith the different groups of ranking of urbanisation and suitability (the squares in Figure 3)
% of agricultural area inhigh intensity farming, byquartile
LowUrbanisation/
LowSuitability
LowUrbanisation/
HighSuitability
HighUrbanisation/
LowSuitability
HighUrbanisation/
HighSuitability
No. ofregions
< 5.4 33 47 17 9 425.4 - 14.3 30 27 20 22 4214.3 - 27.7 19 17 47 24 42> 27.7 19 10 17 44 42No. of regions = 100% 54 30 30 54 168
X2 test: p< 0.001Source: FADN/DG-AGRI-G3, SEAMLESS adaptation
European Rural Landscapes: Change Patterns and Policy Implications 809
Dow
nloa
ded
by [
Uni
vers
ity o
f W
inni
peg]
at 1
5:09
11
Sept
embe
r 20
14

rather than with more intensive arable farming. In both areas the agricultural landscapeis becoming more multifunctional, with functions related to rural living, recreation andhabitat management gaining importance, as part of counter-urbanisation processes.
Exploratory analyses of change at a regional level indicate that higher levels ofagricultural production intensity are most prevalent in regions with high urbanisationand high land suitability. Lower levels are associated with low urbanisation and/or lowsuitability. Much of this can probably be attributed to historical legacy. However, it isalso notable that the highest rates of landscape change due to intensive agriculture aremost likely to be in the regions that have both medium to high suitability for agricul-ture, and high levels of urbanisation. Conversely, change due to extensification isconcentrated in regions with lower levels of urbanisation, and particularly with acombination of low urbanisation and low suitability.
As noted previously, the observations must be qualified by the use of the relativelysimple indicator for urbanisation (due to lack of data on this issue at the Europeanlevel). When combined with great variations in the geographical size of the regionsthere may be significant internal variations in regions that have the same or similarurbanisation scores, and the figures must be interpreted with this limitation in mind.Furthermore, while the statistics behind the regional analysis of changes in intensifica-tion may be representative concerning farm business activities (seen from a strictsectoral point of view), they are unlikely to fully represent developments in land useand landscape management, since hobby and part-time farmers are—from a land usepoint of view—heavily underrepresented, and since they are unlikely to have the sametypes of landscape practices as the full-time farmer. The detailed studies in Denmarkclearly showed that hobby farmers and full-time farmers have very different landscapemanagement practices. The regional analysis of intensification in production is thereforelikely to be significantly distorted concerning the validity of the data in respect to landuse, and the results are consequently shown as an appendix rather than in the mainpaper. Despite these data limitations, the analyses clearly express the importance ofstructural change and urbanisation working in combination as change drivers in rurallandscapes.
Research and Policy Implications
There are several implications for further research. First, improved understanding of thechange pressures on rural landscapes needs an analysis of the interrelationship betweendifferent dynamics of change (in this case, structural adjustment and urbanisation), aswell as investigation of the dynamics themselves. There would be significant benefit inundertaking more systematic factorial analyses of the data presented here. Second, thereis a need to investigate how these interrelationships are expressed in different typesof region. The diversity of European regions was evident in the spread of plots onFigure 3, and analyses are needed into the different conditions expressed. Third, thereis a need to improve the agricultural statistics on a European level, so hobby farmersand pensioners are not excluded (or severely underrepresented). Fourth, micro-scaleanalyses have been valuable to tease out the specific processes at work, and should beundertaken for cases that represent the full range of possibilities, so the limitationsdiscussed above can be dealt with more systematically.
810 J. Primdahl et al.
Dow
nloa
ded
by [
Uni
vers
ity o
f W
inni
peg]
at 1
5:09
11
Sept
embe
r 20
14

There are also a number of policy implications. In reviewing the intersection of themarket and sustainability agendas within developed countries, Primdahl and Swaffield(2009) questioned the assumption that these agendas are necessarily compatible, andidentified several different policy challenges, depending upon the type of landscapeinvolved, expressed in terms of agricultural intensity and urbanisation. The challengesthey identified resonate with the patterns and trends identified in this analysis.
First, in intensive production landscapes strongly connected to international markets,the policy challenge is to find better ways to ensure that soil, water and biodiversityresources are adequately protected against the unintended effects of intensification—orrestored in case of damage to vital resources. Second, in regions with poor conditions,a key challenge is how to sustain biodiversity and other values associated withextensive farming in the face of the marginalisation and abandonment of farming prac-tices. Hitherto, support has been provided through stewardship schemes and other ruraldevelopment measures, but rising public debt levels may constrain the extent of urbansupport for these types of approach in the future. A challenge in this context is how tobuild community capacity to manage—in combination with incentives—non-productivelandscapes over the longer term. Third, in intensively managed landscapes near urbancentres the challenge is how to maintain the green/blue landscape infrastructure thatknits the production mosaic together, in the face of development pressures, and how tomanage the interface between production and urban uses. In lower intensity landscapesnear urban centres, favoured for their amenity quality, the challenge becomes how tomanage the interface between wealthy hobby farmers and the adjoining urbanpopulations.
There are two common themes across these different situations. The first is thecontinuing role of the farmer as a local agent, and how to strengthen his/her contribu-tion as a citizen, in the face of competing pressures upon their management and landowner roles. As a manager, the continuing pressure of price competition, decliningsupport payments and rising energy costs will increasingly constrain the flexibility toundertake significant stewardship functions. This will be further constrained by morecorporate ownership structures. As land owners, farmers also face a situation whereland prices typically exceed the values justified by production. Exercising responsiblecitizenship in these circumstances is both challenging and necessary.
The other common theme has been the diversity of European regions in respect tothe way the different dimensions of suitability, urbanisation and intensity of productionintersect, as this sets a challenge for governance and policy structure. There is a need tofind ways to achieve sufficient consistency across regions and countries to satisfycross-compliance requirements of global and European level agreements, whilstallowing sufficient flexibility to respond to the variable specifics of local landscapes, aspromoted by the European Landscape Convention.
Two further imperatives need consideration. The first relates to energy and climatechange, the policies for which must be designed with integration of concerns for theirlocal landscape impacts. They may reinforce land competition and intensification—butthey may also play a positive role in improving the economic conditions for ‘extensivemanagement’, when shrubs, grasses and other ‘natural’ biomass can be used in theso-called second generation production of biofuels.
The final imperative relates back to the opening paragraph of the paper. Theimplementation of landscape focused public policy imperatives such as the ELC has
European Rural Landscapes: Change Patterns and Policy Implications 811
Dow
nloa
ded
by [
Uni
vers
ity o
f W
inni
peg]
at 1
5:09
11
Sept
embe
r 20
14

provided major impetus for development of improved systems of landscape inventory,characterisation and monitoring, and promoted greater integration of ecological andcultural dimensions and indicators. The analysis of trends across European regions hashighlighted the dynamism of rural landscapes under the twin imperatives of structuraladjustment and urbanisation, and these dynamics are likely to be strengthened in thefuture. Hence tensions are likely to increase between, on the one hand, the desire forcontinuity of landscape identity in the rural hinterlands of the city regions acrossEurope (as expressed in the ELC), and on the other hand, the instability of alllandscapes in the face of structural change and urbanisation. Combining top-downapproaches with bottom-up community approaches becomes the primary policychallenge.
References
Andersen, E. (2010) Regional typologies of farming systems contexts. SEAMLESS Report no. 53, SEAM-LESS integrated project, EU 6th Framework Programme, contract no. 010036-2, ISBN no. 978-90-8585-596-5. Available at http://www.SEAMLESS-IP.org (accessed May 2011).
Andersen, E., Elbersen, B., Godeschalk, F. & Verhoog, D. (2007) Farm management indicators and farmtypologies as a basis for assessments in a changing policy environment, Journal of Environmental Manage-ment, 82(3), pp. 353–362.
Antrop, M. (2004) Landscape change and the urbanization process in Europe, Landscape and Urban Plan-ning, 67, pp. 9–26.
Brouwer, F. (Ed.) (2004) Sustaining Agriculture and the Rural Environment: Governance, Policy and Multi-functionality (Cheltenham: Edward Elgar).
Brouwer, F., van Reheenen, T. & Dhillion, S. S. (2008) Emerging perspectives on changing land managementpractices, in: F. Brouwer, T. van Reheenen, S. S. Dhillion & A. M. Elgersma (Eds) Sustainable Land Man-agement. Strategies to Cope with Marginalisation of Agriculture, pp. 237–246 (Cheltenham: Edward Elgar).
Busck, A. G., Kristensen, S. P., Praestholm, S., Reenberg, A. & Primdahl, J. (2006) Land system changes inthe context of urbanization: Examples from the periurban area of Greater Copenhagen, Danish Journal ofGeography, 106(2), pp. 21–34.
Champion, T. (2001) Urbanisation, suburbanisation, counterurbanisation and reurbanisation, in: R. Paddison(Ed.) Handbook of Urban Studies, pp. 143–161 (London: SAGE Publications).
Council of Europe (2000) European Landscape Convention and Explanatory Report (Strasbourg: The GeneralDirectorate of Education, Culture, Sport and Youth, and Environment).
Dwyer, J. & Hodge, I. (2001) The challenge of change: Demands and expectations for farmed land, in: T. C.Smout (Ed.) Nature, Landscape and People since the Second World War, pp. 117–134 (East Linton: Tuck-well Press).
European Commission (2012) FADN Webpage. Available at: http://ec.europa.eu/agriculture/rica/index.cfm(accessed February 2012).
European Environment Agency (2005) IRENA Indicator Fact Sheet, IRENA 1: Area Under Agri-EnvironmentSupport (Copenhagen: European Environment Agency).
European Environment Agency (2006) Urban Sprawl in Europe. The Ignored Challenge. Characteristics,Trends and Policy Challenges. EEA Report 10/2006 (Copenhagen: European Environment Agency).
Eurostat (2010) Introduction to the NUTS and the statistical regions of Europe. Available at: http://ec.europa.eu/eurostat/ramon/nuts/introduction_regions_en.html (accessed 17 May 2010).
Evans, N., Morris, C. & Winter, M. (2002) Conceptualizing agriculture: A critique of post-productivism as thenew orthodoxy, Progress in Human Geography, 26, pp. 313–323.
Fielding, A. J. (1982) Counterurbanisation in Western Europe, Progress in Planning, 17(1), pp. 1–52.Fry, G., Tveit, M.S., Ode, A. & Velarde, M. D. (2009) The ecology of visual landscapes: Exploring the con-ceptual common ground of visual and ecological landscape indicators, Ecological Indicators, 9, pp. 933–947.
Grigg, D. B. (1974) The Agricultural Systems of the World (Cambridge: Cambridge University Press).Harvey, D. (2000) Spaces of Hope (Edinburgh: Edinburgh University Press).
812 J. Primdahl et al.
Dow
nloa
ded
by [
Uni
vers
ity o
f W
inni
peg]
at 1
5:09
11
Sept
embe
r 20
14

Held, D., McGrew, A., Goldblatt, D. & Perraton, J. (1999) Global Transformation: Politics, Economics andCulture (Cambridge: Polity).
Janssen, S., Andersen, E., Athanasiadis, I. & Ittersum, M. K. (2009) A database for integrated assessment ofEuropean agricultural systems, Environmental Science & Policy, 12(5), pp. 573–587.
Ilbery, B. & Bowler, I. (1998) From agricultural productivism to post-productivism, in: B. Ilbery (Ed.) TheGeography of Rural Change, pp. 57–84 (Harlow: Longman).
Jones, M. (2007) The European Landscape Convention and the question of public participation, LandscapeResearch, 32(5), pp. 613–633.
Jones, M., Howard, P., Olwig, K., Primdahl, J. & Herlin, I. S. (2007) Multiple interfaces of the EuropeanLandscape Convention, Norwegian Journal of Geography, 61(4), pp. 207–216.
Jongman, R. H. G. (2002) Homogenisation and fragmentation of the European landscape: Ecological conse-quences and solutions, Landscape and Urban Planning, 58, pp. 211–221.
Kontuly, T. (1998) Migration into Rural Areas: Theories and Issues (New York: Wiley Blackwell).Kristensen, L. S., Thenail, C. & Kristensen, S. P. (2004) Landscape changes in agrarian landscapes in the1990s: The interaction between farmers and the farmed landscape, A case study from Jutland, Denmark,Journal of Environmental Management, 71, pp. 231–244.
Morgan, K., Marsden, T. & Murdoch, J. (2007) Worlds of Food: Place, Power, and Provenance in the FoodChain (Oxford: Oxford University Press).
Munton, R. (1992) Factors of production in modern agriculture, in: I. R. Bowler (Ed.) The Geography of Agri-culture in Developed Market Economies, pp. 56–84 (Harlow: Longman).
Murdoch, J. (2000) Networks—a new paradigm of rural development, Journal of Rural Studies, 16, pp. 407–419.Nassauer, J. I. (2010) Rural landscape change as a product of US Federal policy, in: J. Primdahl & S. R.Swaffield (Eds) Globalisation and Agricultural Landscapes: Change Patterns and Policy Trends in Devel-oped Countries, pp. 185–200 (Cambridge: Cambridge University Press).
Olwig, K. (1996) Recovering the substantive nature of landscape, Annals of Association of American Geogra-phers, 86, pp. 279–297.
Overmars, K. P., Verburg, P. H. & Veldkamp, T. A. (2007) Comparison of a deductive and inductive approachto specify land suitability in a spatially explicit land use model, Land Use Policy, 24, pp. 584–599.
Pedroli, B., van Doorn, A., de Blust, G., Paracchini, M. L., Wascher, D. & Bunce, F. (2007) Europe’s LivingLandscapes. Essays Exploring Our Identity in the Countryside (Wageningen: Landscape Europe/Zeist:KNNV Publishing).
Pinto-Correia, T. (2010) Rural landscape differentiation in the face of changing demands and policies: A typol-ogy of rural areas, in Portugal, in: J. Primdahl & S. R. Swaffield (Eds) Globalisation and AgriculturalLandscapes: Change Patterns and Policy Trends in Developed Countries, pp. 127–148 (Cambridge: Cam-bridge University Press).
Potter, C. (2010) Agricultural liberalisation, multifunctionality and the WTO: Competing agendas for thefuture of farmed landscapes, in: J. Primdahl & S. R. Swaffield (Eds) Globalisation and Agricultural Land-scapes: Change Patterns and Policy Trends in Developed Countries, pp. 17–30 (Cambridge: CambridgeUniversity Press).
Primdahl, J. (1999) Agricultural landscapes as places for production and for living in owner’s versus producer’sdecision making and the implications for planning, Landscape and Urban Planning, 46, pp. 143–150.
Primdahl, J. (2010) Globalisation and the local agricultural landscape: Current change patterns and public pol-icy interventions, in: J. Primdahl & S. R. Swaffield (Eds) Globalisation and Agricultural Landscapes:Change Patterns and Policy Trends in Developed Countries, pp. 149–167 (Cambridge: Cambridge Univer-sity Press).
Primdahl, J. & Swaffield, S. R. (2009) Globalisation and rural landscape change—key concepts, developmenttrends and some implications for policy, Portuguese Journal of Regional Studies, 20, pp. 87–99.
Primdahl, J. & Swaffield, S. R. (Eds) (2010) Globalisation and Agricultural Landscapes: Change Patternsand Policy Trends in Developed Countries (Cambridge: Cambridge University Press).
Primdahl, J. & Kristensen, L. (2011) The farmer as a landscape manager: Management roles and changepatterns in a Danish region, Danish Journal of Geography, 111(2), pp. 107–116.
Rosen, C. M. & Tarr, J. A. (1994) The importance of an urban perspective in environmental history, Journalof Urban History, 20(3), pp. 299–310.
Terluin, I. J., Verhoog, D. & Godeschalk, F. E. (2010) The use of regional typologies in the assessment of farms’performance, in: F. M. Brouwer & M. van Ittersum (Eds) Environmental and Agricultural Modelling: Inte-grated Approaches for Policy Impact Assessment (Dordrecht, Heidelberg, London and New York: Springer).
European Rural Landscapes: Change Patterns and Policy Implications 813
Dow
nloa
ded
by [
Uni
vers
ity o
f W
inni
peg]
at 1
5:09
11
Sept
embe
r 20
14
Tilman, D., Cassman, K. G., Matson, P. A., Naylor, R. & Polasky, S. (2002) Agricultural sustainability andintensive production practices, Nature, 418, pp. 671–677.
Tivy, J. (1990) Agricultural Ecology (New York: Longman).van der Ploeg, J. D., Long, A. & Banks, J. (2002) Living Countrysides: Rural Development Processes inEurope. The State of the Art (Doetinchem: Elsevier).
Wascher, D. (2005) European Landscape Character Areas: Typology, Cartography and Indicators for theAssessment of Sustainable Landscapes (Wageningen: Landscape Europe).
Watts, M. & Goodman, D. (1997). Agrarian questions. Global appetite, local metabolism: Nature, culture andindustry in fin-de-siecle agro-food systems, in: D. Goodman and M. Watts (Eds) Globalising Food: Agrar-ian Questions and Global Restructuring, pp. 1–32 (London: Routledge).
Wilson, G. A. (2007) Multifunctional Agriculture. A Transition Theory Perspective (Wallingford. CABI).World Commission on Environment and Development (1987) Our Common Future (Oxford: Oxford Univer-sity Press).
Appendix
Appendix 1. Analysis of the intensification of agriculture in EU-15 regions from 1995 to2006
To supplement the state analysis presented in the main text of the paper an analysis of thechange in terms of intensification has been carried out. For the change analysis ‘intensifica-tion’ has been calculated as the change in the average value of agricultural output perhectare for each region from 1995 to 2006 (adjusted for price changes). The regions werethen grouped in four equally sized groups according to the degree of intensification fromweak to strong. The results are presented in Appendix Figure 1 and Appendix Table 1.
0
84
168
0 84 168Urbanisation rank
Suita
bilit
y ra
nk
WeakWeak - MediumMedium - StrongStrong
Appendix Figure 1. The European regions according to ranking of urbanisation (1 is lowurbanisation) and of suitability for agriculture (1 is low suitability). The colours show thechange in intensity of farming in four groups from weak to strong.Source: FADN/DG-AGRI-G3, SEAMLESS adaptation.
814 J. Primdahl et al.
Dow
nloa
ded
by [
Uni
vers
ity o
f W
inni
peg]
at 1
5:09
11
Sept
embe
r 20
14

Appendix Table 1.The share of the regions in the different groupings of change in intensityof agriculture 1995 to 2006 combined with the different groups of ranking of urbanisationand suitability (the squares in Appendix Figure 1).
Change in intensity of farmingin %, by quartile
Lowurbanisation/
lowsuitability
Lowurbanisation/
highsuitability
Highurbanisation/
lowsuitability
Highurbanisation/
highsuitability
No. ofregions
Weak (Change – 40 – 27.4) 41 37 13 9 42Weak – Medium (27.4 – 42) 19 33 37 20 42Medium – Strong (42 – 59) 26 17 13 35 42Strong intensification (>59) 15 13 37 35 42No. of regions = 100% 54 30 30 54 168
Source: FADN/DG-AGRI-G3, SEAMLESS adaptationX2 test: p < 0.001.
Appendix 2. Specification of regions ranking and results
Appendix Table 2. Regions: Urbanisation rank, suitability rank, % of agricultural areamanaged by high intensity farms and intensification % from 1995 to 2006 in mentionedorder
Ovre Norrland: 1; 10; 2; 29 Niederosterreich: 55; 31; 10; 22 Braunschweig: 111; 119; 14;35
Pohjois-Suomi: 2; 9; 7; 27 Southern and Eastern: 56; 162;3; 12
Puglia: 112; 85; 23; -22
Mellersta Norrland: 3; 8; 0; 29 Centro (P): 57; 115; 5; 49 South West: 113; 168; 14; 59Ita-Suomi: 4; 19; 3; 38 Brandenburg: 58; 66; 1; 56 Zeeland: 114; 167; 73; 66Norra Mellansverige: 5; 15; 8;
27Andalucia: 59; 61; 8; 12 Cataluna: 115; 52; 17; 321
Aaland: 6; 2; 9; 27 Galicia: 60; 160; 30; -20 Alsace: 116; 95; 12; -5Lansi-Suomi: 7; 17; 4; 34 Languedoc-Roussillon: 61; 83;
21; 44Sachsen: 117; 21; 7; 29
Castilla-La Mancha: 8; 63; 2; 69 Sydsverige: 62; 43; 8; 53 Freiburg: 118; 82; 23; 59Smaaland med oarna: 9; 44; 5;
27Ionia Nisia: 63; 24; 29; 42 Mittelfranken: 119; 32; 17;
41Alentejo: 10; 77; 2; -2 Picardie: 64; 133; 2; 10 Hannover: 120; 73; 15; 35Extremadura: 11; 69; 1; -10 Lorraine: 65; 106; 0; 7 Oberbayern: 121; 29; 16; 41Aragon: 12; 46; 4; 35 Principado de Asturias: 66; 114;
27; 46Groningen: 122; 102; 61; 66
Castilla y Leon: 13; 80; 2; 105 Kentriki Makedonia: 67; 64; 21;-13
Flevoland: 123; 138; 76; 66
Dytiki Makedonia: 14; 28; 14;-13
Cantabria: 68; 94; 12; 95 Veneto: 124; 90; 34; 108
Corse: 15; 57; 7; 923 Trier: 69; 131; 10; 40 Prov. Liege: 125; 128; 28; 54Border, Midland and Western:
16; 155; 1; 12Umbria: 70; 72; 13; 52 East Midlands: 126; 89; 3;
29Sterea Ellada: 17; 27; 26; 54 Pays de la Loire: 71; 157; 9; 31 Stockholm: 127; 20; 15; 53Ipeiros: 18; 30; 36; 42 Luneburg: 72; 103; 29; 35 East Of England: 128; 56; 6;
29Valle dAosta/Vallee dAoste: 19;
42; 7; 233Oberpfalz: 73; 39; 19; 41 Pais Vasco: 129; 122; 7; 45
(Continued)
European Rural Landscapes: Change Patterns and Policy Implications 815
Dow
nloa
ded
by [
Uni
vers
ity o
f W
inni
peg]
at 1
5:09
11
Sept
embe
r 20
14

Appendix (Continued)
Peloponnisos: 20; 18; 32; 42 Bretagne: 74; 166; 22; 40Niederbayern: 75; 34; 16; 41
Rheinhessen-Pfalz: 130; 136;15; 40
Ostra Mellansverige: 21; 13; 4;53
Region de Murcia: 76; 33; 28;-40
North East: 131; 154; 2; 40
Limousin: 22; 161; 0; 33 Oberosterreich: 77; 53; 20; 22 Liguria: 132; 76; 43; 63Anatoliki Makedonia, Thraki:
23; 51; 13; -13Sachsen-Anhalt: 78; 70; 1; 23 Lazio: 133; 112; 25; 193
Auvergne: 24; 68; 1; -4 Northern Ireland: 79; 158; 7; 65 Detmold: 134; 87; 34; 51Bourgogne: 25; 120; 0; 40 Abruzzo: 80; 86; 24; 68 Nord - Pas-de-Calais: 135;
137; 13; 39Champagne-Ardenne: 26; 129;
2; 52Prov. Namur: 81; 149; 36; 54 Yorkshire and Humber: 136;
110; 6; 40Thessalia: 27; 98; 22; -26 Danmark: 82; 65; 30; 38 Overijssel: 137; 126; 80; 66Voreio Aigaio: 28; 16; 58; 54 Calabria: 83; 100; 27; 18 Prov. Brabant Wallon: 138;
147; 27; 54Tirol: 29; 4; 15; 22 Rhone-Alpes: 84; 62; 7; -11 Prov. Limburg (B): 139; 144;
33; 54Notio Aigaio: 31; 48; 52; 54 Vorarlberg: 86; 22; 25; 22 Prov. West-Vlaanderen: 141;
164; 36; 54Prov. Luxembourg (B): 32; 135;
4; 54Thuringen: 87; 11; 5; 31 Stuttgart: 142; 54; 15; 59
Comunidad Foral de Navarra:30; 109; 7; 253
Wales: 85; 130; 5; 92 Prov. Hainaut: 140; 148;33; 54
La Rioja: 33; 59; 32; 156 Haute-Normandie: 88; 150; 2;27
Munster: 143; 132; 37; 51
Karnten: 34; 7; 21; 22 Kassel: 89; 40; 6; 61 Karlsruhe: 144; 121; 12; 59Midi-Pyrenees: 35; 156; 4; 28 Provence-Alpes-Cote dAzur:
90; 60; 23; 27Gelderland: 145; 141; 88; 66
Basilicata: 36; 101; 10; 36 Oberfranken: 91; 37; 15; 41 Saarland: 146; 140; 1; 17Vastsverige: 37; 47; 1; 27 Unterfranken: 92; 36; 10; 41 West Midlands: 147; 118; 10;
59Etela-Suomi: 38; 38; 3; 48 Toscana: 93; 99; 17; 92 Lombardia: 148; 81; 47; 33Centre: 39; 142; 1; 30 Marche: 94; 111; 7; 35 South East: 149; 163; 9; 29Scotland: 40; 45; 0; 112 Friuli-Venezia Giulia: 95; 93;
26; 80Campania: 150; 84; 35; 404
Dytiki Ellada: 41; 58; 37; 42 Weser-Ems: 96; 108; 24; 35 Prov. Oost-Vlaanderen: 151;145; 44; 54
Poitou-Charentes: 42; 116; 5; 15 Piemonte: 97; 88; 21; 42 Arnsberg: 152; 97; 33; 51Sardegna: 43; 55; 10; 146 Norte: 98; 124; 7; 49 North West: 153; 113; 14; 40Franche-Comte: 44; 127; 1; 22 Schwaben: 99; 35; 25; 41 Noord-Brabant: 154; 151; 79;
66Kriti: 45; 6; 22; 54 Schleswig-Holstein: 100; 123;
15; 25Prov. Vlaams-Brabant: 155;146; 29; 54
Bolzano/Bozen/Trento: 46; 3; 8;105
Luxembourg (Grand-Duche):101; 117; 4; 74
Darmstadt: 156; 49; 8; 61
Molise: 47; 91; 9; -22 Drenthe: 102; 134; 79; 66 Limburg (NL): 157; 152; 76;66
Steiermark: 48; 14; 29; 22 Koblenz: 103; 71; 15; 40 Koln: 158; 125; 38; 51Mecklenburg-Vorpommern: 49;
25; 3; 37Friesland: 104; 105; 73; 66 Prov. Antwerpen: 159; 143;
32; 54Salzburg: 50; 5; 8; 22 Emilia-Romagna: 105; 96; 28;
30Comunidad de Madrid: 160;67; 1; 678
Aquitaine: 51; 159; 13; 28 Illes Balears: 106; 23; 11; 67 Utrecht: 161; 92; 56; 66Burgenland: 52; 50; 18; 22 Comunidad Valenciana: 107;
26; 33; 48Ile de France: 162; 1; 2; 3
(Continued)
816 J. Primdahl et al.
Dow
nloa
ded
by [
Uni
vers
ity o
f W
inni
peg]
at 1
5:09
11
Sept
embe
r 20
14

Appendix (Continued)
Basse-Normandie: 53; 165; 5;14
Sicilia: 108; 41; 20; 69 Lisboa e Vale do Tejo: 163;153; 17; 180
Algarve: 54; 75; 5; -2 Giessen: 109; 79; 2; 61 Noord-Holland: 164; 107;76; 66
Tubingen: 110; 74; 17; 59 Dusseldorf: 165; 139; 32; 51Attiki: 166; 12; 59; 54Zuid-Holland: 167; 104; 61;66
European Rural Landscapes: Change Patterns and Policy Implications 817
Dow
nloa
ded
by [
Uni
vers
ity o
f W
inni
peg]
at 1
5:09
11
Sept
embe
r 20
14