interpreting pump performance curves - chemical engineering
TRANSCRIPT

INTERPRETING PUMP PERFORMANCE CURVES
INTRODUCTION
Pump manufacturers provide pump performance curves (also known as “pump fl ow curves” or just “pump curves”) to assist users in the selection, testing, operation and maintenance of pumps. But not all performance curves are created equally, and each manufacturer may have different formats. Despite the differences, the common understanding of pump performance curves is they provide an expectation of certain performance levels under specifi c operating conditions. This information is essential for design engineers as they attempt to source and select the best pump for their system.
PUMP TERMS
Before explaining the specifi cs of performance curves, it helps to understand the terms used:
Gauge Pressure – a measure of pressure relative to ambient atmospheric pressure and commonly reported in pounds per square inch gauge (psig) or bar gauge (bar g).
Flow rate – the volume of fl uid fl owing through an area over a standard period of time; commonly reported in Liters per minute (L/min).
Atmospheric pressure – measured by a barometer and reported in the standard atmosphere unit: atm; it is the measurement of the force exerted by Earth’s atmosphere.
Vacuum – a measure determined by the pressure differential between an evacuated system and the surrounding atmosphere; commonly reported in inches of mercury (inHg), millimeters of mercury (mmHg) or millibar (mbar).
PUMP PERFORMANCE CURVE DETAILS
A performance curve illustrates the expected performance capabilities across the rated pressure range. Typically, pump performance is plotted on a graph with an x-axis showing pressure and a y-axis showing fl ow rate. The vertical line down the center of the graph represents atmospheric pressure and divides the graph into segments of vacuum and pressure. Vacuum, on the left of the center line, is measured in mbar or inHg. Pressure, on the right of the center line, is measured in psig or bar. The point of intersection between the two curves indicates the maximum fl ow or free fl ow of that pump when operating without
AN IMPORTANT STEP IN MATCHINGF THE RIGHT PUMP TO AN APPLICATION
Example of a pump manufacturer's performance curve sheet
Interpreting Pump Performance Curves.indd 1 8/24/2020 2:29:44 PM

KNF Neuberger Inc. ■ 2 Black Forest Rd, Trenton, NJ 08691 ■ 609-890-8600 ■ [email protected] ■ www.knf.com/en/us
Rev
: Aug
ust
2020
restrictions (see Figure 1). The end points of each curve represent the pump’s respective maximum capabilities for vacuum or pressure.
USING VACUUM AND PRESSURE TEST CONDITIONS TO INTERPRET A FLOW CURVE
In the following sample scenarios, a typical performance curve can be created by measuring simulated pressure and vacuum test conditions. The vacuum test condition utilizes the pump, gauge and fl ow meter confi guration shown in the schematic of Figure 2. The free fl ow rate of this example pump is measured at approximately 6 L/min., as shown previously in Figure 1.
When the valve on the inlet side of the pump is closed to a vacuum gauge reading of 550 mbar, the pump curve can be referenced to predict an expected fl ow rate
of approximately 2.1 L/min. This fl ow rate predication is found by drawing a vertical line up from the 550 mbar data point on the left segment of the x-axis until the fl ow curve is intersected. From that intersection, a horizontal line
is drawn to the y-axis with an intersection point of about 2.1 L/min (see Figure 3).
The pressure test condition is measured by utilizing the equipment confi guration shown in Figure 4. When the valve on the outlet side of the pump is closed to a pressure gauge reading of 22.5 psig, the fl ow rate of the pump is expected to drop off from the free fl ow rate of 6 L/min.
Figure 1: Typical diaphragm pump performance curve with free fl ow identifi ed
Figure 2: Vacuum test condition schematic
Figure 3: Vacuum test condition fl ow rate prediction
Interpreting Pump Performance Curves.indd 2 8/24/2020 2:29:52 PM

KNF Neuberger Inc. ■ 2 Black Forest Rd, Trenton, NJ 08691 ■ 609-890-8600 ■ [email protected] ■ www.knf.com/en/us
Rev
: Aug
ust
2020
A vertical line is drawn up from the 22.5 psig data point on the right segment of the x-axis to the point of intersection with the fl ow curve. A horizontal line is then drawn from that point of intersection to the y-axis where a fl ow rate of approximately 2.3 L/min is predicted. (see Figure 5).
MANIPULATING THE CURVE
Within many real-world applications, a pump may have both vacuum and pressure conditions, as demonstrated in the schematic shown by Figure 6. In situations like this, with a slight manipulation of the chart, a pump performance curve can still be used to estimate the fl ow rate of the pump.
Figure 4: Pressure test condition schematic
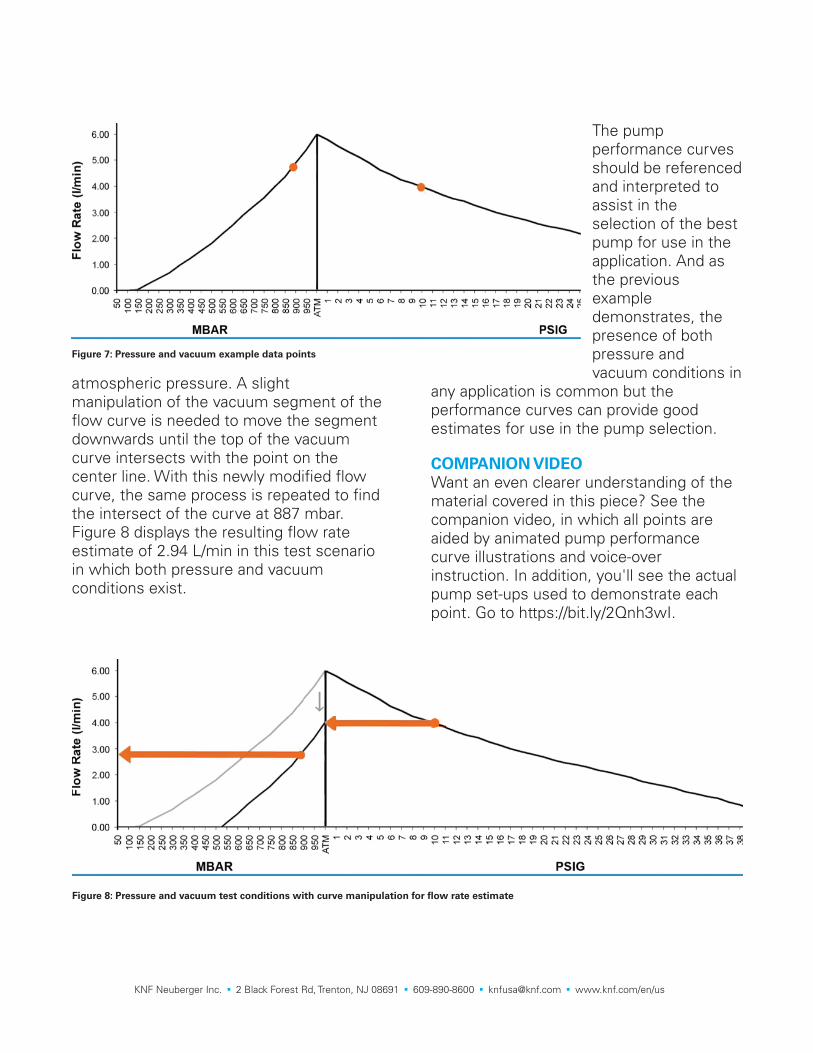
In the example illustrated above, there is a coil of tubing on the inlet side of the pump and a restrictive orifi ce on the outlet, both of which will impact the fl ow performance of the pump. For some example data points shown in Figure 7, assume that the coil of tube adds 887 mbar of restriction on
the inlet while the orifi ce on the outlet side generates 10 psig of backpressure.
As previously demonstrated, a vertical line drawn up from the pressure segment of the x-axis intersects the fl ow curve. But in this instance, the horizontal line drawn from the point of intersection towards the y-axis stops at the center line for
Figure 5: Pressure test condition fl ow rate prediction
Figure 6: Pressure and vacuum test condition schematic
Interpreting Pump Performance Curves.indd 3 8/24/2020 2:29:52 PM
KNF Neuberger Inc. ■ 2 Black Forest Rd, Trenton, NJ 08691 ■ 609-890-8600 ■ [email protected] ■ www.knf.com/en/us
Rev
: Aug
ust
2020
The pump performance curves should be referenced and interpreted to assist in the selection of the best pump for use in the application. And as the previous example demonstrates, the presence of both pressure and vacuum conditions in
any application is common but the performance curves can provide good estimates for use in the pump selection.
COMPANION VIDEO
Want an even clearer understanding of the material covered in this piece? See the companion video, in which all points are aided by animated pump performance curve illustrations and voice-over instruction. In addition, you'll see the actual pump set-ups used to demonstrate each point. Go to https://bit.ly/2Qnh3wI.
atmospheric pressure. A slight manipulation of the vacuum segment of the fl ow curve is needed to move the segment downwards until the top of the vacuum curve intersects with the point on the center line. With this newly modifi ed fl ow curve, the same process is repeated to fi nd the intersect of the curve at 887 mbar. Figure 8 displays the resulting fl ow rate estimate of 2.94 L/min in this test scenario in which both pressure and vacuum conditions exist.
Figure 7: Pressure and vacuum example data points
Figure 8: Pressure and vacuum test conditions with curve manipulation for fl ow rate estimate
Interpreting Pump Performance Curves.indd 4 8/24/2020 2:29:53 PM
KNF Neuberger Inc. ■ 2 Black Forest Rd, Trenton, NJ 08691 ■ 609-890-8600 ■ [email protected] ■ www.knf.com/en/us
Rev
: Aug
ust
2020
BEYOND THE PUMP PERFORMANCE CURVE WITH KNF
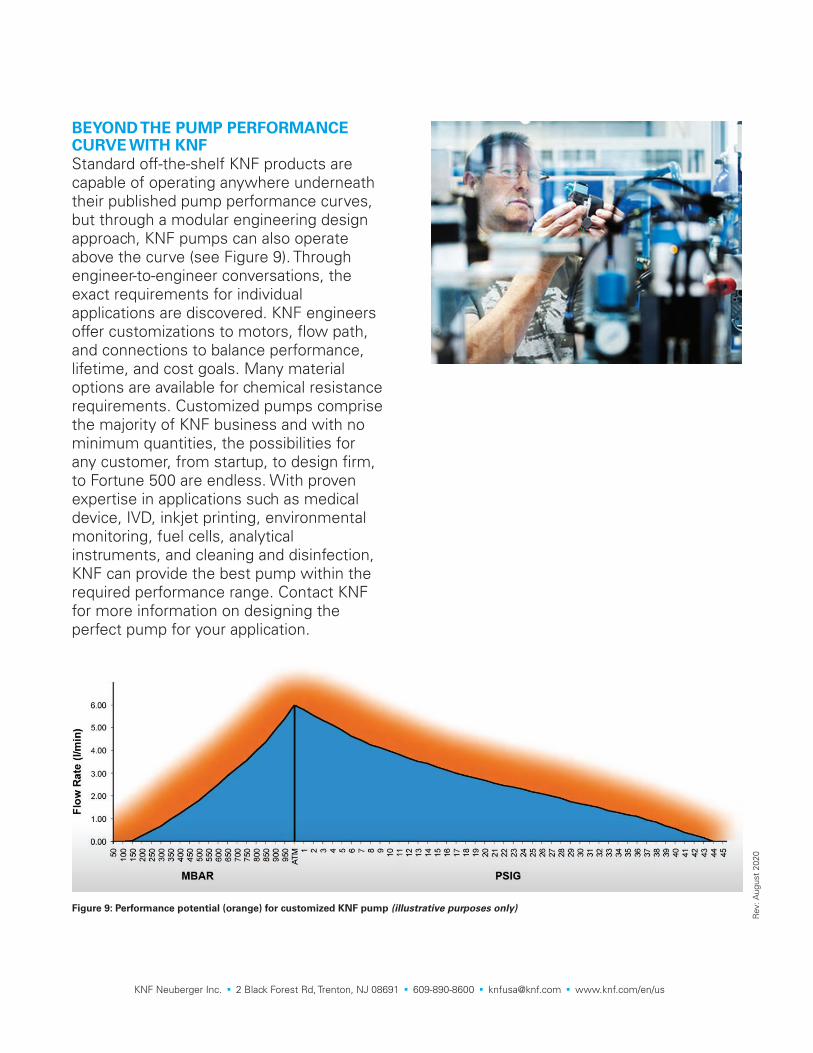
Standard off-the-shelf KNF products are capable of operating anywhere underneath their published pump performance curves, but through a modular engineering design approach, KNF pumps can also operate above the curve (see Figure 9). Through engineer-to-engineer conversations, the exact requirements for individual applications are discovered. KNF engineers offer customizations to motors, fl ow path, and connections to balance performance, lifetime, and cost goals. Many material options are available for chemical resistance requirements. Customized pumps comprise the majority of KNF business and with no minimum quantities, the possibilities for any customer, from startup, to design fi rm, to Fortune 500 are endless. With proven expertise in applications such as medical device, IVD, inkjet printing, environmental monitoring, fuel cells, analytical instruments, and cleaning and disinfection, KNF can provide the best pump within the required performance range. Contact KNF for more information on designing the perfect pump for your application.
Figure 9: Performance potential (orange) for customized KNF pump (illustrative purposes only)
Interpreting Pump Performance Curves.indd 5 8/24/2020 2:29:54 PM