internet traffic exchange: developments and policy
TRANSCRIPT

DSTI/ICCP/TISP(98)1/FINAL
1
Unclassified DSTI/ICCP/TISP(98)1/FINAL
Organisation de Coopération et de Développement Economiques OLIS :Organisation for Economic Co-operation and Development Dist. :__________________________________________________________________________________________
Or. Eng.DIRECTORATE FOR SCIENCE, TECHNOLOGY AND INDUSTRYCOMMITTEE FOR INFORMATION, COMPUTER AND COMMUNICATIONS POLICY
Working Party on Telecommunication and Information Services Policies
INTERNET TRAFFIC EXCHANGE: DEVELOPMENTS AND POLICY
60993
Document complet disponible sur OLIS dans son format d’origine
Complete document available on OLIS in its original format

DSTI/ICCP/TISP(98)1/FINAL
2
Copyright OECD, 1998
Applications for permission to reproduce or translate all or part of this material should be made to:
Head of Publications Services, OECD, 2 rue André-Pascal, 75775 Paris Cedex 16, France

DSTI/ICCP/TISP(98)1/FINAL
3
TABLE OF CONTENTS
FOREWORD.................................................................................................................................................. 5
MAIN POINTS............................................................................................................................................... 6
INTRODUCTION.......................................................................................................................................... 8
NATIONAL AND INTERNATIONAL TRAFFIC EXCHANGE.............................................................. 14
National traffic exchange: peering and transit issues ............................................................................... 14Peering, transit and Internet exchange points ........................................................................................... 22International traffic exchange and infrastructure financing ..................................................................... 35
MAPPING THE INTERNET BY DOMAINS............................................................................................. 45
Distributing domain name registrations ................................................................................................... 45Weighting Internet host distribution ......................................................................................................... 46Global root-level servers........................................................................................................................... 53Intellectual Infrastructure Fund ................................................................................................................ 55
ANNEX 1 ..................................................................................................................................................... 58
ANNEX 2 ..................................................................................................................................................... 60
ANNEX 3 ..................................................................................................................................................... 69
NOTES ......................................................................................................................................................... 72
Tables
Table 1. Internet and PSTN Development................................................................................................ 13Table 2. Benefits and drawbacks of peering for IAPs .............................................................................. 20Table 3. Selected US Internet backbone providers ................................................................................... 20Table 4. Selected Internet exchange points in the OECD area ................................................................. 24Table 5. Selected US Internet exchange points ........................................................................................ 27Table 6. Selected peering and pricing policies and prerequisites of Internet exchange points ................ 31Table 7. Internet exchange point pricing .................................................................................................. 33Table 8. International undesea cable capacity to and from Japan ............................................................ 42Table 9. Singapore’s Internet and traditional PSTN traffic patterns ........................................................ 42Table 10. STIX regional capacity and performance ................................................................................. 43Table 11. International leased line prices (2Mbps) .................................................................................. 44Table 12. Domain registration in OECD countries .................................................................................. 48

DSTI/ICCP/TISP(98)1/FINAL
4
Table 13. US domain name markets ......................................................................................................... 49Table 14. Domain registration in selected non-OECD countries ............................................................. 50Table 15. Domain registrations per 1 000 inhabitant ............................................................................... 51Table 16. Internet host penetration weighted by gTLD registration ........................................................ 52Table 17. Operators of the Internet’s root-level name servers ................................................................. 54Table 18. Indicative contributions to the Intellectual Infrastructure Fund ............................................... 57

DSTI/ICCP/TISP(98)1/FINAL
5
FOREWORD
In March 1998 this report was presented to the Working Party on Telecommunications andInformation Services Policy (TISP) and was recommended to the made public by the Information,Computer and Communications Policy (ICCP) Committee.
The report was prepared by Dr. Sam Paltridge of the OECD’s Directorate for Science,Technology and Industry. It is published on the responsibility of the Secretary-General of the OECD.

DSTI/ICCP/TISP(98)1/FINAL
6
MAIN POINTS
Discussion of Internet traffic exchange is important because some parts of the communicationindustry are asking governments to address an increasing number of regulatory issues. Localtelecommunication carriers are seeking redress for inequities they believe are arising from the finaldelivery of Internet traffic for dial-up users in respect to regulation aimed at telephony. Some smallerInternet service providers (ISPs) claim that arrangements for traffic exchange with larger ISPs are nottransparent and non-discriminatory. Some international facilities-based ISPs argue that they are not beingfairly compensated for carrying traffic for other parties. Finally, some ISPs are calling for professionalmanagement of the Internet’s global root name servers that provide crucial information for the DomainName System (DNS). All these issues will require decisions by policy makers, even if those decisionsultimately give governments a minimal, but supportive, role in finding solutions, for example, byproviding a neutral forum for industry to reach consensus or by providing a neutral point at whichstatistics can be aggregated to inform debate.
The Internet is turning traditional point-to-point communication models on their head. Forexample, in the world of public switched telecommunication networks (PSTN), there was generally acorrelation between the amount of traffic exchanged between two countries and the amount of capacityallocated by infrastructure providers for this route. For the Internet, the points of origin and termination ofpackets of data have very little relationship either to the traffic that may be carried over a given route or totraditional PSTN traffic patterns. For example, PSTN traffic between Singapore and Canada makes upwell under one per cent of each country’s outgoing international traffic. In December 1997, by way ofcontrast, nearly half of the international Internet capacity from Singapore’s Internet exchange point(STIX) was deployed between Singapore and Vancouver. Similarly, in the PSTN world, telephonenumbers were administered on a national basis. For the Internet, more than two-thirds of second-leveldomain names registered by Canadian, French and Spanish users are administered in the United States.
The Internet has evolved in a fundamentally different way from the world’s PSTNs. NationalPSTNs were established locally and connected internationally many decades later. The reverse is largelytrue for the Internet. Until relatively recently, an e-mail message between two users located in the samebuilding, but with different ISPs, was likely to travel over inter-continental backbone networks andreceive DNS information from a server located on the other side of the globe. In some countries, Internetperformance is better on an "international" than on a "national" or "local" basis, and in a number cases,this is directly related to past, and present, regulatory obstacles to infrastructure competition.
Due to the Internet’s evolution, as well as the price and availability of national and regionalinfrastructure, a great deal of traffic between users in one geographical area is being pushed ontointernational or intercontinental infrastructures, particularly where this improves performance. However,this may negatively affect performance for users in other countries by creating congestion in trafficexchange (including domestic traffic exchange) in those countries. Local infrastructure performance is nolonger isolated from local and regional performance elsewhere in the world. Consequently, governments

DSTI/ICCP/TISP(98)1/FINAL
7
need to increase the momentum for liberalising infrastructure provision, notably by implementing theworld Trade Organization (WTO) agreement, not least because poorer levels of performance in the localinfrastructures of other countries affect their own markets.
The private sector, and in particular ISPs, are actively developing infrastructure to "localise"Internet traffic flows by improving the performance of local infrastructure. Their initiatives include theestablishment of an increasing number of Internet exchange points (the places where ISPs exchangetraffic) and greater global distribution of the infrastructure supporting the DNS. In these cases"localisation" does not indicate a specific geographic area but rather the fact that content, services, andsome network functions are being shifted closer to the user to increase network efficiency (e.g. to bringusers faster response times). These developments are critical in improving the performance of the Internetfor electronic commerce. This document aims to increase awareness of how traffic exchange occurs on theInternet and how infrastructure and financial interconnection arrangements (including peering and transit)to accomplish traffic exchange are developing. The role of government in these developments is toeliminate existing and potential barriers by monitoring and reforming regulation as appropriate.
Because of the international nature of the Internet and the rapid pace at which the services andinfrastructure are developing, some of these issues are complex. Moreover, the nature of traffic exchangeon the Internet, relative to the PSTN, does not easily lend itself to past commercial settlement models. Forexample, if the traffic flowing between a country in the Asia-Pacific region and the United States werecontained within a single international link and within the geographical borders of both countries, a modelfor sharing infrastructure costs might be self-evident. However, the Internet does not transport traffic insuch a precisely defined or bounded way. Not only might the IP (Internet Protocol) packets travel alongdifferent paths and through different countries, so might the DNS information drawn from global rootservers.1
From the perspective of ISPs in the United States, the greater the capacity foreign ISPs put inplace to Internet exchange points based in the United States, the greater their costs in providing domesticinfrastructure that is used for international transit. From the perspective of ISPs outside the United States,the existing peering model (akin to "sender keeps all" in the PSTN world) does not fairly compensatethem for costs incurred in carrying the traffic of US users. There is little information available forunderstanding the balance of these costs, or even the patterns of international traffic (including transittraffic and traffic related to international DNS requests), although such information is necessary to informdiscussion of the financing of international infrastructure linking OECD countries. At this stage, the bestway forward is for industry to initiate discussion on the financing of Internet traffic exchange, forexample, via the Asia-Pacific Internet Association’s call for comments and other industry forums. Therole of government is to stay abreast of these discussions and support industry-led solutions.

DSTI/ICCP/TISP(98)1/FINAL
8
INTRODUCTION
The Internet has evolved in a fundamentally different way from the world’s public switchedtelecommunication networks (PSTN). National PSTNs were established locally and connectedinternationally many decades later. For these public networks, the first telephone exchanges defined thecalling opportunities and the resulting traffic patterns. When these exchanges became connected on anational, and then international, basis traffic patterns started to change. At that point, subscribers to onelocal exchange could call, for the first time, those of another. The reverse is largely true for the evolutionof the global Internet.
The Internet evolved from an international “private” network first used by the US military, andthen by academic and research institutions. The Internet’s core infrastructure, such as the first networkaccess points (NAPs) and global root-level servers, were mostly established in locations far remote fromthe bulk of the initial users. This was made possible, of course, because the Internet has been grafted ontothe world’s PSTN infrastructure via lines leased by Internet service providers (ISPs) or capacity allocatedby public telecommunication operators (PTOs) for their own traffic using the Internet protocol (IP). Toexchange traffic, and to receive Domain Name System (DNS) information from far distant root-levelservers, ISPs connected to the original NAPs using national and international leased lines.
To contrast initial Internet traffic flows with the PSTN consider the example of two users inBoston, Massachusetts, making a local telephone call or exchanging an e-mail at the beginning of 1997.In the case of local telephony, the call would have been switched via an exchange in Boston and the twoparties would be connected without the traffic, or signalling information, needing to go outside the localcalling area. In the case of an e-mail between the same users (as customers of different ISPs) the trafficwould most likely have been routed via NAPs in Washington, DC or New Jersey. These were two of theoriginal four NAPs funded by the US National Science Foundation (NSFNET). A similar IP exchangebetween two users in London, until 1995, would very probably have traversed one of these same NAPs inthe United States2 At the same time the DNS information, may have been drawn from one of a number ofthe nine original global root-level servers in the United States or Sweden at the core of the domain namesystem (DNS).
For a number of reasons, which will be examined below, Internet infrastructure providers areendeavouring to “localise” IP traffic and the DNS functions provided by the global root-level servers.Accordingly, a great many new Internet exchange points are now being established in major US cities toaugment the original National Science Foundation (NSF) sponsored sites. By way of example, Bostonhad its first Internet exchange point established in 1997 so that traffic between Bostonians could beexchanged locally between ISPs operating in Massachusetts. At the same time new Internet exchangepoints were being established in Manchester (1997), Milan (1996) and Grenoble (1997) to complimentearlier exchange points in London, Rome and Paris. Similarly, in 1997, two global root-level servers weretransferred from the United States to Japan and the United Kingdom.

DSTI/ICCP/TISP(98)1/FINAL
9
In this way, in contrast to the way PSTNs were built up from local exchanges, the public Internetis gradually seeing exchange points built on more localised basis. This process is critical to efforts toupgrade information infrastructure in ways that will make it more suitable for electronic commerce. Yet,to date, there has been little discussion of its importance and what, if any, might be the implications forcommunication policies supporting the development of infrastructure for electronic commerce. Thissource document aims to describe the process that is under way in “localising” Internet traffic exchangeand the policy issues that are arising. Before doing this it is necessary to set the context.
The OECD’s first consideration of IP traffic flows and infrastructure development was based ona discussion of “webcasting” and some of the policy implications of convergence.3 That discussion notedthat the locality of the most accessed content over the World Wide Web was concentrated in the UnitedStates, and more specifically in California. The background report highlighted a number of initiatives thatare under way to take this content closer to users and improve network efficiency such as caching, IPmulticasting, mirror sites and digital warehousing.
This document does not intend to repeat the analysis of IP traffic flows in relation to webcastingbut rather to build on that work. However, several additional factors should be considered owing to thedynamic nature of developments. One factor is that deployment of streaming media technologies used forwebcasting is proceeding very rapidly. Based on data collected by RealNetworks, a leading supplier ofwebcasting tools, there were 103 000 web pages using streaming media in September 1997, with 11 percent having a video component.4 By November 1997 they had grown to 178 000 pages with 14 per centhaving a video component. Adding to the increase in IP traffic, due to the webcasting of World WideWeb content, is the expected increase in the use of multimedia e-mail.5
While accounting for a smaller percentage of IP traffic than the World Wide Web, the use of e-mail is expanding at a prodigious rate. The major reason for this is the increased use of e-mail for socialand commercial reasons, as well as the increase in “spam” (the Internet’s equivalent of “junk mail” in thepostal system). In December 1997, Deja News, a site which archives postings to Usenet newsgroups, saidit was collecting about 730 000 messages per day. Deja News noted “...that nearly two-thirds of thecontent added to Usenet newsgroups daily is spam, or messages sent to cancel spam, creating a majorimpediment to information access and causing frustration for users ”.6
Including audio and video clips in e-mail communication, even if it remains unopened as in thecase of some spam, can be expected to further increase IP traffic. Many of the solutions aimed at takingcontent closer to users are not designed to deal with such developments. Therefore, the process oflocalising traffic exchange, where possible, takes on further significance. Until the process of establishingnew Internet exchange points in OECD countries is further developed, a great deal of “regular” and“multimedia” IP traffic will continue to traverse continental and intercontinental backbone networks.Infrastructure providers are responding by increasing the amount of capacity available on national andinternational routes at an unprecedented rate. In December 1997, MCI Communications said it doubledthe core circuit capacity of its Internet backbone to dual 622 megabits per second and planned to increaseits backbone core circuit capacity even further to 2.5 Gbits per second by year-end 1998. ISPs areincreasing the capacity of their international backbones at a similar pace. However, Internet trafficcontinues to spiral, placing increased traffic demands on existing NAPs and other exchange points.
There is some evidence that some US backbone networks connecting to major NAPs, such asMAE East and MAE West, experienced deteriorating performance during 1997.7 One study, by KeynoteSystems, found the average performance of Internet backbone networks in North America, as measured bypage download speeds, decreased by 4.5 per cent during 1997.8 Significantly, the backbone network withthe best performance in the Keynote survey, SAVVIS, has a strategy of bypassing “public NAPs” such as

DSTI/ICCP/TISP(98)1/FINAL
10
MAE East by purchasing direct connections to larger backbone networks for IP traffic exchange.9 Theterm “public NAPs” or public Internet exchange point is not used to indicate ownership status but ratherthat any ISP that meets certain requirements may exchange traffic at these points. Private Internetexchange points, such as those being used by SAVVIS, are direct connections with larger backbonenetworks.
While communication policy makers have a long-standing interest in promoting regulatoryframeworks that encourage infrastructure development, this is being given added impetus by the growingrequirements for electronic commerce. In terms of the Internet some studies suggest performanceproblems are generally not located on user’s sites (e.g. server problems). For many Web sites used forelectronic commerce, Keynote System's measurements indicate that most of the performance problemsoccur in the Internet's infrastructure somewhere between the Web site and its users, such as at the publicexchange points and NAPs where backbone providers interconnect, in one or more routers along thecommunication path, or in the DNS.10 How much can be concluded from different efforts to measurebackbone network performance is currently a contentious issue. Some critics of Keynote’s methodologyclaim their results reveal more about the performance of different backbone provider’s Web sites thantheir about actual backbone networks.
The amount of traffic generated by the DNS may also be considerable but may depend on wheresamples are taken. One survey of Internet usage, undertaken in late 1997, found that DNS requestsaccounted for 24.4 per cent of packet traffic and 9.9 per cent of byte volume on one segment of theInternet backbone -- the largest single category of Internet traffic.11 Bellcore says this is because, “Everytime a Web site is searched or an e-mail is sent the correct IP address must be found and validated -- aprocess that can take several round trips to different DNS servers anywhere on the Internet.”12 One way toreduce this traffic is to “localise” DNS information by caching the most widely used IP addresses.Accordingly, in December 1997, Sun Microsystems and Bellcore announced the availability of the SoliantAdvanced DNS system, which, by enabling ISPs to cache the most accessed IP addresses, reduces IPname searches to one trip. Sun and Bellcore say this will free up bandwidth and quicken response timesfor users. They believe widespread deployment could enable users to increase the speed with which theyaccess data from a Web site by 10 to 15 per cent. Another study of traffic, undertaken by MCI in 1997,found DNS traffic made up a much smaller proportion of total packets and volume. MCI found that ondomestic US and an international (US - UK) link DNS traffic comprised between 3-5 per cent of thepackets and 1-2 per cent of bytes but as much as 25 per cent of the flows.13
To the extent that the initial “public NAPs” in the United States are points of congestion, theproblem is compounded by the fact that many international networks exchange traffic both with theUnited States and “third country” ISP networks at these points. It has been reported that more than half ofintra-European and intra-Asian IP traffic is transported via the United States.14 While little data areavailable to provide confirmation of the exact amount of intra-regional traffic passing via the UnitedStates it is almost certainly very considerable. Furthermore, the great bulk of intercontinental trafficbetween the Asia-Pacific region and Europe is transported across the United States. Where data areavailable they show far more traffic being shipped from the United States to other countries than viceversa. For example, on average, Swisscom’s transatlantic Internet link carries six times as much datafrom the United States as it carries to it.15
There are a number of reasons why the United States has developed as a “global hub” forInternet traffic. As will be examined below, these include historical factors (the original coreinfrastructure was in the United States), as well as the economic and network performance incentivessome foreign ISPs have to route international transit traffic via the United States. In some cases, this isbecause a lack of infrastructure competition has led to prohibitively priced intra-regional capacity in

DSTI/ICCP/TISP(98)1/FINAL
11
Europe and Asia. In other cases, it could be because telecommunication carriers are withholding capacityfrom competitors in adjacent value-added markets such as Internet access.16 It has also been suggestedthat because some telecommunication carriers do not exchange traffic at national Internet exchangepoints, for reasons of commercial strategy or regulatory obstacles, this forces a great deal of domestictraffic to be unnecessarily routed via the United States. 17
A further factor which might be researched by the Internet community is how much traffic flowsback and forth between countries due to requests for DNS information. The results cited by Bellcore andMCI give different indications of the amount of traffic which may be generated between foreign countriesand the United States, because the latter is the location for ten of the thirteen global root level servers. Afurther question is whether greater use of generic Top Level Domains (gTLD such as .com, .net, .org) insome countries outside the United States, as opposed to national TLDs (such as .fr for France), impacts onthe balance of traffic between those countries and other countries where the global root level servers arelocated. Requests for root servers supplying DNS information for TLDs are a further factor, with aroundhalf of the 172 DNS servers being located outside the country concerned. Generally, DNS servers keeptrack of the round trip times for DNS packets to each of the root servers and will choose to query theserver that responds most quickly over time. When traffic traverses international links, it would be theroot server that is the closest according to network topology. The traffic impact is essential because oncea server queries for a certain domain name, it caches the response and does not need to contact the rootagain until the cached value expires.
Two other factors are also very important in understanding why the United States is a globalInternet hub. First the location of the most accessed “non-local” content is overwhelmingly located in ahandful of US States such as California. Second, using an analogy from the PSTN, the greatest number of“calling opportunities” are in the United States. In other words, the greatest number of visible hosts -- thegreatest number of connected users and range of content (as corroborated by a similar survey of servers) --on the public Internet are in the United States. This is significant because the balance of Internet hosts inthe United States is significantly ahead of its share of telecommunication mainlines (Table 1). Whereasthe United States has just under a quarter of the world’s telecommunication mainlines it has just over halfof all public Internet hosts.
The US share of Internet hosts is smaller than the share calculated for that country in the past.The reason is that in times past there were very little data on the public record as to how manyregistrations under gTLDs were made by users outside the United States. Accordingly, the hosts surveyedunder gTLDs were assigned to the United States. For network planners this made global surveys ofInternet hosts less useful than they might otherwise have been in those countries that make greater use ofgTLDs. This is particularly true for Canada, which is the largest user of gTLDs outside the United States.While surveys by Statistics Canada reveal that the number of Canadian households with access to theInternet nearly doubled (843 000 to 1 500 000) between 1996 and 1997, the number of hosts under .caonly increased by 62 per cent.18
By making an allowance for users of gTLDs in other countries, it is possible to give a moreaccurate estimate of Internet penetration where official data are not available. This enables policy makersto have a better understanding of how the Internet is developing and to inform discussion of Internettraffic patterns and exchange, including what, if any, impact registration patterns may have on trafficpatterns generated by DNS requests. Accordingly, in the concluding sections, this document discussesdomain name registration and its impact on Internet host statistics and traffic exchange. This analysisshows that while the United States accounts for half of the hosts accessing the Internet, the distributions ofhosts in other countries is significantly higher that it has been previously possible to determine. When this

DSTI/ICCP/TISP(98)1/FINAL
12
fact is added to the high concentration of popular content in the United States, it helps to understand thecurrent trend of spiralling international traffic loads. In other words, there are more users outside theUnited States making use of US content than was previously evident.
This document also discusses national and international traffic exchange and its relationship toInternet exchange points and the international DNS infrastructure. It is very important for policy makersto understand better how traffic exchange occurs on the Internet. One reason is the need to increase themomentum of introducing infrastructure competition. It is ironic that efforts to restrict the opening ofnational markets has actually pushed increases in IP traffic, sometimes including purely domestic traffic,into being hubbed in foreign countries with the most competitive communication markets.
Policy makers need to ensure that there are no regulatory barriers restricting incumbenttelecommunication carriers and private networks from exchanging traffic at public and private Internetexchange points. Particular issues to review are how existing regulation might impact on an incumbenttelecommunication carrier’s ability to enter into selective peering arrangements as opposed to fulfillingnon-discrimination requirements. Similarly, there is a need to ensure that regulation does not have theunintended consequence of designating some private or user networks as facilities-based carriers if theyparticipate at Internet exchange points.
A further initiative some OECD governments might like to consider is the promotion of co-operation between ISPs at the sub-regional and municipal level in the creation of Internet exchange points.In those countries that do not have Internet exchange points, or only have exchange points in the largestcity, government authorities at the state or provincial level could stimulate awareness of the benefits ofISPs co-operating to establish local points of traffic exchange. While industry will no doubt accomplishthis in the medium term, because the economic incentives are very large, many thousands of ISPs areextremely small and may not be well placed to initiate such efforts. In the case cited above the City ofBoston played a role in supporting the establishment of a metropolitan Internet exchange point.
Finally policy makers need to increase their awareness of Internet traffic exchange because ofthe increasing number of issues that some parts of the communication industry are asking them to address.These include some local telecommunication carriers seeking redress for inequities they believe arearising from the final delivery of Internet traffic for dial-up users with respect to regulation aimed attelephony; some smaller ISPs claim that arrangements for traffic exchange with larger ISPs are nottransparent and non-discriminatory; some international facilities-based ISPs arguing that they are notbeing fairly compensated for carrying traffic for other parties; and some ISPs calling for professionalmanagement of the Internet’s global root name servers which provide critical information for the DNS.All these issues will require decisions by policy makers, even if those decisions are ultimately forgovernments to play a minimal role in finding solutions -- such as by providing a neutral forum forindustry to reach consensus or by providing a neutral point at which statistics can be aggregated to informdebate.

DSTI/ICCP/TISP(98)1/FINAL
13
Table 1. Internet and PSTN Development
Share of world’s Internethosts adjusted for gTLDregistrations (per cent)
Share of world’stelecommunicationmainlines (per cent)
Ratio
United States 51.5 23.8 1.2Canada 6.1 2.6 1.4United Kingdom 5.5 4.2 0.3Germany 5.2 5.8 -0.1Japan 5.2 8.8 -0.4Australia 3.8 1.3 1.9Netherlands 2.1 1.2 0.8France 2.0 4.7 -0.6Finland 1.8 0.4 3.4Sweden 1.8 0.9 1.1Italy 1.4 3.6 -0.6Norway 1.1 0.4 2.2Switzerland 1.0 0.6 0.5Denmark 0.9 0.5 0.9Spain 0.9 2.2 -0.6New Zealand 0.8 0.2 2.4Korea 0.8 2.7 -0.7Austria 0.5 0.5 0.0Belgium 0.5 0.7 -0.2Czech Republic 0.3 0.3 -0.3Ireland 0.2 0.2 0.1Hungary 0.2 0.3 -0.4Poland 0.2 0.8 -0.7Mexico 0.2 1.3 -0.8Turkey 0.2 2.0 -0.9Portugal 0.1 0.5 -0.8Greece 0.1 0.7 -0.8Iceland 0.07 0.02 2.4Luxembourg 0.03 0.03 -0.2EC 23.0 26.1 -0.1
1. Host data is from Network Wizard’s July 1997 Survey. Mainlines data is from the ITU for 1996. Weighting methodology isdescribed in later sections of this document and registration data is provided by Imperative.
Source: OECD

DSTI/ICCP/TISP(98)1/FINAL
14
NATIONAL AND INTERNATIONAL TRAFFIC EXCHANGE
National traffic exchange: peering and transit issues
Traditionally ISPs have exchanged traffic among themselves using a different financialsettlement model from PTOs.19 When domestic traffic is exchanged between PSTNs it is usuallyaccomplished via an interconnection or access payment. The bulk of international PSTN traffic isexchanged via a system of financial settlements, sometimes know as the accounting rate system. By wayof contrast ISPs, in the main, continue to exchange traffic via a system known as “peering” although thereis increasing use of interconnection payments between ISPs.
An agreement to peer means that two ISPs will exchange necessary routing information so thattraffic can be exchanged between their networks at no charge (i.e. similar to the sender-keeps-all systemsometimes used for international PSTN traffic).20 This exchange occurs at public and private Internetexchange points, which are points of traffic exchange and provide access to backbone networks. In timespast, there were only a small number of Internet exchange points or NAPs and, because of the origins ofthe Internet, they were all located in the United States. At present the number of Internet exchange pointsis growing very quickly, with a much greater geographical dispersion both within the United States and inother OECD countries (see next section).
ISPs will consider several factors in approaching negotiations for peering agreements (Table 2).These include consideration of their prospective peer’s customer base (e.g. number and type ofcustomers), as well as the reach and breadth of their network. Peering between ISPs of equal “size andshape” is relatively straightforward at the local and national level. The largest ISPs in the United States,peer with each other on a national basis because they recognise the mutual benefits. The smaller ISPs,usually operating in a limited geographical region, also peer among themselves on a fairly straightforwardbasis because they too recognise the mutual benefits. This is a major factor in the proliferation of new“local and regional” Internet exchange points (note: these new exchange points are sometimes known bydifferent terms, such as MXP, as explained below).
The different characteristics of ISPs mean that they do not necessarily enter an interconnectionnegotiation with equal bargaining strength. There are more than 4 000 ISPs of greatly differingcharacteristics in the OECD countries.21 Some have customers providing content and services much indemand by the customers of other ISPs. At the same time, some ISPs have a customer base that thecustomers of other ISPs want to access. However negotiations for peering do not just occur horizontallybetween ISPs but also vertically between “small local ISPs” and “large national ISPs”. In the latter casethe “large national ISPs” have a stronger bargaining position because they not only provide access to theircustomer and content base, but also act as a gateway to the rest of the Internet. As a result the exchange ofInternet traffic operates with two parallel systems. The first is peering, whereby traffic is usuallyexchanged without payment, and the second is a system involving transit payments. One commentatorhas defined transit along the following lines:

DSTI/ICCP/TISP(98)1/FINAL
15
“Transit comes into play when a provider wants to reach customers of some third party that thefirst provider doesn't peer with. If the ISP that peers with the first provider also peers with thethird party, then that provider is in a position to offer the first provider transit to the third party.Transit will normally cost a flat monthly charge.”22
To understand the relationship between peering and transit payments it is necessary to recall the“non-commercial” origins of the Internet. In its first guise as a defence network, with a single user (theUS military), commercial traffic exchange was explicitly excluded. In the 1980s, as the network wasincreasingly opened to academic and research institutions, the Internet’s commercial utility wasrecognised but limited by the so called “acceptable use policy” (AUP). In the 1990s, as the AUP wasrelaxed, the first commercial NAP was established in the United States. In 1991, the Commercial InternetExchange or CIX, now better known as a leading industry association of ISPs, obtained its name by beingthe first entity to establish an exchange point for commercial users.23 The original rationale for acommercial NAP was to enable companies using the Internet to have more flexible routing. Prior to theestablishment of the CIX, while one division of a company might have had access to the Internet, otherdivisions of the same company may not have had the same access rights because of the AUP. In thissituation, such a company would therefore have had to route the other divisions’ traffic via anothernetwork.24 The establishment of a commercial NAP allowed the original CIX members to route allcompany traffic over the same network without fear of violating NSFNET or Internet AUPs.
In 1994, the NSF awarded contracts to replace the NSFNET’s Internet backbone. Thesecontracts were for backbone transport, the routing arbiter and traffic exchange points (NAPs). The fouroriginal NSF-sponsored NAPs were located in San Francisco (operated by Pacific Bell), Chicago(operated by Ameritech), New York (operated by Sprint in New Jersey), and Washington, DC (operatedby MFS).25 In 1995 NSFNET was retired and US backbone traffic was routed via interconnectedcommercial networks. These networks continue to use the four original NSF-sponsored NAPs, nowcommercially funded, and the CIX.
In the transition to a commercial Internet, ISPs continued largely to employ the peering modelthey had inherited from NSFNET. One reason was the fairly small number of ISPs, with relativelyuniform characteristics, so that their bargaining power was more or less even. In addition, the relativelysmall number of exchange points meant that all ISPs wanting to peer had to build or purchaseinfrastructure (i.e. leased lines from telecommunication carriers) to reach the available NAPs. In otherwords, the levels of network investment or costs were broadly similar and this infrastructure could, inturn, be used by all ISPs to mutual advantage. However, as the number of ISPs, and the number ofInternet exchange points, increased, the economics of providing networks and the relative bargainingstrength of the parties began to change.
The strains in certain peering relationships in the United States, which began to show in 1996,became much more visible in 1997. What brought this debate to public attention was a move by some ofthe larger ISPs to bring to an end certain existing peering arrangements, or a decision not to enter into newpeering arrangements, with smaller ISPs. In the United States, the most discussed interconnection debateoccurred between UUNET, a subsidiary of WorldCom, and a number of smaller ISPs, including WholeEarth Networks.26 In this instance UUNET, by some measures the largest Internet service provider in theworld, stated that it would no longer accept peering requests from other ISPs whose infrastructures wouldnot allow for the exchange of similar traffic levels.
For UUNET the reasons for ending some peering relationships were clear and compelling.27
According to UUNET, the company was not only receiving peering requests from smaller ISPs that couldnot route traffic on an equitable and bilateral basis, but also from companies running “Web server farms”

DSTI/ICCP/TISP(98)1/FINAL
16
that were not providing inter-networking services. From UUNET’s perspective, this meant they werebeing asked to provide national and international data transport, as well as connectivity and supportservices, to companies that could not provide similar services in return. In other words, UUNET said,these companies were seeking to use its network free of charge and not providing it with a return on itsgrowing investment in infrastructure.
Critics acknowledge the validity of many of the points made in support of the position adoptedby companies such as UUNET, such as the substantial cost differences in providing different networks.However they are concerned with the transparency of the interconnection process and the potential foranti-competitive behaviour. One critic has stated,
“In the context of peering, many mid-sized Internet Service Providers have currently or havebeen willing to build out their networks to exchange traffic with the largest networks in multiplegeographically diverse points only to find that these larger networks will neither exchange trafficonce these competitive networks have arrived at these points, nor will these large networkoperators even disclose under what criteria they would exchange traffic over thesegeographically diverse points. This refusal to make public their criteria for interconnection is atthe heart of a very serious threat to the continued growth and openly competitive nature of theInternet.”28
For its part, UUNET responded to criticism of this type by explicitly stating that it was in favourof interconnection and would not deny network access to any ISP.29 UUNET further stated its policy wasto offer peering with any ISP that operated a national network, with a diversely routed DS-3 (a networkoperating at T3 speeds) backbone, and which could connect to UUNET at DS-3 or greater speeds in atleast four geographically diverse locations in the United States. For ISPs not meeting these criteria,UUNET announced monthly interconnection rates of US$ 2 000 for a T1 connection, and US$ 6 000 for aT3 connection to their network. AGIS, another Internet backbone provider, also discloses its criteria forpeering, although the company notes that some companies do not publish these requirements.30 In theUnited Kingdom, UUNET has also published its peering policy (Box 1). Clearly stated is the fact thatUUNET reserves the right to peer in the United Kingdom with other ISPs, even if they meet all the criteriaspecified. Similarly in Switzerland, Unisource Business Networks (UBN) reserves the right to decline topeer with other ISPs even if they meet UBN’s specified criteria (Box 2). Policies of this type havegenerated complaints from smaller ISPs in some markets.
This debate raises a number of complex issues for consideration by policy makers. However,before considering these issues it is necessary to note a series of other developments that need to be takeninto account. At a time when several large ISPs moved to end peering relationships PSINet, manager ofone of the world’s largest and most advanced packet switched networks, announced it was prepared tooffer free peering to any ISP for its planned OC-48 (a network operating at 2.5 Gbit/s) Internet-optimisedbackbone. According to PSINet while “free peering” has obvious benefits for smaller ISPs that are deniedpeering by other larger operators, it would also benefit PSINet’s corporate customers by streamliningcommunication between those customers and PSINet’s ISP partners.
In a world where communication carriage has until recently been the preserve of monopolyoperators, the offer by PSINet is a somewhat novel example of the market at work. Even when marketshave been opened, there is inevitably a considerable period of time necessary for new entrants to roll outalternative infrastructure and test different strategies. Accordingly, in those instances where it has beendeemed that incumbent operators of essential facilities were acting in an anti-competitive manner,

DSTI/ICCP/TISP(98)1/FINAL
17
regulators have had to act before competitive markets have been able to exert discipline. What isrefreshing about the Internet is that market forces are, in a growing number of cases, acting ahead of theneed for traditional communication regulation.
The other interesting aspect of the divergent paths adopted by PSINet and UUNET is that theInternet industry is still experimenting with different business models. Both models appear to haveattractive features in terms of either offering incentives to build new infrastructure by providing a clearpath for financial return (i.e. transit payments) or by opening markets for smaller ISPs (i.e. peering). Incontrast to the telecommunication markets, the evolution of the Internet is taking place in a largelyunregulated environment which is enabling business models to be tested by the market. To date, asconcerns have arisen about questions such as “interconnection transparency” between ISP networks orcompetition among backbone providers, the market has responded.
While the larger Internet backbone providers appear to be going through a period ofconsolidation, the number of players appears large relative to other communication infrastructure markets(Table 3). If a backbone company is defined as one that does not have to buy Internet access from anyother company, there were nine such entities in the United States in September 1997, although thisnumber may be reduced owing to subsequent announcements of mergers and acquisitions.31 By includingcompanies that pay transit fees that number may increase to almost 50 backbone providers. Nevertheless,some have questioned whether the proposed merger between WorldCom (including UUNET) and MCImight raise competition concerns.32 Some analysts put the combined WorldCom-MCI share of Internetbackbone traffic at 50-55 per cent.33 That being said, in the absence of unified Internet traffic statistics, itis not entirely clear how some of these estimates were calculated.
Determining market shares for the Internet using available indicators is extremely difficult.34 Theuse of indicators from traditional communication markets, such as measurements of traffic or revenue bymarket segment, is not generally possible because the aggregated data are not available. While theleading players may know this information for their own activities, they may not have data for the wholeInternet market. In the absence of such measurements, some analysts have used the InterNic database ofAutonomous System Numbers (ASNs) and the routing table from the MAE West exchange point toapproximate the number of routes connecting ISPs to major backbone providers.35 These analysts thenendeavour to assess a backbone provider’s position in the market by its share of routes to other ISPs.
The OECD has experimented with another indicator which uses traceroutes from Web sitesserved by the networks of major backbone providers to 100 of the most accessed Internet sites. Thisprovides an indication of which backbone providers carry this traffic on an end-to-end basis (i.e. back andforth between the origin of the traceroute and the leading Web sites) and which backbone providersexchange traffic with another backbone provider to access some of the most popular content on theInternet. The three originating points for the traceroutes (with their initial US backbone connection inbrackets) were Global One (Sprint), Mids/Alexa (Alternet/UUNET), and Beachnet (Cerfnet). Therespective results, for each of traceroutes sites to Web21’s leading 100 Internet sites in March 1998, areshown in Appendix 1 (Figures 1, 2 and 3). For example, a series of traceroutes from the Global One Website, where Sprint provides the initial backbone connection, shows that Sprint carries the traffic on an end-to-end basis for 18 of the 100 leading Web sites. For the other 82 Web sites, Sprint passes the traffic to asecond backbone provider, the largest of which is the Worldcom group of Internet companies.
By themselves, these three traceroutes should not be taken to measure market share and moreextensive measurements would need to be undertaken to provide such an indication. Rather, they representthe perspectives of different backbone providers on the traffic exchange with other companies, which isneeded to provide connectivity to popular Web sites for their customers. Accordingly, the traceroute tool

DSTI/ICCP/TISP(98)1/FINAL
18
might be further developed to provide an indication of the market power different participants (includingISP to ISP and between some large scale content providers and ISPs) have in relation to negotiations onInternet traffic exchange. The results shown in Figure 1 could be described as the Sprint “perspective” onInternet traffic exchange to leading Internet sites. A series of traceroutes from a Web site served byanother backbone provider will produce a different result. Accordingly, a series of traceroutes fromMids/Alexa, which uses Alternet as the initial infrastructure provider, shows that the Worldcom group ofInternet companies can carry traffic on an end-to-end basis to a much greater number of these same Websites than Sprint (Figure 2). The difference in the number of Web sites for which Worldcom passes trafficto Sprint (as opposed to vice versa) is due to some leading content providers multi-homing (i.e. usingmore than one ISP to provide infrastructure). In other words for many of the sites for which Sprintprovided end-to-end carriage, the Worldcom group could also provide direct end-to-end carriage. A thirdperspective is supplied by undertaking the same series of traceroutes from a Web site served by a smallerbackbone provider -- CerfNet (Figure 3).
The competition concern raised by some smaller ISPs is that an operator with a very large shareof IP backbone traffic and connectivity might be able to leverage higher rates for “interconnection” withtheir backbone network. Critics, of this view, point to the high existing level of Internet backboneinfrastructure competition and to a number of fairly recent market entrants in the United States which arebuilding extensive networks, such as Level 2 and Qwest. Nevertheless even if the United States does notyet have cause for concern, because the earlier introduction of infrastructure competition has encouragednumerous backbone networks, this may not be true in other OECD countries that are opening theirmarkets to competition in 1998 and beyond. A further concern has been raised by some smaller ISPs thatdo not receive direct allocations of IP addresses. These ISPs borrow IP addresses from upstream backboneproviders and may have to give them up if they change provider. While recognising that alternatives existin the backbone market, small ISPs say that it is expensive and time-consuming, as well as inconvenientfor their customers, to reconfigure their networks if they change backbone provider.36 Policy makers needto be vigilant in ensuring non-discriminatory and transparent access to essential facilities in thosecountries where alternative backbone infrastructure is not yet widely available and further investigate thesignificance of the lack of IP address portability between backbone providers for smaller ISPs (for whichthere may be sound technical reasons, such as minimising the load on routing tables), in terms of theissues raised for competition policy.37
Regulatory designation
The other issue which is arising from current developments is the question of regulatorydesignation. Most ISPs would prefer to be designated as value-added service suppliers rather than astelecommunication carriers. While ISPs would generally like to be eligible for the privileges granted totelecommunication carriers in terms of co-location, for example, they would not like to have thetraditional regulatory burden that has attended common carriage providers. In terms of traffic exchangebetween ISPs, where the debates clearly have similarities to telecommunication interconnection, the bestway forward appears to be not to apply traditional telecommunication regulation to ISPs as long as there issufficient competition in the market. In other words, ISPs should continue to be free to select the type oftraffic exchanges they wish to enter into with other ISPs. At the same time, emerging best practiceindustry self-regulation involves transparency in terms of publication of peering and transit policies.
Although the regulatory designation of ISPs has received the most attention with respect toInternet traffic exchange, there may also be a need to review communication regulation in relation to howit affects telecommunication carriers and user networks. For example, if telecommunication regulationspecified that a common carrier had to offer interconnection on a non-discriminatory basis, then this may

DSTI/ICCP/TISP(98)1/FINAL
19
curb a telecommunication carrier’s range of options for traffic exchange compared to an ISP. In otherwords, an ISP might be able to choose to peer with other companies that offer equivalent services whilecharging transit to others. However, if a telecommunication carrier offering peering to one company hadto offer it to all applicants, irrespective of their ability to offer equivalent services, the carrier mightchoose only to offer transit. To date, it seems unlikely that this has been a restraint on the commercialfreedom of carriers. Certainly Swisscom’s participation in UBN does not seem to have posed a problemin terms of reserving the right to choose whether it will exchange traffic with other ISPs and how this willbe undertaken (see Box 2). In most cases if the telecommunication carrier chooses not to peer it isprobably because it does not believe that smaller ISPs can offer equivalent levels of service.
Similar questions are emerging in terms of telecommunication regulation and the participationby user networks wanting to peer at Internet exchange points. In Australia, the establishment of anInternet exchange point in the state of Western Australia (WAIX) raised the question of whether academicand government networks were going to peer at WAIX. Under new legislation, the TelecommunicationsAct 1997, the question was raised as to whether these organisations might be classified astelecommunication carriers if they were to peer at WAIX.38 At the time of writing submissions were upbefore the Australian Communications Authority for exemption or relief. Before continuing thediscussion of traffic exchange at the international level it is necessary to better understand the role ofInternet exchange points and how they are developing in the OECD area.
The regulatory designation for the exchange of traffic between telecommunication carriers andISPs are also generating questions at the level of local access networks. In the United States someRegional Bell operating companies (RBOCs) have expressed a desire for calls to ISPs originating on theirnetworks, but terminating on the local networks of others, to be paid for in a different way from localcalls.39 The RBOCs say that with regular telephony patterns of use, traffic exchanged between localnetworks would tend to be in balance over time. However, they argue that if competitors target ISPs theywill be in the position of having a significant financial deficit with other local network providers. Theirmain point is that regulatory frameworks designed for telephony should be reviewed in the light of thedifferent patterns of use generated by Internet access. At the same time, ISPs argue that incumbenttelecommunication carriers sometimes leverage their bottleneck control over the local loop infrastructurein ways that are anti-competitive. Until alternative local infrastructure is available on a sufficient basis toenable ISPs to have competitive access options, policy makers need to ensure that competitive safeguardsare in place.

DSTI/ICCP/TISP(98)1/FINAL
20
Table 2. Benefits and drawbacks of peering for ISPs
Upside Downside
An ISP can send traffic free to the customers of anotherISP.
Another ISP can send traffic free to your customers.
Peering does not require accounting systems in the sameway as a settlements system.
Peering may be more difficult to administer thanpurchased transit.
Some ISPs may benefit from not having to pay their fairshare of infrastructure costs associated with transit.
Some ISPs may not receive a fair return on theirinvestment in infrastructure used for transit.
Peering with additional ISPs may reduce the number of“hops” traffic must pass in traversing networks.
This may be at the risk of carrying additional transit traffic.
Large customers have indicated they favour peeringamong service providers even though there is little toindicate one system is necessarily superior from aperformance perspective.
Some ISPs may not manage their networks efficiently.
For designated telecommunication carriers regulationmay mean that if they offer peering to one company theymay have to offer it to all applicants irrespective of theirability to provide an equivalent service.
Source: OECD, based on Schwandt (1997).
Table 3. Selected US Internet backbone providers
US backbone provider StatusAGIS (www.agis.net/) AGIS (Apex Global Internet Services, Inc.) was founded in 1994 to provide Internet
backbone services and corporate intranets. AGIS has equipment present at themajor Internet peering points around the United States: MAE-East in Washington,DC; the New York NAP at Sprint in Pennsauken, NJ; the AADS NAP in Chicago, IL;the Commercial Internet Exchange (CIX) in Santa Clara, CA; the Pacific Bell NAP inPalo Alto, CA.; and MAE-West in San Jose, CA. AGIS currently uses Worldcom'sATM service at DS-3 (45 Mbps) rates to haul IP data across the United States, andhas begun its migration to OC-3 (155 Mbps).
BBN/GTE (www.bbn.com/)(www.gte.com/)
On August 15, 1997, GTE Corporation acquired BBN Corporation, which became anew subsidiary of GTE. GTE Internetworking, the new data unit, includes BBN andthe existing GTE Intelligent Network Services organisation.
MCI (http://www.mci.com/) MCI Internet customers are connected to the Internet through MCI's Internetbackbone. Operating at 622 megabits per second (Mbps), it is one of the fastest andlargest backbone networks of its kind in the world. Competitive bidding is under wayfor MCI with offers made by two other companies owning backbone networks,WorldCom, the owner of UUNET, and GTE, the owner of BBN.
Netcom/ICG(www.icgcomm.com/)(www.netcom.com/)
Merger announced in October 1997. ICG has extensive fibre-optic networks andoffers local, long distance and enhanced telephony and data services in California,Colorado, the Ohio Valley and parts of the southeastern United States. ICG is aleading national competitive local exchange carrier. The combined company will beserved by more than 2 600 employees and will have a network platforminterconnecting 330 Internet points-of-presence, over 40 000 dial-in access ports,18 telephony switches, 15 frame relay switches and nearly 2 900 fibre route miles --with an additional 1 117 fibre route miles under construction.

DSTI/ICCP/TISP(98)1/FINAL
21
Table 3. Selected US Internet Backbone Providers (continued)
PSINet (www.psi.net/) Another Internet pioneer PSINet has 225 points-of-presence in the United States andmore than 350 worldwide.
Sprint (www.sprint.com/) Sprint is an Internet pioneer and says it is the carrier of nearly two-thirds of today’sInternet traffic worldwide.
UUNET/WorldCom UUNET became a subsidiary of WorldCom, Inc., in 1996. In the same yearWorldCom acquired MFS. In September 1997, WorldCom acquired AOL andCompuServe’s network services company. AOL’s company was previously calledANS Communications and CompuServe’s company CNS.
1. A list of backbone providers and comparison of performance can be found at:http://www.keynote.com/measures/backbones/backbones.html
Source: OECD.
Box 1: Extract from UUNET (UK) AS-1849 Peering Policy, Source: UUNET at:http://www.uk.uu.net/network/peering/policy/
UUNET (UK) will consider peering with all ISP organisations within the United Kingdom (including the LINX, theLondon Internet Exchange) provided they meet the following conditions:
- The ISP must be a nation-wide ISP, offering service to its customers throughout the United Kingdom.
- The ISP must have at least 2Mbps bandwidth connecting from their backbone to their router at the interconnect point(for example, the LINX), or to the UUNET (UK) backbone in the case of a direct connection.
- The ISP must announce at least a /15 network block allocation or its equivalent from RIPE or other such registry.This does not include customer class B networks.
- The ISP must aggregate route announcements to UUNET (UK). UUNET (UK) will dampen heavily any networkswith /24 mask and filter those with a longer prefix.
- The ISP will receive all UK-based networks connected to the AS1849 backbone, as detailed in the RIPE RoutingRegistry AS-UUNETPIPEXUK macro. The UUNET International business networks will only be available byseparate agreement. Please contact [email protected] if you wish to discuss.
- The ISP must have established a full peering with the LINX collector router (If LINX GIX)
Even if these conditions are met, there is no guarantee, implied or otherwise, that UUNET (UK) agree to peer with theISP or continue to peer at some stage after agreement has been reached. All decisions taken in respect of peering are atthe sole discretion of UUNET (UK). UUNET (UK) reserves the right to change any of these conditions at a later date.This policy is intended to serve as guidelines and clarify our peering policy.

DSTI/ICCP/TISP(98)1/FINAL
22
Box 2: Extract from Uniplus Internet Peering Policy: http://www.unidata.ch/backbone/policy.htm
To optimise as far as possible the connectivity of the Internet, Unisource Business Networks Switzerland (UBN) hasan open policy for “zero-settlement” peering with other Internet service providers (ISPs). A zero-settlement peering isone where both ISPs assume that the traffic is approximately equal in both directions, and both benefit equally fromthe connectivity. Neither ISP buys a service from the other, and hence neither ISP bills the other.
Rather than measure traffic in order to make sure that a peering is not disproportionally in favour of one party or theother (which is difficult at public LAN exchange points anyway), UBN defines the following criteria for entering intoa zero-settlement peering. These criteria are designed to ensure that both UBN and the peering partner will benefitequally from the peering.
- Points of presence (POPs) in the 8 largest Swiss cities
- At least 1 Mbps of dedicated transatlantic Internet trunk capacity
- Direct (leased line) Internet access to customers as a standard offering at all POPs
- RIPE Local Registry
- 24 hour-per-day/7 day-per-week support function
Note that these criteria are only guidelines. UBN reserves the right to decline to enter into a zero-settlement peeringeven if the above criteria are nominally met by a potential peering partner.
In the case of ISPs who want improved connectivity to the Swiss Uniplus network, but who do not meet the zero-settlement criteria and do not want or need the global connectivity offered to Uniplus Internet customers, there is theoption to become a “Local Connectivity” customer. This service offers connectivity to all other customers of the SwissUniplus Internet service, and the zero-settlement peers of the Swiss Uniplus network, at a lower price.
Local connectivity customers are normally multi-homed, since they will get global Internet connectivity from anotherISP. Therefore they must have their own autonomous system (assigned by RIPE), and the BGP4 protocol must be usedon the connection between UBN and the customer. Normally, a local connectivity customer will connect to theUniplus Internet service via PTT leased line to the nearest Uniplus POP. It is also possible to make the connection atthe CIXP, provided that the connection is still via a dedicated serial connection.
Peering, transit and Internet exchange points
The Internet consists of a patchwork of independent networks using the same protocols. Whenpackets need to be exchanged between IP networks they either go via direct interconnection between thesenetworks or via a public Internet exchange point. As recently as 1995, there were only a small number ofInternet exchange points which were almost all located in the United States. This meant that contentbeing requested by a user from a server in the same geographical locality might traverse continental andintercontinental networks before being received. In the United States, for example, prior to theestablishment of an Internet exchange point in Boston, traffic between users in Boston would mostly beexchanged in New Jersey or Washington, DC.40 This was the case even if the content provider and theuser were physically located in close proximity. The same situation existed internationally. Before the

DSTI/ICCP/TISP(98)1/FINAL
23
establishment of the “NAP Roma” in May 1995, data packets to and from Italian users were routed overlong paths ranging across Europe and the United States.41 Indeed, what was true for Boston and Romeapplied to virtually the whole of the Internet.
The commercialisation of the Internet, and the rapidly growing traffic it has generated, hasprovided tremendous incentives for ISPs to increase the number of Internet exchange points. It is anaxiom of Internet network management that ISPs are endeavouring to take content closer to customers.This not only provides better response times for applications, such as “surfing the web”, but can cut thetransit payments smaller ISPs need to make to larger ISPs. In terms of response time, “local Internetexchange points” mean that local traffic is not competing for resources at the larger, and busier, exchangepoints and NAPs and that local content providers can be directly connected via their ISP. For example,the City municipality of Rome is connected by a local area network to “NAP Roma”.
Between 1995 and 1996 Internet exchange points were established in the largest city of mostOECD countries outside the United States. In 1997, the trend has been to establish new Internet exchangepoints in an increasing number of regional cities and centres (Table 4). The country most advanced alongthis path is the United States which has, in some cases, competing Internet exchange points in the samecity (Table 5). In other countries while the first Internet exchange points were often established in capitalcities (e.g. Paris, London and Rome), new Internet exchange points have now been established in regionalcentres such as Grenoble, Manchester, and Milan. The benefits for users are readily apparent. Before theGrenoble exchange point was established, a user on one ISP’s network wanting to access local content onanother ISP’s network had wait while this traffic passed through the only French interconnection pointlocated in Paris (i.e. the SFINX). The short-cut provided by the new exchange point has meant decreasesof more than a factor of ten in reported response times.42 Smaller exchange points than the initial NAPs aresometimes referred to as Metropolitan eXchange Points (MXP). The main difference is that while nationalservice providers exchange traffic at the larger peering points and NAPs, an MXP aims to service local orregional traffic without burdening backbone networks.43
The reasons for installing regional exchange points are not just compelling increases in responsetimes for users. The new Internet exchange points also increase the reliability of the Internet. BeforeMaNAP started operations in Manchester, an estimated 98 per cent of UK Internet traffic was passingthrough a single building in London and through one set of equipment.44 A failure of the London LINXexchange, although extremely rare, meant that all UK traffic would have had to be routed to the UnitedStates.45 However the growth of UK Internet traffic means that routing all traffic via the United States isno longer a viable option, not only because the available international links would not have the capacity tocarry all intra-UK traffic, but also because US users and ISPs would not want US NAPs to handle thistraffic. The process of establishing new exchange points can be expected to continue as some of the firstexchange points outside the United States still handle the bulk of national traffic. For example, theCopenhagen Internet exchange (DIX) was founded in May 1994, and still exchanged more than 90 percent of the Danish inter-network traffic by November 1997.46
Internet exchange point policies and pricing
The policies of Internet exchange points and NAPs are drawn up by the founding membersmostly in the form of a memorandum of understanding (MoU). In general they are commendableexamples of industry participants co-operating to produce workable models for traffic exchange.Significantly, these arrangements have been made without the need for government involvement and

DSTI/ICCP/TISP(98)1/FINAL
24
regulation in contrast to interconnection between PSTNs. This is largely because initial participants wereof relatively equal strength compared to newly liberalised telecommunication markets where theincumbent is a dominant operator of essential facilities.
While most of these MoUs are not lengthy documents it is not possible to reproduce them here.In most cases, they are published on the relevant Internet site associated with the exchange point. Assuch, only a selection of the types of policies found in MoUs are described, mainly focusing on trafficexchange (Table 6). In many cases the MoUs have been modelled on the first NAP or Internet exchangein that country (e.g. MaNAP based on LINX) or on international examples. Accordingly, there are anumber of common specifications such as the number of independent connections (sometimesinternational) an ISP must have with other Internet exchanges or the number of other ISPs which must bepeered with at the Internet exchange point concerned. One issue that may arise here is whether regulationof common carriers in any way impedes their ability to conform with or take advantage of these suchpolicies.
The pricing of some NAPs appears to vary widely even where it is stated that activities areundertaken on a not-for-profit basis (Table 7). No doubt there are a number of different explanations forthese differences, such as the size of the Internet exchange, the services or equipment included inpublished prices as opposed to those supplied by each ISP, and so forth. As with the policies associatedwith peering, there appears to be little need for any direct government involvement in these industry-driven pricing arrangements for the Internet exchange points. In contract to traditional telecommunicationnetworks, there are no incumbent operators controlling essential facilities. Moreover, as the policies areagreed by industry participants, they are mostly transparent and non-discriminatory. However, it is alsotrue that pertinent information for prospective members, such as pricing and traffic exchange policies, arenot uniformly available on the Web sites of some Internet exchange points. In addition some Internetexchange points provide much better information for end users in terms of network performance. In thisrespect, one of the best Web sites is Singapore Telecom’s site for its Internet exchange (STIX), whichprovides near real-time performance indicators (http://www.stix.net/).
Table 4. Selected Internet exchange points in the OECD area
Network exchange point Status URL
Australia Internet exchange(WAIX)
Western Australian Internet Association(WAIA)
www.waia.asn.au/Issues/Peering/index.html
Australia AUIX (Australian InternetExchange)
Public exchange point for ISPs in thelargest Australian cities.
www.auix.net/
Austria Vienna InterneteXchange (VIX)
Vienna University Computer Centerwhich may be used by Internet ServiceProviders (ISPs) to exchange traffic atthe national or international level. TheVIX is a service for commercial ISPs andacademic networks operating in thecentral and eastern European region.Not-for-profit.
www.vix.at/

DSTI/ICCP/TISP(98)1/FINAL
25
Table 4. Selected Internet exchange points in OECD area (continued)
Belgium BNIX: The BelgianNational IP eXchange
The place where ISPs can interconnectin Belgium. It is aimed at the IP trafficexchange between each connected ISPat national or international level. Any ISPwith an arrangement for traffic exchangewith any of the ISPs already connectedto the BNIX can connect to the BNIX.
www.bnix.net/
Canada Montreal InternetExchange (MIX) andothers. (No web pageavailable for CANIX)
The Montreal Metropolitan InterneteXchange backbone was created in1993 as a agreement among 5 ISPs toexchange local Internet traffic. A fewmonths later, Toronto MIX and QuebecCité MIX were created. As of 1995 inQuebec, 47 ISPs and their customers,including large corporations, exchangelocal traffic over the MIX backbones,thus increasing the performance ofInternet communication by avoiding longdetours via the United States.
cgat.bch.umontreal.ca:8080/sps3.html
CzechRepublic
Neutral InterneteXchange (NIX.CZ)
www.nix.cz/
Denmark DIX(Danish InterneteXchange point)
UNI-C NetworkOperations Center, Lyngby
www.uni-c.dk/dix/
Finland Finnish CommercialInternet Exchange(FICIX)
Consortium of Finnish Internettechnology-based data communicationproviders
www.ficix.fi/.
France GNI (Grenoble InternetInitiative)
Grenoble's Proximity Exchange Point isa place where Grenoble area ISPs mayinterconnect their backbones, andexchange local traffic.
www.gni.fr/PEP/
France SFINX: Service forFrench InternetExchange (also GIX)
Paris-based facility enabling ISPs toexchange traffic without passing throughtransnational networks. The GIX ismanaged by Renater
www.urec.fr/Renater/Sfinx/French/SFINX.html andwww.urec.fr/Renater/gix/gix1000.html
Germany DE-CIX Based in Frankfurt. www.eco.de/Greece Athens Internet
Exchange (AIX)Ministry of Development, GeneralSecretariat for Research andDevelopment. GRNET (Greek Researchand Technology Network).
www.grnet.gr/index_en.html
Hungary BIX - Budapest InterneteXchange
goliat.c3.hu/bix/
Iceland NA NA NAIreland INEX (Internet Neutral
Exchange)Facility for Irish Internet ServiceProviders. Not-for-profit.
www.inex.ie/
Italy MIX - Milan InterneteXchange
Association of Italian Internet Providers(AIIP)
www.aiip.it/mixit.html
Italy NapRoma An Internet exchange point hosted bythe CASPUR (Consortium for theApplications of Supercomputation forUniversity and Research) facilities at theUniversity of La Sapienza in Rome andco-operatively operated by itsparticipants.
www.nap.inroma.roma.it/
Japan JPIX (JaPan InterneteXchange)
www.jpix.co.jp/

DSTI/ICCP/TISP(98)1/FINAL
26
Table 4. Selected Internet exchange points in OECD area (continued)
Japan NSPIXP (NetworkService Provider InterneteXchange Point)
xroads.sfc.wide.ad.jp/NSPIXP/www.inoc.imnet.ad.jp/noc/nspixp2.html
Korea NA NA NALuxembourg NA NA NAMexico NA NA NANetherlands Amsterdam Internet
Exchange (AMS-IX)Used by ISPs to exchange traffic at anational or international level.
www.ams-ix.net/
New Zealand New Zealand InternetExchange (NZIX)
University of Waikato www2.waikato.ac.nz/NZIX/
Norway NA NA NA
Poland NA NA NAPortugal PIX (Portuguese Internet
eXchange point)www.fccn.pt/PIX/
Spain ESPANIX (SpanishNeutral InterconnectionPoint)
www.espanix.net/
Sweden DGIX - KTHNOC Royal Institute of Technology (KTH),Stockholm.
www.sunet.se/dgix/
Switzerland SIX - the Swiss InterneteXchange
ISP national and international trafficexchange. SIX-B - Bern SIX-Z - ZürichSIX-L - Lausanne (planned)
www.six.ch/
Switzerland CERN InterneteXchange Point (CERN-IXP)
Open to all ISPs having a point ofpresence in Switzerland and/or France.
wwwcs.cern.ch/wwwcs/public/ip/cernixp.home.html
Turkey NA NA NAUnitedKingdom
LINX (London InterNeteXchange)
Not-for-profit industry association ofISPs.
www.linx.net
UnitedKingdom
MaNAP (ManchesterNetwork Access Point)
Not-for-profit industry association ofISPs.
www.manap.org/rel_22_jul.html
UnitedKingdom
i-Exchange Located in Telehouse London, i-Exchange is a neutral peering pointallowing UK ISPs to exchange trafficwith each other on a regional or nationallevel.
www.i-exchange.co.uk/
United States Commercial InterneteXchange (CIX) andmany others. ReferTable 7
CIX is a not-for-profit Industryassociation of ISPs.
www.cix.org/
1. In some case information was not available in English or French on the above sites.
Source: OECD and Bill Manning’s http://www.isi.edu/div7/naps/

DSTI/ICCP/TISP(98)1/FINAL
27
Table 5. Selected US Internet exchange points
State Network exchange point Status URLArizona The Tucson
InterconnectThe Tucson Interconnect allowstaking IP packets that go betweenone Tucson ISP and anotherTucson ISP off the expensivenational circuits and onto theinexpensive local circuits.Membership is by invitation, free,and includes automatic peeringwith all participants. Only Tucsonbusinesses are welcome.
www.tti.aces.net/
Arizona The Tuscon NAP Non-NSF Regional NetworkAccess
www.ttn.rtd.net/
California Digital InternetExchange
Digital’s Internet Exchange inPalo Alto is a data andcommunications center at whichISPs and their customers canlocate equipment for redundantaccess, reliability and operationalstability. In addition, theCommercial Internet Exchange(CIX) has installed their router,which provides free multilateralpeering to CIX members at theExchange.
www.ix.digital.com/
California MAE-West MAE West is interconnected withthe Ames Internet Exchange,operated by NASA at the AmesResearch Center.
http://www.mfsdatanet.com/MAE/
California MAE-Los Angeles A WorldCom public exchangepoint for ISPs.
http://www.mfsdatanet.com/MAE/
California LAP/MAE LAP is located in the LA area, atISI and connects to MFSDatanet ((MAE-LA).
www.isi.edu/div7/lap/
California Pacific Bell NAP Pacific Bell’s San Francisco NAPis one of the four original NSF-sponsored network access pointsfor the Internet infrastructure.
www.pacbell.com/products/business/fastrak/networking/nap/index.html
Colorado The MAX: MountainArea Exchange
The MAX is a public Internettraffic exchange point in Denver.
www.themax.net/
District ofColumbia
MAE East A NAP provided by MFS Datanetin Washington, DC One of thefour original NSF-sponsorednetwork access points for theInternet infrastructure.
www.mfsdatanet.com/MAE/

DSTI/ICCP/TISP(98)1/FINAL
28
Table 5. Selected US Internet exchange points (continued)
Georgia Atlanta exchange point The Atlanta-NAP houses fibresystems from Bell South, MFS,and MCI Metro.
www.atlanta-nap.net/
Georgia Atlanta InternetExchange (AIX)
Proposed. www.com/aix/
Illinois Chicago NAP Ameritech’s Advanced DataServices Network ExchangePoint. One of the four originalNSF-sponsored network accesspoints for the Internetinfrastructure.
nap.aads.net/index.html
Illinois MAE-Chicago A WorldCom public exchangepoint for ISPs.
http://www.mfsdatanet.com/MAE/
Indiana IndyX, Indianapolis DataExchange
The exchange functions as agateway to a new nationalswitched Internet backbone, aswell as a local exchange betweenISPs.
www.indyx.net/info/
Maryland Baltimore NAP The Baltimore NAP provides acommon forum for mutual inter-exchange of Internet networktraffic among multiple ISPs.
www.baltimore-nap.net/
Massachusetts Boston MXP The Boston MetropolitanExchange Point or MXP is aproject undertaken by MAINetwork Services with thesponsorship and support of theCity of Boston. The functionalgoal of the exchange is to allowISPs, businesses, universities,and any other organisations withlarge IP networks to developfaster connectivity between oneanother and to rely less onInternet infrastructure located ingeographically distantlocations.
www.mai.net/bostonMXP/
Michigan Detroit MXP Services local or regional traffic www.mai.net/mxp/MXP.HTMLMissouri STLOUIX The St. Louis Open Internet
eXchange was created to improvethe speed and reliability ofInternet traffic for St. Louis andMidwest regional businesses andindividuals.
www.stlouix.net/
New Jersey IPeXchange IPeXchange is a public/privatejoint venture of the AV-Networkand IPeXchange participants.
www.avnet.org/isg/njipxdes.html

DSTI/ICCP/TISP(98)1/FINAL
29
Table 5. Selected US Internet exchange points (continued)
New Jersey Sprint NAP One of the four original NSF-sponsored network access pointsfor the Internet infrastructure.
www.merit.edu/nsf.architecture/Sprint/.index.html
New Mexico New Mexico NAP Under construction www.nmnap.net/New York MAE-New York A WorldCom public exchange
point for ISPs.http://www.mfsdatanet.com/MAE/
New York Telehouse NY IIX Telehouse operate two peeringservices -- one aimed at servingthe needs of global ISPs and theother aimed at bringing togetherthe ISPs in the New Yorkmetropolitan area.
www.telehouse.com/Telehouse/InternetOffer.htm
Ohio FibreNAP FibreNAP is a layer 2 NAP whereISPs, Network Service Providers,and corporations, can meet toexchange traffic (peer), sellservices to their customers(transit), or privately connect twonetworks.
www.fibrenap.net/
Oregon Oregon InternetExchange
The Oregon Internet Exchange(Oregon-IX) provides rich Internetconnectivity for ISPs and high-volume networks throughout theNorthwest region.
antc.uoregon.edu/OREGON-EXCHANGE/
Pennsylvania Philadelphia InternetExchange
The Philadelphia InternetExchange is a public Internetexchange point located inPhiladelphia for ISPs and otherslooking for better connectivity toothers in the region.
www.phlix.net/
Tennessee Nashville CityNet Nashville CityNet is the intra-citycomputer network of Nashville.
nap.nashville.net/
Texas MAE-Houston A WorldCom public exchangepoint for ISPs.
mae.houston.tx.us/
Texas MAE-Dallas A WorldCom public exchangepoint for ISPs.
http://www.mfsdatanet.com/MAE/
Texas Metro Access Point Aim to exchange IPv4 packetsbetween service providers andinterested parties with a lowbarrier to entry and a lowrecurring operation costs. Austin:AMAP (online);Dallas-Fort Worth: DFWMAP(proposed); Houston: HMAP (Inprogress); San Antonio: SAMAP(In progress).
www.fc.net:80/map/

DSTI/ICCP/TISP(98)1/FINAL
30
Table 5. Selected US Internet exchange points (continued)
Utah Utah REP Utah REP is a regional exchangepoint.
utah.rep.net/
Vermont Vermont InterneteXchange - VIX
Proposed. www.hill.com/trc/vix/index.html
Washington SNNAP: SeattleNetwork-to-NetworkAccess Point
Facilitates high performance,reliable connectivity amongnetworks in the Puget Soundregion and Washington state
weber.u.washington.edu/~corbato/snnap/
Washington InterNAP A Private Network Access Point(P-NAP): providing highbandwidth TCP/IP connectivitybetween the leading national andglobal ISPs, InterNAP, and itscustomers.
www.internap.com/nap4.html
Washington NIX: Northwest InterneteXchange
This point was designed with theintention that providers in thenorthwest would get together andexchange traffic with each other,as an alternative to using theheavily used backbone providersand NAPs.
www.structured.net/nix/
Washington Eastern WashingtonInternet Exchange
The EWIX is an exchange point inSpokane Washington wheremembers connect via FrameRelay or dedicated 10 Mbpsethernet connections for theexchange of TCP/IP based traffic.There is a significant amount of e-mail and Web traffic thatoriginates and terminates on localISPs networks. Private exchangepoints, like the EWIX, provide amore direct path for trafficbetween ISPs and companies ina particular region.
www.dsource.com/ewix/
1. Shaded NAPs are the four original NSF-sponsored network access points for the Internet infrastructure.
Source: OECD

DSTI/ICCP/TISP(98)1/FINAL
31
Table 6. Selected peering policies and prerequisites of Internet exchange points
Peering and Related Policies.
Australia (WAIX) Each network agrees to exchange traffic with the others at no cost, this not only eliminatestraffic costs, but the savings means much faster links can be used. Peering does not replacethe need for transit links. Participants still need to maintain an arrangement with a carriageprovider to offer a "default route" for full Internet connectivity. ISPs may be able to purchase thistransit by means of a direct connection inside the WAIX facility, but outside the WAIX peeringfabric by arrangement with another participant.
Australia (AUIX) A multilateral peering agreement participating ISP is obligated to advertise all its (participating)customers’ routes to all the other MLPA (multilateral peering agreement) participating ISPs;obligated to exchange traffic among customers of all MLPA participating ISPs; entitled to selectrouting paths among the MLPA participating ISP. A multilateral peering agreement ISP is notobligated to provide transit to other MLPA participating ISPs; or obligated to announce theroutes obtained from its other bilateral peering agreement partners to the MLPA participatingISPs. No monetary settlements are required by this agreement.
Austria (VIX) VIX members need to agree on bilateral peering arrangements for traffic exchange. There is noobligation to exchange traffic with all other participants. A VIX member is required to be an ISPwith its own international Internet connectivity. This connectivity must not be solely provided byother VIX member(s). A VIX member must provide Internet access to its customers at the IPlevel. In general, mere content provision does not qualify for VIX membership. Traffic is onlypermitted between VIX members having an explicit peering agreement. Injection of traffic intorouters of non-peers is prohibited. VIX members will document their peering status in the RIPEdatabase and notify VUCC of any changes.
Belgium (BNIX) Peering with all other ISPs at the BNIX is not mandatory. Separate peering agreements haveto be negotiated. ISPs are however asked to have at least one peering active.
Denmark (DIX) Each party agrees not to charge the other party for interconnection-related matters, includingcharges based on traffic volume, commonly called "settlements", until mutually agreed by theparties. Transit traffic is traffic that has its origin or destination in a network which is not part ofthis agreement. Such traffic should not be covered by the agreement. (suggested DIX PeeringAgreement).
France (GNI) NAIreland (INEX) Members must have their own permanent international connection to the Internet. As a rule of
thumb, new members must have a route from their network to MAE-East in the United Stateswhich does not pass through an existing INEX member. Each member must be licensed by theDepartment of Communications. End-users who do not sell Internet services may not connectto the INEX. Internet resellers who buy connectivity from existing INEX members, and/or whodo not have international capacity independent of members are likewise excluded frommembership. Members may not connect more than two wide-area circuits to their router housedin the INEX rack, nor may they directly connect customers via circuits to their router. Eachmember must publish the contact to whom requests for peering should be sent. Any peeringrequest by a potential new member must be responded to within seven working days of therequest. Members will not install “sniffers” to monitor traffic passing through the INEX.
Netherlands (AMS-IX)
After being connected and up and running the ISP needs to arranges its own peerings.
Sweden (D-GIX) Each ISP manages its own router and decides with which other ISPs it will set up peeringsessions for exchanging traffic at the D-GIX. There is no obligation to exchange traffic with allother participants, but each ISP must peer with at least two other ISPs on the D-GIX.

DSTI/ICCP/TISP(98)1/FINAL
32
Table 6. Selected Peering Policies and Prerequisites of Internet Exchange Points (continued)
Switzerland (SIX) Peerings occur between all ISPs within the SIX i.e. once an ISP joins the SIX it has establishedpeerings with all other ISPs within the SIX. Agreement to join SIX confers no rights upon eitherparty to use another party’s international connections. Operators joining the neutral LANnetwork are free to set up bilateral network connections independently of the SIX. Routing mustbe structured so that a network is always identified as being the same AS as "source as" evenwhen it involves more than one peering point. Any ISP (no end user organisations) is eligible tojoin SIX, plus a couple of exceptions including governments (e.g. Swiss federal government).and academic institutions of higher learning. A SIX organisation must have one otherpermanent Internet connection.
Switzerland(CERN-IXP)
The CERN-IXP is a neutral Internet exchange point between Internet operators and is not a"service provider" per se. CERN operates an IXP in order to maximise its own Internetconnectivity. Traffic in transit through the CERN-IXP is not subject to any particular restrictions,but must conform to all applicable laws and guidelines, and to the usage policies of the sourceand destination ISPs. CERN accepts no liability in any respect for the nature of transit traffic.Connection to the CERN-IXP does not provide any automatic connectivity. In order to getconnectivity to other networks (e.g. Ebone, Eunet, Europanet, Transatlantic services, etc) it isthe full responsibility of the ISP to make agreements and/or subscribe to such services via otherISPs located on the CERN-IXP or elsewhere.
United Kingdom(LINX)
Applicants must have their own independent, permanent, international connection to theInternet. As a rule of thumb, applicants must have paths from within their UK network to four ofthe Internet "root" name servers, which do not pass through existing LINX members. Membersmust have operational peering agreements with at least 20 per cent of existing LINX Members.Members must publish service details, including at least one public service allowing customersto connect to the Internet. Members must respond to a peering request by a potential newmember within two working days of the request. Members must publish their contact to whomrequests for peering should be sent. Members may not directly connect customers via circuits totheir router housed in the LINX rack. Members will not install “sniffers” to monitor traffic passingthrough the LINX.
United Kingdom(MaNAP)
Members must have operational peering agreements with at least one existing MaNAPmember. Members must publish prices, including at least one public service allowing customersto connect to the Internet. Members may not directly connect customers via circuits to theirrouter housed in MaNAP rack. Members will not install “sniffers” to monitor traffic passingthrough the MaNAP.
United States(PhiladelphiaInternet Exchange)
PhlIX participants are welcome to set-up bilateral peering arrangements (or not) with any otherparticipants as they see fit. To help reduce the work load in arranging peering, PhlIXmanagement will maintain a list of those wishing to participate in an MLPA. PhlIX managementrecommends participation in the MLPA.
United States(Ameritech’sChicago NAP)
Attaching customers should intend to form bilateral or multilateral agreements with other NAP-attached networks; upgrade attachment technology and protocols as appropriate, andparticipate in the Chicago-NAP mailing list. A physical connection to a NAP should not beconsidered as an "Internet Connection." The NAP is an exchange point and peeringarrangements between ISPs should be made before connecting. In addition, once the MLPA isin effect, additional bilateral transit agreements may be made between network providers.

DSTI/ICCP/TISP(98)1/FINAL
33
Table 6. Selected peering policies and prerequisites of Internet exchange points (continued)
United States(CIX)
Member networks have a fundamental agreement to interconnect with all other CIX members.There is no restriction on the type of traffic that may be routed between member networks. Thevalue of this basic agreement to exchange all legitimate traffic will continue to increase as thenumber of CIX member networks grow. There are no "settlements" nor any traffic-basedcharges between CIX member networks. Each member network connects to all other membernetworks directly or indirectly through the CIX router at no additional cost to member networks.
United States(PAC Bell NAP)
Multilateral peering agreement participating ISP is obligated to advertise all its (participating)customers’ routes to all the other MLPA participating ISPs and accept routes from thecustomer’s routes advertised by the ISPs; obligated to exchange traffic among the customers ofall the MLPA participating ISPs; entitled to select routing paths among the MLPA participatingISPs; and entitled to make Bilateral peering agreements with non-MLPA participating ISPs. AMLPA participating ISP is not obligated to provide transit to other MLPA participating ISPs; orobligated to announce the routes obtained from its Bilateral peering agreement partners to theMLPA participating ISPs.
1. Wording is taken from sites concerned.
Source: OECD.
Table 7. Internet Exchange point pricing
Pricing Policies
Australia (WAIX) Any network may link into the WAIA NAP. The cost of connecting is one off set-up fee ofUS$ 370 and monthly maintenance fee of US$ 111. The peering point is neutrally managedby the Association on a non-profit basis.
Australia (AUIX) The following charges are proposed by AUIX for the purpose of participating at theexchange points: a one-off setup charge of US$ 370; A monthly maintenance charge ofUS$ 111; for those participants requiring interNAP carriage, a monthly fee of US$ 148 for ashared 64Kb test circuit. The costs as indicated above go towards the following: 1. Cost ofputting in place an Ethernet switch and router at exchange point; 2. Cost of putting in placea rack enclosure at the exchange point; 3. Cost of rental of space for rack enclosure at theexchange point; maintenance of route server will be provided at no charge by auix.net
Austria (VIX) VIX services are provided on a not-for-profit basis; hence tariffs aim at cost recovery only.VUCC will charge each VIX member an annual tariff of US$ 2 128, for standard equipmenthousing (up to three height units in a 19" rack) and US$ 709, per height unit for any furtherrack space needed. The annual charge includes the connection to one 10BaseT switch port,and overheads like floor space, UPS power, A/C and VIX management.
Belgium (BNIX) Prices not published on Web site. Available on request.Denmark (DIX) The network cover all expenses in the establishment of its connection. A low speed
connection is presently free of charge. A high speed connection at the FDDI ring ischarged a yearly sum of US$ 1 740. Around the clock (7*24) access to the DIX site ischarged an annual US$ 1 160 per network. Access during normal working hours is free ofcharge.

DSTI/ICCP/TISP(98)1/FINAL
34
Table 7. Internet Exchange Point Pricing (continued)
France (GIX) Tariffs as from 1st June, 1996 : managed GIX on shared Ethernet : US$ 9 893 per year (notincluding the leased line) plus cost of the leased line; managed GIX on switched Ethernet :US$ 12 177 per year (not including the leased line) plus cost of the leased line; managedGIX with joined Ebone access either US$ 9893 or US$ 12177 per year ( depending on thechoice of the managed GIX) plus cost of the leased line; an additional cost of US$ 4110 peryear (exploitation and serial link between the GIX and Ebone EBS and exploitation)EBONE costs (without the US$ 8174 for the router) hosted GIX US$ 5023 per year (notincluding the leased line) plus cost of the leased line.
France (GNI) The access to the PEP is free during the experimental phases, from June 1st 1997 untilDecember 1st 1997. To get connected to the PEP you must lease a leased line from thePEP (Proximity Exchange Point) to your local Point Of Presence.
Ireland (INEX) New members, on joining, will pay the agreed annual fee (currently US$ 3106). Newmembers joining more than halfway through the year will pay half of the annual cost.
Netherlands(AMS-IX)
The costs of the connection to the physical infrastructure are as follows: Connection to theswitched ethernet 10BaseT: US$ 531 per month (excl. VAT) Connection to the switchedethernet 100BaseTX: US$ 902 per month (excl. VAT)
Sweden (D-GIX) All ISPs are welcome to connect to the D-GIX. There is a modest fee to cover housing andpower expenses. Connecting ISPs are also responsible for providing the local loop to reachthe D-GIX. Fee not published on home page.
Switzerland (SIX) Connection to the SIX is not accompanied by any form for compensation between theparties except for a monthly fee of US$ 37 covering costs housing (for 1 router/modem),electricity (for 1 router), accessing the SIX Ethernet segment.
Switzerland(CERN-IXP)
CERN will charge a standard fee for establishing a new connection and an annual fee formaintaining each connection. This will include physical access to the CERN-IXP (initiallyEthernet or FDDI, ATM later), as well as overheads such as floor space, UPS electricity, airconditioning and administration. The standard CERN-IXP connection charges during the1996-1997 start up period, payable in one settlement, are the following: One timeinstallation charge: US$ 1485. Recurrent monthly charge: US$ 495. First year total (fullyear): US$ 7426. The prices above only apply to shared Ethernet connections. In case, theISP requires a dedicatedEthernet segment, a port on an FDDI concentrator, or an ATM connection, extra chargeswill apply based on full cost recovery basis.
United Kingdom (LINX) New members joining in the first half of the year will pay the agreed joining fee (currentlyUS$ 14749) for new members for that year, plus the half-annual fee (currently US$ 7375)for existing members for that 6 month period.
United Kingdom(MaNAP)
New members joining in the first half of the year will pay the agreed joining fee (currentlyUS$ 2950, proposed) for new members for that year, plus the half-annual fee (currently US$1475, proposed) for existing members for that 6 month period.
United Kingdom (i-Exchange)
There is an initial joining fee, of US$ 2950 (10baseT port) or US$ 7375 (100baseT port),along with a half annual fee of US$ 1475. Additional ports on the i-Exchange switch can beprovided for a one off setup charge, currently US$ 2950 (10baseT) or US$ 7375(100baseT).
United States (BostonMXP)
The Boston MXP is priced on a cost recovery basis. There are two choices ofconnectivity and the pricing is listed below: US$ 500 per year and US$ 500 install for either10 megabit or 100 megabit switched access. Peering and Transit services will carryadditional charges. MAI will, of course, peer with anyone who connects, but that does notinclude Transit.

DSTI/ICCP/TISP(98)1/FINAL
35
Table 7. Internet Exchange Point Pricing (continued)
United States(Baltimore NAP)
Membership in the Baltimore NAP is currently free. Space for a CSU/DSU, and router isprovided at no charge by ABSnet for a period to last no longer then June, 1998, after whichtime ABSnet has the right to re-negotiate rack space rental at reasonable, current rates inline with other ABSnet co-lo space and other NAP co-lo space, if it so chooses. ABSnetunderstands it is providing the space free of charge as a "seed" donation for the building ofa successful NAP, and that charges for space and NAP access, at appropriate rates, are avery real possibility in the future to recover it’s costs of service. Membership fees for theNAP will probably be instituted as the NAP incurs any operating costs. NAP members areencouraged to donate needed equipment to the NAP to defray operating costs.
United States (CIX) Yearly fees for CIX members connecting to the CIX router, in addition to a one time $1 500installation fee, are : T-1 Port (US$ 10000); SMDS T-1 Port (US$ 5000); SMDS Above T-1(US$ 7500); Frame Relay T-1 (US$ 5000); FDDI (Co-located at Digital for US$ 15000).
United States(PAC Bell NAP)
Our NAPs are located in the San Francisco Bay Area (Service Area 1) and the LosAngeles area (Service Area 5). Pacific Bell will work with any interexchange carrier of theNAP customer’s choice. Rates are: DS3 (45 Mbps) US$ 1500 (installation), US$ 5500(monthly service); OC3c (155 Mbps) US$ 3000 (installation), US$ 6956 (monthly service)
1. Currency conversion for US$ is based on 1996 purchasing power parities. Wording is taken from sites concerned.
Source: OECD.
International traffic exchange and infrastructure financing
Before examining the different aspects of how international backbone networks are financed it isnecessary to note how the current arrangements emerged over private and public networks. Thisdistinction is important because private and public networks have historically had very different models oftraffic exchange. The terms “private” and “public” do not indicate ownership status but rather whether theuse of such networks were restricted to a defined group of users or open to the public. In most countriesthis distinction was significant in times past because virtually all telecommunication services offered tothe public were reserved for monopoly operators. In other words, a user who leased dedicated capacityacross the PSTN could not provide certain services to the public. For example, “reselling” PSTN capacityor providing switched telecommunication services would have placed a private network operator incontravention of government imposed monopolies. The reason users opted for private networks was thatdedicated capacity was priced less expensively by telecommunication carriers than transporting the largeamounts of the customer’s own traffic over public switched networks.
Traffic exchange between private networks, in those instances where it occurred, did not incur asettlement or interconnection fee. If a private network spanned different geographical monopolies, suchas in the case of an international leased line, then the user paid both operators for their nominal half of thecircuit.
By the time NSFNET was created, the United States had liberalised its telecommunicationmarket, but the Internet was still considered a private network because it was restricted to a defined groupof users. Qualified academic or research institutions could join NSFNET and exchange traffic amongthemselves on a non-commercial basis. The non-commercial nature of NSFNET was the reason for theacceptable use policy. This aimed to preclude commercial traffic being exchanged over “publicinfrastructure” owned by US telecommunication carriers but leased by NSFNET via funding from theUnited States government.

DSTI/ICCP/TISP(98)1/FINAL
36
Thus, to summarise developments, in its first guise as a US military network, the question ofcommercial arrangements for Internet traffic exchange between networks owned by different parties wasnot at issue. In its next guise, as a US academic network, managed under various contracts withtelecommunication infrastructure providers, the issue of commercial traffic exchange was similarly not atissue because users were not in the business of selling communication services to each other. As theInternet was opened to academic institutions in other countries the same situation applied. To connect tothe NSFNET a foreign academic network needed to purchase an international leased line and pay atelecommunication carrier in its home country and carrier at the US end for both their halves of the circuit.
According to the NSF, network managers outside the United States wanted to connected to theNSF backbone network for two reasons. The first reason was that the United States was the location of“so many of the Internet resources” and initial Internet infrastructure.47 The second reason was the pricingon international circuits. According to the NSFNET management, the earlier introduction of competitionin the United States made that country’s half of the international leased lines much less expensive thanthat of most other countries. This meant that network managers had an incentive to connect to the NSFbackbone network rather than directly to another country.
When the acceptable use policy was ended and the Internet opened for ISPs to sellcommunication carriage to the public the inherited models of traffic exchange were maintained. Aspreviously noted, the word most commonly used to describe these arrangements is peering. While othermethods of interconnection payment exist among ISPs, peering still accounts for the bulk of internationaltraffic exchange. This means that individual ISPs generally pay telecommunication carriers the full costof the circuits connecting their networks to international peering points. In other words an ISP still paysfor two half-circuits but, due to peering, carries another ISP’s traffic. In those cases where the ISP ownsthe international infrastructure, such as a telecommunication carrier owning a share of an undersea cable,the ISPs pay the full cost of both circuit halves to reach the international peering point. Accordingly, theInternet model for financing international infrastructure, for those networks that peer, effectively shifts thefinancial mid-point for traffic exchange from oceans (as in the case of cables) and geostationary orbit (asin the case of satellites) to Internet exchange points.
The above description of the evolution of traffic exchange is not controversial. However, theway these arrangements have evolved is emerging as a contentious issue among some of the owners ofbackbone IP networks connecting the Asia-Pacific region to the United States. In a competitivetelecommunication world, it is natural for end-to-end services to emerge across international borders. Thecorollary is that companies will build their own end-to-end infrastructure or pay full circuit costs to theproviders of this infrastructure. However the question remains open for commercial negotiation as to howISPs that do not wish to peer want to charge each other for transit.
The chief complaint of the Asia-Pacific carriers such as Telstra of Australia and KDD of Japan isthat in shifting the financial mid-point to US Internet exchange points they are paying the full cost ofinternational carriage for both their customers and customers of ISPs based in the United States.48 BothKDD and Telstra have argued that the costs of the international links should be met by the parties usingthat infrastructure. KDD says that in Asia many carriers are already sharing carriage costs amongthemselves. The Asia-Pacific Internet Association (APIA), has also raised the issue of funding theInternet’s international backbone networks.49 In late 1997 APIA requested comments on how futureInternet infrastructure growth should be financed and the models that might best guide this development.In addition, Telstra has mounted legal action in the United States in an attempt to get the US FederalCommunications Commission to review this issue.50

DSTI/ICCP/TISP(98)1/FINAL
37
In support of Telstra’s plea for the discussion of financing of international infrastructure costsand APIA’s explanation of its call for comments, these entities note the shifting balance of traffic. BeforeNSFNET was retired as the Internet’s premier backbone network, in May 1995, data on inbound andoutbound traffic for the United States showed a large imbalance. More content was originating from theUnited States and being shipped to the rest of global Internet than was originating elsewhere and beingterminated in the United States. By 1997 Telstra estimated the flow was of the order of 70:30 UnitedStates-to-Australia versus Australia-to-the United States.
It is at this point in the debate that the issues involved begin to get more complex. If the trafficflowing between an Asia-Pacific country and the United States was contained within a single internationallink and the geographical borders of both countries a model for sharing infrastructure costs might be self-evident. However the Internet does not transport traffic in such a precisely defined or bounded way.51 Notonly might the IP packets travel along different paths, traversing different countries, but so might therouting information drawn from global root servers. From the perspective of ISPs in the United States,this means that the greater the capacity foreign ISPs put in place to US-based Internet exchange points, thegreater their costs in providing domestic infrastructure used for international transit. While there is littleinformation available to understand the balance of these costs, or even information on patterns ofinternational traffic (including transit traffic and traffic related to DNS requests) necessary to inform anexercise aimed at allocating costs on an international basis, it is possible to indicate how connectivity isevolving across the entire Asia-Pacific region.
Asia-Pacific regional and inter-continental internet connectivity
A 1992 paper by members of the Intercontinental Engineering and Planning Group (IEPG) had adiscussion of the considerations for the Asia-Pacific region in connecting to NSFNET (Box 3). This papernoted that the Asia-Pacific region’s Internet connectivity was almost exclusively via the United States.This included traffic exchange among entities in the same country and all transit traffic destined for ororiginating in Europe. In addition to tariff considerations the paper noted “policy considerations” relatingto connectivity having been configured in this way. These considerations included routing stability withthe authors expressing the opinion that putting in place direct independent routes between the Asia-Pacificregion and Europe might “erode stability”.
By 1993, there were still virtually no intra-regional links between Asia-Pacific countries exceptthose transiting North America (see Appendix 1 for maps prepared by the Asia-Pacific NetworkingGroup52). The exception was a leased line between Korea and Japan. The first independent directconnections to Europe were added in 1994 from Japan, Korea and India and a second intra-regional linkbetween Japan and Chinese Taipei was also added. Over the next two years, many new intra-regional andlinks to Europe were added. However not only were the number of direct links to the United Statesincreasing but so was the size of these connections. In terms of large-scale connectivity, by the first halfof 1996 there were only three connections with 34 Mbps or higher capacities. Two of these were fromJapan to the United States and one from Australia to the United States. In the second half of 1996, thefirst regional link of 34 Mbps or higher was added between Korea and Japan, as well as one addition linkbetween Japan and the United States. In 1997, as the APNG maps indicate, the amount of connectivityacross the Pacific spiralled with more than 20 links of 45 Mbps or higher. At the same time, there wasonly one intra-regional link of this scale (between Korea and Japan) and no direct links from the Asia-Pacific region to Europe of this scale.

DSTI/ICCP/TISP(98)1/FINAL
38
The pace at which demand for Internet services drove new capacity allocation across the Pacificis unprecedented. At the start of January 1995 Telstra’s international links for IP traffic amounted to6 Mbps. A year later this had increased to 82 Mbps and by August 1997 had climbed to 140 Mbps.Telstra stated in late 1997 that demand for international Internet capacity was growing at around 10 Mbpsper month and accelerating. Much of this demand is being translated into bandwidth allocated across thePacific because this is where the available capacity IS to be found. Thus, even if North America is not thelocation for the most Internet users and the most accessed content, it might still be the case that a greatdeal of transit traffic, including intra-regional traffic and traffic to and from Europe, needs to be passedover the most readily available international capacity. For example, of the undersea cables originating andterminating in Japan, some 70 per cent of the total capacity is between Japan and the United States(Table 8) and only 30 percent to regional or other destinations.
It should be noted that international patterns of traffic for the Internet are radically different fromthose for international PSTN traffic. Singapore provides one example of these differences. The premierdestination for Singapore’s international PSTN traffic is Malaysia with just over one-third of all outgoingtraffic being terminated in that country. By way of contrast, only 0.4 per cent of the international capacityallocated for global Internet connectivity, by Singapore Telecom’s Internet Exchange (STIX) connectsdirectly to Malaysia (Table 9) (Appendix 3, Figure 4). The difference in Internet and PSTN trafficpatterns between Singapore and Canada is even more extreme. While less than one per cent ofSingapore’s outgoing PSTN traffic terminates in Canada, a massive 46.7 per cent of the capacity allocatedfor Singapore, global Internet connectivity is on a route to Vancouver.
How traffic traverses Asia-Pacific links is a result of routing policies, which depend on peeringor transit agreements between partners. Accordingly, a packet may not travel by the most direct orobvious route between two countries. A user in Singapore wanting to access Japanese content might findthat traffic goes via the United States. A further consideration is the quality of service within the Asia-Pacific region compared to intercontinental links. It is still the case that for some Asia-Pacific countriespackets travel faster across the Pacific than between relatively close neighbours. For example, the averagetime it takes for packets to make a round trip between Singapore and the rest of the Asia-Pacific region isdouble the time it takes for a round trip to North America (Table 10) (Appendix 3, Figure 5). Even moreremarkable is that a round trip from STIX to Europe can be eight times faster than the regional average.In the latter case, this may indicate that the backbone between STIX and Monaco is relatively under-utilised compared to other links.
It is not easy to discern what overall impact the fact that intra-regional service is often slowerthan intercontinental has on network planners and users. A current axiom of Internet infrastructureplanning is to try to take content and services closer to users. Yet even if a content or service providercreates a mirror site in an effort to provide a more localised service, it may be still quicker for a user toaccess the same site on another continent rather than in a nearby country. This is because the “localinfrastructure” in some countries and regions does not perform as well as intercontinental links. Thisproblem is not confined to the Asia-Pacific region. According to studies of backbone performanceundertaken by Keynote Systems:
“Deploying a mirrored Web site in Europe to serve European users may not increaseperformance for those users. Our measurements show that a web server geographically close toits users can often deliver worse performance than a more geographically remote server. ”53
Accordingly, users may opt to use popular sites such as search engines at distant rather than atlocal sites generating increased intercontinental traffic. As for network planners, Keynote Systems saytheir studies lead them to conclude that:

DSTI/ICCP/TISP(98)1/FINAL
39
“Network engineers at backbone providers tend to focus on optimising traffic flow within theirown networks. They tend to de-emphasise or ignore connectivity and end-to-end response timeto users on other networks. The Internet, however, is an interconnection of many backbones andprivate networks, with the result that users rarely access Web sites that are directly connected tothe same backbone they are.”54
It is even more difficult to discern what all this means for discussions and negotiations over thefinancing on international infrastructure. Telstra and KDD’s point about shifting the financial mid-pointfrom within international links to Internet exchange points is a good one, but it is not clear how thisshould be interpreted in terms of different parties paying a fair share of infrastructure costs. Indeed beforethis question could be addressed in any meaningful way at great deal of information would need to begathered. For example, the issue of Internet traffic transiting via a third country would need to be studiedin greater detail than has been done to date as would the costs of providing infrastructure for this traffic.Moreover, while some have cast this as a debate between certain Asia-Pacific and US-based ISPs, itclearly has implications for ISPs in all countries.
Before proceeding to discuss further the issue of financing international infrastructure, it isinteresting to consider how ISPs, in countries that have largely not been party to this debate, might beaffected. For example, how might ISPs in Canada or Europe view this discussion, particularly given theremarkably large amount of capacity between STIX and Canada compared to that between STIX andEurope. The first thing to note is that it is self-evident that the capacity allocated between STIX andVancouver is far in excess of what would be required for transporting traffic solely between Asia-Pacificusers and Canadian users. This capacity is, of course, being used to transit traffic to other destinations andis related to hubbing strategies. This means it would be extremely complex to try to determine some typeof cost allocation among all beneficiaries.
The example of connectivity between STIX and Vancouver demonstrates the incompatibility oftraditional cost allocation in financing international infrastructure, such as sharing of half-circuit costs,with current Internet developments. Nevertheless the question of cost allocation is a valid one if thecurrent arrangements are not equitable in terms of use made of infrastructure relative to financialcontribution. Here, it is interesting to contrast the situation in Europe with that in the Asia-Pacific region.In the traditional PSTN model, European and Asia-Pacific ISPs would have paid half-circuit costs. In theInternet model, given the small amount of direct connectivity, it seems as if the financial mid-point hasbeen shifted to North America. For European ISPs, the current arrangements may be a less expensiveoption to connect to the Asia-Pacific regional than, for example, sharing direct half-circuit costs.
While listed half-circuit prices for leased lines are not what users pay, they provide one startingpoint for analysis of the cost to an ISP of purchasing intercontinental links. This analysis shows that if anISP in Belgium, Norway and the UK purchased a 2 Mbps leased line to the United States and paid for bothhalf-circuits it might be less expensive than sharing the average of a half-circuit cost for the same link toAustralia and Japan (Table 11). At the same time because the discounts are likely to be greater on routesto the United States than to Asia-Pacific countries this situation probably applies to ISPs in many otherEuropean countries. Recent analysis shows that it is often less expensive for European ISPs to purchasetrans-Atlantic capacity, to traffic exchange points in the United States, than to purchase equivalent trans-European capacity to European Internet exchange points.55 Moreover, the countries with less expensivetrans-Atlantic prices may be the points of departure for trans-European networks to aggregateinternational traffic. For example, UUNET’s largest connections between Europe and the United Statesare from the United Kingdom.

DSTI/ICCP/TISP(98)1/FINAL
40
A further factor in the financing of international infrastructure is how ISPs, with their ownintercontinental infrastructure, view these issues either because they own it directly or via alliances. Onereason why some European telecommunication carriers may not view the issue in the same way as someAsia-Pacific carriers is that they have been more active in investing in the US market. For example,France Telecom and Deutsche Telekom’s investments in Sprint, which has one of the largest Internetbackbone networks, mean that international IP traffic exchange could be handled by partners within theGlobal One alliance. Similarly, Cable and Wireless has a leading IP backbone network (CWIX) in theUnited States which it can connect to its other global networks. At the same time US-based ISPs havebeen much more aggressive in entering European markets to offer services to business and consumersthan in the Asia-Pacific region. Companies such as WorldCom/UUNET own and manage internationalnetworks providing end-to-end services for their business and dial-up customers.56
Companies such as UUNET also sell transit across the United States and around the world forother ISPs. This transit is priced at both flat and measured rates.57 The latter service allows users to haveusage-sensitive prices for “burstable connections” enabling large amounts of data to be transported inbursts, during periods of high demand, as required. The growth in scale of UUNET’s network capacityacross the Atlantic quadrupled to 45 Mbps in August 1996 from the beginning of that year, and thedoubled to 90 Mbps by October 1996. That same month, UUNET's parent company, WorldCom,announced that a US$ 500 million, 10 Gbps transatlantic link, was to be constructed and that it is expectedto commence service in 1998.58
Liberalisation of international infrastructure markets has underpinned the transfer of thefinancial mid-point from transmission links to public and private Internet exchange points. Thebargaining power each party has at a Internet exchange point no longer rests on regulation, as it did whenfinancial mid-points resulted from the connection of national monopoly networks. In the newenvironment, bargaining strength relies on several other factors. One factor is the network reach whichparties can offer each other via their own networks or those of their partners. As the leading globalInternet hub, ISPs in the United States are in the strongest bargaining position. The fact that the mostaccessed Internet content resides in the United States adds to this strength because the customers of ISPsin other parts of the world want direct connections to this content. Foreign ISPs want to reduce thenumber of hops between networks experienced by their customers to minimise response times. Directpeering and transit connections at public and private US NAPs and other exchange points are one way tominimise the number of hops. This is driving the creation of high-speed international connections to theUnited States in advance of some intra-regional connections elsewhere in the world.
In the newly liberalised environment for international infrastructure provision regulators would,no doubt, be loath to intervene in the commercial negotiations between ISPs. Moreover, it is not easy todiscern what would be the consequences of such intervention. If US policy makers mandated that US-based ISPs had to pay half-circuit prices it would push financial mid-points away from Internet exchangepoints and NAPs and back to transmission links. For European and Asia-Pacific ISPs this would increasethe financial appeal of linking to each other via the United States. This might increase congestion atNorth American Internet exchange points for users and generate new investment demands on ISPs basedin the United States. From the perspective of US-based ISPs they are already paying for a global hubbingfunction for the Internet. On the other, hand the existing system means that European and Asia-Pacifictraffic will continue to add to the burdens of the US-based Internet exchange points because this is theleast expensive option for Europe, and the Asia-Pacific ISPs have a more limited range of options.
In the face of such challenges, Asia-Pacific ISPs do have some strategies available. First, thecreation of attractive content at the national or ISP level would place ISPs in a stronger position tonegotiate joint sharing of infrastructure costs. Second, there is a growing incentive to use caching

DSTI/ICCP/TISP(98)1/FINAL
41
technologies at national or ISP levels to reduce the amount of international and national bandwidthrequired and therefore produce a lower cost. Third is the creation of Internet exchange points (andnumerous MXPs) in those countries and cities that are not well served. Fourth is for ISPs, which are notpresently PTOs, to consider construction of their own infrastructure. According to one example given inCommunicationsWeek International, owning cable infrastructure is considerably less expensive thanleasing capacity.59 According to one commentator, leasing a 2-Mbps circuit between the US mainlandand Australia from two PTOs would typically cost US$ 98 000 a month. A 2-Mbps link, known as aminimum investment unit (MIU), for the same route would cost only $12 638 per month -- an 87 per centdiscount.60 Fifth could be the deployment of IP multicasting on an international basis for the mostaccessed audio and video content, in an effort to reduce the increase in traffic due to webcasting. Sixth,could be a strategy by PTOs, outside the United States, to offer discounts to ISPs in an effort to become anattractive hub along the lines STIX.
Box 3: Extract from “Connectivity within the Internet - A Commentary”, by Geoff Huston(AARNET), Elise Gerich (MERIT), and Bernhard Stockman (SUNET/NORDUnet), 1992.
http://www.iepg.org/docs/IEPG-connect.html
From the perspective of the global Internet the picture is not complete without adding the connectivityissues of the Asia / Pacific region. Here policy objectives and link tariff constraints dictate that there is littleinternational regional infrastructure within the region (unless you consider that Hawaii and the United States itself arean integral part of the Asia / Pacific region!). The overall structure of regional connectivity here is that each nationalentity (and in some cases more than one entity within a nation) implements its primary connectivity through a link intothe US infrastructure, as being an implementation of their primary policy objective. There are no regional *IX,*BONE or *EX structures in place, as a consequence (in part) of these policy objectives and tariff constraints.
The current picture of connectivity within the region is there are direct connections into Hawaii, the USwest coast and even the US east coast, and a large proportion of inter-regional traffic transits portions of the USinfrastructure as a consequence. At this point in time there are no direct infrastructural Pacific regional connections tothe European infrastructure. While from a routing management perspective this may be considered to be a reasonableposition, when one takes into account the fact that there are at present no open transit paths within the United Statesitself, the end result is that inter-Pacific and Pacific / European connectivity is constrained by the policy provisions ofthe various US entities who are in a position to undertake a transit role for such traffic. Unless this situation is alteredin the near future a natural consequence of the growth in connectivity requirements will be a number of Pacificregional entities making direct connections to the European infrastructure, adding even further to the routingmanagement complexities and further eroding the levels of stability of the overall Internet connectivity structure

DSTI/ICCP/TISP(98)1/FINAL
42
Table 8. International undersea cable capacity to and from Japan (July 1997)
Cable Name Japan - UnitedStates. Number of64-kbit/s circuits
Cable name Japan - Regional and other,Number of 64-kbit/s circuits
TPC-3, Chikura - Hawaii 3 780 H-J-K, Chikura - Hong Kong 3 780TPC-4, Chikura - Point Arena 7 560 H-J-K, Chikura - Korea 3 780TPC-5CN, Miyazaki - Hawaii 120 960 APC Miura- HongKong 7 560TPC-5CN, Bandon - Ninomiya 120 960 APC Miyazaki-Toucheng 7 560
APC Miyazaki-Singapore 7 560C-J FOSC Miyazaki-Nanhui 7 560R-J-K, Naoetsu- RussianFed.
7 560
R-J-K, Naoetsu-Korea 7 560APCN, Miyazaki - Asia 60 480
Total 253 260 113 400Per cent of total 69.1 30.91. This table does not include KDD capacity on cables that do not originate or terminate in Japan, such as across the Atlantic.
Source: KDD Annual Report.
Table 9. Singapore’s Internet and traditional PSTN traffic patterns
Outgoing MiTT as per centof total outgoing PSTNtraffic (1996)
Internet capacity as a per cent of total capacity allocated forInternet on international links from Singapore (STIX) to globalInternet (November 1997)
Malaysia 34.5 0.4Indonesia 8.5 1.9Hong Kong 7.4 0.4United States 4.8 24.9Japan 4.8 6.8Australia 4.8 1.6China 4.8 0.4Thailand 3.7 0.0United Kingdom 3.2 0.0India 3.2 0.2Philippines 3.2 0.4Korea 1.4 0.4Brunei 0.9 6.2France/Monaco 0.9 6.2Canada 0.8 46.7Total of above 86.9 96.51. MiTT (Minutes of Telecommunication Traffic) is for 1996. The MiTT share for Korea and France are based on 1995 data.
The MiTT for Canada is an upper bound estimate.2. STIX stands for Singapore Telecom Internet exchange. Refer to http://www.stix.net/.
Source: OECD based on STIX, Telegeography.

DSTI/ICCP/TISP(98)1/FINAL
43
Table 10. STIX Regional capacity and performance
STIX to: Capacity (kbit/s) Per cent of totalcapacity inoperation
Average roundtrip time (ms) (1)
Vancouver 15360 46.7 331Los Angeles 4096 12.5 390San Francisco 4096 12.5 424Brunei 2048 6.2 270Monaco 2048 6.2 97Tokyo 1984 6.0 248Tokyo 1920 0.0 Not in operation during survey
Surabaya 512 1.6 792Sydney 512 1.6 508Tokyo 256 0.8 289Jakarta 192 0.6 1331Beijing 128 0.4 602Hong Kong 128 0.4 435Johor Bahru 128 0.4 763Jakarta 128 0.4 487Lahore 128 0.4 1475Manila 128 0.4 516Noumea 128 0.4 1208Seoul 128 0.4 272Taipei 128 0.4 281Bombay 64 0.2 291Colombo 64 0.2 1235Dhaka 64 0.2 1578Dhaka 64 0.2 908Dhaka 64 0.2 1244Karachi 64 0.2 1408Karachi 64 0.0 Not in operation during survey
Kathmandu 64 0.2 1677Lahore 64 0.2 1837Noumea 64 0.2 1208Phnom Pehn 64 0.2 1096Total (2) 32896 100.0 808Total to Asia-Pacific Region (3) 7296 22.2 885Total to North America 23552 71.6 382Total to Europe 2048 6.2 97
1. These are averages taken from the STIX site in late November early December 1997 over several weeks at different times ofday. Data from STIX: refer to http://www.stix.net/. Destinations mentioned two or more times have multiple links.
2. Excluding capacity not in operation. Simple rather than weighted average.3. Excluding North America and capacity not in operation.
Source: OECD

DSTI/ICCP/TISP(98)1/FINAL
44
Table 11. International leased line prices (2Mbps, $US)
From/To Australia Japan United States Ratio (%) of averageprice from Europe to
Australia/Japancompared to price to
United States.Norway 58445 58445 20920 279United Kingdom 68215 68215 29990 227Belgium 61064 61064 27926 219France 70030 41787 30046 186Switzerland N/A 43292 23252 186Ireland 51760 51760 28468 182Netherlands 30444 30444 16710 182Denmark 61736 61736 36525 169Germany 49944 44910 28659 165Poland 34166 62634 34166 142Finland 52104 52104 37778 138Portugal 60656 60656 47146 129Sweden 35034 35034 27604 127Italy(2) 54534 54534 44223 123Spain 45354 45354 45354 100Average 52392 51465 31918 163
1. Monthly half-circuit charge. Price data from Tarifica.
2. The prices in these tables are subject to rapid change. Between the time of writing and publication the prices in Italy werereduced to US$ 50 050 for the route to Australia and Japan and US$ 40 600 for the route to the United States (using the May1998 exchange rate of Lit 1775/US$ ).
Source: OECD.

DSTI/ICCP/TISP(98)1/FINAL
45
MAPPING THE INTERNET BY DOMAINS
All indications are that the amount of traffic being transported over the Internet is increasingvery rapidly. As a result infrastructure providers are having to escalate the amount of capacity they aremaking available on existing national and international routes. Few data are available to enable analysis ofnational and international IP traffic flows on the Internet, but all indications are that it is fundamentallydifferent from PSTN traffic patterns. The OECD report “Webcasting and Convergence: PolicyImplications” showed that by far the most accessed content on the Internet was located in the UnitedStates, and more particularly in California. To complement that analysis of content location, this sectionattempts to give a better indication of levels of Internet host penetration and users. It makes allowancesfor generic TLD registrations, which account for the bulk of Internet domain name addresses (Box 4).The other reason for examining gTLD registrations is to better understand how traffic may be generatedbetween some countries because of the relative use of gTLDs as opposed to TLDs.
Distributing domain name registrations
By September 1997, there were just over 2 000 000 domain names registered in the world(Table 12). The largest number of registrations occur under the gTLDs which account for just under75 per cent of all domain addresses. The greatest number of domain registrations in the gTLD category isunder .com. Registrations in national registries of TLDs (such as .be for Belgium) account for just over25 per cent of all domain addresses.
A small number of OECD countries utilise gTLDs far more than other countries. By far thelargest user of gTLDs is the United States followed by Canada. By mid 1997 some 98 per cent of allsecond level domains registered in the United States were under gTLDs and only 2 per cent registeredunder the .us domain name (Appendix 3, Figure 6). The next largest user of gTLDs is Canada. In factCanadians have opted to use gTLDs over the .ca TLD by a ratio of nearly five to one. The only otherOECD countries where the number of gTLD registrations at InterNIC outnumber TLD registrations innational registries are France, Korea and Spain. By way of contrast, the balance of domain registrations inother OECD countries favours TLDs rather than gTLDs. In the Czech Republic, New Zealand andPoland, more than 90 per cent of all registrations are made under .pl, .nz and .cz respectively.
Within the United States the largest concentration of domain registrations is in California(Table 13). In September 1997, California had just under 250 000 active gTLD registrations, just under22 per cent of all gTLD registration in the United States. At the same time, this represented just over 13per cent of the world’s combined total for gTLDs and TLDs. In fact California, in its own right, is thelargest market for domain names in the world, with twice as many registrations as the next largest marketsin Canada and the United Kingdom. Significantly, US states in their own right make up 19 of the top 30domain name markets.

DSTI/ICCP/TISP(98)1/FINAL
46
Registries located in OECD countries for gTLD and TLD registrations were responsible for93 per cent of the world’s domain addresses by mid 1997. Some 96 per cent of gTLDs and around85 per cent of all TLDs are registered in OECD countries. That being said users in non-OECD countries,on average, tend to favour registration under gTLDs over TLDs much more than users in most OECDcountries (Table 14). Outside OECD countries, the largest markets for gTLDs are Hong Kong, China andthe Arab Emirates. Brazil has the greatest total number of gTLDs and TLDs outside the OECD area. Thelocations outside the OECD area with the largest number of gTLDs per 1 000 inhabitants are the BritishVirgin Islands, Liechtenstein and the Cayman Islands (Table 15).
Reasons why users prefer registering domains under various gTLDs and TLDs are examined inthe OECD document “Domain Names: Allocation Policies”.61 The benefits cited for registering under agTLD, such as .com, are that they are viewed as not being identified with a particular geographicallocation. This is a particularly attractive quality for a company with international operations. It is alsotrue that as domain name users have opted for .com, particularly in North America, this has builtmomentum owing to the belief that Internet users will use the DNS as a directory service. In other words,users wanting to find a company or subject will try the company name or subject area followed by .comby way of instructing their browser.
Other reasons for registering under a gTLD, rather than a TLD, include the relative efficiency ofregistries. Even in 1997 some TLD registries are still staffed on a voluntary basis, although most haverecently moved to a more commercial footing. This has generally meant that users opting for a gTLDhave received a more efficient service at InterNIC than at their national registry. Moreover, the price forTLD registration, where the service is charged for, is usually more expensive than InterNIC’s gTLDregistration. In addition national TLDs often have restrictive policies in terms of who can register andhow many registrations a user is allowed. In some countries individuals are not permitted to registerunder TLDs and must have a presence in that country. Moreover, in some countries multiple registrationsare not permitted under TLDs. A further consideration is that some TLD registries only allocate third-level domain names to some users. Accordingly, some users may prefer the simplicity of a second-leveldomain name under a gTLD or may not want to be tied to a particular second-level TLD category (e.g. aparticular state or province). The other reason some users prefer gTLDs is that they do not want to bedirectly identified with a particular country because of regulatory or legal considerations. For example,the most accessed Web sites conducting online gambling all use .com domain addresses rather than theTLDs for their operational locations.
Weighting Internet host distribution
The most common indicator used to measure Internet development is the survey of Internet hostsundertaken by Network Wizards and RIPE (Réseaux IP européens). The Network Wizards surveyincludes all gTLD and TLD registrations and is undertaken every six months. The RIPE survey isundertaken monthly but is limited to European TLD registrations. While both surveys are muchappreciated by the Internet community the results need to be qualified and have several limitations. Thefirst qualification that needs to be made is that host data do not indicate the total number of users who canaccess the Internet. At best, they may be interpreted as the minimum size of the public Internet.
The second factor that has made it difficult to undertake comparative analysis between countrieshas been that there was no way to distribute Internet hosts under gTLD registrations on a national basis.In other words, the reachable hosts of a user in France registering under a gTLD would appear underdomains such as .com or .net rather than .fr.

DSTI/ICCP/TISP(98)1/FINAL
47
The availability of gTLD registrations by country gives the first possibility to considerredistributing Internet hosts under domain names such as .com to individual countries. The simplestoption is to weight the number of hosts under gTLDs according to the number of gTLD registrations froma particular country. In other words if 5 per cent of the total gTLD registrations are from a particularcountry, then 5 per cent of the total number of hosts surveyed under gTLDs are reallocated to that country.This methodology would, no doubt, be subject to a number of caveats. Nevertheless, it seems reasonableto assume that this approach gives a more accurate distribution of Internet hosts in OECD countries thanallocating all hosts under gTLD registrations to the United States.
The results of the weighted methodology are most striking in the case of Canada where there is a72 per cent increase in the number of hosts over the number of hosts surveyed solely under .ca (Table 16)(Appendix 3, Figure 7). Other countries to record significant increases, albeit from smaller base numbersof hosts, were France, Luxembourg, Spain and Turkey. All these countries recorded a relatively largeincrease in the number of hosts relative to the average OECD increase of 21 per cent. The countries forwhich this made very little difference are those where users mainly rely on national TLD registrationssuch as Iceland, the Czech Republic, Finland, New Zealand and Poland.
In terms of the ranking countries by the number of Internet hosts per 1000 inhabitants, comparedto the previous methodology, Canada rises three places and Luxembourg climbs two places. The UnitedStates falls five places, as would be expected, and Hungary declines two places. Most other countrieseither hold their ranking (12 countries) or rise or fall one place (13 countries).
Box 4: The Internet Domain Name System
The DNS essentially maps Internet addresses. It works for any Internet service that requires domain names:e-mail, WWW, FTP and so on. To function as part of the Internet a host needs a domain name that has an associatedInternet Protocol (IP) address record. This includes any computer system connected to the Internet via full or part-time, direct or dial-up connections. A top-level domain name (TLD) is either an ISO country code (for example, .bestands for Belgium) or one of the generic top level domains (a so called gTLD such as .com, .org, .net). Internetdomain names consist of a number of domains joined together by a dot (“.”) following a form similar to the followingexample: www.oecd.org. This example has three separate domains (www, oecd, and org). There can be four or moredomains within the domain name, but it is often impractical to go much beyond four. The domains follow a hierarchywhere the left-most domain is the lowest level, and the right-most domain (known as the top level domain) is thebroadest coverage. Left of the TLD is the is the second level domain (i.e. oecd), then a third level domain ifapplicable and so on. The OECD’s domain name is registered under a generic top level domain (i.e. .org) withInterNIC. This name provides a user friendly address which overlays a numeric address (i.e. 204.180.228.0). TheOECD has also registered a second-level domain name under a TLD in France (i.e. oecd.fr), although this address isnot currently used as part of the Organisation’s universal resource locator (URL) on the World Wide Web or for the e-mail address.
In 1997 two registration processes operated for gTLD and TLD addresses. In 1995 the US NationalScience Foundation contracted Network Solutions, Inc., to manage certain gTLDs and authorised the company tocharge users for registration from September 1995. In most OECD countries, the registrars responsible for TLDs havefollowed the reforms instituted at InterNIC. Most commonly, registrars, once housed in universities, have been spunoff into private companies or associations run by members. Typically, the members of organisation-based registrarsare ISPs, and in a growing number of countries, the marketing of TLDs is done through their offices. TLD registrarshave also followed InterNIC’s lead and introduced fees for registration. As a result the incentives for registrars ofTLDs, and resellers, to market these services have radically changed between 1995 and 1997. Whereas university-based registrars did not market TLDs in a commercial manner this was changing by 1997. A commercial customer ofa registrar, who may once have been referred to InterNIC, will now have a TLD recommended.

DSTI/ICCP/TISP(98)1/FINAL
48
Table 12. Domain registration in OECD countries
gTLD registrations(September 1997)
TLD domains(July/Aug-97)
Total domainregistrations
gTLD as % oftotal registrations
TLD as a %of total
registrationsUnited States 1141455 21590 1163045 98.1 1.9Canada 101540 21753 123293 82.4 17.6Spain 12486 5829 18315 68.2 31.8France 19733 10769 30502 64.7 35.3Korea 6346 5686 12032 52.7 47.3Turkey 3067 3664 6731 45.6 54.4Sweden 14281 19745 34026 42.0 58.0Italy 11407 17377 28784 39.6 60.4Netherlands 12028 18948 30976 38.8 61.2Belgium 3302 6220 9522 34.7 65.3Switzerland 8006 15061 23067 34.7 65.3Germany 29542 56059 85601 34.5 65.5United Kingdom 38615 76916 115531 33.4 66.6Ireland 1360 2899 4259 31.9 68.1Luxembourg 317 765 1082 29.3 70.7Japan 11492 31143 42635 27.0 73.0Greece 528 1531 2059 25.6 74.4Finland 1890 5687 7577 24.9 75.1Austria 2721 9013 11734 23.2 76.8Portugal 684 2325 3009 22.7 77.3Australia 7646 28523 36169 21.1 78.9Mexico 1400 5827 7227 19.4 80.6Norway 2340 10124 12464 18.8 81.2Denmark 6609 30873 37482 17.6 82.4Hungary 349 1961 2310 15.1 84.9Iceland 50 573 623 8.0 92.0Czech Republic 273 4010 4283 6.4 93.6New Zealand 874 12929 13803 6.3 93.7Poland 259 5544 5803 4.5 95.5OECD 1440600 433344 1873944 36.1 67.3Non-OECD 63340 74603 137943 57.7 42.3World 1503940 507947 2011887 74.8 25.2
1. Iceland’s gTLD registration is an OECD estimate.2. OECD average is a simple average rather than a weighted average. The weighted average is 76.9 for gTLDs and 23.1 for
TLDs. The average for non-OECD is a simple average. The weighted average for non-OECD is 45.9 for gTLDs and 54.1 forTLDs.
3. gTLD registration data supplied by Imperative (http://www.imperative.com/ and http://www.internet.org).
Source: OECD.

DSTI/ICCP/TISP(98)1/FINAL
49
Table 13. US Domain name markets
gTLDregistrationby US State
(1)
US State share ofgTLDs
State share ofglobal gTLD/TLDs
Rank Top 30 Domain Markets
California 248 467 21.8 13.3 1. CaliforniaNew York 92 322 8.1 4.9 2. CanadaFlorida 76 196 6.7 4.1 3. United KingdomTexas 68 633 6.0 3.7 4. New YorkIllinois 44 292 3.9 2.4 5. GermanyMassachusetts 41 624 3.7 2.2 6. FloridaNew Jersey 41 133 3.6 2.2 7. TexasPennsylvania 37333 3.3 2.0 8. Illinois
Washington 31 960 2.8 1.7 9. JapanOhio 31 094 2.7 1.7 10. MassachusettsVirginia 29 551 2.6 1.6 11. New JerseyGeorgia 25 367 2.2 1.4 12. DenmarkColorado 24 942 2.2 1.3 13. PennsylvaniaMichigan 24 691 2.2 1.3 14. AustraliaArizona 22 912 2.0 1.2 15. SwedenMaryland 22 439 2.0 1.2 16. WashingtonMinnesota 20 666 1.8 1.1 17. OhioOregon 19 676 1.7 1.0 18. NetherlandsNorth Carolina 18 644 1.6 1.0 19. FranceConnecticut 17 524 1.5 0.9 20. VirginiaMissouri 15 771 1.4 0.8 21. ItalyIndiana 15 007 1.3 0.8 22. GeorgiaWisconsin 14 465 1.3 0.8 23. ColoradoTennessee 12 954 1.1 0.7 24. MichiganNevada 11 197 1.0 0.6 25. SwitzerlandUtah 10 896 1.0 0.6 26. ArizonaKansas 10 515 0.9 0.6 27. MarylandLouisiana 8 344 0.7 0.4 28. MinnesotaDistrict of Columbia 8 242 0.7 0.4 29. OregonOther 92 618 8.1 4.9 30. North Carolina
1. Includes state registrations under .com, .net. .org, and .edu. Excludes state registrations under the .us domain.2. gTLD registration data supplied by Imperative (http://www.imperative.com/).
Source: OECD.

DSTI/ICCP/TISP(98)1/FINAL
50
Table 14. Domain registration in selected non-OECD countriesgTLD registrations(September 1997)
TLD domains(July/Aug-97)
Total domainregistrations
gTLD as % oftotal
TLD as a % oftotal
Cayman Islands 146 0 146 100.0 0.0Virgin Islands (British) 726 6 732 99.2 0.8Arab Emirates 5 342 92 5434 98.3 1.7Saudi Arabia 721 19 740 97.4 2.6Virgin Islands (US) 316 9 325 97.2 2.8Bahamas 824 28 852 96.7 3.3India 4 218 281 4499 93.8 6.2Panama 493 33 526 93.7 6.3Barbados 253 22 275 92.0 8.0Netherlands Antilles 198 21 219 90.4 9.6Hong Kong 10 316 1616 11932 86.5 13.5Pakistan 537 190 727 73.9 26.1Jordan 280 119 399 70.2 29.8Dominican Republic 228 112 340 67.1 32.9Venezuela 1 268 650 1918 66.1 33.9Thailand 1 621 859 2480 65.4 34.6Liechtenstein 324 184 508 63.8 36.2Indonesia 1 674 1019 2693 62.2 37.8Trinidad & Tobago 169 109 278 60.8 39.2Philippines 887 605 1492 59.5 40.5China 6 125 4534 10659 57.5 42.5Costa Rica 483 364 847 57.0 43.0Ecuador 234 178 412 56.8 43.2Chinese Taipei 1 915 1784 3699 51.8 48.2Bermuda 179 187 366 48.9 51.1Colombia 750 899 1649 45.5 54.5Guatemala 115 152 267 43.1 56.9Malaysia 1 218 1670 2888 42.2 57.8Lebanon 190 374 564 33.7 66.3Israel 1 955 3902 5857 33.4 66.6Egypt 126 253 379 33.2 66.8Brazil 4 824 9885 14709 32.8 67.2Singapore 2 126 4525 6651 32.0 68.0Argentina 1 809 8370 10179 17.8 82.2South Africa 1 489 9055 10544 14.1 85.9Chile 253 1787 2040 12.4 87.6Slovenia 153 1358 1511 10.1 89.9Russian Federation 578 5915 6493 8.9 91.1Slovakia 63 1856 1919 3.3 96.7Other countries 8 214 11581 19795 41.5 58.5Total non-OECD 63 340 74603 137943 57.7 42.31. Non-OECD average is a simple rather than a weighted average. The weighted average is 45.9 for 54.12. gTLD Registration data supplied by Imperative (http://www.imperative.com/).
Source: OECD

DSTI/ICCP/TISP(98)1/FINAL
51
Table 15. Domain registrations per 1 000 inhabitants
OECD Active gTLDregistrations per
1 000inhabitants
Total gTLD andTLDs per 1 000
inhabitants
Non-OECD Active gTLDregistrations
per 1 000inhabitants
Total gTLDand TLDsper 1 000
inhabitantsDenmark 1.26 7.17 Virgin Islands (British) 55.02 55.48United States 4.34 4.42 Liechtenstein 10.38 16.27Canada 3.43 4.16 Bermuda 2.88 5.89New Zealand 0.24 3.86 Cayman Islands 4.21 4.21Sweden 1.62 3.85 Bahamas 2.94 3.04Switzerland 1.13 3.26 Virgin Islands (US) 2.87 2.95Norway 0.54 2.86 Arab Emirates 2.24 2.28Luxembourg 0.77 2.62 Singapore 0.71 2.22Iceland 0.19 2.33 Hong Kong, China 1.67 1.93Netherlands 0.78 2.00 Netherlands Antilles 0.99 1.10Australia 0.42 2.00 Barbados 0.97 1.06United Kingdom 0.66 1.97 Israel 0.35 1.04Finland 0.37 1.48 Slovenia 0.08 0.76Austria 0.34 1.46 Colombia 0.19 0.42Ireland 0.38 1.19 Slovakia 0.01 0.36Germany 0.36 1.05 Argentina 0.05 0.29Belgium 0.33 0.94 South Africa 0.04 0.25France 0.34 0.52 Costa Rica 0.14 0.25Italy 0.20 0.50 Trinidad & Tobago 0.13 0.21Spain 0.32 0.47 Panama 0.19 0.20Czech Republic 0.03 0.41 Chinese Taipei 0.09 0.17Japan 0.09 0.34 Malaysia 0.06 0.14Portugal 0.07 0.30 Chile 0.02 0.14Korea 0.14 0.27 Lebanon 0.05 0.14Hungary 0.03 0.23 Jordan 0.06 0.09Greece 0.05 0.20 Brazil 0.03 0.09Poland 0.01 0.15 Venezuela 0.06 0.09Turkey 0.05 0.11 Russian Federation 0.004 0.04Mexico 0.02 0.08 Dominican Republic 0.03 0.04
1. Data are for mid-1997. gTLD registration data supplied by Imperative (http://www.imperative.com/).
Source: OECD

DSTI/ICCP/TISP(98)1/FINAL
52
Table 16. Internet host penetration weighted by gTLD registration
Internet hostsas reported by
NetworkWizards
(July/Aug1997)
Estimatedadditional
hosts basedon active
gTLDregistrations(September
1997).
Total hosts Changein
numberof hosts
(%)
Traditionalpresentation ofInternet host
penetration per1 000
inhabitants(mid-1997)
Internet Hostpenetration per
1 000inhabitantsweighted by
gTLDregistration(Mid-1997)
Finland 335956 9316 345272 2.8 65.8 67.6Iceland 14153 246 14399 1.7 53.0 53.9Norway 209034 11534 220568 5.5 47.9 50.6New Zealand 155678 4308 159986 2.8 43.5 44.7Australia 707611 37686 745297 5.3 39.2 41.3Canada 690316 500476 1190792 72.5 23.3 40.2Sweden 284478 70389 354867 24.7 32.2 40.2United States 11829141 -1773488 10354699 -15.0 45.0 38.2Denmark 137008 32575 169583 23.8 26.2 32.4Switzerland 148028 39460 187488 26.7 20.9 26.5Netherlands 341560 59284 400844 17.4 22.1 25.9United Kingdom 878215 190328 1068543 21.7 15.0 18.2Luxembourg 3854 1562 5416 40.5 9.3 13.1Austria 87408 13411 100819 15.3 10.9 12.5Germany 875631 145608 1021239 16.6 10.7 12.5Ireland 33031 6703 39734 20.3 9.2 11.1Belgium 86117 16275 102392 18.9 8.5 10.1Japan 955688 56642 1012330 5.9 7.6 8.1France 292096 97261 389357 33.3 5.0 6.7Czech Rep. 49104 1346 50450 2.7 4.8 4.9Italy 211966 56223 268189 26.5 3.7 4.7Spain 121823 61542 183365 50.5 3.1 4.7Korea 132370 31279 163649 23.6 3.0 3.7Hungary 33818 1720 35538 5.1 3.3 3.5Portugal 18147 3371 21518 18.6 1.8 2.2Greece 19711 2602 22313 13.2 1.9 2.1Poland 43384 1277 44661 2.9 1.1 1.2Turkey 22963 15117 38080 65.8 0.4 0.6Mexico 35328 6900 42228 19.5 0.4 0.5
1. gTLD registration data supplied by Imperative (http://www.imperative.com/).
Source: OECD

DSTI/ICCP/TISP(98)1/FINAL
53
Global root-level servers
DNS servers perform the necessary function of translating back and forth between names andnumbers and are therefore a critical element in traffic exchange between ISP networks. These serverscontain databases of IP addresses and corresponding domain names and are interrogated when a userwants to send an e-mail or request data over the World Wide Web.62 For example, if a government userin Ottawa wanted to send an e-mail to a colleague in the Japanese Ministry for Posts andTelecommunications (e.g. [email protected]), and copy that message to a colleague in Industry Canada(e.g. [email protected]) their mail programme would initiate a request to the DNS server of that person’sInternet service provider.
Owing to the fact that the Canadian colleague’s machine is hosted on the same governmentnetwork, his/her address would be located on the same DNS server. By way of contrast, because theCanadian government DNS server would not contain a record for the domain name .go.jp it would initiatea request to a root-level server. Root-level servers contain databases with information about which DNSservers on the Internet act for which domain names. The root-level server would, in this case, point theCanadian DNS server to a counterpart that knows the IP address for the .go.jp domain name. Followingthis, a request is made to the DNS server hosting .go.jp and the DNS server then returns the IP addresswhich receives mail for [email protected]. The e-mail can then be sent and received.
There are 13 global root-level servers in support of the IANA recognised DNS (Table 17). Fourcontain information for the root alone and these "root only" servers were launched to test the feasibility ofmaintaining the root information separate from the information for the top level domains.63
InterNIC/Network Solutions, Inc., operate two of the global root-level name servers. In May 1997, athird global root-level name servers, formerly operated by Network Solutions (InterNIC), was shifted tothe United Kingdom. In addition a further global root server was established at Keio in Japan. There arenow two such name servers located in Europe, one in Japan and ten in the United States. Under thecurrent addressing system it has been suggested that 13 global root servers if the optimal number(Box 5).64
Discussion of location and management of these global root level servers takes place in theInternet Engineering and Planning Group (IEPG). The IEPG is an Internet operational group intended toassist ISPs to interoperate within the global Internet. The goals and activity domains of the IEPG aredescribed in the IEPG Charter, and are summarised in RFC1690. In June 1996 the IEPG discussed,
“... the logical location of root nameservers in respect to provider and exchange topology. It wasnoted that while the placing of a root server on an exchange was a topological neutral location bothin terms of traffic flow and in terms of relation to potential inter-provider settlement structures, thelocation did hamper effective management of the root name service. Placing a root server within aprovider network offers improved management capability and places the onus on the provider toprovide high quality connectivity to the server, and was generally considered to be a more stabledeployment structure.”65
A further consideration of location has been the funding of root servers. At present a number ofthe root-level servers are ultimately funded by governments, with US taxpayers making the largestcontribution. As IEPG discussions bear witness, some of these root servers have relied on volunteerhosting. This has raised concerns as the Internet moves to being a fully commercially driven network andCIX has recommended:

DSTI/ICCP/TISP(98)1/FINAL
54
“... that the US Government study the desirability and feasibility of full time professionalmaintenance of the DNS root servers. The root servers are the equivalent of the ‘air trafficcontrollers’ for the Internet. Few of us would like to imagine commercial aviation in which the airtraffic control towers are managed by volunteers, or solely by the carriers themselves. The purposeof this study would be to ensure that these vital Internet components are -- and will continue to be --fully secure but also are fully supported to minimise network disruption. ”66
Table 17. Operators of the Internet’s root-level name servers
Operator Status LocationNetwork Solutions, Inc. (A) Private company United States http://www.netsol.com/Army Research Laboratory (B) Military United StatesPerformance Systems InternationalInc. (C-NYSER)
Private company United Stateshttp://www.psi.com/
University of Maryland (UMD-TERP) Computer Science Center
University United States http://www.umd.edu/
NASA Ames Research Center, E Government United StatesInternet Software Consortium (ISC),F Non-profit organisation. United States http://www.isc.org/isc/GSI (DIIS-NS) Military United States http://www.nic.ddn.mil/
University of Southern California(ISI2) Information Sciences Institute
University United States http://www.usc.edu/
US Army, H Military United StatesNetwork Solutions, Inc. (J) Private company United States http://www.netsol.com/
M-Wide Keio University: “Wide Project” JapanNORDUnet Private company (1) Sweden
http://www.nordu.net/
RIPE NCC. (K) European Network Co-ordinationCentre http://www.ripe.net/
LINX (United Kingdom)http://www.linx.net
1. In May 1997 K.root-servers.net was shifted from Network Solutions (InterNIC) to be housed within LINX and managed byRIPE NCC. LINX is a London-based exchange point for Internet traffic in the United Kingdom and externally. Two otherglobal root name servers exist at ISI at the University of Southern California, one of which was moved to Keio, Japan, inAugust 1997.
Source: OECD based on http://nic.mil/DNS/root-server.html and ftp://rs.internic.net/domain/named.ca.

DSTI/ICCP/TISP(98)1/FINAL
55
Box 5: IEPG Advisory Note - Root Name Servers (Source: Bill Manning, October 1996.http://www.iepg.org/docs/IEPG-ADV-9610.html)
The question has been raised in the IEPG regarding reports of less than satisfactory responses to root nameservers.These reports were substantiated and it was suggested that a couple of actions be taken:
Separate the machines serving the root zone from those supporting top level domains.
Move some root nameservers to be "closer" to end users.
Add more machines as root nameservers.
It was noted that given current constraints, that all root servers need to be able to fit into a single UDP packet, whichworks out to a total of 13 machines, given the current naming scheme. There are currently 9 in service. Severaldiscussions on placement of the remaining four nameservers ensued. The IEPG discussed direct attachment toexchanges, placement just off an exchange or within a service provider. It was suggested that perhaps the bestapproach, to meet the proposed guidelines in the manning-dnssrv draft, would be to place them, under contract fromthe IANA, one hop off exchange points and in control of an ISP. It was suggested that perhaps the best way tomaintain the desired level of topological insensitivity would be to inject 13 host routes into the global routing systemfrom a well known prefix. This would ensure that regardless of where these servers were placed over time, therewould always be a route to them. Such a prefix has been identified and has been prepared for this purpose. The prefixin question is: 192.0.0.0/23 We will run some experiments using addresses within this prefix before deploying newroot nameservers or migrating existing servers. We then discussed potential candidates and found no volunteers in theAsia-Pacific region, none in Africa and only one in Europe. The biggest concern was the level of global traffic thatwould attempt to resolve root queries. So, at this time, only Keith Mitchell of LINX has offered, with somequalifications, to host a root name server in Europe.
Intellectual Infrastructure Fund
An important element of the core infrastructure supporting the public Internet are the DNSdatabases. In September 1995, following NSF authorisation, Network Solutions began charging for gTLDregistrations. The co-operative agreement issued by the NSF to Network Solutions, to provide InterNICregistration services, provides for 30 per cent of the funds collected for registration and renewal of domainnames to be:
“...placed into an interest-bearing account which will be used for the preservation andenhancement of the “Intellectual Infrastructure” of the Internet in general conformance withapproved Program Plans. [Network Solutions] will develop and implement mechanisms to insurethe involvement of the Internet communities in determining and overseeing disbursements fromthis account. [Network Solutions] will also establish and maintain publicly available records ofall deposits to and disbursements from the account.”67
Between September 1995 and August 1997, US$ 34.2 million was deposited into the“Intellectual Infrastructure” account by Network Solutions. From publicly available data it is not possibleto determine how much of this money was contributed by users in different countries. Since theintroduction of charges applicants have been charged US$ 100 per initial registration of a second leveldomain name with US$ 30 of that money being put into the “Intellectual Infrastructure” fund. The initialfee covered a period of two years. However, by using the number of active domains in each country, as at

DSTI/ICCP/TISP(98)1/FINAL
56
September 1997, it is possible to give a good indication of likely proportional contribution by country forone year (Table 18). This shows that users in the United States have contributed around 76 per cent ofmoney for the “Intellectual Infrastructure” fund and users in other countries 24 per cent. Outside theUnited States the largest contribution was made by Canadian users and the largest regional contributionmade by European users. Reflecting their relatively low use of gTLDs OECD countries from the APNICarea (Australia, Japan, Korea and New Zealand) would have contributed less than 2 per cent.
In keeping with the original goal of the Intellectual Infrastructure, Fund the US Congress hasproposed devoting a major part toward funding “Internet 2”, a high-speed network connecting US researchand university campuses. With respect to the contribution from users outside the United States, somehave raised the question of whether this money should made available for similar worthy projects inappropriate countries or regions. A good case can be made for this point of view. On the other hand, thisneeds to be balanced against the ongoing funding by US taxpayers of certain parts of the DNS operationand management. In addition, many regard this fee as a form of “tax”. They might point out that USusers pay value added taxes for registering second level domains in many national TLD registries aroundthe world. Given the higher pricing of these TLDs the tax often costs more than US$ 15 per annum pername. Those countries without charges for registering or without VAT could no doubt counter this point.

DSTI/ICCP/TISP(98)1/FINAL
57
Table 18. Indicative contributions to the Intellectual Infrastructure Fund
Active gTLDs(September 1997)
Indicative Annual Contribution toIntellectual Infrastructure fund, US$ (1)
Per cent of WorldTotal
United States 1 141 455 17 121 825 75.90Canada 101 540 1 523 100 6.75United Kingdom 38 615 579 225 2.57Germany 29 542 443 130 1.96France 19 733 295 995 1.31Sweden 14 281 214 215 0.95Spain 12 486 187 290 0.83Netherlands 12 028 180 420 0.80Japan 11 492 172 380 0.76Italy 11 407 171 105 0.76Switzerland 8 006 120 090 0.53Australia 7 646 114 690 0.51Denmark 6 609 99 135 0.44Korea 6 346 95 190 0.42Belgium 3 302 49 530 0.22Turkey 3 067 46 005 0.20Austria 2 721 40 815 0.18Norway 2 340 35 100 0.16Finland 1 890 28 350 0.13Mexico 1 400 21 000 0.09Ireland 1360 20 400 0.09New Zealand 874 13 110 0.06Portugal 684 10 260 0.05Greece 528 7 920 0.04Hungary 349 5 235 0.02Luxembourg 317 4 755 0.02Czech Republic 273 4 095 0.02Poland 259 3 885 0.02Iceland 50 750 0.003Total OECD 1 440 600 21 609 000 95.79Total Non-US 362 485 5 437 375 24.10EU Area 155 503 2 332 545 10.34Europe (RIPE area)(2) 169 847 2547705 11.29Asia (APNIC area)(2) 26 358 395370 1.75Non-OECD 63340 950100 4.21World 1503940 22559100 100.00
1. This represents the “Intellectual Infrastructure” contribution for one year of US$ 15 per second level domain registration undera gTLD. Some second level domain name owners would have paid this on an going basis over several years.
2. OECD countries only.
Source: OECD.

DSTI/ICCP/TISP(98)1/FINAL
58
ANNEX 1
Figure 1: Peer/transit/internal backbone access to top 100 Internet sites via Global One
MCI8%
Sprint18%
Exodus8%
CerfNet6%
AboveNet3%
Intermedia Communications
(Digex)3%
IBM3%
Other14%
GTE (BBNPlanet, Genuity)
9%Frontier Corp. (Global
Center)10%
Worldcom (Alternet, UUnet, ANS,
CompuserveNet)18%
Hot100 from Web21/Trace from Global One
Source: OECD.

DSTI/ICCP/TISP(98)1/FINAL
59
Figure 2: Peer/transit/internal backbone access to top 100 Internet sites via Worldcom
Worldcom (Alternet, UUnet, ANS,
CompuserveNet)45%
MCI9%
Sprint3%
Frontier Corp. (Global Center)
8%
GTE (BBNPlanet, Genuity)
4%
Exodus7%
CerfNet2%
AboveNet3%
IBM3%
Intermedia Communications
(Digex)2%
Other14%
Hot100 from Web21/Trace from MIDS/Alexa
Source: OECD.
Figure 3: Peer/transit/internal backbone access to top 100 Internet sites via CERFNET
MCI10%
Exodus7%
CerfNet6%
Other10%
Frontier Corp. (Global Center)
7%
GTE (BBNPlanet, Genuity)9% Sprint
18%
Internex3%Intermedia Communications
(Digex)3%
Worldcom (Alternet, UUnet, ANS, CompuserveNet)
27%
Hot100 from Web21/Trace from BeachNet
CERFNet peers with MCI, ANS, Sprint, UUnet, PSI, BBN-Planet, AGIS, DREN, ESNet,ICM, Digex, Compuserve, EUNet, IIJ, @Home, Netcom, Global Center,CIX, Verio. Sprint carries residual international traffic.
Source: OECD.

DSTI/ICCP/TISP(98)1/FINAL
60
ANNEX 2
$XVWUDOLD
-DSDQ
.RUHD
&KLQD
7DLZDQ
)LML
1HZ�=HDODQG
*XDP
+RQJ�.RQJ
,QGLD
0DFDR
3KLOLSSLQHV
,QGRQHVLD
0DOD\VLD
6LQJDSRUH
7KDLODQG
8�6�$�
(XURSH
8�6�$�
8�6�$�
6UL�/DQND
3DNLVWDQ
1HSDO
%DQJODGHVK
9LHWQDP
0RQJROLD
3DSXD�1HZ�*XLQHD
%UXQHL
8�6�$�
8�6�$�
8�6�$�
+DZDLL
Macro Map - 1994Macro Map - 1994
&RS\ULJKW��������%DUU\�5DYHHQGUDQ�*UHHQH��EJUHHQH#FLVFR�FRP!
Legend:
• Leased line Dial-up or X.25

DSTI/ICCP/TISP(98)1/FINAL
61
$XVWUDOLD
-DSDQ
.RUHD
&KLQD
7DLZDQ
)LML
1HZ�=HDODQG
*XDP
+RQJ�.RQJ
,QGLD
0DFDR
3KLOLSSLQHV
,QGRQHVLD
0DOD\VLD
6LQJDSRUH
7KDLODQG
8�6�$�
(XURSH
8�6�$�
8�6�$�
6UL�/DQND
3DNLVWDQ
1HSDO
%DQJODGHVK
9LHWQDP
0RQJROLD
3DSXD�1HZ�*XLQHD
%UXQHL
8�6�$�
8�6�$�
8�6�$�
Macro Map - 1995Macro Map - 1995
+DZDLL
&RS\ULJKW��������%DUU\�5DYHHQGUDQ�*UHHQH��EJUHHQH#FLVFR�FRP!

DSTI/ICCP/TISP(98)1/FINAL
62
$XVWUDOLD
-DSDQ
.RUHD
&KLQD
7DLZDQ
)LML
1HZ�=HDODQG
*XDP
+RQJ�.RQJ
,QGLD
0DFDR
3KLOLSSLQHV
,QGRQHVLD
0DOD\VLD
6LQJDSRUH
7KDLODQG
8�6�$�
(XURSH
8�6�$�
8�6�$�
6UL�/DQND
3DNLVWDQ
1HSDO
%DQJODGHVK
9LHWQDP
0RQJROLD
3DSXD�1HZ�*XLQHD
%UXQHL
8�6�$�
8�6�$�
8�6�$�
/DRV
&DPERGLD
+DZDLL
Macro Map - 1996Macro Map - 1996Does not include International NSP Backbones
(XURSH
1HZ�&DOHGRQLD
&RS\ULJKW��������%DUU\�5DYHHQGUDQ�*UHHQH��EJUHHQH#FLVFR�FRP!

DSTI/ICCP/TISP(98)1/FINAL
63
$XVWUDOLD
-DSDQ
.RUHD
&KLQD
7DLZDQ
)LML
7RQJD
9DQXDWX
6RORPRQ�,VODQGV
1HZ�=HDODQG
*XDP
+RQJ�.RQJ
,QGLD
0DFDR
3KLOLSSLQHV
,QGRQHVLD
0DOD\VLD
6LQJDSRUH
7KDLODQG
8�6�$�
(XURSH
8�6�$�
8�6�$�
6UL�/DQND
3DNLVWDQ
1HSDO
%DQJODGHVK
9LHWQDP
0RQJROLD
3DSXD�1HZ�*XLQHD
%UXQHL
8�6�$�
8�6�$�
8�6�$�
/DRV
&DPERGLD
+DZDLL
Macro Map - 1997Macro Map - 1997Does not include International NSP Backbones
(XURSH
1HZ�&DOHGRQLD
6H\FKHOOHV
&RS\ULJKW��������%DUU\�5DYHHQGUDQ�*UHHQH��EJUHHQH#FLVFR�FRP!

DSTI/ICCP/TISP(98)1/FINAL
64
$XVWUDOLD
-DSDQ
.RUHD
&KLQD
7DLZDQ
)LML
1HZ�=HDODQG
*XDP
+RQJ�.RQJ
,QGLD
0DFDR
3KLOLSSLQHV
,QGRQHVLD
0DOD\VLD
6LQJDSRUH
7KDLODQG
(XURSH
8�6�$�
6UL�/DQND
3DNLVWDQ
1HSDO
%DQJODGHVK
9LHWQDP
0RQJROLD
3DSXD�1HZ�*XLQHD
%UXQHL
8�6�$�
8�6�$�
+DZDLL
Big Internet Bandwidth Big Internet Bandwidth 1 H ‘96 1 H ‘96 (34M or higher)(34M or higher)
&RS\ULJKW��������%DUU\�5DYHHQGUDQ�*UHHQH��EJUHHQH#FLVFR�FRP!

DSTI/ICCP/TISP(98)1/FINAL
65
$XVWUDOLD
-DSDQ
.RUHD
&KLQD
7DLZDQ
)LML
1HZ�=HDODQG
*XDP
+RQJ�.RQJ
,QGLD
0DFDR
3KLOLSSLQHV
,QGRQHVLD
0DOD\VLD
6LQJDSRUH
7KDLODQG
(XURSH
8�6�$�
6UL�/DQND
3DNLVWDQ
1HSDO
%DQJODGHVK
9LHWQDP
0RQJROLD
3DSXD�1HZ�*XLQHD
%UXQHL
8�6�$�
8�6�$�
+DZDLL
Big Internet Bandwidth Big Internet Bandwidth 2 H ‘96 2 H ‘96 (34M or higher)(34M or higher)
&RS\ULJKW��������%DUU\�5DYHHQGUDQ�*UHHQH��EJUHHQH#FLVFR�FRP!

DSTI/ICCP/TISP(98)1/FINAL
66
$XVWUDOLD
-DSDQ
.RUHD
&KLQD
7DLZDQ
)LML
1HZ�=HDODQG
*XDP
+RQJ�.RQJ
,QGLD
0DFDR
3KLOLSSLQHV
,QGRQHVLD
0DOD\VLD
6LQJDSRUH
7KDLODQG
(XURSH
8�6�$�
6UL�/DQND
3DNLVWDQ
1HSDO
%DQJODGHVK
9LHWQDP
0RQJROLD
3DSXD�1HZ�*XLQHD
%UXQHL
8�6�$�
8�6�$�
+DZDLL
Big Internet Bandwidth Big Internet Bandwidth 1 H ‘97 1 H ‘97 (34M or higher)(34M or higher)
&RS\ULJKW��������%DUU\�5DYHHQGUDQ�*UHHQH��EJUHHQH#FLVFR�FRP!

DSTI/ICCP/TISP(98)1/FINAL
67
$XVWUDOLD
-DSDQ
.RUHD
&KLQD
7DLZDQ
)LML
1HZ�=HDODQG
*XDP
+RQJ�.RQJ
,QGLD
0DFDR
3KLOLSSLQHV
,QGRQHVLD
0DOD\VLD
6LQJDSRUH
7KDLODQG
(XURSH
8�6�$�
6UL�/DQND
3DNLVWDQ
1HSDO
%DQJODGHVK
9LHWQDP
0RQJROLD
3DSXD�1HZ�*XLQHD
%UXQHL
8�6�$�
8�6�$�
+DZDLL
Big Internet Bandwidth Big Internet Bandwidth 2 H ‘97 2 H ‘97 (34M or higher)(34M or higher)
+7+7
&RS\ULJKW��������%DUU\�5DYHHQGUDQ�*UHHQH��EJUHHQH#FLVFR�FRP!

DSTI/ICCP/TISP(98)1/FINAL
68
$XVWUDOLD
-DSDQ
.RUHD
&KLQD
7DLZDQ
)LML
1HZ�=HDODQG
*XDP
+RQJ�.RQJ
,QGLD
0DFDR
3KLOLSSLQHV
,QGRQHVLD
0DOD\VLD
6LQJDSRUH
7KDLODQG
(XURSH
8�6�$�
6UL�/DQND
3DNLVWDQ
1HSDO
%DQJODGHVK
9LHWQDP
0RQJROLD
3DSXD�1HZ�*XLQHD
%UXQHL
8�6�$�
8�6�$�
+DZDLL
Big Internet Bandwidth Big Internet Bandwidth 1 H ‘98 1 H ‘98 (34M or higher)(34M or higher)
+7+7
&RS\ULJKW��������%DUU\�5DYHHQGUDQ�*UHHQH��EJUHHQH#FLVFR�FRP!
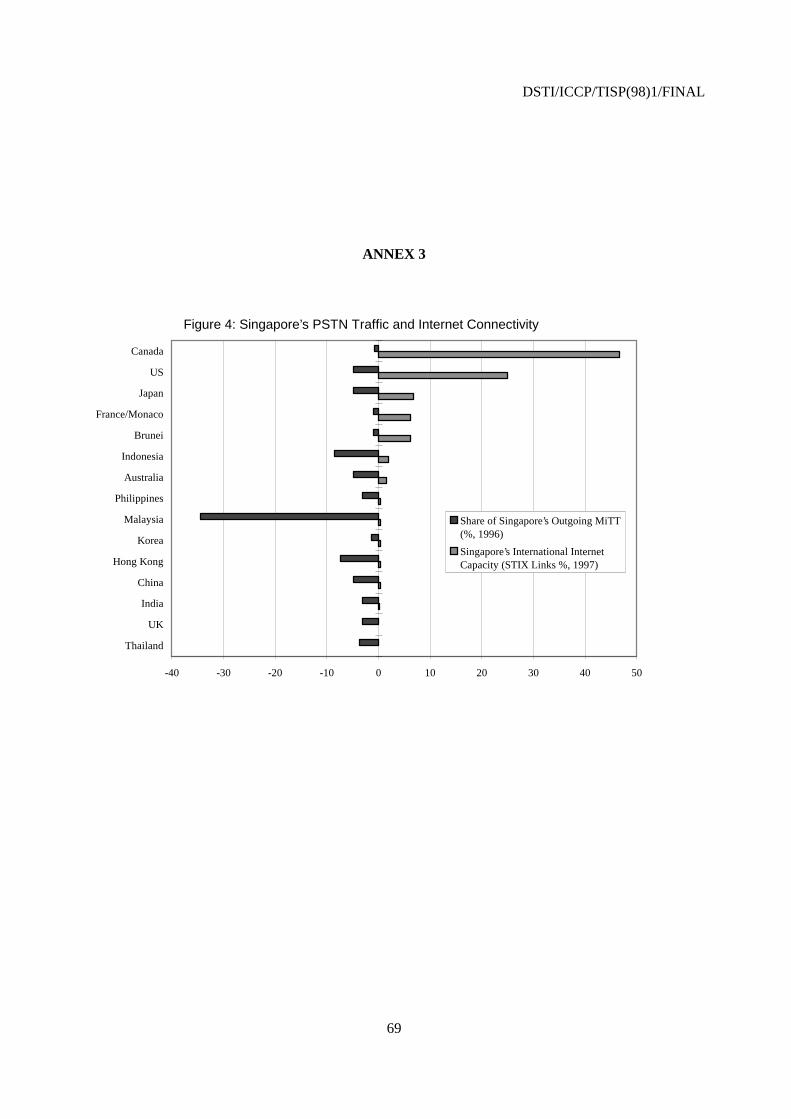
DSTI/ICCP/TISP(98)1/FINAL
69
ANNEX 3
-40 -30 -20 -10 0 10 20 30 40 50
Thailand
UK
India
China
Hong Kong
Korea
Malaysia
Philippines
Australia
Indonesia
Brunei
France/Monaco
Japan
US
Canada
Share of Singapore’s Outgoing MiTT(%, 1996)
Singapore’s International InternetCapacity (STIX Links %, 1997)
Figure 4: Singapore’s PSTN Traffic and Internet Connectivity

DSTI/ICCP/TISP(98)1/FINAL
70
0
500
1000
1500
2000Lahore
KathmanduDhaka
Lahore
Karachi
Jakarta
Dhaka
Colombo
Noumea
Noumea
Phnom Pehn
Dhaka
SurabayaJohor Bahru
BeijingManilaSydney
Jakarta
Hong Kong
San Francisco
Los Angeles
Vancouver
Bombay
Tokyo
Taipei
Seoul
BruneiTokyo
MonacoSingapore to Rest ofWorld (AverageRound Trip Time(ms) Nov/Dec 1997)
Average Round TripTime Singapore to:Asia/Pacific - 885 msNorth America - 382 msEurope - 97ms
Figure 5: Average round trip time to and from STIX
Figure 6: Balance between second level domain registration under TLDs and gTLDs
0 % 2 0 % 4 0 % 6 0 % 8 0 % 1 0 0 %
P o l a n d
N e w Z e a l a n d
C z e c h R e p u b l i c
I c e l a n d
H u n g a r y
D e n m a r k
N o r w a y
M e x i c o
A u s t r a l i a
P o r t u g a l
A u s t r i a
F i n l a n d
G r e e c e
J a p a n
L u x e m b o u r g
I r e l a n d
U K
G e r m a n y
B e l g i u m
S w i t z e r l a n d
N e t h e r l a n d s
I t a l y
S w e d e n
T u r k e y
K o r e a
F r a n c e
S p a i n
C a n a d a
U S
g T L D % ( e . g .. c o m , . o r g , . n e t )
T L D % ( e . g . . k rf o r K o r e a )

DSTI/ICCP/TISP(98)1/FINAL
71
Figure 7: Internet Hosts per 1000 Inhabitants adjusted for gTLD registrations
FinlandIceland
NorwayNew Zealand
AustraliaCanadaSweden
USDenmark
SwitzerlandNetherlands
UKLuxembourg
AustriaGermany
IrelandBelgium
JapanFrance
Czech Republic ItalySpain
KoreaHungary
PortugalGreece
PolandTurkeyMexico
0.0 10.0 20.0 30.0 40.0 50.0 60.0 70.0
Internet Hosts per1000 InhabitantsAdjusted for gTLDregistrations, Mid 1997
DSTI/ICCP/TISP(98)1/FINAL
72
NOTES
1. The DNS is a mapping service which translates domain names and IP addresses back and forth. It isseparate from the routing system (except that the routing system is needed to enable kDNS traffic to flow).DNS root servers contain no routing information. Routing information is distributed and there is no root.Each ISP announces its routes to its peers via the Border Gateway Protocol (at exchanges) or statically.There are some route servers located at exchanges, but they are the exception rather than the rule and arenot essential to the operation of the routing system.
2. The first Internet exchange point in the United Kingdom was established in London by a small group ofIAPs in October 1994.
3. OECD, “Webcasting and Convergence: Policy Implications”, OCDE/GD(97)221, 1997.
4. Bruce Haring, “Video on the Net snaps into focus”, USA Today, 25 November 1997.http://www.usatoday.com/life/cyber/tech/ctb705.htm
5. Steve Rosenbush, “E-mail takes on a video dimension”, USA Today, 28 November 1997.http://www.usatoday.com/life/cyber/tech/ctb710.htm
6. Deja News, “Press Release: Deja News Launches Major Assault On Spam Offers Internet Users "Spam-Free" Access to Internet Discussion Forums, including Usenet Newsgroups”, 8 December 1997.http://emarket.dejanews.com/emarket/about/pr/dnpr_971208.shtml
7. Gene Koprowski, Backbones Wheel and Deal to Keep Net Moving”, Wired,http://www.wired.com/news/news/technology/story/8642.html
8. See http://www.keynote.com/measures/backbones/backbones.html
9. See http://www.savvis.com/11-11-97-savvis-is-tops.html
10. Keynote Systems, “Top 10 Discoveries about the Internet”, 1997.http://www.keynote.com/measures/top10.html
11. “Sun Microsystems, Bellcore Announce Plans to Deliver First Jointly Marketed Product; New Solution,Advanced Domain Name Server, Will Reduce Internet Traffic Bottlenecks”, Business Wire, 10 December1997. See also http://www.soliant.com
12. Ibid.
13. Kevin Thompson, Gregory j. Miller and Rick Wilder, “Wide-Area Internet Traffic Patterns andCharacteristics, IEEE Network, November/December 1997 or Seehttp://www.vbns.net/presentations/papers/

DSTI/ICCP/TISP(98)1/FINAL
73
14. Andreas Evagora, “World Wide Weight”, tele.com, September 1997.http://www.teledot.com/0997/features/tdc0997globe.html
15. Data for monthly average in the late 1997. Refer to monthly averages at:http://www.unidata.ch/info/public/usa-tot.html
16. Ibid.
17. Ibid.
18. Reuters, “Internet Use Doubles in Canada”, 28 November 1997.http://www.yahoo.com/headlines/971128/tech/stories/canada_1.html
19. Public Telecommunication Operators are here defined as entities offering public switchedtelecommunication services. The term is not used here to indicate ownership status.
20. For a glossary of Internet terms, some of whose definitions are drawn on in this document, see GordonCook’s Glossary at: http://www.cookreport.com/
21. See the “The List” at http://thelist.internet.com/
22. Gordon Cook, “Glossary of Internet Terms”, http://www.cookreport.com/
23. Commercial Internet eXchange (CIX) Association, Inc. formed by General Atomic (CERFnet),Performance Systems International, Inc. (PSInet), and UUNET Technologies, Inc. (AlterNet), after NSFlifts restrictions on the commercial use of the Net. Seehttp://info.isoc.org/guest/zakon/Internet/History/HIT.html
24. Originally the organisation, under award from NSF, which provided routing information at each NAP wasthe Routing Arbiter (RA). The RA provided customised routing information at each NAP that will reflectedall bilateral agreements between that NAP's clients. http://www.busn.ucok.edu/desci/binning/nsp_rnp.htm
25. See http://www.pacbell.com/products/business/fastrak/networking/nap/features.html#howitworks
26. Jeff Pelline, “Whole Earth dumps president”, NewsCom, 30 April 1997.http://www.news.com:80/News/Item/0,4,10247,00.html
27. UUNET, “UUNET Details Peering Strategy”, Media Release, 12th May 1997.http://www.us.uu.net/press/peering.html
28. David Holub, “Peering/Interconnection on the Internet as a Telecom Carrier”, Internet Press Release toVarious NewsGroups, 5th May 1997.
29. UUNET, op.cit.
30. Jeff Ubois, “Peer Pressure: An Interview with Philip Lawlor”, August 1996.http://www.internetworld.com/1996/08/peer.html
31. Janet Kornblum, “Will WorldCom own the backbone business?”, NewsCom, 11 September 1997.http://www.news.com/News/Item/0,4,14171,00.html

DSTI/ICCP/TISP(98)1/FINAL
74
32. Kenneth Cukier, “MI-WorldCom faces Internet probe...”, CommunicationsWeek International, Issue 195,24 November 1997. p 1
33. Ibid.
34. Comments by CAIDA Concerning the Federal Communications Commission Review of the Acquisition ofMCI Communications Corp. by Worldcom, Inc. April 27, 1998. http://www.caida.org/Caida/fcc-98.html
35. Bell Atlantic, Filing to US Federal Communications Commission CC Docket No 97-211, 5 January 1998.(Appendix A) http://www.fcc.gov/Bureaus/Common_Carrier/Comments/worldcom/
36. See Simply Internet, Filing to US Federal Communications Commission CC Docket No 97-211, 1998.http://www.fcc.gov/Bureaus/Common_Carrier/Comments/worldcom/
37. A plot of the Internet routing table is available at http://www.employees.org:80/~tbates/cidr.plot.html
38. See http://www.waia.asn.au/Issues/Peering/index.html
39. Jermey Scott-Joynt, “Pressure Builds on FCC to Reconsider Internet Access Call Status”, Totaltele,http://www.totaltele.com, 14th November 1997.
40. See http://www.mai.net/bostonMXP/general.htm
41. See http://www.nap.inroma.roma.it/
42. See www.gni.fr/PEP/
43. See http://www.mai.net/mxp/MXP.HTML
44. See MaNAP press release at: http://www.manap.net/rel_22_jul.html
45. Ibid.
46. DIX is located at Lyngby just north of Copenhagen . See http://www.uni-c.dk/dix/
47. Interview with Steve Goldstein, Cook Report, January 1995. http://cookreport.com/icm.html.
48. Telstra, Filing with the Federal Communications Commission “In the Matter of International SettlementRates) IB Docket No. 96-261”, op.cit.
49. APIA’s CFC is at http://www.apia.org/call4.htm
50. Telstra (the Petitioner) initiated action versus the FCC and the United States (Respondents) in the UnitedStates Court of Appeals for the District of Columbia Circuit on 1 October 1997.
51. For a discussion of what connectivity is, see Geoff Huston, Elise Gerich and Bernhard Stockman,“Connectivity within the Internet - A commentary”, 1992, http://www.iepg.org/docs/IEPG-connect.html
52. The APNG maps are made available courtesy of Barry Raveendran Greene.
53. Keynote Systems, “Top 10 Discoveries about the Internet”, 1997.http://www.keynote.com/measures/top10.html

DSTI/ICCP/TISP(98)1/FINAL
75
54. Ibid.
55. See EuroISPA analysis of costs at http://euro.ispa.org.uk/papers/telecoms1.html.
56. For UUNET’s major backbone routes, see http://www.uk.uu.net/network/connectivity/
57. See http://www.us.uu.net/products/ustrans/pricing.shtml
58. See http://www.uk.uu.net/international/faq/
59. Camille Mendler, “Subsea cables make waves: New entrants climb on board...” CWI News Listing forIssue 186, Monday, 2 June 1997.
60. Ibid., This would assume an upfront payment of US $1.3 million spread over the cable's expected 15-yearlifespan - US$ 7 222 per month over 180 months.
61. OECD, “Domain Names: Allocation Policies”, OCDE/GD(97)207, 1997.
62. See Lanminds “How Does the Domain System Work” http://www.lanminds.com/dns/tld.html
63. See http://rs.internic.net/newsletter/apr97/dnsgraphic.html
64. See http://www.iepg.org/docs/IEPG-ADV-9610.html
65. See IEPG Meeting Notes, June 1996. http://www.iepg.org/mjun96.html
66. Barbara Dooley, Executive Director of CIX, Testimony before the House Subcommittee on Basic ResearchHouse Science Committee, Washington, 30 September 1997. http://www.cix.org/congtest.html
67. See http://rs.internic.net/announcements/iif-update.html