internationales bodensee-forum für einkauf und ... · internationales bodensee-forum für einkauf...
TRANSCRIPT
Internationales Bodensee-Forumfür Einkauf und Materialwirtschaft
Professionelles Spend Management –
Wertbeitrag des Einkaufs zur Profitabilität
Marco Schlimpert
Vice President Operations Europe & Americas

Leading Fiber Innovation
Lenzing Group

3
The Lenzing Group 2014
Sales: EUR 1,864.2 mn (2013: 1,908.9 mn)
Export share: 92.3% (2013: 90.8%)
Fiber sales volumes: 960.000 tons (2013: 890,000 tons)
Staff: 6.356 (2013: 6,675)
Listed at Vienna Stock Exchange, Prime Market (ATX)
Major shareholders:
B&C Privatstiftung >50%
Oberbank AG >5%

4
Our core market:Man-made cellulose fibers
Produced from the raw material wood
Halfway position between natural and chemical fibers
Natural wearing properties of natural fibers combined with the advantages ofsynthetical fibers such as purity and consistent quality

5
Global network for our customers1)
1) as at 31/12/20132) air-dried

6
362
238
112
154
Production (42%)
Non Production (27%)
RM/Technical Parts (13%)
Equipment & Construction (18%)
Purchasing volume Lenzing Group 2013: € 866 mio. (w/o pulp and wood)
Global Purchasing centralizes allpurchasing activities (w/o pulp and wood)
values in mio. €

7
Situation 2012
Source: Investor Presentation FY 2012, page 33 , www.lenzing.com

8
Situation 2012
Plant specific material master data management
No uniform commodity keys, material description and part numbers
Approx 30% of spend w/o part numbers („non-stock“ items)
4 different SAP templates
Approx 150k different order positions and 7.000 suppliers
80% of purchasing volume with top 300 part numbers
20% of purchasing volume not on the „radar“
Time consuming spend analysis (spend cube) on an annual basis
Insufficient overview of degree of „maverick buying“
Time consuming reporting and price controlling
Difficult planning and prioritizing of purchasing initiatives
Low trust and credibility due to lack of facts and figures

9
Early Involvement of Purchasing inthe Procurement Process
Source: Studie BME-Benchmark 2012

10
Administrator or strategic function?Yesterday Tomorrow Three main factors
Value instead ofprice
- cost management- value management for
internal customers
Networking- organisation- process- skills
Creator instead ofadministrator
- supplier management- local and global
sourcing- innovation
management
1
2
3
CompetenceCenter
Supplier networkmanagement
Creation of value
Cost managerCompetent partner
Tough negotiatorPerfect administrator
„Somebody with your negotiation stylewould perfectly fit into our purchasing
department “

11
High visibility adds value to the company
Controlling of spend on a monthly basis
Identifying areas for improvement („quick wins“) Identifying and implementing new savings potentials („commodity
strategies“) Improve compliance in purchasing (trust is good, controlling is necessary) Starting point for improving master data in SAP
Creating transparency

12
How does it work?
TSV
Classified &enriched data
Unstructuredmulitlingual data
Standardontology Customer specific
ontology
Automated classification &attribute extraction
SEMANTICENGINE
SEMANTICENGINE
Classification: quality & flexibility
ready to use both standard as wellas customized ontology
flexible and full customizable high detail level (+15k categories) high precision (min 95%)
Operation: high performance real time analysis on demand maximum drill down detail high data volume fully automated process easy to use
Project: no invading approach no impact on legacy systems only few weeks of implementation customer orientation: high flexibility
during project

13
Total Spend Analysis
SemanticClassification
SupplierAnalysis
Brand Analysis
StandardReports
Customizedreports
KPIs Tracking
AutomaticDatarefresh
ERPs
…

14
Display item details

15
Brand analysis

16
Supplier Analysis

17
Easy to create specific analysis…

18
…and fast results

19
Create and save individual reports
20
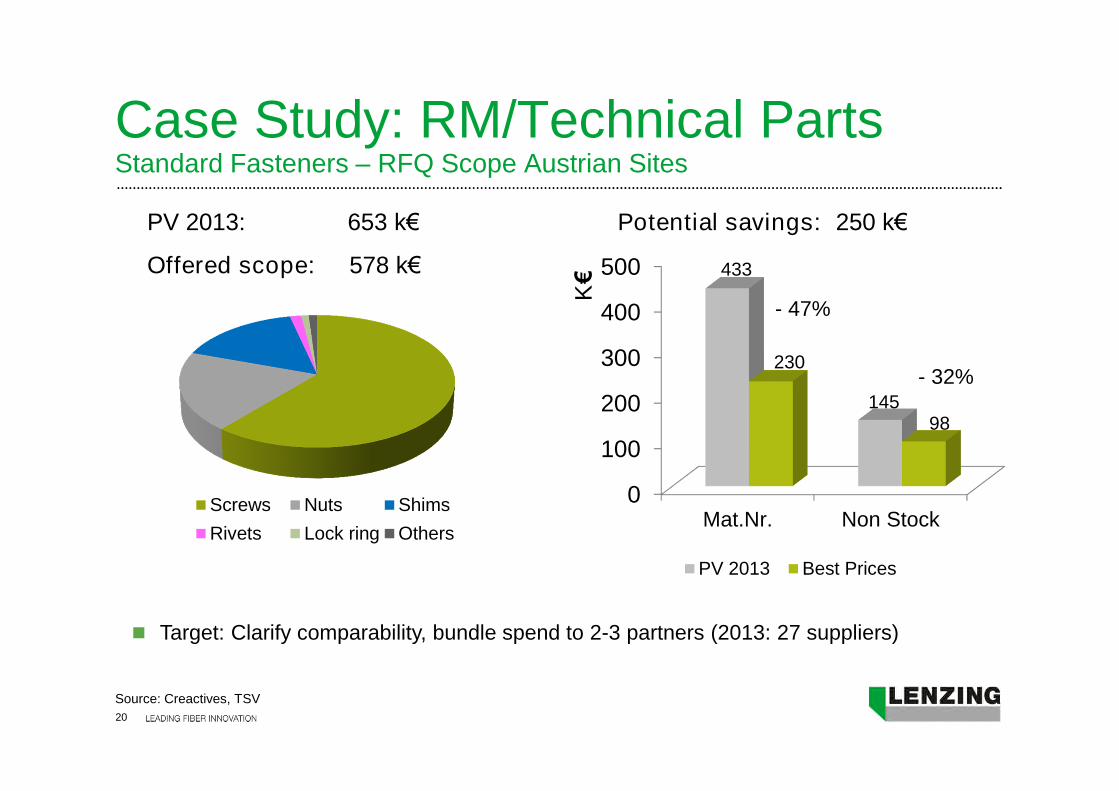
Case Study: RM/Technical PartsStandard Fasteners – RFQ Scope Austrian Sites
Target: Clarify comparability, bundle spend to 2-3 partners (2013: 27 suppliers)
0
100
200
300
400
500
Mat.Nr. Non Stock
433
145
230
98
K€
PV 2013 Best Prices
Screws Nuts Shims
Rivets Lock ring Others
PV 2013: 653 k€
Offered scope: 578 k€
Potential savings: 250 k€
- 47%
- 32%
Source: Creactives, TSV

21
Purchasing Roadmap 2013 - 2014EfficiencyTransparency Effectivity
Commodity Key Spend Analysis SAP Purchase to payprocess
PurchasingInitiative
Management
Organisation
Uniform keyworldwide
Special tool foranalyzing SAP
data
Using standardfeatures in SAP
Using state ofthe art e-
procurementsolution
Special tool totrack purchasing
initiatives
StreamliningOrganisation

22
Situation 2013:
Source: Investor Presentation FY 2013 page 24, www.lenzing.com

23
Situation 2014:
Source: Investor Presentation FY 2013 page 24, www.lenzing.com

24
Lessons learned Spend visibility in purchasing is the starting point of 7 Steps of Sourcing
Spend visibility helps to get early involvement
Early involvement of demanding department helps buy-in during theprojects
Commodity strategies can be developed together with the demandingdepartments based on hard facts and figures
Structured approach of the projects increases recognition of purchasing
Purchasers need to get used to using new IT tools
Implementation is fast, taking advantage of TSV takes time
Training, training, training
Beginning of the long journey of master data management
No fancy graphics, but quick facts and figures
As CPO be a role model and use TSV actively

Thank you for your attention!