international journal of management and transformation
TRANSCRIPT

International Journal of Management and Transformation Volume 5, Number 1: Spring 2011
Series Editor Content
Dr. Siddhartha Sarkar 1.User Perception of Automatic Ticket Vending Machine: A Study of
Director, Asian School of Management and Technology, India
Indian Southern Railway: T.K.Murugesan and A.Ramachandran: 3-9
E-mail: [email protected] 2. Methods of Voting System and Manipulation of Voting:
J. N. Islam, H. K. Mohajan and P. Moolio: 10-34
Editorial Board 3. Assessment of Impact of Effectiveness of Advertising in Telecom Service Sector In India: P.K. Agarwal, Pradeep Kumar
Ge Zhiyuan, Beijing University of Technology, China and Swati Gupta: 35-43
Isaac K. Acheampong, University of Cape Coast, Ghana 4. Demystifying NPAs on Education Loan: An Empirical Analysis: B. C. John V. Mensah, University of Cape Coast, Ghana M. Patnaik, Ipseeta Satpathy and Aroop Kumar Mohapatra: 44-54
Kishore G. Kulkarni, Metropolitan State College of 5.The Gendered Nature of Small Business Environment in Ghana:
Denver, USA A Research Agenda: Rosemond Boohene: 55-66 Larry Smith, University of New England, Australia 6.A Study on Job Stress of the Employees with Reference to Banking Marino R. Romero, Isabela State University, Philippines Sector: Kanagaluru Sai Kumar: 67-78 Mokhtar M. Metwally, University of Wollongong, 7. Competitiveness and Its Impact on Research and Development in Australia Indian Automobile Industry: Subhrabaran Das and Piya Das: 79-89 Pablo Hernandez, Saint Mary’s College, USA 8. Extent of Knowledge Penetration in Textile Industry of Punjab,India: P. Subbarao, University of Papua New Guinea, Papua Radha Kanwal Sharma and Prem Kumar: 90-101 New Guinea Zaneta Stasiskiene, Kaunas University of Technology, Lithuania
ISSN: 0974-3502 ISBN: 978-1-61233-539-X
Brown Walker Press 23331 Water Circle, Boca Raton, FL 33486-8540, USA
www.brownwalker.com/ASMT-journals.php Copyright © Asian School of Management and Technology, India Asian School of Management and Technology (All Rights Reserved)

2

International Journal of Management and Transformation 5(1): Spring 2011
3
User Perception of Automatic Ticket Vending Machine: A Study of Indian Southern Railway
T.K.Murugesan
Assistant Professor, Department of Management Studies, Prathyusha Institute of Technology & Management, Tiruvallure, Tamil Nadu, India
E-mail: [email protected]
A.Ramachandran Director, SNR Institute of Management Sciences, SNR Sons College, Coimbatore, Tamil Nadu,India
E-mail: [email protected]
Abstract: This paper throws a light on user perception of Automatic Ticket Vending Machine (ATVM) offered by Southern Railway in India. It also tries to find out the awareness level of smart card service among passengers in Chennai District. The smart cards are nowadays commonly utilized for purchasing the transportation services ticket fares like buses, railways, etc. A smart card, chip card, or integrated circuit card (ICC), is any pocket-sized card with embedded integrated circuits which can process data. The Indian Railways has rolled out ATVM as part of an Unreserved Ticketing System (UTS) at major railway stations in India. The Railway has issued smart cards to facili-tate inter-city travel. This card will work as a prepaid device, which will allow commuters to travel specified routes via rail without worrying about cash. The commuters would have to swipe at both occasions – entry and exit. De-pending on the distance covered, the balance on the card will be adjusted. To add to the security at the platforms, ticket checkers would be alarmed with palm tops to scan the smart cards. The smart cards will greatly reduce queues at manual ticketing counters and will drive process efficiencies. The southern railway has installed 455 Automatic Ticket Vending Machine at more than 191 suburban railway stations in Chennai Central, Beach, Fort, Nungambakkam, Kodambakkam, Mambalam, Saidapet, Guindy, St. Thomas Mount, Pazhavanthangal, Thirusoolam, Meenambakkam, Pallavaram, Chrome pet, Mylapore, Tambaram and Chepauck stations. About 9 lakh people use suburban rail transport every day. The primary objective of the study is to analyze the awareness level of the pas-sengers and their perceptions regarding smart card services rendered by southern railway in Chennai district. It also focuses on the significant factors influencing the passengers to buy smart card service. It is inferred from the survey that majority of the respondents have become aware of the smart card service rendered by Southern Railway. It also reveals that ATVM is found to be very personable and friendly while handling the transactions of smart card service to make inter-city travel. Keywords: Automatic Ticket Vending Machine (ATVM), Integrated Circuit Card (ICC), Unreserved Ticketing System (UTS), Smart Cards, Automated Teller Machines, Kiosk, Indian Railway System. Introduction The smart cards are nowadays commonly utilized for purchasing the transportation services
ticket fares like buses, railways, etc. There are many such projects underway around the world for transportation utility services like railways. The important factor for the ticketing system in railways is the transaction payment time. The payment time of not more than 300 milliseconds is usually demanded. The Indian Railways smart card is pre-filled and does not have to connect to the bank's site for payment. So, the speed of the facility is very good for payment. The feedback of the respondents who already a user of this service will depend upon this important factor. A smart card, chip card, or integrated circuit card (ICC), is any pocket-sized card with embedded integrated circuits which can process data. Smart cards are available to commuters at railway sta-tions.
Railways mull smart cards to facilitate inter-city travel. This card will work as a prepaid de-vice, which will allow commuters to travel specified routes via rail without worrying about cash.

International Journal of Management and Transformation 5(1): Spring 2011
4
The project is being undertaken in collaboration with BEST bus transport system of Mumbai. During a rail journey, the smart cards would be scanned by special machines positioned at vari-ous places at the platform. The commuters would have to swipe at both occasions – entry and exit. Depending on the distance covered, the balance on the card will be adjusted. To add to the security at the platforms, ticket checkers would be alarmed with palm tops to scan the smart cards. The system could be extremely beneficial for commuters who travel to-and-fro between cities and their respective suburbs. Delhi Metro Rail Corporation (DMRC) is the first transporter to have introduced smart cards for travelling in the Capital. Around 1.9 lakh commuters having smart cards travel by metro every day. In Mumbai also, BEST bus service has launched smart cards for frequent travellers. The chip inside the cards usually has details of permitted routes and validity of the smart cards. If the card is valid, the scanning machine or the ticket checker gets a green signal. The smart card service would not be for low pricing but for unlimited travel on the specified route. Apart from using radio frequency based cards (RFID) in travel, the Railways are also under the process of implementing computerized charting process. It has already imple-mented RFID tags on wagons to monitor the mobility of wagons. Till now it has done an invest-ment of Rs.230 crores on 2,00,000 wagons. The Indian Railways has rolled out Automatic Ticket Vending Machine (ATVM) as part of an Unreserved Ticketing System (UTS) at major railway stations across the nation. The passengers at all these stations can book unreserved tickets through ATVM by smart cards. The AVTM solution in its entirety has been conceptualized and designed by CRIS (Centre for Railway Information Systems) using NXP’s MIFARE DES Fire technology based on the international ISO 14443A standard. NXP is planning to provide MIFARE DES Fire-based ICs and Siepmann's Card Systems will provide the card. The adoption of contact less ticketing will greatly reduce queues at manual ticketing counters and will drive process efficiencies. Initially, in 2007 CRIS had developed smart card based contact less ticketing solutions using NXP’s MIFARE 1KB Classic chip in Mumbai Suburban Railway and Chennai, wherein approximately 5 lakh cards were issued to passengers in the Central Western Railway at Mumbai and Southern Railway at Chennai.
Automatic Ticket Vending Machine (ATVM) Automatic ticket vending machines using ‘smart card’ designed and developed by the Centre
for Railway Information Systems were installed at all suburban railway stations. Many such ma-chines have been installed in railway stations over the past few years. The facility operates simi-lar to the Automated Teller Machines. The commuters have to purchase ‘Smart Card’ Coupons, place them in a slot on the ticket vending machine, select the route and destination on the touch screen and once the details are confirmed, a computer-printed ticket is delivered. Commuters have to initially buy Rs.100 coupons and later recharge them in denominations of Rs. 50. Re-charge of the coupons could be made in specified counters. Once the ticket is purchased through the machines, the appropriate amount would be deducted from the commuters’ coupon. The Southern Railway has initially appointed the staff be present near the machines to assist the commuters. Automatic ticket vending machines is aimed at clearing the rush of daily commuters and avoiding overcrowding at counters.
The system was set up first in Mumbai and Bangalore. Now the facility would be available at Chennai Central Moore Market Complex, Beach, Fort, Park, Nungambakkam, Kodambakkam, Mambalam, Saidapet, Guindy, St. Thomas Mount, Pazhavanthangal, Tirusoolam, Meenambak-kam, Pallavaram, Chromepet, Mylapore, Tambaram and Chepauk stations. About 9lakhs people

International Journal of Management and Transformation 5(1): Spring 2011
5
use suburban rail transport every day. At present, the ATVMs are only for suburban train tickets. The ATVMs are fruitful in reducing queues in suburban stations as the transaction is cashless and convenient. The time taken to print a ticket is less than a second. These machines are used for dispensing platform tickets and unreserved journey tickets,”
An Overview of ATVM
“Smart card to make all hassles at counters a thing of the past” Statement of the Problem The queues in front of the ticket counters in suburban railway stations have been drastically in-
creased over the period of time. In order to reduce the rush of daily commuters and to avoid overcrowding at ticket counters, Southern Railway has installed Automatic Ticket Vending Ma-chine in major suburban railway stations for reducing queues and dispending unreserved journey tickets as well as flat form tickets electronically. The southern railway has installed 455 Automatic Ticket Vending Machine at more than 191 suburban railway stations in Chennai Central, Beach, Fort, Nungambakkam, Kodambakkam, Mambalam, Saidapet, Guindy, St. Thomas Mount, Pazhavanthangal, Thirusoolam, Meenambakkam, Pallavaram, Chrome pet, Mylapore, Tambaram and Chepauck stations. About 9 lakh people use suburban rail transport every day. It has paved the way to study the user perception of smart card service offered by the southern railway. The study analyses the opinions of passengers regarding essential features of smart cart service and its utility for commuters as smart cards will greatly reduce queues at manual ticketing counters and will drive process efficiencies. Objectives of the Study • To evaluate the user perception of Automatic Ticket Vending Machine (ATVM) that
processes smart card service. • To analyze the level of awareness of passengers regarding Smart Card Service offered by
Southern Railway. • To throw a light on the significant factors that influence the passengers to buy Smart
Card Service. • To offer suggestions on the basis of the opinions given by the respondents. Research Design and Methodology Adopted The research design applied for the study is of descriptive nature. A non –probability conveni-
ence sampling technique was adopted for selecting the sample size for the research paper. A sample size of 200 respondents was drawn for the study. The sapling areas of the study can in-clude Chennai Central, Beach, Fort, Nungambakkam, Kodambakkam, Mambalam, Saidapet and Guindy.The data required for the study were purely primary data collected through the personal

International Journal of Management and Transformation 5(1): Spring 2011
6
survey by preparing a structured questionnaire, which consists of dichotomous, close ended, multiple choice and ranking questions. In order to prepare an effective questionnaire, a pilot sur-vey of 20 respondents was conducted, which is 10 percent of the total sample size of the study. During the pilot survey, most of the respondents were felt comfortable in responding the ques-tionnaire. The same questionnaire was chosen for the main survey also. The statistical tools ap-plied for the study for drawing statistical inferences about the study can include chi-square Test, K-S Test, Spearman’s Rank Correlation and ANOVA Test. The findings, suggestions and con-clusion about the study are purely based on the opinions and responses given by the respondents. The period of the study was one month, Nov-Dec 2009.
Limitations of the Study The sample size chosen for the research study might not be representative of total population.
Due to short span of time, the study is restricted to 200 samples only. Data collected from the respondents are based on their opinions and knowledge. Sometimes, they may subject to bias. Few respondents were found to be reluctant while answering the questionnaire.
Statistical Analysis The researcher has applied statistical tools to the following hypotheses for drawing statistical
inferences about the study. • H1: The demographic variables have no significant influence over the sources of
awareness about smart card services rendered by Southern Railway. • H2: There is no significant relationship between the occupation of respondents and the
frequency of using ATVM. • H3: There is no significant association between the duration of using the service of
smart card by the respondents and their opinions about the services rendered by the machine. 1. Chi-Square Test: Chi-square test is used to test whether a variable has a significant
influence over the other variable. For this purpose, the factors considered for the study are broadly classified into two groups. The first group consists of demographic factors namely (1) Gender, (2) Age, (3) Education, (4) Monthly Income and (5) Occupation. The second group consists of a variable for analysis is sources of awareness. Null-Hypothesis (Ho): The demographic variables have no significant influence over the
sources of awareness about Smart Card Service rendered by Southern Railway.
Table No.1: Demographic Variables Vs. Quality of Service by ATVM
Sl.No. Variables Chi-square Value Table Value S/NS
1. Gender 2.21 5.99 NS 2. Age 1.63 9.49 NS 3. Education 0.61 9.49 NS 4. Monthly Income 2.19 9.49 NS 5. Occupation 1.63 12.59 NS
(Source: Primary Data) (S: Significant, NS: Not Significant)
Inference: The Table No.1 clearly indicates that the null hypothesis (Ho) is accepted (Not significant) in all the demographic variables. Hence, it is concluded that the demographic variables such as gender, age, education, monthly income and occupation have no significant influence on the sources of awareness about Smart Card Service rendered by Southern Railway.

International Journal of Management and Transformation 5(1): Spring 2011
7
2. K-S Test: Null-Hypothesis (Ho): There is no significant relationship between the occupation of
respondents and the frequency of using ATVM.
Table No. 2: Computation of DMax Value
O CFo Fo(x)
E CFe Fe(x) DMax = │Fo(x)-Fe(x)│
27.78 27.78 0.68 6.85 6.85 0.17 0.51
5.56 33.34 0.81 6.85 13.7 0.33 0.48
3.67 37.01 0.90 6.85 20.55 0.50 0.4
2.67 39.68 0.96 6.85 27.4 0.67 0.29
1 40.68 0.99 6.85 34.25 0.83 0.16
0.44 41.12 1 6.85 41.12 1 0
ΣO=41.12
ΣE=41.12
(Source: Primary Data)
Table No. 3: Occupation of Respondents Vs. Frequency of Using ATVM
Sl.No.
Variable 1 Variable 2 Calculated Value of Dmax
Table Value of Dmax
Significant/ Not Significant
1. Occupation of Respondents
Frequency of Using ATVM.
0.51 0.096 Significant
Inference: The Table No.3 states that the null hypothesis (Ho) is rejected (Significant).Hence,
it is concluded that there is a significant relationship between the occupation of respondents and the frequency of using ATVM. 3. Analysis of Variance (ANOVA) Test: Null Hypothesis (H0): There is no significant association between the duration of using the
service of smart card by the respondents and their opinions about the services rendered by the machine.
Table No.4: ANOVA Table Sources of Variation Sum of Squares Degree of Free-
dom Mean Squares
Between samples 475 3 158
Within sample 779 12 65
Total 1254 15
Calculated value of F is = 2.43 Level of significance = 5% The table value of F for v1 = 3 and v2 = 12 at 5% level of significance = 3.49

International Journal of Management and Transformation 5(1): Spring 2011
8
Inference: Since the calculated value of F = 2.43 is less than the table value of F = 3.49, the null hypothesis is accepted. It is inferred that there is no significant association between the dura-tion of using the service of smart card by the respondents and their opinions about the services rendered by the machine. 4. Ranking of media preferred by the respondents to popularize Smart Card Service:
Table No. 5: Ranking of Media for Publicity of Smart Card Service Rank Media
R1 R2 R3 R4 R5 Total
Television 56 (28%) 48 (24%) 48 (24%) 40 (20%) 8 (4%) 200
Radio 64(32%) 64(32%) 40(20%) 8 (4%) 24 (12%) 200
Newspaper 56 (28%) 56 (28%) 48 (24%) 32 (16%) 8 (4%) 200
Bit Notice 16 (8%) 32 (16%) 48 (24%) 64 (32%) 40 (20%) 200
Point of Display 32 (16%) 24 (12%) 8 (4%) 48 (24%) 88 (44%) 200
(Source: Primary Data) (Figures in parenthesis indicate percentage of respondents)
Figure No.1: Ranking of Media for Publicity of Smart Card Service
0
5
10
15
20
25
30
35
40
45
50
1 2 3 4 5
Rank
% of Respondents
Television Radio News Paper Bit Notice Point of display
Inference: The above figure portrays that 32% of respondents or 64 respondents (Out of 200)
have ranked radio as No.1 media for making publicity of Smart Card Service. The following box provides details of percentage of respondents who have ranked different media as No.1 for mak-ing the publicity of Smart Card Service.
Media % of Respondents
Television 28
Radio 32
Newspaper 28
Bit Notice 8
Point of display 16
International Journal of Management and Transformation 5(1): Spring 2011
9
Recommendation 1. It is observed from the study that the Smart Card Service requires a wide range of
publicity in an effective and informative mass media like T.V., Newspapers, Theatres and Radio etc.,
2. The card should be allowed for renewal with the lapsed amount with a nominal penalty/fine because the passengers had a bad experience that the balance amount of smart card gets lapsed on expiry.
3. The Southern Railway Department should install ATVMs at major railway stations because the passengers frequently deduct the amount by using smart card each time a travel is made unlike a pass. In a pass, the passengers need not to detect the amount each time a travel is made by them.
4. The Railway Department needs to ensure the functionability of ATVM because most of the respondents have voiced that the kiosk installed are few and not available at all railway stations. Whenever it is available, most of the time it is out of order, either due to paper ticket exhausted, or the kiosk itself out of order. Also, the expiry of card is not very prominent on the screen.
5. ATVM must have an additional feature of displaying expiry date along with the display of balance amount on the ticket screen because passengers are always in a hurry to get the ticket and take back the card.
6. Since there is no restriction for the passengers to carry as many smart cards as possible, the railway can restrict the number of cards a person has to carry. Findings and Conclusion 58% of the respondents are male and 42% are female. Nearly 48% are in the age group of
below 30 years. Most of the respondents (64%) are private employees. Nearly 85% of the respondents are aware of Smart Card Services rendered by Southern Railway and 81% of the respondents have been using Smart Card Service close for more than one year. 69% of the respondents would like to recommend Smart Card Service to others. 100 percent of the respondents have felt that the Smart Card Service requires wide publicity.
It is concluded from the study that majority of the passengers (85%) are aware of Smart Card Service rendered by Southern Railway. The survey also indicates that most of the commuters have responded that they know how to operate ATVM for accessing their journey tickets as well as platform tickets by using Smart Card. Two third of the respondents have felt that ATVM is found to be very personable and friendly while handling their transactions. The survey has given a clear picture that three fourth of the passengers are satisfied with essential features of ATVM such as quick service, technology, convenience, prompt delivery, flexibility and less waiting time. In order to increase the sales of Smart Card and accessibility of Kiosk, the Southern Railway should install ATVM in all major railway stations. References David L. Loudon and J. Della Bitla (2002), Consumer Behaviour, Tata Mc Graw Hill Publishers. Leon G.Schiffman, Leslie Lazar Kanuk (2002), “Consumer Behaviour”, Pearson Education. Philip Kotler (2000), Marketing Management, 10th Edition, Prentice Hall of India Publishers. William G. Zikmund & Michael d’ Amico (2001), Marketing- Creating and Keeping Customers in an e-commerce
World, 7th Edition, Thomson Asia Pte Ltd. Naresh K. Malhotra (2007), Marketing Research, 5th Edition, Pearson Education. Donald R. Cooper and Pamela S. Schindler (2004), Business Research Methodology, 9th Edition, Tata McGraw Hill
Publishers.

International Journal of Management and Transformation 5(1): Spring 2011
10
Methods of Voting System and Manipulation of Voting
J. N. Islam Emeritus Professor, Research Centre for Mathematical and Physical Sciences
University of Chittagong, Bangladesh
H. K. Mohajan Assistant Professor, Premier University, Chittagong, Bangladesh
E-mail: [email protected]
P. Moolio Professor, Paññāsāstra University of Cambodia, Phnom Penh, Cambodia
E-mail: [email protected]
Abstract: In this paper an attempt has been taken to describe various types of voting system and manipulation of them. French philosophers Marquis de Condorcet (1743-1794) and Jeans-Charles Borda (1733-1799) introduced modern voting system. Duncan Black first introduced the manipulation of voting in 1958 in his book “Theory of Committee and Elections”. Condorcet, Borda and even many modern politicians believe that elections are logically imperfect. In this paper this imperfection is analyzed in some detail. In this paper voting methods are discussed in very simple but in a detailed manner. Voting system is directly involved with Economics, Political Science and So-cial Science. So that if one has no proper knowledge of the voting system then he can not serve the society in proper way and cannot expect the economic development of the society. Some voting methods such as Arrow’s theorem, median voter theorem, randomized voting, Muller-Satterthwaite theorem and Gibbard-Satterthwaite theorem are apparently non-manipulability and are included in this paper. Keywords: Voting system, voting paradox, manipulation of voting, condorcet winner, dictatorship, strategy-proof-ness. Introduction A voting system is of manipulability whenever some individual misrepresents his preferences
in order to secure an outcome preferred to the outcome when he is honest otherwise it is strategy-proof. In voting system every voter’s preference ordering i.e., the preference profile, taken col-lectively, form the input the output is usually a single certain winner or a set of winners. The me-thods of transforming preference profiles into winners i.e., mappings from the set of possible preference profiles into the set of alternatives is called voting procedures. For each preference profile the mapping produces a single winning alternative. Such a mapping is called a social de-cision function (SDF). The social welfare function (SWF) on the other hand, first studied by Ar-row, are the rules for transforming preference profile into social preference orderings or rank-ings. The definition of SWF given by Arrow is as follows: Let { }naaaY ..., , , 21= denote a finite set of alternatives or social choice options among which the voters must select one and let ( )YR denote the set of strict linear rankings on Y. Let { }nN ..., ,2 ,1= be a finite set of individual vot-ers. A function YRf N →: will be called a social choice function. A member of NR is called a profile of rankings and its ith component is called individual i’s ranking.
A SWF is a function RRf N →: which aggregates voters’ preferences into a single prefe-rence order on Y. The N-tuple: ( )NRR ..., ,1 of voters’ preferences is called a preference profile. Arrow declared that there exist no satisfactory SWF (Islam et al. 2009). A satisfactory SDF should not be a dictatorship (Feldman 1979). Gibbard (1973, 1978) and Satterthwaite (1975) in-

International Journal of Management and Transformation 5(1): Spring 2011
11
dependently proved this as follows: “If a satisfactory social decision function is one which is al-ways immune to manipulation and which is non-dictatorial, there is no satisfactory social deci-sion function”. Following Myerson (1996, 2009) we have discussed some portion of this paper in some detail.
This paper is an exposition of voting system and of the manipulation of voting. French political philosophers Borda (1781) and Condorcet (1785) introduced modern voting system but they had not mentioned about manipulation of voting. Condorcet, Borda and even many modern politi-cians believe that elections are logically imperfect. In this paper we will explore such imperfec-tions of the election in some detail. Duncan Black (1958) first introduced the manipulation of voting. Here we discuss in easier way of voting system and manipulation of them (Feldman 1979; Myerson (1993, 1996, 2006, 2009); Blackorby, et al. 1990; Blackorby, et al. 2002; Sapori-ti and Thomé 2006; McLennan 2008; Saporiti 2008; Miller 2009; Robert and Tsoukiàs 2009; Sa-to 2009).
The concept of Median Voter is described following Black (1948, 1958); Gans and Smart (1994); Myerson (1996); Austen-Smith and Banks (1999); Congleton (2004); Saporiti and Thomé (2006); Saporiti (2008); and Penn et al. (2008). In this paper we have discussed relatively simple models of voting system but the real political settings are more complex than the models seem to imply (Congleton 2004). We used simple model basically for three reasons namely: i) simple models allow knowledge to be transferred from person to person than those of more com-plex models, ii) simple models provide us some clear knowledge of voting whereas complex models do not always provide so, iii) from simple models we, the common people, can under-stand the main features of the voting system which is a theme of democracy. Condorcet Method A Condorcet method is any single-winner election method which always selects the Condorcet
winner (i.e., an alternative that beats every other alternative in sequence of pair-wise majority contests); the candidate who would beat each of the other candidates in a run-off election if such a candidate exists. Condorcet method is named after the French political philosopher Marquis de Condorcet (1743-1794). Condorcet (1785) introduced imperfection of jury by problem in proba-bility theory as follows: There are two alternatives x and y between which a panel of jury is to decide, who is guilty or innocent. Between the two alternatives one is guilty and the other is in-nocent. Since the members of jury are imperfect, so they may err. Since the jury members are efficient, so that if the numbers of jury members are more than enough the probability of correct voting will be less wrong. Suppose, x gets more votes than y, so that probability x of being inno-cent to more correct (Feldman 1979). Let probability of voting correctly be p, so the probability of voting incorrectly is ( )p−1 . Suppose there are three alternatives, say, x, y and z. Here one al-ternative is innocent and other two are guilty, so that the problem is complicated. Suppose the contest will be pair wise. As before if x gets more votes than y, and y gets more votes than z, and x gets more votes than z. In this case jury’s decision of being innocent is x and the probability of x being innocent can be calculated as before. But the following case is not so easy which creates a paradox.
Now we discuss the Condorcet voting paradox in which there is no Condorcet winner (Con-dorcet 1785; Risse 2005). In this section and throughout the paper we consider each voter ranks the list of candidates in order of preference i.e., for three candidates x, y and z the preference pro-file of a voter may be as follows:
1. x

International Journal of Management and Transformation 5(1): Spring 2011
12
2. y 3. z.
Here x is one’s first choice, y is second choice and z is third choice. For convenience, we will use this profile as, xPyPz. Let us assume that there are 17 voters of three types and three alterna-tives x, y, z. Let preference relations are as follows:
Type 1: xPyPz by 8 voters, Type 2: yPzPx by 5 voters, Type 3: zPxPy by 4 voters.
In an election a vote between x and y, x collects 8+4 =12 votes and y collects 5 votes, so that x wins. Again a vote between y and z, y collects 8+5 =13 votes and z collects 4 votes, so that y wins. Again a vote between x and z, x collects 8 votes and z collects 4+5 =9 votes, so that z wins. We observe that there is a cycle in the voting results where x is defeated by y, y is defeated by z and also z is defeated by x which is a voter paradox.
Condorcet’s ad hoc judgment is that x is the Condorcet winner, since x wins by 7 votes and de-feats by 1 vote, y wins by 9 votes and defeats by 7 votes, z wins by 1 vote and defeats by 9 votes. But this is not a satisfactory and acceptable decision. Again consider the preference relations be as follows:
Type 1: xPyPz by 49 voters, Type 2: yPzPx by 2 voters, Type 3: zPxPy by 48 voters.
Here y is preferred by a 4950 − majority to x and by a 4851− majority to z. So, according to the Condorcet criterion, y should win, despite the fact that very few voters rank y in the first place but the plurality (will be discussed later) elects x. Borda Count Jean-Charles Borda (1733-1799) developed another voting method named “method of marks”
(Borda 1781). Each elector ranks the alternatives according to his order of preference (ties disal-lowed). Once all votes have been counted and the candidate with the most points is the winner. It is currently used for the election of two ethnic minority members of the National Assembly of Slovenia, and in modified forms, to select presidential election candidates in Kiribati and to elect members of the Parliament of Nauru. It is also used throughout the world by various private or-ganization and competitions. In this method if there are m alternatives, an elector’s first choice is assigned ( )1−m points, his second ( )2−m points and so on down to his last choice, which is assigned 0 point. One property of the Borda rule is that each of the voters of each type gives ( )1−mm marks to the candidates. Borda votes in the above first example be as follows:
For x: 8×2+5×0+4×1 = 20 marks, For y: 8×1+5×2+4×0 = 18 marks, For z: 8×0+5×1+4×2 = 13 marks.
Here x gets highest marks 20, so x wins. We observed that Borda method has no voter paradox but it has some problems. Black (1958) and Satterthwaite (1975) modified the Borda method by misrepresentation of their preferences by the electors. Now we modify the example by adding two alternatives u and v. The preference relations be as follows:
Type 1: xPyPzPuPv by 8 voters, Type 2: yPzPxPuPv by 5 voters, Type 3: zPxPyPuPv by 4 voters.
Now Borda counts be as follows:

International Journal of Management and Transformation 5(1): Spring 2011
13
For x: 8×4+5×2+4×3 = 54 marks, For y: 8×3+5×4+4×2 = 52 marks, For z: 8×2+5×3+4×4 = 47 marks, For u: 8×1+5×1+4×1 = 17 marks, For v: 8×0+5×0+4×0 = 0 mark.
So that in this case x wins again. If the type 3 voters falsely declared that their preference or-dering is as,
Type 3: zPyPuPvPx by 4 voters, then the Borda counts would be,
For x: 8×4+5×2+4×0 = 42 marks, For y: 8×3+5×4+4×3 = 56 marks, For z: 8×2+5×3+4×4 = 47 marks, For u: 8×1+5×1+4×2 = 21 marks, For v: 8×0+5×0+4×1 = 4 marks.
In this case y would have won. The voters of type 3 would have been better off than when they voted honestly; the method provides a temptation for misrepresentation of preferences. The pos-sibility of manipulation of the result of an election through the misrepresentation of preferences as described above was considered neither by Borda nor by Condorcet. Borda Rule is Cloning Manipulable We have seen that Borda did not use manipulation in his voting method. But we can manipu-
late the Borda rule by introducing a cloning candidate (Serais 2002). Suppose x would be de-feated in an election following Borda count. The candidate x can manipulate the election out-come in his favor by introducing his clone y (say) in the choice set, the clone y being defined as an alternative which is ranked immediately below x in the individual preferences.
Let { }nN ..., ,2 ,1= be the set of individual voters, and let { }... , , , zyxY = be the finite set of al-ternatives. Choose a set YA ⊆ be a finite set where ( ) mAn = . Now for { }zyxA , ,= the six possible preference orderings over A will be numbered as follows:
Table 1: Possible Preference Orderings Over the Set A
1n 2n 3n 4n 5n 6n x y z
x z y
y x z
y z x
z x y
z y x
A voting situation is a vector, ( )61 ,...,nns = , where ( )6,...,1 =jn j be the number of type j vot-
ers and ∑=
=6
1jj nn . Here n is the total number of voters in an election. Let { }nn ssS ,...,1= be the
set of all possible voting situations. A social choice function ASf n →: , assigns to each vot-ing situation a non-empty subset of A. Let xyN be the number of voters who prefer x to y, x
sBS , be
the Borda score of x, and xysBS , be the difference of Borda score between x and y for the voting
situations i.e., ysB
xsB
xysB SSS ,,, −= . Now we can introduce the mathematical definition of a clone as
follows:

International Journal of Management and Transformation 5(1): Spring 2011
14
A candidate y is a clone of x for a voting situations if and only if { }yxXz ,\∈∀ , Ni∈∀ zyPzxP ii ⇔ and Ni∈∀ , yxPi .
This type of manipulation was introduced by Dummett (1998) where he called it agenda ma-nipulation. Dummett observed that the Borda rule may suffer from this manipulation and ex-plained by a series of examples. Here we set an example where there are 12 voters and they have to choose preference relation among four alternatives x, y, z and u. Let the preference relations be as follows:
Type 1: yPuPzPx by 2 voters, Type 2: uPzPxPy by 2 voters, Type 3: zPuPyPx by 2 voters, Type 4: xPuPyPz by 3 voters,
Type 5: xPyPuPz by 1 voter, Type 6: zPyPxPu by 2 voters.
Borda votes in the above example be as follows: For x: 2×0+2×1+2×0+3×3+1×3+2×1 = 16 marks, For y: 2×3+2×0+2×1+3×1+1×2+2×2 = 17 marks, For z: 2×1+2×2+2×3+3×0+1×0+2×3 = 18 marks, For u: 2×2+2×3+2×2+3×2+1×1+2×0 = 21 marks.
Here u gets highest 21 marks, so u wins and y gets second lowest 17 marks. Dummett as-sumes that before the election, a fifth candidate, v is introduced by y whom every voter ranks immediately below y. Then the preference profile would be as follows:
Type 1: yPvPuPzPx by 2 voters, Type 2: uPzPxPyPv by 2 voters, Type 3: zPuPyPvPx by 2 voters, Type 4: xPuPyPvPz by 3 voters,
Type 5: xPyPvPuPz by 1 voter, Type 6: zPyPvPxPu by 2 voters.
Then the Borda votes would be as follows: For x: 2×0+2×2+2×0+3×4+1×4+2×1 = 22 marks, For y: 2×4+2×1+2×2+3×2+1×3+2×3 = 29 marks, For z: 2×1+2×3+2×4+3×0+1×0+2×4 = 24 marks, For u: 2×2+2×4+2×3+3×3+1×1+2×0 = 28 marks, For v: 2×3+2×0+2×1+3×1+1×2+2×2 = 17 marks.
Now y gets highest score of 29 marks and wins in the election. Here we observed that in ini-tial voting situation y scored second lowest 17 marks but after cloning a candidate v as fifth can-didate by y placed him in first position. So that cloning manipulation is sufficiently powerful to win in an election by a losing candidate.
Let there are two losing candidates in an election. Now we will discuss the cloning manipu-lation by a single loser. Let { }zyxA ,,= then the voting situation 1s be as follows:
Table 2: The Voting Situation of 1s .
1n 2n 3n 4n 5n 6n Scores
x y z
x z y
z x y
z y x
y z x
y x z
2 1 0

International Journal of Management and Transformation 5(1): Spring 2011
15
From table 2 we find; ( ) 6321,
21 nnnnS xsB
+++= , ( )6541,21 nnnnS y
sB+++= and ( ) 5432,
21 nnnnS zsB
+++= ,
321 nnnN xy ++= , 654 nnnN yx ++= , 621 nnnN xz ++= , 543 nnnN zx ++= ,
651 nnnN yz ++= and 432 nnnN zy ++= , nnnnnnnNN zyyz =+++++=+ 654321 ,
Similarly, nNN yxxy =+ and nNN zxxz =+ .
Let 01,≥xy
sBS and 01,
≥xzsB
S , so that x wins by Borda counts. Now suppose y is in the lowest po-sition by Borda counts. The candidate y could introduce u whom every voter ranks immediately below y. Then the voting situation 2s would be as follows:
Table 3: The Voting Situation of 2s
1n 2n 3n 4n 5n 6n Scores
x y u z
x z y u
z x y u
z y u x
y u z x
y u x z
3 2 1 0
From table 3 we find:
( ) 6321,232 nnnnS x
sB+++=
( )( ) ( )32163212 nnnnnnn ++++++=
xyxsB
NS += 1,,
( )654321,3222 nnnnnnS y
sB+++++=
( )( ) ( )6543216541 2 nnnnnnnnnn +++++++++= nS y
sB+= 1,
,
( ) 5432,322 nnnnS z
sB+++=
( )( ) ( )4325432 2 nnnnnnn ++++++=
zyzsB
NS += 1,,
( )6541,22 nnnnS u
sB+++= = y
sBS 1,
. Since u is cloned by y, so u is always beaten by y. Now y beats x if,
xysByx SN 1,
> i.e., xyxsB
ysB
NSnS +>+ 11 ,,
i.e., ( ) ( ) ( ) 6341326541 2332 nnnnnnnnnn +++>+++++ (1) Now y beats z if,
zysByz SN 1,
≥ i.e., zyzsBzyyz
ysB
NSNNS +≥++ 11 ,, i.e., zy
zsB
ysB
NSnS +≥+ 11 ,,
i.e., ( ) ( ) ( ) 5243326541 2332 nnnnnnnnnn +++>+++++ . (2) Inequalities (1) and (2) satisfy all the properties of Borda rule, so that y wins in the election.
Now we describe the cloning manipulation by both of the losing candidates. In table 2 we consi-

International Journal of Management and Transformation 5(1): Spring 2011
16
dered that x wins but y and z were defeated. Now both y and z could introduce cloning candi-dates. Let u be the clone of y and v be the clone of z and let only y would be benefited by clon-ing. The voting situation 3s would be as follows:
Table 4: The Voting Situation of 3s .
1n 2n 3n 4n 5n 6n Scores
x y u z v
x z v y u
z v x y u
z v y u x
y u z v x
y u x z v
4 3 2 1 0
From table 4 we find:
( ) ( )6321,243 nnnnS x
sB+++=
( )( ) ( ) ( )62132163212 nnnnnnnnnn +++++++++= xzxy
xsB
NNS ++= 1,,
( )654321,4233 nnnnnnS y
sB+++++=
( )( ) ( ) ( )6516543216541 2 nnnnnnnnnnnnn ++++++++++++= yz
ysB
NnS ++= 1,,
( ) 654321,2433 nnnnnnS z
sB+++++=
( )( ) ( ) ( )4326543215432 2 nnnnnnnnnnnnn ++++++++++++= zy
zsB
NnS ++= 1,,
( )6541,323 nnnnS u
sB+++=
( )( ) ( )6516541 2 nnnnnnn ++++++= yz
ysB
NS += 1,,
( ) 5432,323 nnnnS v
sB+++=
( )( ) ( )4325432 2 nnnnnnn ++++++= zy
zsB
NS += 1,.
Since u be the clone of y, so u is always beaten by y. y beats x if 03,>yx
sBS
xzxysB
ysB
NSS +>⇒ 11 ,, i.e., xz
xsB
ysB
NSS +> 11 ,,2 i.e., xz
xsByzyx
ysB
NSNNS +>++ 11 ,,
i.e., xyxzxsBxyyzyx
ysB
NNSNNNS ++>+++ 11 ,,
i.e., xyxzxsByz
ysB
NNSNnS ++>++ 11 ,,,
( ) ( ) ( ) ( )32162163216516541 22 nnnnnnnnnnnnnnnnnn +++++++++>+++++++
i.e., ( ) ( ) ( )6321432165 24234 nnnnnnnnnn +++>+++++ . (3) Again v is the clone of z so that 03,
≥yzsB
S gives 03,≥zv
sBS which implies 03,
≥yvsB
S .

International Journal of Management and Transformation 5(1): Spring 2011
17
Again y beats z if 03,≥yz
sBS yzzy
yzsB
NNS −≥⇒ 3, zy
zsByz
ysB
NnSNnS ++≥++⇒ 11 ,,
i.e., ( ) ( ) 615243432165 234234 nnnnnnnnnnnn +++++>+++++ . (4) Inequalities (3) & (4) satisfy all the properties of Borda rule, so that y wins in the election. In
this section we have shown by calculations that Borda voting is for sincere voters and manipula-tion is impossible but a defeated candidate can manipulate Borda voting in his favor by introduc-ing his clone. Majority Voting In section 2 we observed the voting paradox in majority voting where there is no unambiguous
winner. We modify the majority voting by the introduction of an agenda (Black 1958; Feldman 1979). Let us again consider the preference relation of section 2 i.e.,
Type 1: xPyPz by 8 voters, Type 2: yPzPx by 5 voters, Type 3: zPxPy by 4 voters.
Now suppose that x is the status quo, while y is a motion to change the status quo and z is an amended version of that motion. A typical committee practice, which Black (1958) called Proce-dure α , is to hold a vote between y and z (the motion and the amended version), and place the winner of that vote against x (the status quo). If votes are sincere, Procedure α produces y on the first round (the amendment is defeated) and x on the second (the bill is defeated). In these cir-cumstances, type 2 voters could misrepresent their preferences as,
Type 2: zPyPx by 5 voters. Then, z could win the first round (the amendment would pass) and then z defeated x (the
amended bill would be adopted). In this case type 2 voters could be benefited by manipulation of voting.
A second committee practice, which Black (1958) called Procedure β , pits each motion against the status quo. We have shown z defeats the status quo but y does not, so that z is adopted, provided the voters vote sincerely. We observed that under Procedure β , type 1 voters have an opportunity to gain by misrepresentation. If they vote as of their preferences were,
Type 1: yPxPz by 8 voters, Then both y and z would defeat the status quo in the first round. In the second round y would
defeat z. So that type 1 voters would have manipulated the choice of y, which they prefer, over z. Single Transferable Voting System The single transferable vote (STV) is a system of preferential voting designed to minimize
wasted votes. In STV, a constituency elects two or more representatives per electorate. As a re-sult the constituency is proportionally larger than a single member constituency from each party. Political parties tend to offer as many candidates as they most optimistically could expect to win; the major parties may nominate almost as many candidates as there are seats, while the minor parties and independents rather fewer. STV initially allocates an elector’s vote for her most pre-ferred candidate and then, after candidate have been either elected or eliminated, transfers sur-plus or unused votes according to the voter’s stated preferences (ties disallowed). It is a many ballots electoral system and mainly used in the English-speaking countries. It can be used for ei-ther single winner or multi-winner voting system and we will discuss both methods in this sec-tion.

International Journal of Management and Transformation 5(1): Spring 2011
18
History of STV The concept of transferable voting was first proposed by Thomas Wright Hill in 1821, for ap-
plication in elections at his school but was not populated. Carft Andrae in 1855 proposed a trans-ferable voting system for election in Denmark and used it in 1856 to elect the Danish Rigsdag. The English barrister Thomas Hare is generally credited with the concept of STV and proposed that electors should have the opportunity of discovering which candidate their vote had ultimate-ly counted for, to improve their personal connection with voting. Andrew Inglish Clark was suc-cessful in persuading the Tasmanian House of Assembly to be the first parliament in the world elected by what become known as the Hare-Clark system, named after himself and Thomas Hare. The STV is a system of preferential voting designed to minimize wasted votes which pro-vides proportional representation while ensuring that votes are explicitly expressed for individual candidates rather than party lists. In 2007 STV is used for parliamentary elections in the Repub-lic of Ireland, North Irish Assembly and Malta. It is also used for the Australian Senate in the form of a group voting ticket, as well as certain regional and local elections in Australia, local government elections in Australia, local government elections in New Zealand. It is held up by its supports as being the best and fairest electoral system in the world, but political parties dislike it and resist to adopting it because it requires candidates to compete publicly with one another. If it is popularized in the society then there is probability of political parties to be completely ab-olished. Setting the Quota In an STV election, a candidate requires a certain minimum number of votes ‘the quota’ to be
elected. A number of different quotas can be used; the most common is the Droop quota, given by the formula (Droop 1881):
11+
+SV
where, V = the total number of valid votes cast. S = the number of seats to be filled. STV is a step procedure, in each step voters cast votes for their most preferred candidate. It
proceeds according to the following steps: i) Any candidate who touched or exceeded the required quota is declared
elected. ii) If not enough candidates have been elected, the count continues. iii) If a candidate casts more vote than the quota, then their surplus is trans-
ferred to other candidates according to the next preference on each voter’s ballot. iv) If none meets the quota, the candidate with the fewest votes is eliminated
and their votes are transferred. This process continues until the last candidates survive which is the winner in the election.
Again in quota system, voting procedure is stopped when the numbers of remaining candidates instead of counting votes until all candidates have reached a quota. In STV, candidates who re-ceive excess votes and candidates who are excluded have their votes transferred to other candi-dates, it is said to be minimize wasted votes. Let us introduce a simple example:
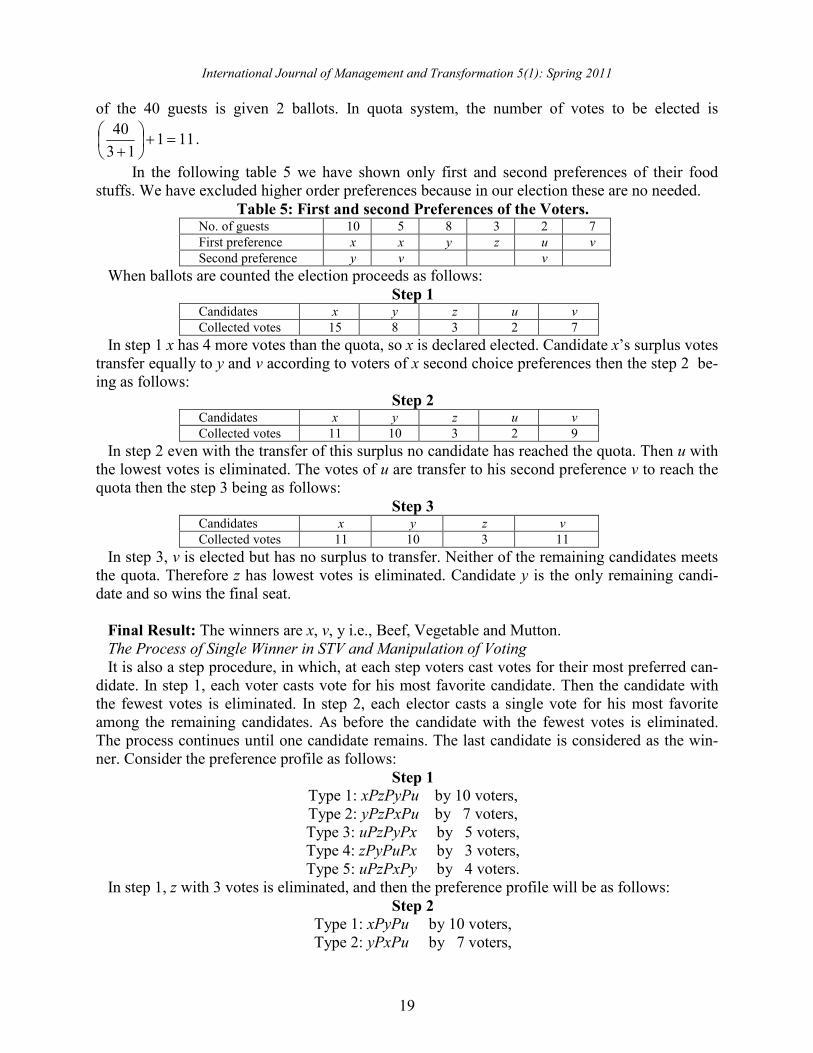
Let 40 guests (voters) are invited in party and 5 food stuffs (candidates), 3 of which will be selected. The candidates are: Beef (x), Mutton (y), Chicken (z), Fish (z) and Vegetable (v). Each
International Journal of Management and Transformation 5(1): Spring 2011
19
of the 40 guests is given 2 ballots. In quota system, the number of votes to be elected is
11113
40=+
+
.
In the following table 5 we have shown only first and second preferences of their food stuffs. We have excluded higher order preferences because in our election these are no needed.
Table 5: First and second Preferences of the Voters. No. of guests 10 5 8 3 2 7 First preference x x y z u v Second preference y v v
When ballots are counted the election proceeds as follows: Step 1
Candidates x y z u v Collected votes 15 8 3 2 7
In step 1 x has 4 more votes than the quota, so x is declared elected. Candidate x’s surplus votes transfer equally to y and v according to voters of x second choice preferences then the step 2 be-ing as follows:
Step 2 Candidates x y z u v Collected votes 11 10 3 2 9
In step 2 even with the transfer of this surplus no candidate has reached the quota. Then u with the lowest votes is eliminated. The votes of u are transfer to his second preference v to reach the quota then the step 3 being as follows:
Step 3 Candidates x y z v Collected votes 11 10 3 11
In step 3, v is elected but has no surplus to transfer. Neither of the remaining candidates meets the quota. Therefore z has lowest votes is eliminated. Candidate y is the only remaining candi-date and so wins the final seat. Final Result: The winners are x, v, y i.e., Beef, Vegetable and Mutton. The Process of Single Winner in STV and Manipulation of Voting It is also a step procedure, in which, at each step voters cast votes for their most preferred can-
didate. In step 1, each voter casts vote for his most favorite candidate. Then the candidate with the fewest votes is eliminated. In step 2, each elector casts a single vote for his most favorite among the remaining candidates. As before the candidate with the fewest votes is eliminated. The process continues until one candidate remains. The last candidate is considered as the win-ner. Consider the preference profile as follows:
Step 1 Type 1: xPzPyPu by 10 voters, Type 2: yPzPxPu by 7 voters, Type 3: uPzPyPx by 5 voters, Type 4: zPyPuPx by 3 voters, Type 5: uPzPxPy by 4 voters.
In step 1, z with 3 votes is eliminated, and then the preference profile will be as follows: Step 2
Type 1: xPyPu by 10 voters, Type 2: yPxPu by 7 voters,

International Journal of Management and Transformation 5(1): Spring 2011
20
Type 3: uPyPx by 5 voters, Type 4: yPuPx by 3 voters, Type 5: uPxPy by 4 voters.
In step 2, u with 9 votes is eliminated, and then the preference profile will be as follows: Step 3
Type 1: xPy by 10 voters, Type 2: yPx by 7 voters, Type 3: yPx by 5 voters, Type 4: yPx by 3 voters, Type 5: xPy by 4 voters.
In step 3, x with 14 votes is eliminated. Finally y will be the remaining person and will win in the election. Type 3 voters prefer z to y. They anticipate that y will win then they could manipu-late the preferences as follows:
Type 3: zPxPuPy by 5 voters. Then as before in step 1 u with 4 votes would be eliminated and then the preference profile
would be as follows: Step 2a
Type 1: xPzPy by 10 voters, Type 2: yPzPx by 7 voters, Type 3: zPyPx by 5 voters, Type 4: zPyPx by 3 voters, Type 5: zPxPy by 4 voters.
In step 2a, y with 7 votes would be eliminated and then the preference profile would be as fol-lows:
Step 3a Type 1: xPz by 10 voters, Type 2: zPx by 7 voters, Type 3: zPx by 5 voters, Type 4: zPx by 3 voters, Type 5: zPx by 4 voters.
In step 3a, x with 10 votes would be eliminated. Finally z would be remaining person and would win in the election. Therefore, we have seen that STV is manipulable. Tie-Breaking in STV Although we mentioned above that in STV ties disallowed, sometimes ties can occur for sever-
al different reasons and the ties need to be broken (Newland and Britton 1997; O’Neill 2004). The ties can be broken simply by lottery system such as tossing coin. But this system is not the best one and usually the following four rules are used in tie-breaking.
i) Forwards Tie-Breaking (FTB): Choose the candidate who has the most (least) votes at the first stage where they had unequal votes.
ii) Backwards Tie-Breaking (BTB): Choose the candidate who has the most (least) votes at the previous stage or at the latest point in the count where they had unequal votes.
iii) Borda Tie-Breaking: Choose the candidate with the highest (least) Borda score.
iv) Cooms Tie-Breaking: Choose the candidate with the fewest (most) last place votes.

International Journal of Management and Transformation 5(1): Spring 2011
21
Sometimes after breaking tie by any of the above mentioned rules the candidate would still face tied. In this case it is useful to distinguish between weak ties and strong ties. A weak tie oc-curs when candidates have the same number of votes at a given stage. A strong tie occurs when candidates are still tied after applying a tie-breaking rule (any one rule from (i)–(iv) mentioned above). A strong tie would be broken by lottery. Here we will use ERS97 rules of tie-breaking (Newland and Britton 1997; O’ Neill 2004). The difference between FTB and BTB is given in table 6 which is from Newland & Britton (1997) without any change. Table 6: Example Tally with ERS97 Rules where 60 Voters are Electing 2 Candidates from 6.
Surplus of x Eliminate w Eliminate v Eliminate z
Stage 1 2 3 4 5 x 23 20.00 20.00 20.00 20.00 y 13 13.00 13.00 15.00 15.00 z 6 6.50 10.00 12.00 2.00 u 7 7.50 9.50 12.00 18.00 v 7 7.50 7.50 - - w 4 5.50 - - -
Non-Transferable 0 0.00 0.00 1.00 5.00 Here we have to eliminate one candidate at stage 4 and there is a tie between candidates z and
u. Thus, tie-breaking needs to be used to determine which candidate is to be eliminated. We use the FTB following ERS97 rules. In this case we first look to the counts at stage 1. From table 6 we see that u has one more vote than z at stage 1. So that candidate z is eliminated. If z and u had been tied at stage 1, then we would have to be looked to subsequent stages. If z and u would have been tied in all stages, then we would have been a strong tie which would have been broken by lottery.
But in BTB we have to look at the previous stage to break ties and if necessary to the pre-ceding stages. In table 6 we see in preceding stage 3 that z is ahead to u, so that u would be elim-inated.
One problem arises with FTB where the elimination order is: 4, 1, 2, 3 which is not sequen-tial and is undesirable. If we make a meaningful sequence starting from 4 then the order is: 4, 3, 2, 1 which is BTB. Again FTB does not use the most relevant information than BTB to break the tie. Hence BTB is better than FTB in tie-breaking. Probability of Eliminating of Winning Candidates in Tie-Breaking STV In tie-breaking STV, ERS97 rule sometimes eliminates winning candidates without manipu-
lation of voting which is undesirable. Suppose there are 31 voters and 6 candidates among which one will be elected. Each of the voters is given 4 ballots (O’ Neill 2004). In step 1 the prefe-rences would be as follows:
Step 1 No. of votes 4 5 5 2 4 11
1st prefe-rence
x y z u v w
2nd prefe-rence
y z y x x
3rd Prefe-rence
z y y
4th prefe-rence
z z

International Journal of Management and Transformation 5(1): Spring 2011
22
In step 2, u with fewest votes would be eliminated and u’s votes would be transferred to his second preferred candidate x. The preference profile of step 2 would be as follows:
Step 2 Candidates x y z v w Collected votes 6 5 5 4 11
In step 3, v with fewest votes is eliminated and v’s votes would be transferred to his second preferred candidate x. The preference profile of step 3 would be as follows:
Step 3 Candidates x y z w Collected votes 10 5 5 11
In step 3, a tie arises between y and z with the fewest 5 votes. Then both would be eliminated by ERS97. However, instead tie would be broken by FTB or BTB or by lottery. Suppose z was eliminated by lottery and z’s votes would be transferred to his second preferred candidate y. Then y would be tied with x. The preference profile of step 4 would be as follows:
Step 4 Candidates x y w Collected votes 10 10 11
In that situation tie would be broken by FTB rule. In step 1 candidate x has fewer votes than y, so that x would be eliminated and y as x’s second preferred candidate received all of x’s votes and beat w with 20 to 11 votes in final step. Therefore, winning candidate in ERS97 rule was eliminated which is unacceptable situation in STV election.
So that there is a flaw in STV, ERS97 FTB rule. This flaw could be removed in two ways: (i) by changing the rules of STV, ERS97, (ii) by using BTB rule which is better as we have seen be-fore. Hence with FTB a winning candidate could be improperly eliminated however, with BTB both of these last-place candidates cannot win and can thus be properly eliminated. Plurality Voting The plurality voting system is a single-winner voting system often used to elect executive of-
ficer or to elect members of a legislative assembly, which is based on single member constituen-cies. This is the simplest of all voting systems for voters and vote counting officials. Generally plurality ballots can be categorized into two forms. The simplest form is a blank ballot where the name of a candidate is written in by hand. A most structured ballot will list all the candidates and allow a mark to be made for a single candidate; however a structured ballot can also include space for a write- in candidate as well. Sometimes at the end of each candidate a known symbol is enclosed and each voter votes for his favorite by sealing on the symbol of his favorite. Under this system the winner of the election acts as representative of the whole region of his constitut-ing area. In this method there are many candidates or alternatives and there are many voters or individuals where each voter casts only one vote for one candidate. The candidate who collects highest total wins in the election; there is no requirement that the winner gain an absolute ma-jority of votes. This type of voting system is prevailed in most of the countries in the world such as the USA, the UK, Canada, India, Bangladesh, Pakistan, and so on. This type of voting some-times is called simple plurality, first past the post (FPP) or winner-takes-all. Plurality voting is used for local and/or national elections in about 43 of the 191 countries of the UN. The term FPP was coined as an analogy to horse racing, where the winner of the race is the first to pass a par-ticular point as the track, after which all other runners completely lose. In some countries such as France a different plurality system is used, where there are two rounds; the two-ballots or run off election plurality system. If any candidate in the first round gains majority of the votes then there

International Journal of Management and Transformation 5(1): Spring 2011
23
is no need of second round, otherwise the two highest-voted candidates of the first round com-pete in a two-candidate second round. Most of the voters cast vote for one among the favorite candidates who has a strong chance of winning. However, some voters will want to manipulate the result by misrepresenting their votes. Consider three preference relations be as follows:
Type 1: xPyPz by 15 voters, Type 2: yPzPx by 12 voters, Type 3: zPyPx by 4 voters.
In a sincere election, type 3 voters cast their votes for z, but x wins the plurality. If type 3 vot-ers anticipate this result, they of course vote for y, as y is their second choice candidate. In this case the type 3 preference would be yPzPx, and then y would get 12+4 =16 votes where as x would get 15 votes and in final result y would win. Observed that here 4 voters of type 3 are ma-nipulating the election. Manipulation by a group rather than a single individual is called coali-tional manipulation. Unfortunately sometimes plurality voting creates tie votes. In the above ex-ample if there were 15 type 1 voters and 15 typy 2 voters, only 1 type 3 voter and one of the vot-ers in type 1 is the leader. In a sincere election x would cast 15 votes and y would cast 15 votes z would cast 1 vote, and the leader would break the yx − tie in favor of x, since, x is his most fa-vorite candidate. Anticipating the result that x would win which is less preferred by type 3 voter, he can manipulate the election by the preference profile as yPzPx. Then x would cast 15 votes and y would cast 16 votes and final result that y would win. Therefore, the plurality voting is ma-nipulable. Exhausting Voting This method is rarely used in modern world, which works in steps. In step 1, each voter casts a
vote for his least preferred candidate. The candidate with the largest number of votes is eliminat-ed from the list. The process continues until the last candidate survives which is the winner in the election (ties disallow). Suppose the preference relations be as follows:
Step 1 Type 1: xPyPzPuPv by 5 voters, Type 2: yPzPxPuPv by 12 voters, Type 3: zPxPyPvPu by 10 voters, Type 4: uPvPxPyPz by 11 voters, Type 5: vPyPxPzPu by 8 voters, Type 6: zPxPuPvPy by 9 voters.
In step 1, u collects highest score of 10+8 =18 votes, so that u is eliminated. Now the prefe-rence relations for step 2 be as follows:
Step 2 Type 1: xPyPzPv by 5 voters, Type 2: yPzPxPv by 12 voters, Type 3: zPxPyPv by 10 voters, Type 4: vPxPyPz by 11 voters, Type 5: vPyPxPz by 8 voters, Type 6: zPxPvPy by 9 voters.
In step 2, v collects highest score of 5+12+10 =27 votes, so that v is eliminated. Now the prefe-rence relations for step 3 be as follows:
Step 3 Type 1: xPyPz by 5 voters,

International Journal of Management and Transformation 5(1): Spring 2011
24
Type 2: yPzPx by 12 voters, Type 3: zPxPy by 10 voters, Type 4: xPyPz by 11 voters, Type 5: yPxPz by 8 voters, Type 6: zPxPy by 9 voters.
In step 3, z collects highest score of 5+11+8 =24 votes, so that z is eliminated. Finally the pre-ference relation for step 4 be as follows:
Step 4 Type 1: xPy by 5 voters, Type 2: yPx by 12 voters, Type 3: xPy by 10 voters, Type 4: xPy by 11 voters, Type 5: yPx by 8 voters, Type 6: xPy by 9 voters.
In step 4, y collects highest score of 5+10+11+9 =35 votes, so that y is eliminated. Finally x is the remaining person and wins in the election. If the type 4 voters anticipate that x will win who is not their most liking candidate and there is no chance of winning their most favorite candidate u. So they would want to manipulate the result and they would send a message that they would cast votes for z as their most preferred candidate. Then if z who had a little chance of winning would promise with them that type 4 voters would find favor of z then they would manipulate the preferences as follows:
Type 4: zPvPuPyPx by 11 voters. In that case no voters of other types would imagine such a manipulation. Similarly as before, in
step 1, u would eliminate, in step 2, v would eliminate, in step 3, x would eliminate, in step 4, y would eliminate and finally z would win. So that type 4 voters are better off than when they are honest. Therefore exhausting voting is manipulable. Approval Voting Approval voting is a single winner voting system used for elections. In this method each voter
may vote for as many of the candidates as he wishes. Let there is a set of n candidates { }... , , , zyx . One may cast 0, 1, 2, …, or even m votes, where nm ≤ , by assigning a single vote to each candidate he approves and none to each candidate he disapproves. The candidate with the highest total wins (Brams and Fishburn 1978). The system was described in 1976 by Guy Olte-well and also by Rober J. Weber who coined the term “approval voting”. Approval voting has been adopted by the Mathematical Association of America (1986), The Institute of Management Sciences (1987), The American Statistical Association (1987), and Institute of Electrical and Electronics Engineers ((IEEE) (1987)). IEEE rescinded the approval voting in 2002 because the director of IEEE Deniel J. Senese states that “few of our members were using it and it was felt that it was no longer needed”. From 13th to 18th centuries, the Republic of Venice elected the Doge of Venice using a multi-stage process that featured random selection and voting which al-lowed approval of multiple candidates and required a super majority. In 19th century approval voting was used in England. The selection of the Secretary-General of the UN has involved rounds of approval polling to help discover and build a consensus before a formal vote is held in the Security Council. Approval voting usually elects Condorcet winners in practice (Brams and Fishburn 1978).

International Journal of Management and Transformation 5(1): Spring 2011
25
Sincere Approval Voting An approval voting is sincere if the outcome is the same as the true preference of the voters
(Brams and Fishburn 1978). Let us consider there are four candidates x, y, z and u, and a voter’s preference profile being as follows:
xPyPzPu. We can write his possible sincere approval votes as follows:
i) vote for x, y, z and u, ii) vote for x, y and z, iii) vote for x and y, iv) vote for x, v) vote for no candidates.
If a voter be indifferent between y and z but still x is his most preferred candidate, then also (i) to (v) conditions are sincere (in this paper indifferent is not considered). Now we can also in-clude a new combination as a sincere vote which is :
vi) vote for x and z. Let us introduce another example as follows: There are three electors, where elector 1 is a leader; if there are ties for first place, he breaks
them and there are three alternatives x, y, z. The preference profile is as follows: 1 (leader) 2 3 x y z y z x z x y.
Each elector may cast 0, 1, 2 or 3 votes. It is foolish to cast votes equally for all or for none. Elector 1(the leader) can vote as follows:
i) vote for x, y and z, ii) vote for x and y, iii) vote for y,
and so on. Here (i) and (ii) are sincere but (iii) is insincere. Similarly voter 2’s sincere strategies are as follows:
i) vote for y, ii) vote for y and z.
Similarly one can calculate voter 3’s sincere strategies. The following discussion results that approval voting can be manipulated and can be non-
manipulated. Manipulation of the Approval Voting Let us consider the above example. Here every voter casts 1 vote for his favorite. So that the
results are: 1 for x, 1 for y, 1 for z. Person 1 (the leader) breaks the tie in favor of x, so that x wins. Voter 2 anticipates that by the leader’s favorite x will win who is his less favorite, so he could vote falsely as: 1 vote for his second favorite z instead, but none for y or x, then the result would be 2 votes for z but 1 vote for x and none for y and finally z would be winning. Therefore, the approval voting is manipulable. On the other hand person 1 votes 1 for each in a sincere way but both 2 and 3 also vote sincerely in the following ways:
i) person 2 votes 1 for y, 1 for z but none for x ii) person 3 votes 1 for z, 1 for x but none for y.