international journal of engineering and geosciences
TRANSCRIPT

* Corresponding Author Cite this article
*([email protected]) ORCID ID 0000 – 0002 – 5091 – 9571 ([email protected]) ORCID ID 0000 – 0002 – 9800– 8056 ([email protected]) ORCID ID 0000 – 0001 – 6950 – 4336 ([email protected]) ORCID ID 0000– 0003– 0125 – 4646 Research Article / DOI: 10.26833/ijeg.658377
Yamak B, Yagcı Z, Bilgilioğlu B B & Comert R (2021) Investigation of the effect of urbanization on land surface temperature example of Bursa. International Journal of Engineering and Geosciences, 6(1), 1-8.
Received: 12/12/2019; Accepted: 24/03/2020
International Journal of Engineering and Geosciences– 2021; 6(1); 01-08
International Journal of Engineering and Geosciences
https://dergipark.org.tr/en/pub/ijeg
e-ISSN 2548-0960
Investigation of the effect of urbanization on land surface temperature example of Bursa
Beyzanur Yamak *1 , Zekeriya Yagci 1 , Burhan Baha Bilgilioglu 1,2 , Resul Comert 1
1Gumushane University, Faculty of Engineering and Natural Sciences, Geomatics Engineering Department, Gümüşhane, Turkey 2Istanbul Technical University, Faculty of Civil Engineering, Geomatics Engineering Department, İstanbul, Turkey
Keywords ABSTRACT Land surface temperature (LST) Urban heat island (UHI) Normalized differential vegetation index (NDVI) Bursa
Today, industrialization and urbanization in large cities cause an increase in the surfaces covered with man-made objects such as concrete and asphalt. The expansion of urban areas and increase in the using materials with high heat storage properties, directly affect the Land Surface Temperature (LST), which shows an increase in the sensible temperature of the region. LST is directly connected to the natural green vegetation of the land and varies widely in large urban areas, these differences related to the temperature is defined as the ‘urban heat island’. In this study, it was investigated the temporal variation of land surface temperature due to urbanization. Bursa, which is considered as a study area, has shown a rapid population increase since 1990 and a rapid increase in the number of buildings with the impact of urbanization and industrialisation. To determine the effect of this urbanization and industrialisation on land surface temperature, temporal change analysis of the surface temperature in the Bursa was observed with Landsat satellite images of 1988, 1998, 2008 and 2018. From produced maps, it was observed that the amount of green vegetation in urban areas decreased and as a consequence of this decrease, the surface temperature increased in the urban areas.
1. INTRODUCTION
The population of urban areas has uncontrolled rising due to education, health and housing opportunities. Rapid population growth causes changes in land use characteristics and unplanned urbanization in cities. Especially with the increase of residential and industrial areas, the green zone required for the human is decreasing. Urbanization and industrialization increase the heat adversely affects the water cycle in the atmosphere and climate change (Yuksel and Yilmaz 2008). Also, with the increase of urban needs, vegetation and forestry areas decrease, the absorption of solar radiation increasesand affect the regional climate. These results lead to the formation of urban heat island (UHI) (Morabito et al. 2016). UHI is the case where a surface area in the city is warmer than in other regions. This climatic discrepancy in cities can be defined as urban heat island (Yuksel and Yilmaz 2008).
Radiation that reaches the Earth is one of the most important factors affecting UHI formation. Different land use/land cover properties in rural and urban areas cause significant temperature differences in these areas. Reflection of the incoming energy from the ground is not the same in rural and urban areas. Because in rural areas, the reflected energy is reflected without any physical obstacles, while in urban areas it is kept between high buildings and occurred significant back-time delays (Cicek and Dogan 2006). It is very important to identify these areas in order to reduce the impact of the heat islands in cities and to make sustainable plans for the future. With the developing satellite technologies, it is possible to determine the urban heat islands with the thermal sensors on the satellite (Orhan et al. 2019). Today many studies are investigating the relationship between urban land use/land cover and urban heat island (Herbei et al. 2012; Patil et al. 2018; Khorrami et al. 2019; Kuşak and Küçükali 2019). When these studies were

International Journal of Engineering and Geosciences– 2021; 6(1); 01-08
2
examined, it was observed that generally similar results were obtained. Especially in urban areas, the UHI value was high but in vegetation and water areas, the UHI value was low (Sekertekin et al. 2016).
In this study, the relationship of urban heat island formation and the urban growth of Bursa city center between 1988 and 2018 was investigated. Within this scope, the land use/land cover (LU/LC) and land surface temperature (LST) maps of the city center have been produced for 10 years periods since 1988. By comparing the generated maps, the relationship between LST and terrain LU/LC was demonstrated. Besides, the Normalized Difference Vegetation Index (NDVI) and Normalized Difference Built-up Index (NDBI) were produced to determine the relationship between LST and urban area and vegetation. Also, the correlation between these indexes and LST was determined.
2. STUDY AREA
The main area of the study includes Osmangazi,
Yildirim and Nilufer district centers of Bursa. The study area consists of the city center and its surrounding area covering a total area of 630.72 km2 because urban heat islands are particularly come into existence in urban centers, structured areas and industrially developed areas. The location and boundaries of the study area are shown in Figure 1. Bursa province is a middle scale city when 755.504 people live in there in 1965, then the number increased to 2.150.571 in 2000 and 2.994.521 in 2018 in proportion with the industry. Thus Bursa became the fourth province with the highest population density in Turkey (TUIK 2019). In this respect, it is a very important issue to examine the effects and results of the urbanization of Bursa.
Figure 1. Study area: yellow polygon indicates the application area 3. DATA and METHODS 3.1. Data
Landsat satellite community has been used for the extraction of information about the earth surface for many years. In this study, landsat satellite images were used to create LU/LC and land surface
temperature maps (Aghayev 2018; Orhan et al. 2019). Landsat 5 satellite images for 1988, 1998, 2008 Landsat 8 satellite images for 2018 were obtained from the US Geological Survey (USGS) 'Earth Explorer' website (https://earthexplorer.usgs.gov/). When selecting satellite images, we preferred cloudless images considering atmospheric conditions and seasonal effects (Table 1). Spectral bands were used for LU/LC classification and relevant spectral bands and thermal bands were used when generating LST maps. The band characteristics of the satellite images are given in Table 2. Table 1. Details of Landsat satellite images
Number Satellite Sensor Date Acquired
1 Landsat 5 TM 25.07.1988 2 Landsat 5 TM 06.08.1998 3 Landsat 5 TM 17.08.2008
4 Landsat 8 OLI &TIRS 13.08.2018
Table 2. Bands and spatial resolutions of satellites images used in analysis
Bands Resolution (meters)
Blue 30 Green 30 Red 30 Near Infrared 30
SWIR 1 30
SWIR 2 30
Thermal* 30
*The thermal bands were re-sampled to 30 meters.
3.2. Method
The methodology applied within the scope of this
study is given below as sub-headings. 3.2.1 Production of land use / Land cover (LU/LC)
Supervised classification method was performed for LU/LC determination. To classify the satellite images of the study area for the specified years, 5 classes were defined as urbanized area, vegetated area, water, cropland and bare soil. According to the defined classes, training data were collected and the classification process was performed using the Maximum Likelihood algorithm. The accuracy of supervised classification results was calculated by the error matrix for each year using 350 control points.
3.2.2 Normalized difference built-up index (NDBI)
Normalized Difference Built-up Index (NDBI) was calculated using Middle Infra-Red (MIR) and Near Infra-Red (NIR) bands spectral reflectance value for determining the settlements of the study area (Herbei et al. 2012). Also, this index has been applied for determining the relationship of the settlement area with the land surface temperature.

International Journal of Engineering and Geosciences– 2021; 6(1); 01-08
3
Normalized Difference Built-up Index is calculated by dividing the difference of MIR and NIR bands with the sum of bands (Eq. (1)).
NDBI = 𝑀𝐼𝑅−𝑁𝐼𝑅
𝑀𝐼𝑅+𝑁𝐼𝑅 (1)
3.2.3 Calculation of land surface temperature (LST)
Many algorithms have been used for the purpose of extracting LST from satellite imagery. Some of algorithms is the SplitWindow Algorithm (SWA), Single Channel Algorithm (SCA), Mono-Window Algorithm (MWA) and the Radiative Transfer Equation (RTE) (Ndossi and Advan 2016). In this study, Mono-Window Algorithm (MWA) was used to extract LST (Qin et al. 2001; Wang et al. 2015). The process flow of the methodology is given in Figure 2 (Avdan and Jovanovska 2016). In the study, the thermal band was used to determine the brightness temperature, red and NIR bands were used to calculate Normalized Differential Vegetation Index (NDVI).
Figure 2. Flow chart of the Land Surface Temperature (LST) algorithm
The processing steps and formulas of the LST calculation are as follows. 3.2.3.1 Top of atmospheric spectral radiance calculation (TOA)
The first step of the algorithm is to input the thermal band and calculated spectral radiance formulated from the official site of USGS (Eq.(2)) (Akher and Chattopadhyay 2017).
TOA (L) = ML * Qcal + AL (2) ML: Band specific multiplication rescaling factor
Qcal: Radiant value corresponding to the thermal tape AL: Resizing factor 3.2.3.2 Conversion of radiance to at-sensor temperature (BT)
Digital numbers (DN) refer to reflection values. After these reflection values are converted to radiance values, the spectral radiance is converted to brightness temperature (BT) using the thermal constants provided in the metadata file of the thermal band data (Eq.(3)) (Akher and Chattopadhyay 2017). Applied values for the images were given in Table 3.
Kelvin transformation is performed to obtain the results in Celsius (approx -273.15).
BT = K2
(ln (K1 / “TOA”) + 1) - 273.15 (3)
where K1 and K2: Band-specific thermal conversion constants. Table 3. Applied metadata values for different sensors
Metadata Landsat 5 (Band 6) Landsat 8 (Band 10)
K1 607.76 774.8853
K2 1260.56 1321.0789
ML 0.055375 0.0003342
AL 1.18243 0.1
3.2.3.3 Normalized differential vegetation index (NDVI)
The calculation of the normalized vegetation index was used both in the calculation of emissivity in the LST and the comparison of the existing vegetation areas between the LST (Eq.(4)) (Avdan and Jovanovska 2016).
NDVI = NIR– Red
NIR + Red (4)
3.2.3.4 Calculating the proportion of vegetation (Pv)
The vegetation rate can be calculated according to the following formula (Eq.(5))(Akher and Chattopadhyay 2017).
Pv =((NDVI – NDVImin) / (NDVImax – NDVImin))2 (5)
3.2.3.5 Calculating land surface emissivity (𝜀)
Land surface emissivity (𝜀) must be determined to calculate LST (Eq.(6)). Surface emissivity is defined as the relative ability of the surface of a material to emit energy by radiation. The emissivity is also expressed as the ratio of the energy emitted by a given material to the energy emitted by a black body at the same temperature. In short, it is the

International Journal of Engineering and Geosciences– 2021; 6(1); 01-08
4
efficiency of transmitting thermal energy from the surface to the atmosphere (Jimenez- Munoz et al. 2006).
𝜀𝜆=𝜀V𝜆+𝜀𝑠𝜆 (1−𝑃V) +𝐶𝜆 (6)
where, 𝜀V𝜆: Plant emissivity value;𝑠𝜆: Soil emissivity value
3.2.3.6 Calculation of Land Surface Temperature (LST)
Equation 7 and Equation 8 are applied to obtain the land surface temperature map (Akher and Chattopadhyay 2017).
LST = BT
{1 + [(λBT/ρ)*ln(ε)]} (7)
𝜌 = ℎ𝑐
σ = 1.438 × 10⁻² m K (8)
σ: Boltzmann constant (1.38 × 10⁻²³ J/K) ℎ:Planck’s constant (6.626 × 10⁻³⁴Js) c: Velocity of light (2.998 × 10⁸ m/s) 3.2.4 Calculation of urban heat island effect
The following formula (Eq. 9) was used to analyse urban heat island changes in the study area (Ma et al. 2010):
UHI:µ+ 𝝈
𝟐 (9)
In the formula, µ is the average LST value of the
study area and σ is the standard deviation of LST.
4. RESULTS and DISCUSSION
4.1 LU/LC Classification
The result maps of the classification process for Bursa city center are shown below (Figure 3). For the accuracy assessment of the produced maps, 350 reference points were placed in the study area and the overall accuracy of the classified data was determined for each period. The overall accuracy values of the classified images of 1988, 1998, 2008, 2018 were 85%, 83%, 80% and 86% respectively.
According to the classification results, it has been observed that the urban areas have increased substantially. According to the spatial comparison made after the classification, the urban area in 1988 is 74.18 km2; in 2018, it increased approximately 270% and reached 202.44 km2. This rise in the urban area increase of the land surface temperature and affect the expansion of the urban heat island.
4.2 Land Surface Temperature (LST)
The thermal infrared bands of the Landsat 5 and Landsat 8 satellites were converted to spectral radiance and used as a source for the calculation of the brightness temperature of the surface
temperature land. Following process steps in Figure 2, land surface temperature maps of the study area were produced for the determined years (Figure 4).
Land surface temperature values vary between 20-34 °C in 1988, 17-32 °C in 1998, 22-46 °C in 2008 and 19-42 °C in 2018. In 1988 and 2018, the maximum temperature difference is 8 °C and the minimum temperature difference is 1 °C.
Figure 3. LU/LC maps obtained as a result of classification process; (a): 1988, (b): 1998, (c): 2008, (d): 2018

International Journal of Engineering and Geosciences– 2021; 6(1); 01-08
5
Figure 4. LST maps produced by years (a): 1988, (b): 1998, (c): 2008, (d): 2018
To evaluate the accuracy of land surface temperature maps, the nearest temperature data to satellite image acquisition time were obtained at the meteorological station of Bursa, Kestel, Nilufer and
Yildirim from General Directorate of Meteorology (Table 4). Temperature differences are given as absolute values in Table 4. Root mean square errors that were calculated from temperature difference for the land surface temperature maps were calculated as 0.7 (°C) in 1988, 2.7 (°C) in 1998, 2.9 (°C) in 2008 and 0.83 (°C) in 2018.
4.3 Relationship between Land Surface Temperature and Land Cover/Land Use
When the relationship between land surface temperature maps and LU/LC classes is examined, it is observed that the highest value of land surface temperature is in urban areas and the lowest value is in wetlands (Figure 5). Additionally, it was found that the surface temperature of the study area changed depending on the land cover and land use classes.
Figure 5. Relationship between land surface temperature and land use
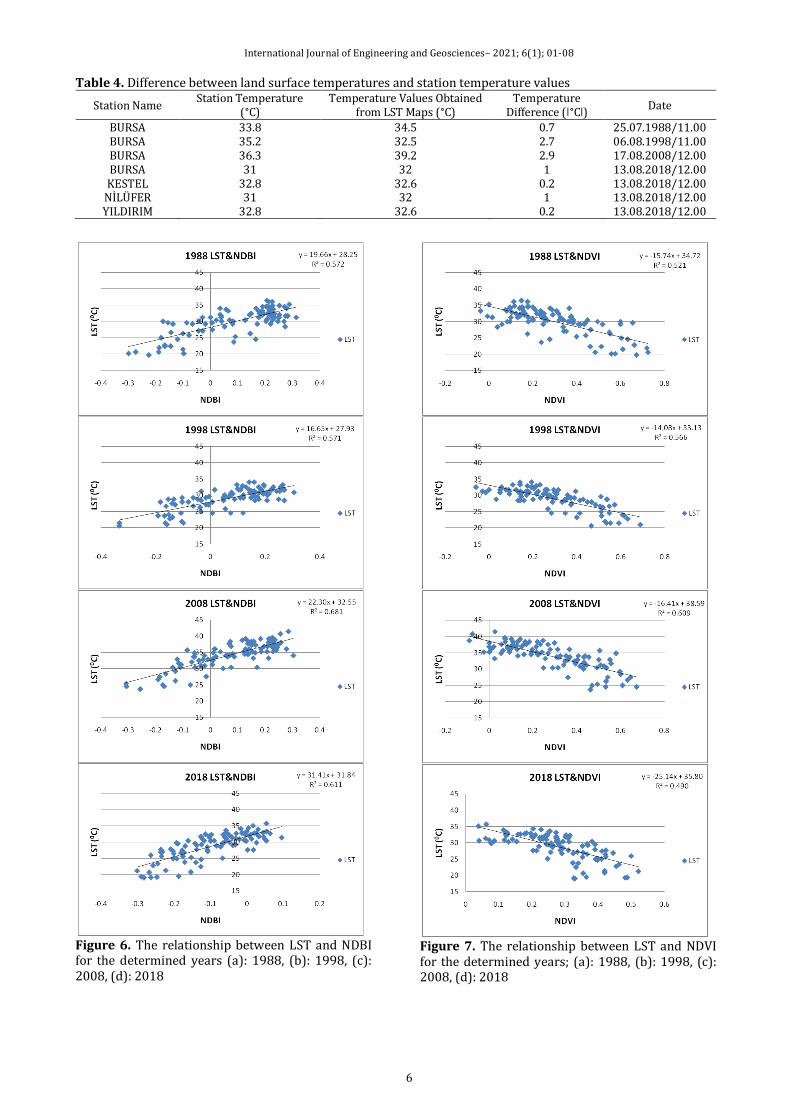
4.4 Relationship of Land Surface Temperature with NDBI and NDVI
Correlation analysis was used to investigate the relationship between land surface temperature, NDBI and NDVI. Correlation analysis was applied using randomly selected 100 points to Landsat 5 and Landsat 8 satellite images sensed on 1988, 1998, 2008 and 2018. Figure 6 and Figure 7 clearly show the correlation between land surface temperature with NDBI and NDVI. As a result, NDBI values were higher in areas with high land surface temperatures and NDVI values were higher in areas with lower land surface temperatures. Based on these results, the correlation analysis showed that the surface temperature of the land was in a high negative correlation with NDVI and high positive NDBI. The correlation coefficient between land surface temperature and NDBI was calculated as 0.75648 in 1988, 0.75579 in 1998, 0.82532 in 2008 and 0.78215 in 2018. The correlation coefficient between land surface temperature and NDVI was calculated as -0.72241 in 1988, -0.75256 in 1998, -0.78061 in 2008 and -0.70042 in 2018.
International Journal of Engineering and Geosciences– 2021; 6(1); 01-08
6
Table 4. Difference between land surface temperatures and station temperature values
Station Name Station Temperature
(°C) Temperature Values Obtained
from LST Maps (°C) Temperature
Difference (ǀ°Cǀ) Date
BURSA 33.8 34.5 0.7 25.07.1988/11.00 BURSA 35.2 32.5 2.7 06.08.1998/11.00 BURSA 36.3 39.2 2.9 17.08.2008/12.00 BURSA 31 32 1 13.08.2018/12.00 KESTEL 32.8 32.6 0.2 13.08.2018/12.00
NİLÜFER 31 32 1 13.08.2018/12.00 YILDIRIM 32.8 32.6 0.2 13.08.2018/12.00
Figure 6. The relationship between LST and NDBI for the determined years (a): 1988, (b): 1998, (c): 2008, (d): 2018
Figure 7. The relationship between LST and NDVI for the determined years; (a): 1988, (b): 1998, (c): 2008, (d): 2018

International Journal of Engineering and Geosciences– 2021; 6(1); 01-08
7
4.5 Calculation of Urban Heat Island Effect
The urban heat island effect of 1988, 1998, 2008 and 2018 was calculated for the study area (Figure 8). When the results are examined, it is determined that the urban heat island effect occurred mostly in the residential and industrial zone. At the same time, these areas where land surface temperature is high. The lowest urban heat island effect was observed in wetland and vegetation areas. Land surface temperature is low in these regions. Based on these observations, it can be said that the density of the residential area and the industrial area increased the surface temperature of the land and revealed the urban heat island concept.
5. CONCLUSION
Landsat 8 and Landsat 5 satellite images were used for long term observation of the study area. Near infra-red, red and thermal bands of Landsat images were used for the extraction of LST maps. Also, LU/LC maps were produced divided into 5 classes as urbanized area, vegetated area, water, cropland and bare soil to make a general evaluation of the study area. When LST maps were evaluated, it was observed that high-temperature values were observed in industrial areas, bare soil and reinforced concrete structures. Besides, low-temperature values have been found in plant areas, forest areas and wetlands. Also, when NDVI and NDBI are compared with LST, it is seen that there is a high positive correlation with NDBI and a high negative correlation with NDVI. It was determined that plant-covered areas could reduce the urban heat island effect because when urban density increased, the urban heat island effect increased. In some areas, there is an average temperature difference of 5-6 °C between the city center and the plant-covered areas, also up to 10 °C temperature differences were observed in urban areas which are changed by the density of urbanization. The reason for this difference is that urban heat island formation reflects its unique climate and temperature value. To reduce the impact of urban heat island effect, reducing the land surface temperature value is an indirect solution. The use of analytical analyses and spatial regression models is important for UHI research and provides a basis for better urban planning. As a result, rising temperatures in urban areas adversely affect human health, social, economic and environmental conditions. Due to low LST values are detected in areas where NDVI is high, conservation and increase of vegetation areas in urban centers can reduce urban heat island effect.
Acknowledgments
This article has been selected from the papers presented at the TUFUAB-2019 (10. Turkey National Photogrammetry and Remote Sensing Technical Symposium).
Figure 8. Urban heat islands for the determined years: (a): 1988, (b): 1998, (c): 2008, (d): 2018
REFERENCES
Aghayev A (2018). Determining of different inundated land use in Salyan Plain during 2010 the Kura River flood through GIS and remote sensing tools. International Journal of Engineering and Geosciences, 3(3), 80-86. DOI: 10.26833/ijeg.412348

International Journal of Engineering and Geosciences– 2021; 6(1); 01-08
8
Akher S K & Chattopadhyay S (2017). Impact of urbanization on land surface temperature-A case study of Kolkata New Town. The International Journal of Engineering Science, 6(1), 71-81. DOI: 10.9790/1813-0601027181
Avdan U & Jovanovska G (2016). Algorithm for automated mapping of land surface temperature using LANDSAT 8 Satellite data. Journal of Sensors. Doi: 10.1155/2016/1480307
Cicek I & Dogan U (2006). Detection of urban heat island in Ankara, Turkey. NuovoCimentodellaSocietaItaliana di Fisica. C, Geophysics and Space Physics; ISSN 1124-1896; Worldcat; v. 29C (4), 3 (1), 399-409.
Herbei M V, Dragomir L O & Oncia S (2012). Using satellite images LANDSAT TM for calculating normalized difference indexes for the landscape of Parang Mountains. RevCAD Journal of Geodesy and Cadastre, 13, 158-167.
Jimenez-Munoz J C, Sobrino J A, Gillespie A, Sabol D & Gustafson W T (2006). Improved land surface emissivities over agricultural areas using ASTER NDVI. Remote Sensing of Environment, 103(4), 474-487.
Khorrami B, Gunduz O, Patel N, Ghouzlane S & Najjar M (2019). Land surface temperature anomalies in response to changes in forest cover. International Journal of Engineering and Geosciences, 4 (3), 149-156. DOI: 10.26833/ijeg.549944
Kuşak L & Küçükali U F (2019). Outlier detection of land surface temperature: Küçükçekmece Region. International Journal of Engineering and Geosciences, 4 (1), 1-7. DOI: 10.26833/ijeg.404426
Ma Y, Kuang Y & Huang N (2010). Coupling urbanization analyses for studying urban thermal environment and its interplay with biophysical parameters based on TM/ETM+ imagery. International Journal of Applied Earth Observation and Geoinformation, 12(2), 110-118. Doi: 10.1016/j.jag.2009.12.002
Morabito M, Crisci A, Messeri A, Orlandini, Raschi A., Maracchi G & Munafo M (2016). The impact of built-up surfaces on land surface temperatures in Italian urban areas. Science of the Total Environment, 551-552, 317-326.
Ndossi M I & Avdan U (2016). Application of open source coding technologies in the production of land surface temperature (LST) maps from Landsat: a PyQGIS plugin. Remote sensing, 8(5), 413. Doi:10.3390/rs8050413
Orhan O, Dadaser-Celik F & Ekercin S. (2019). Investigating land surface temperature changes using Landsat-5 data and real-time infrared thermometer measurements at Konya Closed Basin in Turkey. International Journal of Engineering and Geosciences, 4(1), 16-27. DOI: 10.26833/ijeg.417151
Patil A S, Panhalkar S S, Bagwan S & Bansode S. (2018). Impact of land use land cover change on land surface temperature using Geoinformatics Techniques. International Journal of Research and Analytical Reviews (IJRAR), 5(4), 550-559.
Qin Z, Karnieli A & Berliner P (2001). A mono-window algorithm for retrieving land surface temperature from Landsat TM data and its application to the Israel-Egypt border region. International Journal of Remote Sensing, 22(18), 3719-3746.
Sekertekin A, Kutoglu S H & Kaya S (2016). Evaluation of spatio-temporal variability in land surface temperature: A case study of Zonguldak, Turkey. Environmental Monitoring and Assessment, 188(1), 30. Doi: 10.1007/s10661-015-5032-2
TUİK: URL: http://www.tuik.gov.tr/PreHaberBultenleri.do;jses
sionid=8FJDhyCWQJ1zgWYwrsLl31DbCfbhxRc56SbHK4rTJR1MrBSTvSC1!116535747?id=27587 Accessed date: 12 December 2019
Wang F, Qin Z, Song C, Tu L, Karnieli A & Zhao S (2015). An improved mono-window algorithm for land surface temperature retrieval from Landsat 8 thermal infrared sensor data. Remote sensing, 7(4), 4268-4289. Doi: 10.3390/rs70404268
Yüksel Ü D & Yilmaz O (2008). A study on determining and evaluating summertime urban heat islands in Ankara at regional and local scale utilizing remote sensing and meteorological data. Journal of the Faculty of Engineering and Architecture of Gazi University, 23(4), 937-952. (In Turkish)
© Author(s) 2021. This work is distributed under https://creativecommons.org/licenses/by-sa/4.0/