international conference on rural finance research: … · challenges and opportunities challenges...
TRANSCRIPT
1
Financing Coffee Farmers in Jimma Zone, Ethiopia: Financing Coffee Farmers in Jimma Zone, Ethiopia: Financing Coffee Farmers in Jimma Zone, Ethiopia: Financing Coffee Farmers in Jimma Zone, Ethiopia:
Challenges and OpportunitiesChallenges and OpportunitiesChallenges and OpportunitiesChallenges and Opportunities
by Anne Bastin and Nicola Matteucciby Anne Bastin and Nicola Matteucciby Anne Bastin and Nicola Matteucciby Anne Bastin and Nicola Matteucci
This paper was chosen through an open call for research in rural finance, whereby the selected
individuals were invited to Rome, Italy, to share their results during the conference and to discuss
key issues in shaping the rural finance research agenda as well as ways of strengthening the ties
between research, policy and practice.
International Conference on Rural Finance Research:
Moving Results into Policies and PracticeMoving Results into Policies and PracticeMoving Results into Policies and PracticeMoving Results into Policies and Practice
FAO Headquarters
Rome, Italy 19-21 March 2007
FINANCING COFFEE FARMERS IN ETHIOPIA:
CHALLENGES AND OPPORTUNITIES
Anne Bastin♣ and Nicola Matteucci∗
This version: January 2007
♣ Corresponding author. Chargée de Mission Microfinance, Lux Development, Luxembourg, Ph: +352 29 58 58 234, Fax: +352 29 58 58 200, [email protected] ∗ Assistant Professor in Applied Economics, Department of Management and Industrial Organization, Marche Polytechnic University, Italy.
Abstract
Notwithstanding the severe price shocks which have been shaking its value
chain, coffee remains a fundamental component of the Ethiopian economy
and export. Nevertheless the prolonged price decline has substantially
weakened its production basis and prospects, so that appropriate financial
services are urgently needed to sustain rural communities. Despite the
growing literature on microfinance, financial supply and demand of rural
communities remain issues largely unexplored. To address these issues, in
2005 we carried out an original survey interviewing 120 Ethiopian coffee
farmers; further, the statistical analysis was complemented by “focus group”
discussions and individual interviews with “key-experts” of the coffee value
chain. Several important findings emerge from this study. First, there is a
strong evidence of an overall gap between demand and supply of financial
services, across the different sources (formal and informal ones). Second,
existing financial services (loans) are too costly (except for the cases of
microfinance institutions and cooperatives) and often not tailored to the
farmers’ needs (in relation to timing, length and amounts). Concerning
saving products, their diffusion is still very limited, since they have been
recently introduced, but in the future they could become an important
component for strengthening the microfinance outreach; currently, they also
stand as a substitute for risk-insurance products, totally absent in the coffee
production chain. Regarding policy recommendations, the main priorities
appear those of enlarging the outreach of MFI and financially-active
cooperatives. More generally, a need emerges for demand-oriented financial
services and suitable “bottom-up” agricultural development and policy-
making.
2
1. INTRODUCTION1
Ethiopia is well known as the country of origin of “Buna” (coffee in Amharic), but also
as one of the poorest countries in the world, even when compared to sub-Saharan Africa
(SSA, henceforth): in 2004 Ethiopia has a GDP per capita of 114 US$ - the SSA average
being 731 US$ - cf. UNDP (2006). Coffee has been representing a considerable share of
Ethiopian economy and export. With the coffee price fall, begun in 1999, a substantial
portion of the population (mostly rural) witnessed another severe decrease of income,
which aggravated the poverty outcomes of previous crisis, natural (due to droughts, crop
disease) and institutional. As a result, despite the public efforts to modernize agriculture
and mobilize its surplus, Ethiopia is still far from getting adequate food supply.
In this context, development and public policy must acknowledge market and
institutional failures and intervene accordingly. Agricultural policy stands as the main
ingredient of any development strategy for Ethiopia; further, public network
infrastructure and services need to be intensively and extensively upgraded. However,
beside traditional instruments of intervention directed at the micro level of production
(agronomical techniques, land reforms), an original role could be played by microfinance,
directed at improving the financial side of a low productivity agriculture.
In order to investigate the demand and supply of financial services for coffee
producers, and to highlight the main areas of possible intervention, we carried out an
original survey, complemented by qualitative analysis (focus group meetings and
1 Anne Bastin would like to thank its supervisor Prof. Laura Viganò (State University of Bergamo) for invaluable guidance and support, and Dr. Wolday Amha (AEMFI), for advise and precious data on the subject. Sincere gratitude is expressed to Mr. Bekele Mosisa and its collaborators (FCE NGO, Jimma), for their precious logistic support during the field survey, and to all the professionals and institutions who equally helped: listing them entirely would be impossible here.
3
interviews with key informants); so, this work aims at filling an important gap existing in
the literature, studying microfinance in a sector fundamental for the country’s wealth.
The structure of the study is the following: in the second paragraph, we briefly
review some background of Ethiopia’ economy and coffee production. In the third
paragraph we illustrate the research methodology and the sample. Paragraph four presents
the main results of the analysis, identifying the weaknesses and the strengths of the
existing financial providers in meeting the demand of rural communities. Paragraph five
concludes, presenting a few policy implications.
2. BACKGROUND OF ETHIOPIA
General overview of the country
Ethiopia is a large and populous country (the second in SSA, with 70 millions
inhabitants), which in the past decades underwent a series of disastrous civil wars, border
crisis and radical institutional changes. From a past of quasi-feudal monarchy, in the
early-Seventies Ethiopia became a socialist state, with state ownership and government
control on the main economic activities – including nationalization and radical
agricultural reforms. With the collapse of the Derg regime (1991) and the victory of the
Ethiopian People’s Revolutionary Democratic Front (EPRDF henceforth), there has been
a new change in the economic structure and policy-making, from the previous centrally-
planned model to a more market-based one; in particular, in 1993, together with a huge
devaluation (over 50%) of the national currency, the system of price controls was
abolished and private entrepreneurship somehow encouraged. Together, with the new

4
Constitution (December 1994), the EPRDF moved to a decentralized structure of state
and government, with a federation of 9 regional states, with a strong ethnic identity.2
Notwithstanding its potential for agricultural development (see later), Ethiopia
remains a very poor and underdeveloped country: according to the UN Development
Report (2006), Ethiopia ranks 170th out of the 177 countries considered3. In fact, it
displays the typical features of underdevelopment: in 2004, life expectancy at birth is
only 42 years (46 the average of SSA), while 87% and 78% of its population lacks
sustainable access to, respectively, improved sanitation and water source; moreover, 46%
of the population results to be undernourished (cf. UNDP 2006; p. 308). Public
commitment to health (3.4% of GDP) and education (4.6%) - although above the SSA
average - remains highly insufficient face to the internal challenges, especially if it is
compared to the budget devoted to other areas; in particular, the health situation in
Ethiopia remains highly critical4.
The Ethiopian GDP and GDP per capita have recently exhibited a modest
recovery, starting from the mid-Nineties5; however, some components of this dynamics
(in primis export) appear highly volatile and sensitive to external shocks (cf. later). Table
1 shows that recently also gross investment recovered, despite the drop of domestic
2 More details can be found, for example, on Women’s World Banking (2005). 3 We recall that the UNDP Human Development Index (HDI) is a composite index measuring three main achievements: quality of life (as measured by life expectancy at birth), knowledge (adult literacy rate and gross enrolment at schools) and standard of living (GDP per capita in purchasing power parity - PPP of US$). Despite the multidimensionality of human development and the informative limits of every quantitative indicator, the HDI stands as a better alternative to other more simplistic measures of human well-being (such as GDP per capita). 4 An in-dept analysis of the relation between environment, economic activity, public policy and health in Ethiopia is developed in the last report of UNPD (2006). 5 Other data show that the annual growth rate of GDP per capita was negative over 1985-95, being equal to -1.9% per year; it became positive over the most recent period (1995-2005), equal to 1.6% (cf. World Bank, 2006a).
5
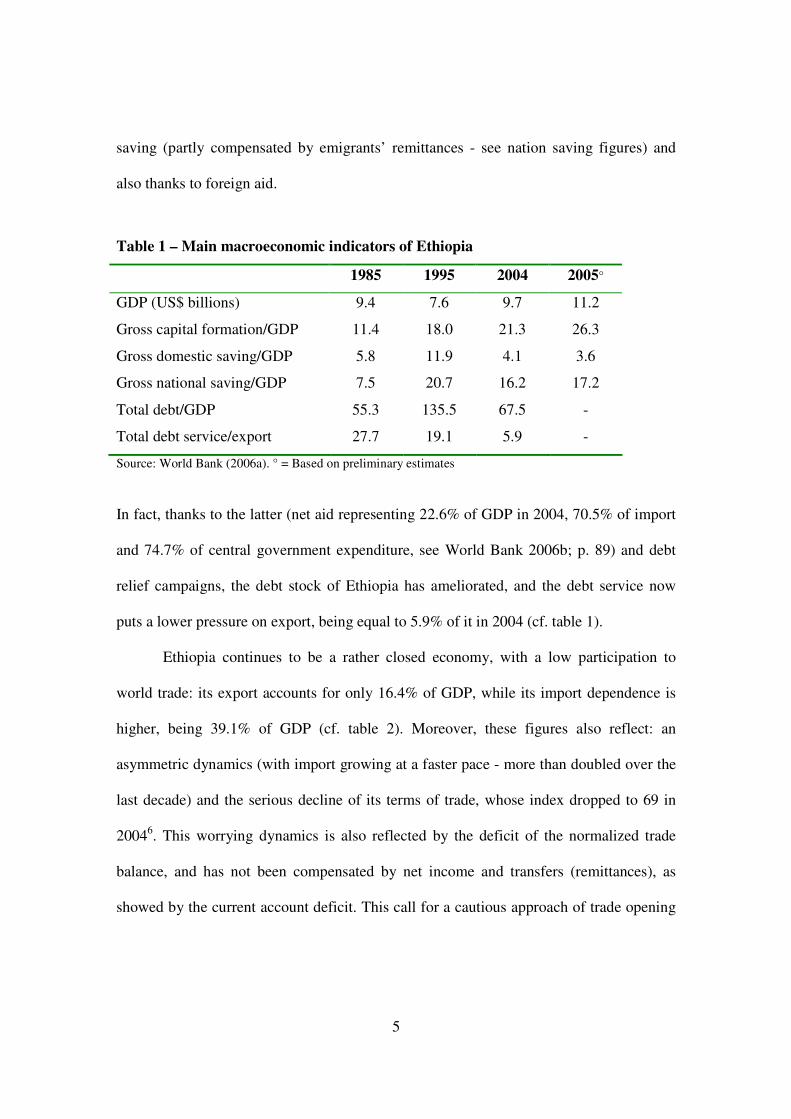
saving (partly compensated by emigrants’ remittances - see nation saving figures) and
also thanks to foreign aid.
Table 1 – Main macroeconomic indicators of Ethiopia
1985 1995 2004 2005°
GDP (US$ billions) 9.4 7.6 9.7 11.2
Gross capital formation/GDP 11.4 18.0 21.3 26.3
Gross domestic saving/GDP 5.8 11.9 4.1 3.6
Gross national saving/GDP 7.5 20.7 16.2 17.2
Total debt/GDP 55.3 135.5 67.5 -
Total debt service/export 27.7 19.1 5.9 -
Source: World Bank (2006a). ° = Based on preliminary estimates
In fact, thanks to the latter (net aid representing 22.6% of GDP in 2004, 70.5% of import
and 74.7% of central government expenditure, see World Bank 2006b; p. 89) and debt
relief campaigns, the debt stock of Ethiopia has ameliorated, and the debt service now
puts a lower pressure on export, being equal to 5.9% of it in 2004 (cf. table 1).
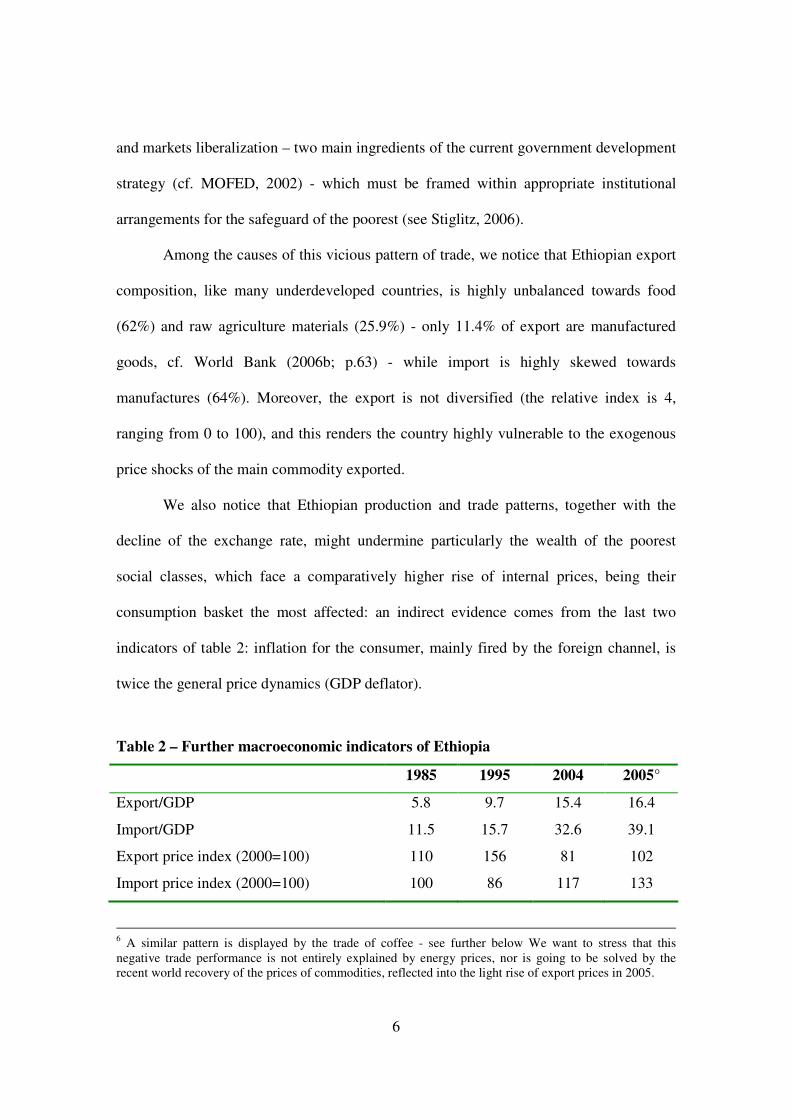
Ethiopia continues to be a rather closed economy, with a low participation to
world trade: its export accounts for only 16.4% of GDP, while its import dependence is
higher, being 39.1% of GDP (cf. table 2). Moreover, these figures also reflect: an
asymmetric dynamics (with import growing at a faster pace - more than doubled over the
last decade) and the serious decline of its terms of trade, whose index dropped to 69 in
20046. This worrying dynamics is also reflected by the deficit of the normalized trade
balance, and has not been compensated by net income and transfers (remittances), as
showed by the current account deficit. This call for a cautious approach of trade opening
6
and markets liberalization – two main ingredients of the current government development
strategy (cf. MOFED, 2002) - which must be framed within appropriate institutional
arrangements for the safeguard of the poorest (see Stiglitz, 2006).
Among the causes of this vicious pattern of trade, we notice that Ethiopian export
composition, like many underdeveloped countries, is highly unbalanced towards food
(62%) and raw agriculture materials (25.9%) - only 11.4% of export are manufactured
goods, cf. World Bank (2006b; p.63) - while import is highly skewed towards
manufactures (64%). Moreover, the export is not diversified (the relative index is 4,
ranging from 0 to 100), and this renders the country highly vulnerable to the exogenous
price shocks of the main commodity exported.
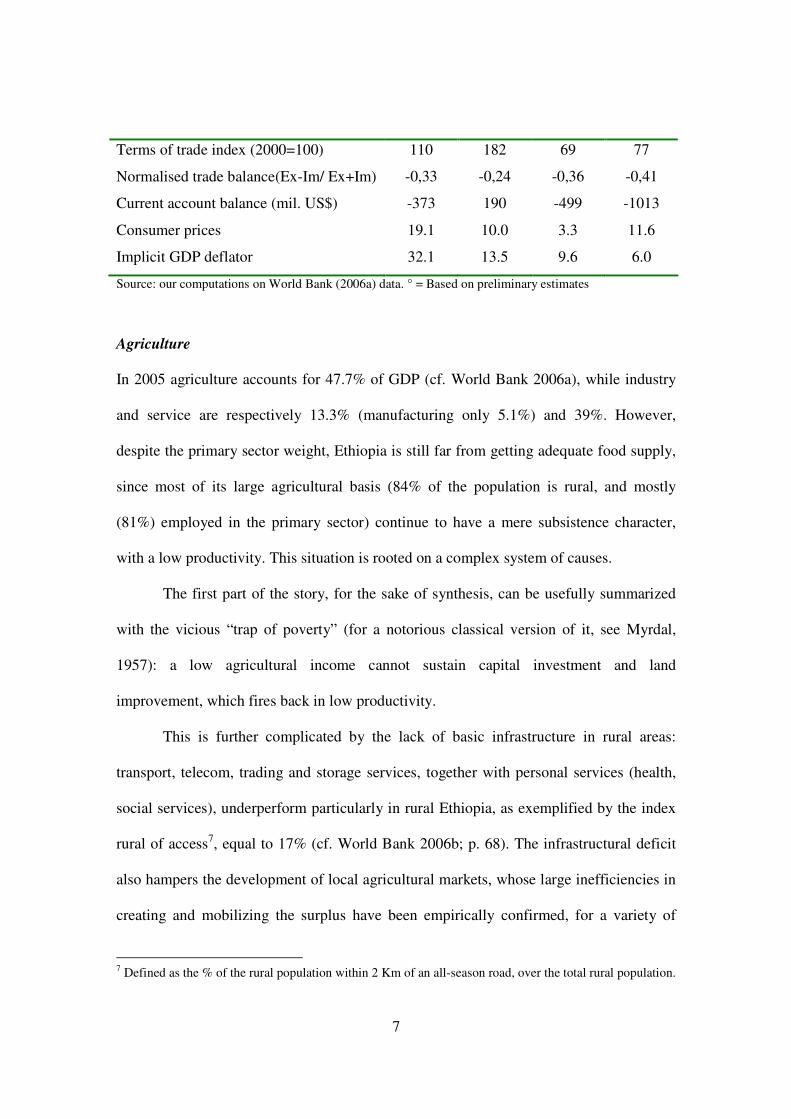
We also notice that Ethiopian production and trade patterns, together with the
decline of the exchange rate, might undermine particularly the wealth of the poorest
social classes, which face a comparatively higher rise of internal prices, being their
consumption basket the most affected: an indirect evidence comes from the last two
indicators of table 2: inflation for the consumer, mainly fired by the foreign channel, is
twice the general price dynamics (GDP deflator).
Table 2 – Further macroeconomic indicators of Ethiopia
1985 1995 2004 2005°
Export/GDP 5.8 9.7 15.4 16.4
Import/GDP 11.5 15.7 32.6 39.1
Export price index (2000=100) 110 156 81 102
Import price index (2000=100) 100 86 117 133
6 A similar pattern is displayed by the trade of coffee - see further below We want to stress that this negative trade performance is not entirely explained by energy prices, nor is going to be solved by the recent world recovery of the prices of commodities, reflected into the light rise of export prices in 2005.
7
Terms of trade index (2000=100) 110 182 69 77
Normalised trade balance(Ex-Im/ Ex+Im) -0,33 -0,24 -0,36 -0,41
Current account balance (mil. US$) -373 190 -499 -1013
Consumer prices 19.1 10.0 3.3 11.6
Implicit GDP deflator 32.1 13.5 9.6 6.0
Source: our computations on World Bank (2006a) data. ° = Based on preliminary estimates
Agriculture
In 2005 agriculture accounts for 47.7% of GDP (cf. World Bank 2006a), while industry
and service are respectively 13.3% (manufacturing only 5.1%) and 39%. However,
despite the primary sector weight, Ethiopia is still far from getting adequate food supply,
since most of its large agricultural basis (84% of the population is rural, and mostly
(81%) employed in the primary sector) continue to have a mere subsistence character,
with a low productivity. This situation is rooted on a complex system of causes.
The first part of the story, for the sake of synthesis, can be usefully summarized
with the vicious “trap of poverty” (for a notorious classical version of it, see Myrdal,
1957): a low agricultural income cannot sustain capital investment and land
improvement, which fires back in low productivity.
This is further complicated by the lack of basic infrastructure in rural areas:
transport, telecom, trading and storage services, together with personal services (health,
social services), underperform particularly in rural Ethiopia, as exemplified by the index
rural of access7, equal to 17% (cf. World Bank 2006b; p. 68). The infrastructural deficit
also hampers the development of local agricultural markets, whose large inefficiencies in
creating and mobilizing the surplus have been empirically confirmed, for a variety of
7 Defined as the % of the rural population within 2 Km of an all-season road, over the total rural population.
8
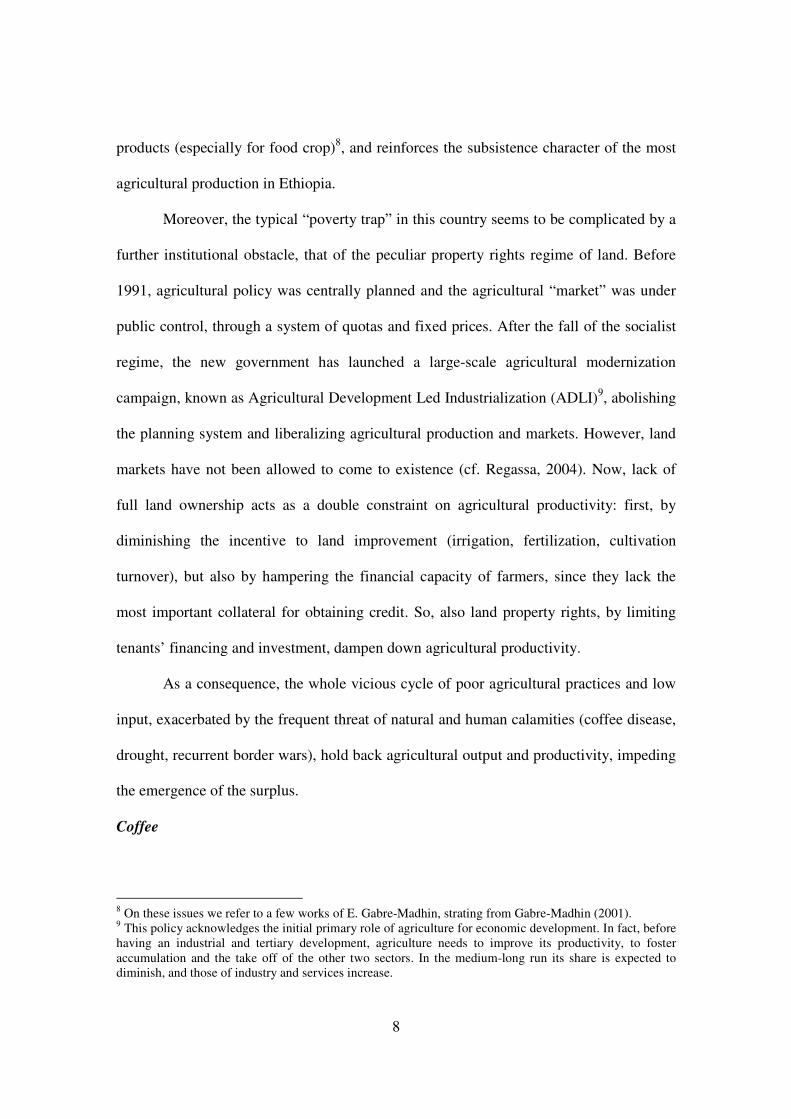
products (especially for food crop)8, and reinforces the subsistence character of the most
agricultural production in Ethiopia.
Moreover, the typical “poverty trap” in this country seems to be complicated by a
further institutional obstacle, that of the peculiar property rights regime of land. Before
1991, agricultural policy was centrally planned and the agricultural “market” was under
public control, through a system of quotas and fixed prices. After the fall of the socialist
regime, the new government has launched a large-scale agricultural modernization
campaign, known as Agricultural Development Led Industrialization (ADLI)9, abolishing
the planning system and liberalizing agricultural production and markets. However, land
markets have not been allowed to come to existence (cf. Regassa, 2004). Now, lack of
full land ownership acts as a double constraint on agricultural productivity: first, by
diminishing the incentive to land improvement (irrigation, fertilization, cultivation
turnover), but also by hampering the financial capacity of farmers, since they lack the
most important collateral for obtaining credit. So, also land property rights, by limiting
tenants’ financing and investment, dampen down agricultural productivity.
As a consequence, the whole vicious cycle of poor agricultural practices and low
input, exacerbated by the frequent threat of natural and human calamities (coffee disease,
drought, recurrent border wars), hold back agricultural output and productivity, impeding
the emergence of the surplus.
Coffee
8 On these issues we refer to a few works of E. Gabre-Madhin, strating from Gabre-Madhin (2001). 9 This policy acknowledges the initial primary role of agriculture for economic development. In fact, before having an industrial and tertiary development, agriculture needs to improve its productivity, to foster accumulation and the take off of the other two sectors. In the medium-long run its share is expected to diminish, and those of industry and services increase.
9
The word “coffee” comes from the region of Ethiopia where it was first discovered,
“Kaffa”, meaning “the land or plant of God”. Due to the large variety of genetically
different strains of coffe existing in Ethiopia (mostly Arabica10), botanists and scientists
agree that this country is the home-land and origin, for diversification and dissemination,
of the coffee plant (cf. Mekuria et al., 2004). Most of the coffee areas are located in
eastern, southern and southwestern Ethiopia.
Coffee as a cash crop has always been very important for the Ethiopian economy.
More than 10 million Ethiopians (no less than 15% of the population) belong to the
coffee value chain, directly or indirectly (processing, storage, trade and export).
Moreover, taxes collected on coffee export constitute a substantial portion of the state
revenue (cf. LMC International, 2000). During the peak of the price crisis (around 2001),
the country was detaining 3.6% of the world production, and exporting (mainly unwashed
Arabica coffee)11 a world share of 2.3% (11th in the world rank of exporters). Ethiopia is
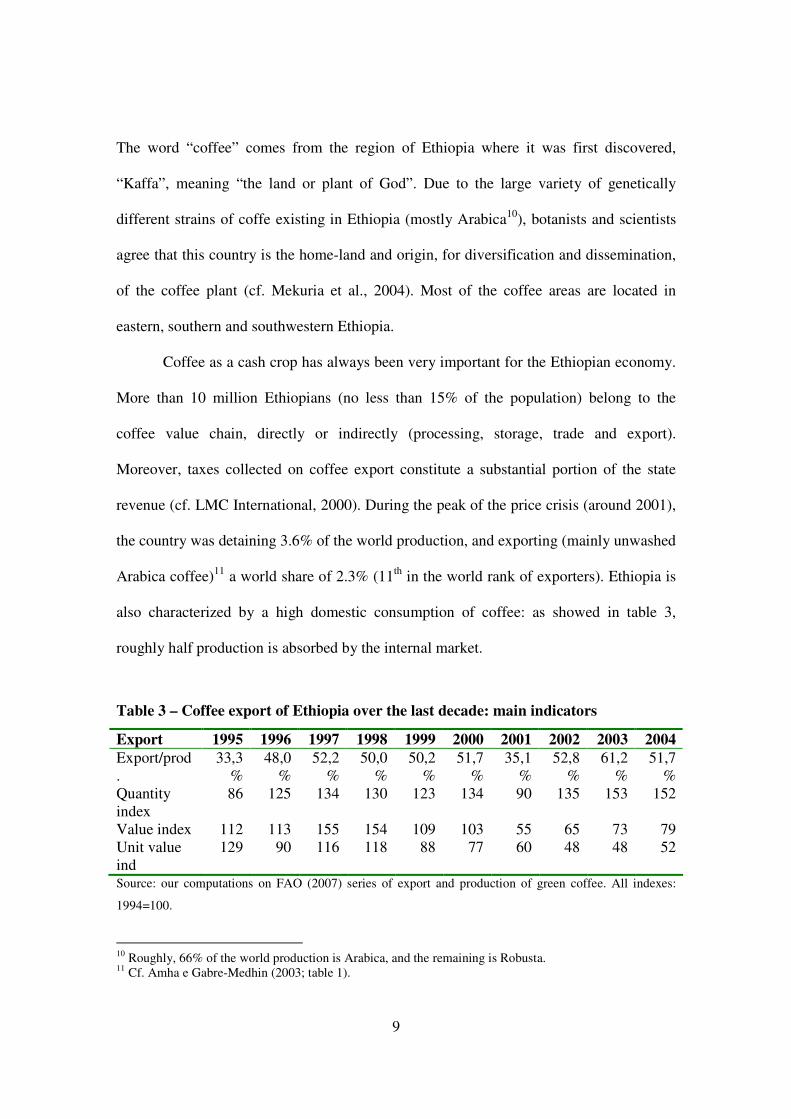
also characterized by a high domestic consumption of coffee: as showed in table 3,
roughly half production is absorbed by the internal market.
Table 3 – Coffee export of Ethiopia over the last decade: main indicators
Export 1995 1996 1997 1998 1999 2000 2001 2002 2003 2004
Export/prod.
33,3%
48,0%
52,2%
50,0%
50,2%
51,7%
35,1%
52,8%
61,2%
51,7%
Quantity index
86 125 134 130 123 134 90 135 153 152
Value index 112 113 155 154 109 103 55 65 73 79 Unit value ind
129 90 116 118 88 77 60 48 48 52
Source: our computations on FAO (2007) series of export and production of green coffee. All indexes:
1994=100.
10 Roughly, 66% of the world production is Arabica, and the remaining is Robusta. 11 Cf. Amha e Gabre-Medhin (2003; table 1).
10
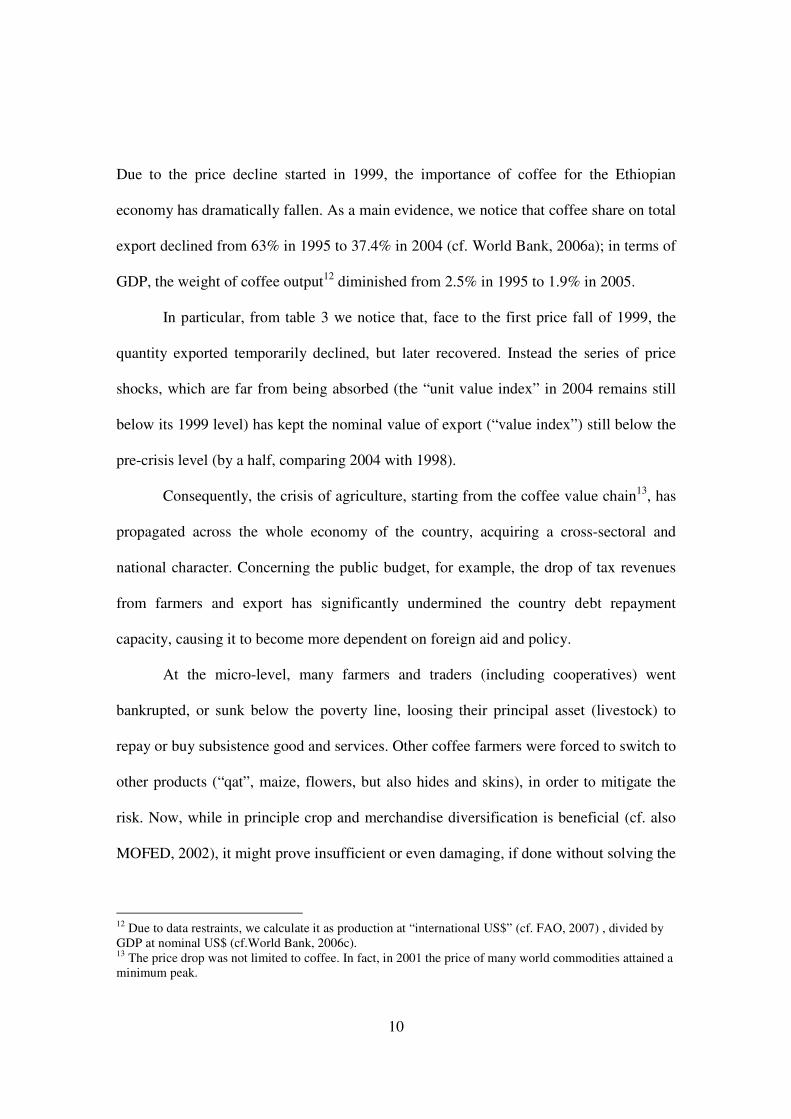
Due to the price decline started in 1999, the importance of coffee for the Ethiopian
economy has dramatically fallen. As a main evidence, we notice that coffee share on total
export declined from 63% in 1995 to 37.4% in 2004 (cf. World Bank, 2006a); in terms of
GDP, the weight of coffee output12 diminished from 2.5% in 1995 to 1.9% in 2005.
In particular, from table 3 we notice that, face to the first price fall of 1999, the
quantity exported temporarily declined, but later recovered. Instead the series of price
shocks, which are far from being absorbed (the “unit value index” in 2004 remains still
below its 1999 level) has kept the nominal value of export (“value index”) still below the
pre-crisis level (by a half, comparing 2004 with 1998).
Consequently, the crisis of agriculture, starting from the coffee value chain13, has
propagated across the whole economy of the country, acquiring a cross-sectoral and
national character. Concerning the public budget, for example, the drop of tax revenues
from farmers and export has significantly undermined the country debt repayment
capacity, causing it to become more dependent on foreign aid and policy.
At the micro-level, many farmers and traders (including cooperatives) went
bankrupted, or sunk below the poverty line, loosing their principal asset (livestock) to
repay or buy subsistence good and services. Other coffee farmers were forced to switch to
other products (“qat”, maize, flowers, but also hides and skins), in order to mitigate the
risk. Now, while in principle crop and merchandise diversification is beneficial (cf. also
MOFED, 2002), it might prove insufficient or even damaging, if done without solving the
12 Due to data restraints, we calculate it as production at “international US$” (cf. FAO, 2007) , divided by GDP at nominal US$ (cf.World Bank, 2006c). 13 The price drop was not limited to coffee. In fact, in 2001 the price of many world commodities attained a minimum peak.
11
structural problems at its basis; for example, production diversification might further
reduce the efficient division of labour and the size of the domestic agricultural markets.
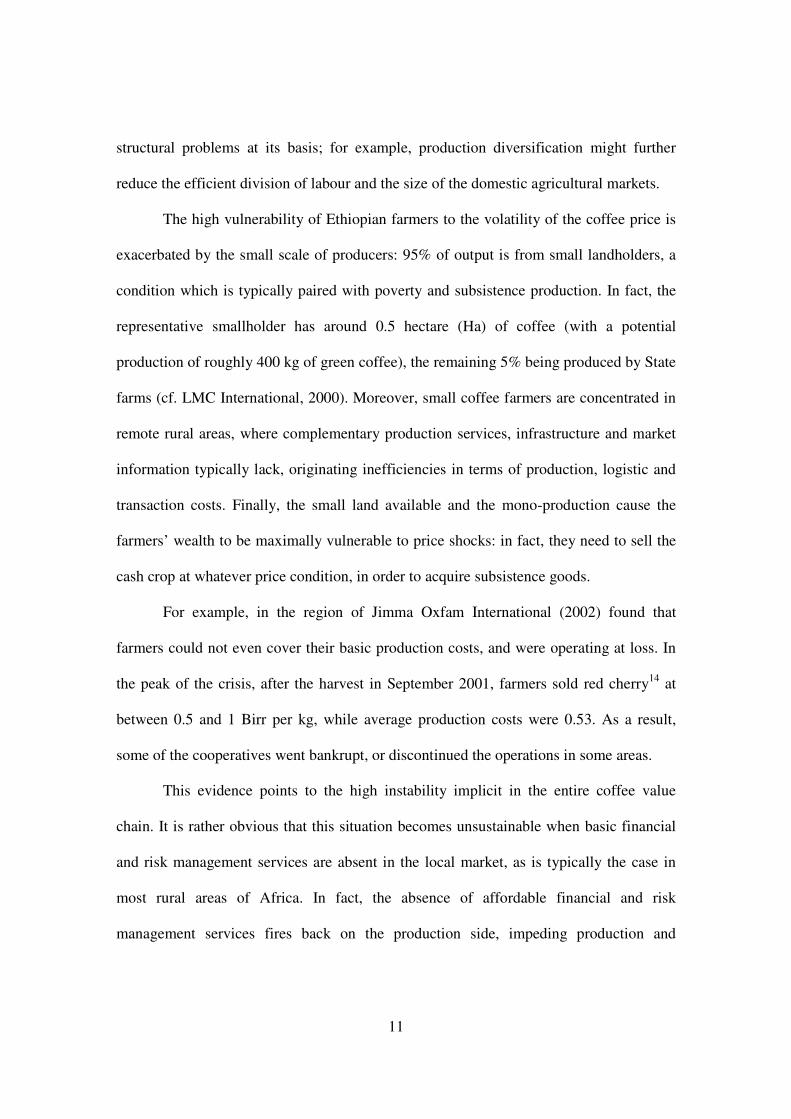
The high vulnerability of Ethiopian farmers to the volatility of the coffee price is
exacerbated by the small scale of producers: 95% of output is from small landholders, a
condition which is typically paired with poverty and subsistence production. In fact, the
representative smallholder has around 0.5 hectare (Ha) of coffee (with a potential
production of roughly 400 kg of green coffee), the remaining 5% being produced by State
farms (cf. LMC International, 2000). Moreover, small coffee farmers are concentrated in
remote rural areas, where complementary production services, infrastructure and market
information typically lack, originating inefficiencies in terms of production, logistic and
transaction costs. Finally, the small land available and the mono-production cause the
farmers’ wealth to be maximally vulnerable to price shocks: in fact, they need to sell the
cash crop at whatever price condition, in order to acquire subsistence goods.
For example, in the region of Jimma Oxfam International (2002) found that
farmers could not even cover their basic production costs, and were operating at loss. In
the peak of the crisis, after the harvest in September 2001, farmers sold red cherry14 at
between 0.5 and 1 Birr per kg, while average production costs were 0.53. As a result,
some of the cooperatives went bankrupt, or discontinued the operations in some areas.
This evidence points to the high instability implicit in the entire coffee value
chain. It is rather obvious that this situation becomes unsustainable when basic financial
and risk management services are absent in the local market, as is typically the case in
most rural areas of Africa. In fact, the absence of affordable financial and risk
management services fires back on the production side, impeding production and
12
complementary improvements (such as crop storage and strategic trade) along the coffee
chain, thereby lowering the creation of value added and the level of market power
detainable by the supply side.
In the extreme cases, frequently detected during our empirical study (see later),
because of the seasonal character of the crop and its the long productive cycle (every 3-5
years coffee trees need to be replanted), farmers need to rely on traditional borrowing
from traders and money lenders (highly costly); and this undermines their future financial
equilibrium and profitability.
Further, a series of coherent improvements on the terminal stages of the coffee
chain have been called (for example, cf. DTIS 2004; p.74 ss). The natural vocation of
Ethiopia as a high quality coffee produced need to be strategically sustained in terms of
branding and specific channel investment, since the basic organization of international
agricultural markets is not conducive to the price discrimination of differentiated product.
In this respect, the working of the traditional Ethiopian auction system15 prevent
exporters to stipulate long-term contacts with buyers, due to the ‘spot’ character and the
anonymity of the auction mechanism. These trading features are obviously incompatible
with the need to signal different quality levels of the merchandise, and to charge
correspondently. A similar reasoning apply to the investment needed to promote and
certify the Ethiopian potential in niche markets (organic, fair trade and ecological coffee).
Face to these big challenges, the need for a more developed and articulated financial
sphere is unequivocal.
Financial demand and supply: a role for microfinance
14 Fresh coffee grains. 1 kg of dry coffee is equivalent to 3 kg of red cherry.
13
Due to the rural location of Ethiopian farmers and to their wealth profile, there are good
reasons to believe that a strong demand exists for financial and insurance products among
small farmers, and that this demand is not adequately met. As a result, many coffee
farmers in several areas of Ethiopia should result credit rationed. The reasons for that are
rooted on traditional factors – typically affecting developing countries – and on
idiosyncratic factors – specific to Ethiopia.
Among the first, it is notorious that formal financial institutions avoid rural
customers, because of the high general risks, lack of collaterals, and high transactions
costs (the latter also due to very poor transport and telecom networks of the country).
Consequently, alternative credit programs aimed at improving rural households’ access to
formal credit have been developed in Ethiopia, the main example being the MFI industry
(cf. RUFIP, 2001, Assefa et al. 2005). Their working schemes differ from those of
traditional financial services, since they are better suited to deal with lack of collaterals
and low repaying rates, being more rooted on the local institutions, and having peculiar
enforcement mechanisms; for example, they rely on group lending schemes, which
contain more effective “peer-to-peer” monitoring. Moreover, despite the fact that
profitability remains an important step for achieving sustainability, they put a lower
emphasis on it: for example, lower profits for the MFI may be justified when more
benefits are transferred to MFI clients (cf. Otero, 1999).
As a result, access to microfinance may help in reducing cash flow problems for
the farmers, while being a highly accessible and low-cost alternative to more flexible
informal channels (such as money lenders, traders). Consequently microfinance, by
15 Until 1998, all coffee was traded through compulsory auction. Later, a few regulatory changes have gradually let some producer cooperatives to sell directly to foreign buyers.
14
reducing credit rationing, increase the farmers’ investment propensity and should stand as
a viable institution to promote agricultural productivity and income, while managing risks
efficiently16.
However, specific evidence on financial services available to the rural population
in Ethiopia - particularly in the coffee value chain - is scarce. Equally scarce is the
evidence on the new formal financial services, such as microfinance, and on the pros and
cons of it in addressing specific development challenges. In fact, after years of
microfinance diffusion and enthusiasms, the research agenda should now assess it with
respect to its performance – in particular in its potential to become a business model
viable “per se”, rather than merely donor-dependent (cfr. Murdoch, 1999).
A few studies focused already on rural communities, and they found that in
Ethiopia the majority of the population get access to financial services through informal
channels, such as money lenders, traders, friends or relatives, Iquib e Idir 17 (cf. Bezabih
et al., 2005). These studies, however, although considering the specificities of credit in
rural communities, did not examine them in relation to coffee production. Similar
conclusions on rural households rationing were presented in the IFAD-World Bank
(2001) study, which also indicates that in 1999, only a small amount of rural households
(some 4-5%) were served by MFI (34 % in Tigray, 5% in Amhara, 1% in Oromia and 3%
in the Southern Region).
While the challenges of serving rural producers remain generally high -
presumably in the case of small coffee farmers – nevertheless relevant opportunities
should exist for providing financial services to this huge segment of the Ethiopian
16 A comprehensive analysis focused on Asia is provided by Meyer e Nagarajan (2000).
15
population (84%). In fact, as of December 2004, the outreach of MFIs in Ethiopia was
still limited to 1 million persons18.
In what follows, we present an empirical analysis specifically aimed at these
issues, focusing on the demand and supply of new formal financial services – such as
those offered by microfinance - to coffee farmers. In particular, we test the extent of the
financial gap between demand and supply, and the characteristics of the initial
microfinance supply in rural Ethiopia. The policy ambition is to provide some first
evidence on the likelihood that microfinance may effectively heal the severe crisis
entrapping the Ethiopian coffee chain, thereby contributing to the relaunch of the
country’s projects of agricultural development.
3. THE SURVEY
Description of the study area
The survey was carried out in August 2005 in the Jimma Zone, belonging to the Oromia
Regional State, located at 335 km S-W of Addis Abeba (see map 1). The region has 12
administrative Zones and 180 woredas. In terms of both population and area, Oromia is
the largest Regional State in Ethiopia: its area spans over 367,000 sq.km (about 30% of
the total nation) and a population of more than 25 million inhabitants (35%); 88% of
Oromia population lives in rural areas, where the average household size is 5 persons.
34.6% of the Oromia population lives below the absolute poverty line. Agriculture
constitutes the mainstay of the economy, and is characterized by fragmented and
subsistence farming. The majority of the farmers depends on coffee: farmers producing
17 Iquib is a traditional ROSCA: Rotating Savings and Credit Association, while Idir is more like a traditional insurance scheme helping people facing the (expensive) funeral procedure. 18 Unpublished data collected by the authors from AEMFI, “MFI outreach growth in Ethiopia”.
16
“Arabica” coffee in the region are 424,309, and 95% of the production is done by small
farmers. The 85% of the coffee produced in the region is marketed raw: sun dried (or
unwashed) coffee.
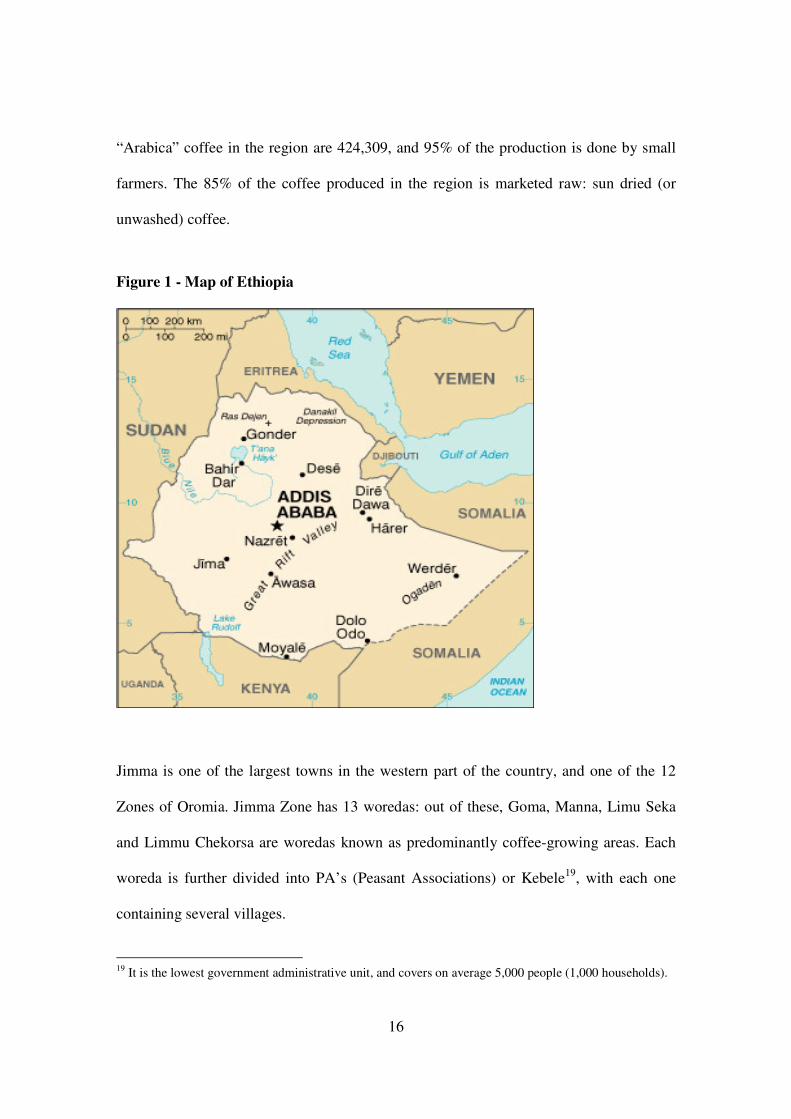
Figure 1 - Map of Ethiopia
Jimma is one of the largest towns in the western part of the country, and one of the 12
Zones of Oromia. Jimma Zone has 13 woredas: out of these, Goma, Manna, Limu Seka
and Limmu Chekorsa are woredas known as predominantly coffee-growing areas. Each
woreda is further divided into PA’s (Peasant Associations) or Kebele19, with each one
containing several villages.
19 It is the lowest government administrative unit, and covers on average 5,000 people (1,000 households).

17
Jimma town is the capital and administrative centre of the Zone, which encompasses
an area of 19,300 sq. km. Its population is around 2 millions, of which approximately 5%
lives in Jimma town. The transport network of the Zone is roughly two-fold: 644 km of
all weather roads and 447 km of dry weather roads. The Jimma Zone has large areas of
potentially cultivable and irrigable lands: in 1999/2000, about 45% of the total area was
arable (of which 30% was under cultivation). Out of the 13 woredas of Jimma, only 7
focus on coffee production; Goma and Mana, where the present study was conducted, are
two major growing coffee areas: here most of the coffee cultivated is forest coffee, at
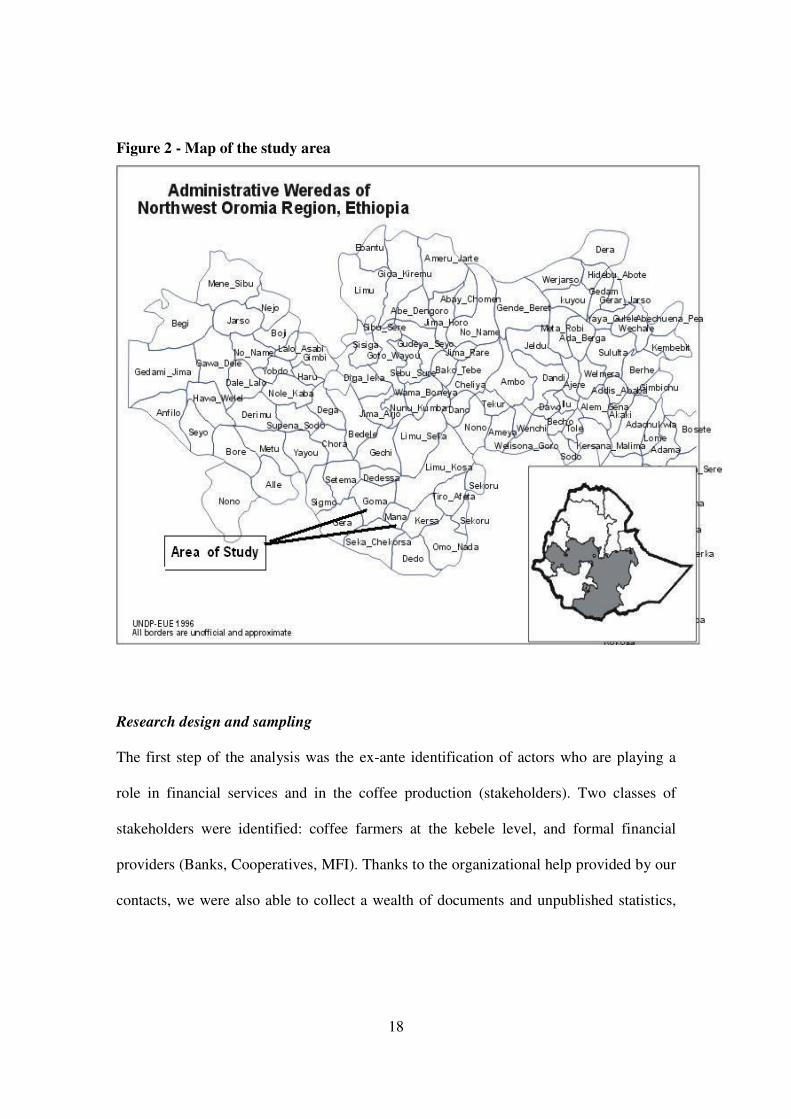
middle altitude of 1600-1700 m. (cf. figure 2, map of the study area).
18
Figure 2 - Map of the study area
Research design and sampling
The first step of the analysis was the ex-ante identification of actors who are playing a
role in financial services and in the coffee production (stakeholders). Two classes of
stakeholders were identified: coffee farmers at the kebele level, and formal financial
providers (Banks, Cooperatives, MFI). Thanks to the organizational help provided by our
contacts, we were also able to collect a wealth of documents and unpublished statistics,
19
and to organize “focus group” discussions and individual interviews with stakeholders
and keys experts of the coffee chain.
Stratified random sampling was used to build a representative sample for the
household coffee farmer survey. Primary information was gathered by interviewing 120
farmers, using semi-structured questionnaires (two types of questionnaires: one for the
farmers having already received financial services and a one for those who never had
before). Before starting the round of interviews20, the experimental questionnaire was
pre-tested on a small sample of farmers, and consequently adjusted to fit the local
situation.
After the survey, secondary complementary information was collected – also with
formal interviews - to map the financial sector and the organization of the Ethiopian
coffee markets21.
4. MAIN RESEARCH FINDINGS
We first present the basic characteristics of the sample. The group originally interviewed
was composed of 120 farmers; however, for the specific policy purposes of this analysis,
we decided to drop the smallest ones (those having less than 0.5 Ha of total land)22. This
choice reduces our final sample to 87 cases.
20 We would like to thank once again the NGO FCE (Facilitator for Change Ethiopia, Jimma), who provided us with enumerators and assistants for interviews and translation. 21 The list of subjects contacted/interviewed include (see glossary): the NBE, the CBE, the DBE, the RUFIP Program, the OCSSCO, the MOA, the MOARD, the EU CIP/MOARD program, the woreda administration offices of Goma and Mana, the AEMFI, the USAID, the Federal Cooperative Commission, the OCFCU and 4 primary cooperatives in Goma and Mana. Interesting information was also collected from Harbu MFI, Buusaa Gonofa MFI and FCE in Addis and Jimma. 22 Due to the limited size of their land, these farmers lie well below the threshold of poverty, and cannot be healed by ordinary development policy. Rather, they need straordinary and emergency assistence.

20
Being the size of land a fundamental individual characteristic (as the main
structural feature of production), influencing the financial and risk profile of rural
activities, farmers were first classified according to it: small farmers (those having
between 0,5-1 Ha of land), medium farmers (between 1-2 Ha), and big farmers -
presumably the wealthiest (between 2-6 Ha).
Our sample is mainly composed of males (88.5%): this does not come as a
surprise, given the social structure of rural Ethiopia and the fact that we interviewed the
household heads. Therefore, most of the few women interviewed were widows.
Table 4 - Level of education in the sample
n. (%)
None or sign only 43 49.4 Reading & writing 14 16.1 Primary school 22 25.3 Secondary school 8 9.2 Total 87 100.0 Source: Authors’ survey
Table 4 uncovers what is a well known stylized fact in development economics: rural
communities are mainly composed of illiterate people, while only a small percentage
carried out a proper curriculum of education. In more details, we see that almost 50% of
the sample is illiterate and only 9.2% of the farmers managed to attend a secondary
school level of education. Certainly, this level of education does not provide that basis of
human capital needed to face the production and trade challenges of the coffee chain.
Table 5: Background statistics
Mean Std. Dev. Median Min. Max.
Age (years) 46 10.7 45 25 73 Family size (persons) 7.2 2.8 7 2.0 14

21
Working people (persons) 5.4 2.3 5 0 14 Children below 5 y.o.(persons) 1.2 1.2 1 0 4 House-road distance (Km) 2 2.3 1 0 12 House-market distance (Km) 4.7 4 5 0 15 Size of land (Ha) 1.2 0.8 1 0.56 5.5 Coffee land (Ha) 0.6 0.5 0.5 0.07 3.2 (Other) crop land (Ha) 0.54 0.4 0.5 0 2.5 First activity income (% tot.) 70.7 13.8 70 40 100 Second activity income (% tot.) 21 9.7 20 0 50 Source: Authors’ survey
Table 5 brings a wealth of interesting information for framing the subsequent analysis.
First, age mean is 46, above the country’s life expectancy at birth (42 year for males, 45
for females), and the median is slightly below (45). So, we got the older share of the
population - and also this can be partly related to the patriarchal status of the Ethiopian
rural society. Second, the average family size is 7.2 persons, and the distribution is rather
concentrated around the mean (std. dev. 2.8)23. Most of the family components work (5.4,
and this often include the occasional participation of children formally at school). Our
rural sample was selected to be not “too remote”, i.e. reflecting a good index of rural
access, for a variety of reasons (logistics of the survey, but also theoretical reasons, such
as the likelihood of access to financial services): this is confirmed by the average distance
from the main road (2 Km, with a median of 1 Km), and from a rather close average
distance from the main (village) market (4.7 Km, with std. dev. 4). Concerning the land
size, the sample has an average of 1.2 Ha each24 (Min. 0.6, Max. 5.5), and this is in line
with the smallholder predominance of the Ethiopian universe. So, we are facing a very
traditional and small scale agricultural landscape, which is not conducive to the
23 Indirectly, we can also notice the larger family found in rural areas, since the average size for Oromia is around 5 persons, cf. Oromia Finance Economic Buro in Addis Ababa, August 2005 24 Again, with respect to the modal type of farmer in rural Ethiopia, our average land size is bigger. Although not chosen during the stratification, this structural feature of our sample make our analysis more
22
employment of intensive and mechanized techniques. However, given the residual
character of the cultivation of the other crop (maize - corn), mostly used for household
consumption, coffee represents a more that proportional share (precisely, 70.7%) of
farmers’ income, in a rather generalized way (median 70, std. dev. 13.8). Obvious, this
quasi mono-culture resulted to be very risky in those years when coffee prices dropped
dramatically in the region.
After this preliminary descriptive investigation, we go to the exam of the financial
behaviour of the sample. First, we investigate how farmers manage the different risks
faced during the year; second, we study the basic features of the credit market, and in
particular we investigate what are the existing financial instruments used in the Jimma
zone.
Risk Management
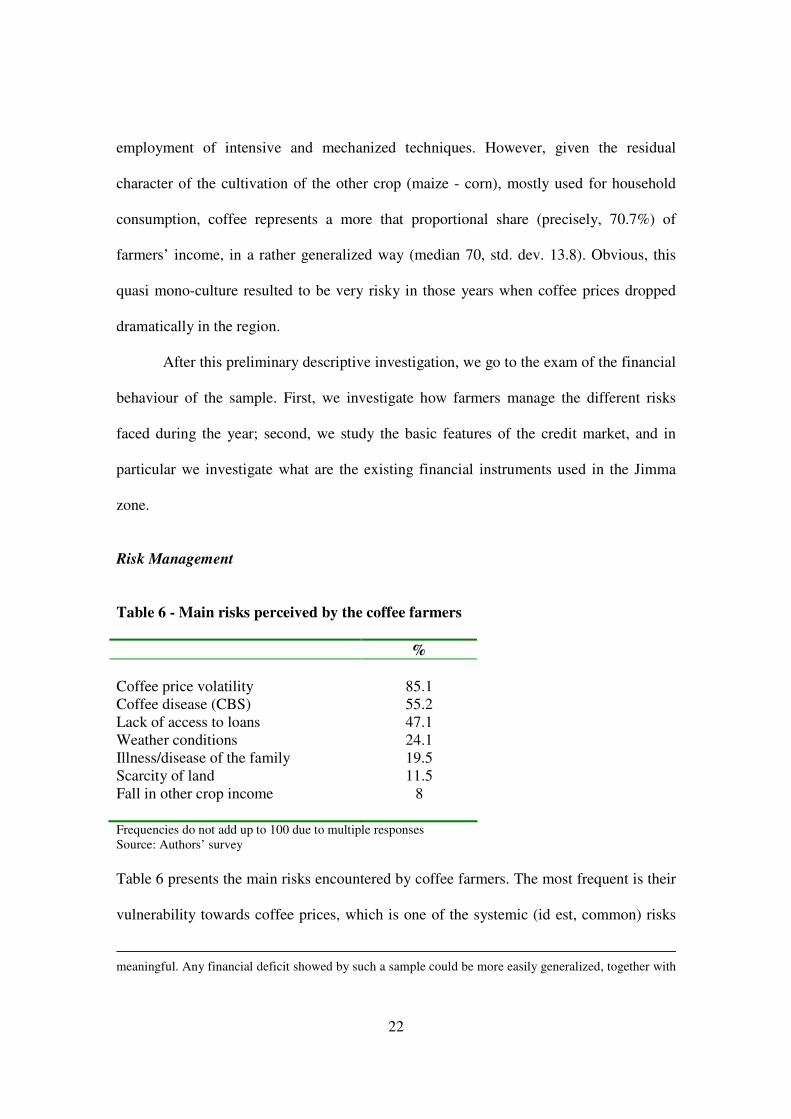
Table 6 - Main risks perceived by the coffee farmers
% Coffee price volatility 85.1 Coffee disease (CBS) 55.2 Lack of access to loans 47.1 Weather conditions 24.1 Illness/disease of the family 19.5 Scarcity of land 11.5 Fall in other crop income 8
Frequencies do not add up to 100 due to multiple responses Source: Authors’ survey
Table 6 presents the main risks encountered by coffee farmers. The most frequent is their
vulnerability towards coffee prices, which is one of the systemic (id est, common) risks
meaningful. Any financial deficit showed by such a sample could be more easily generalized, together with
23
affecting coffee producers25. Obviously, the living condition of coffee farmers is directly
linked with the pendulum of coffee prices. In particular, during the lean period, small
coffee farmers suffer from hunger26. The second risk is the CBS disease (Coffee Berry
Disease), also called “cholera” by local farmers27. Even if remedies are potentially
available, mainly through the Coffee Improvement Project (CIP) from the EU, a sizeable
portion of farmers has not benefited from the service yet; so, there is a high demand for
training on CBS. Moreover, more training is gradually needed as a growing number of
farmers switch to (higher quality) organic coffee, which excludes the use of fungicides.
The third systemic risk is the perceived lack of loans: although apparently inappropriate
as a risk, this occurrence is emblematic of the general permanent uncertainty which
characterizes rural activity, aggravated by the uncertainty in getting credit, mainly due to
lack of collaterals. A non negligible part, however, needs credit also to finance
subsistence good or services, such as in the case of illness (19,5%), frequently caused by
malaria; in fact, malaria typically appears during the rainy season (corresponding to the
lean period).
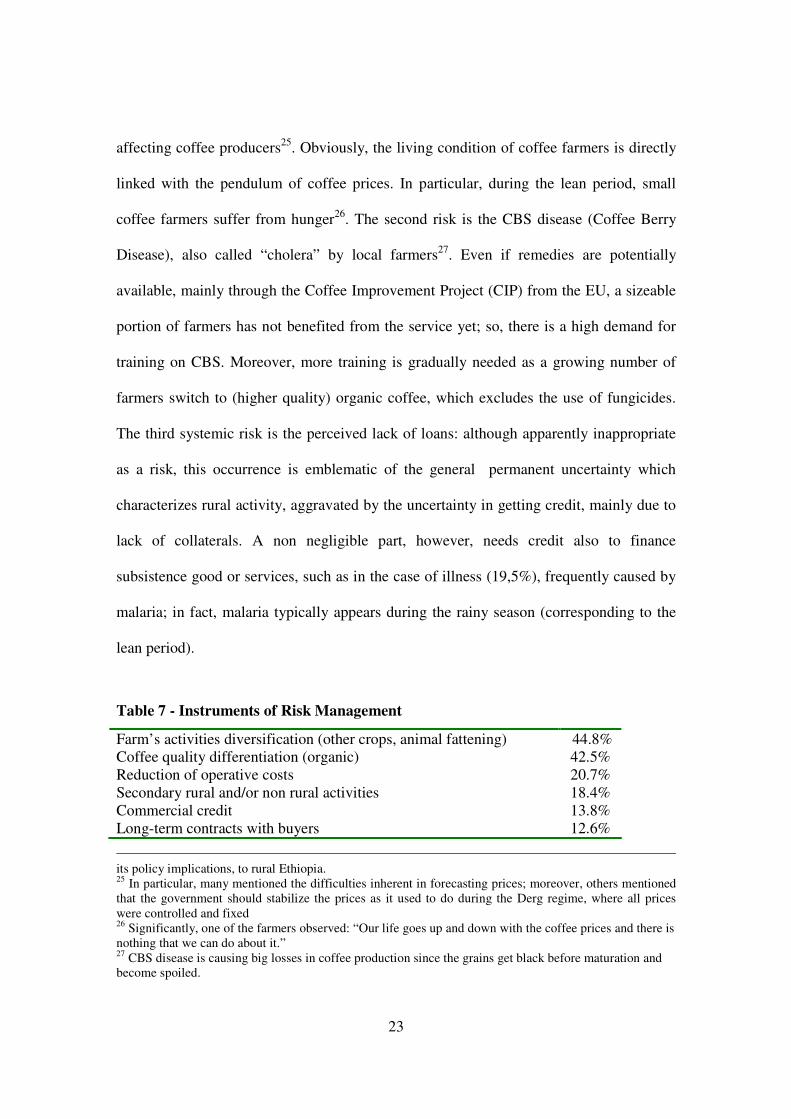
Table 7 - Instruments of Risk Management
Farm’s activities diversification (other crops, animal fattening) 44.8% Coffee quality differentiation (organic) 42.5% Reduction of operative costs 20.7% Secondary rural and/or non rural activities 18.4% Commercial credit 13.8% Long-term contracts with buyers 12.6%
its policy implications, to rural Ethiopia. 25 In particular, many mentioned the difficulties inherent in forecasting prices; moreover, others mentioned that the government should stabilize the prices as it used to do during the Derg regime, where all prices were controlled and fixed 26 Significantly, one of the farmers observed: “Our life goes up and down with the coffee prices and there is nothing that we can do about it.” 27 CBS disease is causing big losses in coffee production since the grains get black before maturation and become spoiled.
24
Saving 2.3% Frequencies do not add up to 100 due to multiple responses Source: Authors’ survey
Risk management strategies include income diversification and income skewing
activities, while risks coping mechanisms include self-protection instruments (such as
saving and credit) or informal network arrangements (with friends/relatives, or traditional
Ethiopian institutions like Iquib e Idir) (cfr. Dercon, 2002). Table 7 illustrates that in our
sample there is a clear prevalence of risk management strategies over risk coping
mechanisms: farm’s activities diversification (44.8%), coffee quality differentiation
(42.5%), reduction of operative costs (20.7%) and secondary production activities
(18.4%). Less frequently, a few risk coping strategies are also used, mainly commercial
credit (13.8%) and long term contracts with buyers (12.6%). Saving as a self-insurance
against risk is negligible, at least according to their answers; in fact, as we will see later,
their actual behaviour is different; although most farmers save, they do not perceive it as
a risk-coping strategy.
Going deeper, our sample let understand that the most diffused ways of risk
management are those which leverage on local knowledge and skills (i.e. production
diversification and reorganization), conditional on credit availability. In fact, as showed
later, income diversification is only possible to entrepreneurs getting MFI loans, since the
higher cost implied by informal sources (friends, money lenders, etc.), given the amount
necessary28, would be unbearable. Alternatively, there are production diversification
activities, like conversion to organic coffee, who are increasingly chosen due to the
partial public subsidization of the cost: in particular, our focus group discussions showed
28 For example, an ox costs around 800 Birr. Slightly cheaper is bee keeping, which is a good source of income in the region.
25
that the OCFCU and a few primary cooperatives are intensively involved on this issue,
together with local farmers.
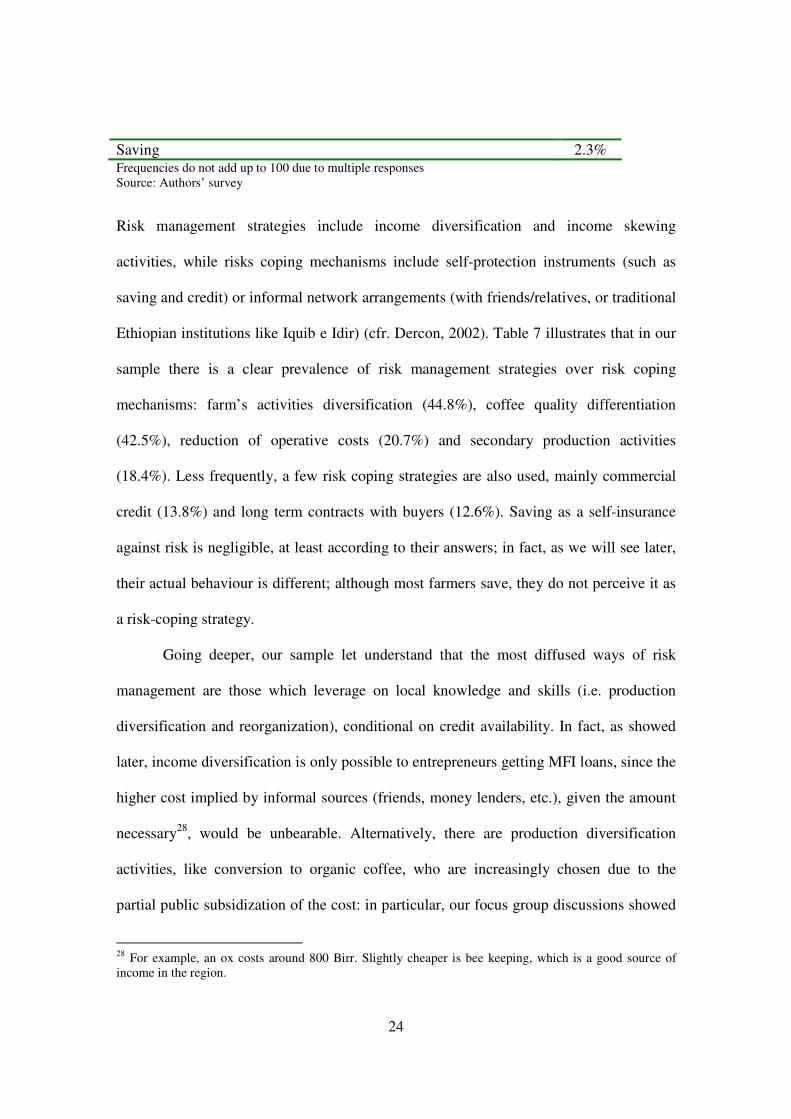
It is also interesting to analyze the main risks in relation with the size of land
cultivated, as in table 8 below. As expected, there is a certain negative relation between
risk perception and land size, whatever the risk considered: this is partly due to the
sample composition effect.
Table 8 – Main perceived risks by farmer size
Main risks Small Medium Big Row
total
Sample
incidence
(%) (%) (%) (%) (%) Volatility of Prices 54.1 39.2 6.8 100 85.05 Coffee Disease 54.2 39.6 6.3 100 55.2 Lack of access to FS 43.9 48.8 7.3 100 47.1 Weather Conditions 66.7 33.3 0 100 24.1 Illness disease in the family 52.9 23.5 23.5 100 19.5 Scarcity of land 70 20 10 100 11.5 Fall in other crop income 57.1 28.6 14.3 100 8 Multiple responses and row percentages. The last column refers to the risk incidence over the total sample (87 farmers). Source: Authors’ survey
In particular, focusing on the most perceived risks, small producers fear particularly
weather conditions, volatility of prices and coffee disease. Medium farmers, instead,
suffer comparatively more from lack of access to financial services - probably because
they have an effective demand which remain (partly) unsatisfied. Big farmers, instead,
register a comparatively higher occurrence of illness risk, which results to be more evenly
distributed across classes: after all, the healthcare situation in rural communities is rather
undifferentiated.
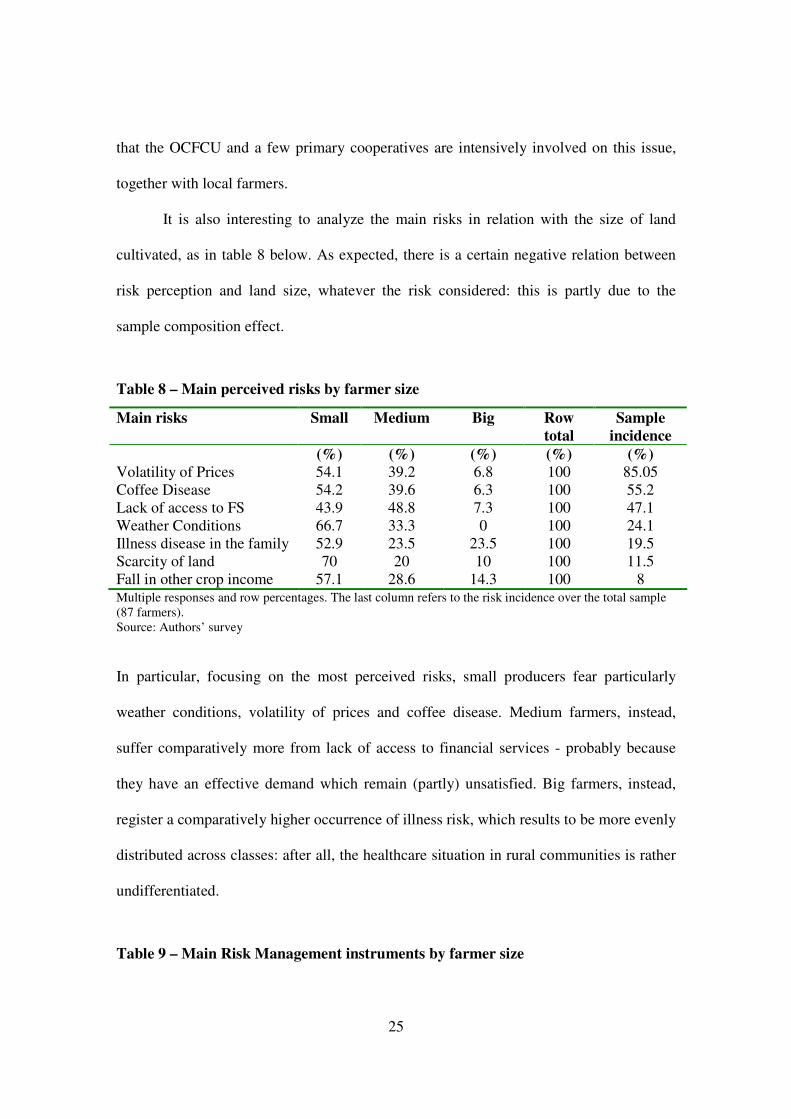
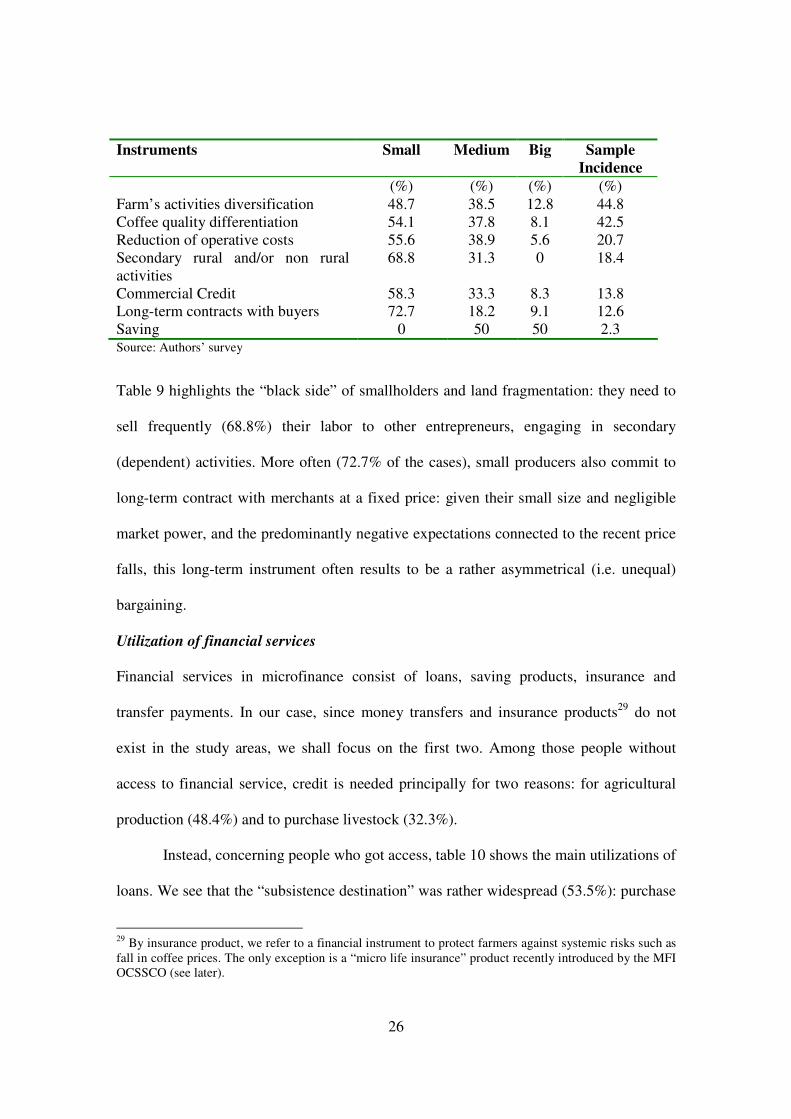
Table 9 – Main Risk Management instruments by farmer size
26
Instruments Small Medium Big Sample
Incidence
(%) (%) (%) (%) Farm’s activities diversification 48.7 38.5 12.8 44.8 Coffee quality differentiation 54.1 37.8 8.1 42.5 Reduction of operative costs 55.6 38.9 5.6 20.7 Secondary rural and/or non rural activities
68.8 31.3 0 18.4
Commercial Credit 58.3 33.3 8.3 13.8 Long-term contracts with buyers 72.7 18.2 9.1 12.6 Saving 0 50 50 2.3 Source: Authors’ survey
Table 9 highlights the “black side” of smallholders and land fragmentation: they need to
sell frequently (68.8%) their labor to other entrepreneurs, engaging in secondary
(dependent) activities. More often (72.7% of the cases), small producers also commit to
long-term contract with merchants at a fixed price: given their small size and negligible
market power, and the predominantly negative expectations connected to the recent price
falls, this long-term instrument often results to be a rather asymmetrical (i.e. unequal)
bargaining.
Utilization of financial services
Financial services in microfinance consist of loans, saving products, insurance and
transfer payments. In our case, since money transfers and insurance products29 do not
exist in the study areas, we shall focus on the first two. Among those people without
access to financial service, credit is needed principally for two reasons: for agricultural
production (48.4%) and to purchase livestock (32.3%).
Instead, concerning people who got access, table 10 shows the main utilizations of
loans. We see that the “subsistence destination” was rather widespread (53.5%): purchase
29 By insurance product, we refer to a financial instrument to protect farmers against systemic risks such as fall in coffee prices. The only exception is a “micro life insurance” product recently introduced by the MFI OCSSCO (see later).

27
of food, but also clothes, children education and house construction. At the second
position stands product diversification (32.1%), while coffee-related production activities
rank third (14.3%). Although the period in which the survey was conducted might have
somehow30 increased the “subsistence use” frequency, we believe that there is a more
structural explanation for it – the prolonged crisis affecting the rural population – which
explains why the majority of the financed farmers did not invest on coffee production or
land improvement techniques.
Table 10 - Use of loans granted to coffee farmers
n° %
Coffee inputs 8 14.3 Consumption, house expenditures, etc. 30 53.5 Other productions (trading, animal fattening, other crops)
18 32.1
Total 56 100 Source: Authors’ survey
Access to financial services: loans
Almost two thirds of the sample (64.4%) got access to financial services in the past, while
the remaining part (35.6%) lacked any source of credit, although most tried to get credit
(54.8%)31. Moreover, for those who did not even try, the answers depict a framework of
lack of supply of financial services in the local area, self-rationing and poverty-trap32.
So, the overall picture leads to conclude that almost the entire sample did have a
potential demand for financial services: the majority was served, while the remaining
30 Since coffee picking usually takes place between September and January and coincides with food crops harvesting, there is a lack of cash and food particularly from June to September (lean period, when the survey was conducted).
28
share (still substantial) was unsuccessful for a variety of reasons: regarding the lender (for
example, its temporary inability to lend), the borrower (not meeting the income or
collateral conditions to get credit) or both (distance or other transaction costs).
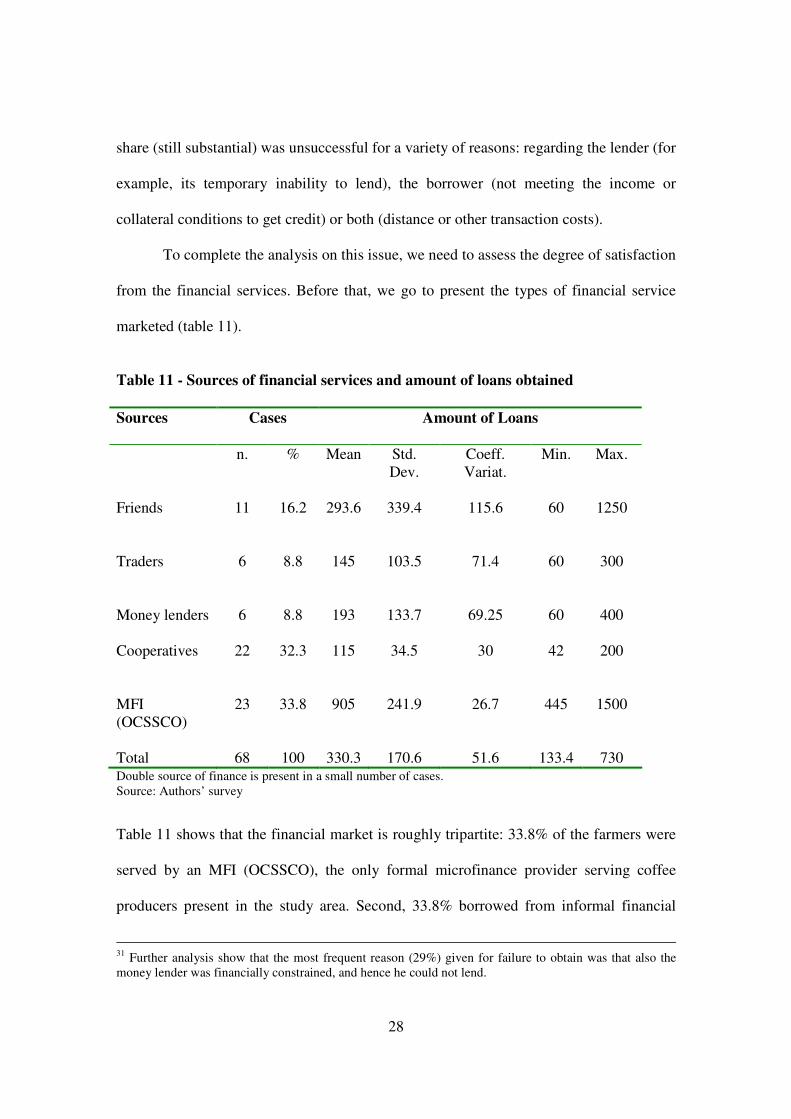
To complete the analysis on this issue, we need to assess the degree of satisfaction
from the financial services. Before that, we go to present the types of financial service
marketed (table 11).
Table 11 - Sources of financial services and amount of loans obtained
Sources Cases Amount of Loans
n. % Mean Std. Dev.
Coeff. Variat.
Min. Max.
Friends
11
16.2
293.6
339.4
115.6
60
1250
Traders
6
8.8
145
103.5
71.4
60
300
Money lenders
6
8.8
193
133.7
69.25
60
400
Cooperatives
22
32.3
115
34.5
30
42
200
MFI (OCSSCO)
23
33.8
905
241.9
26.7
445
1500
Total
68
100
330.3
170.6
51.6
133.4
730
Double source of finance is present in a small number of cases. Source: Authors’ survey
Table 11 shows that the financial market is roughly tripartite: 33.8% of the farmers were
served by an MFI (OCSSCO), the only formal microfinance provider serving coffee
producers present in the study area. Second, 33.8% borrowed from informal financial
31 Further analysis show that the most frequent reason (29%) given for failure to obtain was that also the money lender was financially constrained, and hence he could not lend.
29
providers: friends (16.2%), money lenders (8.8%) and traders (8.8%). Finally, primary
cooperatives, with 32.3%.
If the proportion of the clients served by the MFI and the informal sector is
practically identical, the average loan from the MFI was substantially higher, being 905
ETB33, against the 210.5 ETB offered by the informal sector. Finally, 115 ETB is the
average loan lent by our cooperative34. Moreover, the dispersion around the mean of the
MFI loan amount is rather small with respect to that of money lenders and traders (cf. the
coefficient of variation): this indicates that the credit chances offered by MFI are higher
in quantity and relatively less unequal among borrowers. Finally, friends seem to offer a
good opportunity for credit, but they appear on average a source internally differentiated
(highly dispersed) which may not be often available, being highly dependent on the own
local context and human relations network.
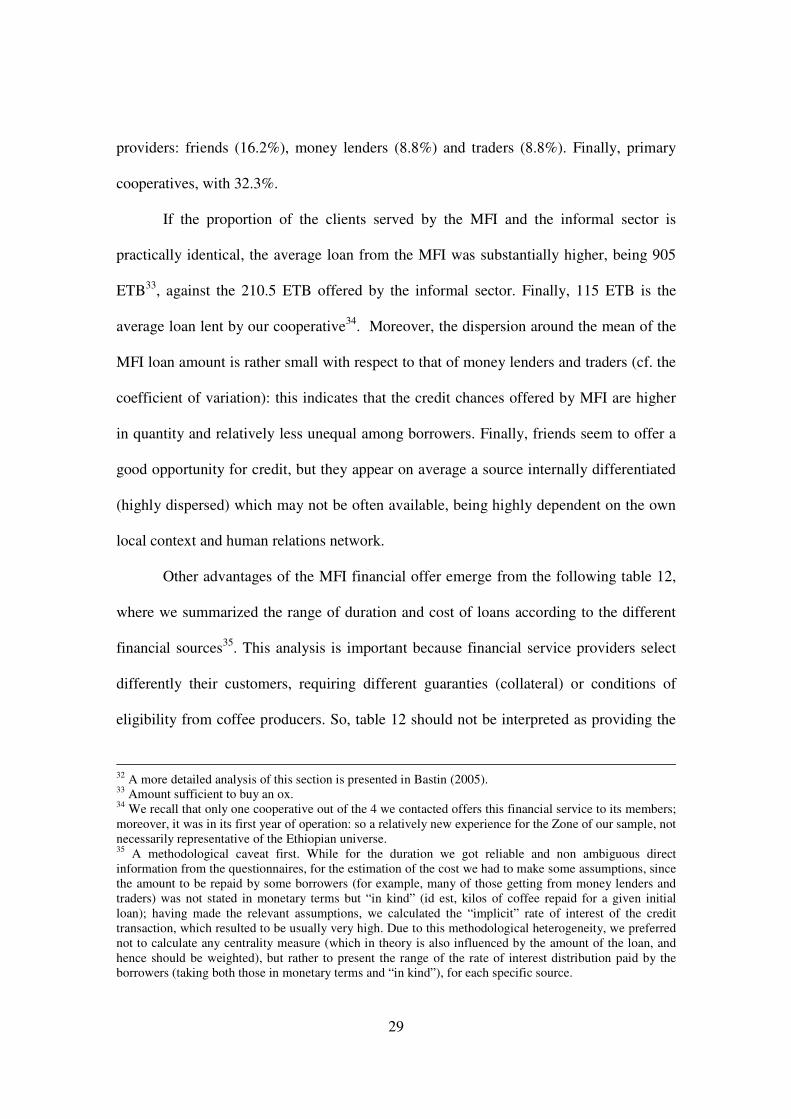
Other advantages of the MFI financial offer emerge from the following table 12,
where we summarized the range of duration and cost of loans according to the different
financial sources35. This analysis is important because financial service providers select
differently their customers, requiring different guaranties (collateral) or conditions of
eligibility from coffee producers. So, table 12 should not be interpreted as providing the
32 A more detailed analysis of this section is presented in Bastin (2005). 33 Amount sufficient to buy an ox. 34 We recall that only one cooperative out of the 4 we contacted offers this financial service to its members; moreover, it was in its first year of operation: so a relatively new experience for the Zone of our sample, not necessarily representative of the Ethiopian universe. 35 A methodological caveat first. While for the duration we got reliable and non ambiguous direct information from the questionnaires, for the estimation of the cost we had to make some assumptions, since the amount to be repaid by some borrowers (for example, many of those getting from money lenders and traders) was not stated in monetary terms but “in kind” (id est, kilos of coffee repaid for a given initial loan); having made the relevant assumptions, we calculated the “implicit” rate of interest of the credit transaction, which resulted to be usually very high. Due to this methodological heterogeneity, we preferred not to calculate any centrality measure (which in theory is also influenced by the amount of the loan, and hence should be weighted), but rather to present the range of the rate of interest distribution paid by the borrowers (taking both those in monetary terms and “in kind”), for each specific source.
30
whole range of possibilities for a potential borrower, but rather the different
characteristics of the offers designed by the lender, which most of the time acts in a
context of quasi-monopoly. Looking at the duration we uncover relevant differences.
First, it is showed that the longest period of duration is given by MFI (12 months
maximum), which also possesses the highest minimum duration (6 months). Friends offer
in theory the second-best alternative for duration, better than traders and money lenders.
Cooperatives, instead, offer small-term loans.
Table 12 - Duration and cost of loans according to the sources of FS
Source Duration (months) Annual interest rate (%)
Min. Max. Min. Max. Friends 2 12 0 120 Traders 5 8 200 660 Money lenders 5 7 120 171 Cooperatives 3 6 0 0 MFI (OCSSCO) 6 12 11.5 11.5 Source: Authors’ survey
Things change greatly when we go to analyze the underlying cost conditions. For
example, the MFI charges a very reasonable rate of interest. While for the minimum rate
their offer is surpassed by that of friends (most of the time zero) and that of cooperatives,
MFI stand as the cheapest concerning the maximum rate of interest (excluding
cooperatives). However, the eligibility criteria for MFI loans are rather selective and
cannot finance items other than agricultural production, livestock or similar (in general,
loans are given for income generating activities, while consumption is excluded).
Moreover, there are also restricted time periods of eligibility: usually, loans are offered
during selected months (January-February in our sample). Further, loans are only given
jointly to a group of borrowers: while the leader of the group acts externally as an
instrument for the reduction of asymmetric information (and transaction costs), the role of

31
the group is that of peer-to-peer monitoring. It is clear that the MFI wants to be protected
from the risk of bad or non-repayment from the coffee producers, who are especially
vulnerable during the months of June-August36. Clearly, the strictness of the eligibility
criteria and the monitoring mechanisms in place yield a negligible rate of overdue loans
for MFI, which can sets in return very reasonable rates of interest.
Cooperatives (we have just one “financial” cooperative in the sample37) offer rates
of interest even cheaper than MFI: in our case the rate charged was zero, together with a
low administration or membership fee. However, they strictly select the borrowers (who
need to sell coffee to the cooperative to be eligible for credit, getting sometimes a lower
price for coffee with respect to alternative trading channels) and give only credits of
small amount, conditional on the past behavior of the potential borrower.
Borrowing from friend is also very cheap in the majority of cases (9 over 11 cases
show a rate of zero), while in the remaining cases the rate of interest charged is non-
negligible (up to a maximum of 120% per year – presumably “bad friends”).
The more flexible and accessible credit channels result to be that of money
lenders and traders, which however charge outrageously high (definitely unsustainable!)
interest rates, even though their funds can be freely used also for non-productive reasons.
However, we need to realize that most of the time this freedom of choice is only
apparent, being these borrowers affected by highly urgent personal needs (serious health
36 Indeed, during the years of fall in prices, the repayment rate of MFI dropped to 30%. This put a great danger to the sustainability of the institution, which needed to stop disbursing loans for a while. 37 Access to funds and zero interest rates are reserved to cooperative members, who repay the cash amount in kind just after harvest at the current market price. In general the principal function of the primary cooperatives is strictly agricultural: with the support of the Union (higher level cooperative), they are mainly concerned with production and marketing issues. They have just started to provide loans to their members in 2005 to help the coffee producers to cope with the difficulties of the lean season of July-August. Their financial role is likely to remain small, since they do not have either technical knowledge or preferential access to credit funds; in this Zone, they also carry bad losses from the past.
32
problems or mere subsistence), which do not permit to wait longer to be satisfied. In a
sense, this credit relationship is highly risky for both parties: credit lenders select the
most risky portion of the credit demand rationed by the other channels, often without
collateral, and need to fix a high rate and a short repayment period to compensate for the
higher rate of overdue loans; on the other side, these borrowers select the most costly and
risky offer, which is likely to unbalance even further their precarious financial situation in
the near future. Most of the times, the highest rates of interest (hundreds of percent
points!) were found when the loan is returned “in kind”. This phenomenon can be
interpreted with different explanations. A first one could be simply that of a big
unbalance between demand and supply of funds, especially likely during the lean period:
a partial support comes from the fact that most of the loans borrowed from the informal
lenders and the cooperatives were requested in June-July. However, we could also think
that money lenders and particularly traders, who are the big coffee merchants, ask a
premium for risk on loans repaid in kind, since in this case they bear the risk of a sudden
fall in prices (the quantity of coffee to be repaid is in fact stated at the beginning of the
period): however, given the interest rate demanded, the risk premium rationale can justify
only a small portion of the excess rate demanded. Perhaps, a further explanation is to be
found also on asymmetries of information and on a certain kind of “computation
illusion”, which affects the farmer when the repayment is in kind38.
It is rather obvious to conclude that, by paying such outrageous interest rates, with
a low productivity activity like traditional coffee farming, informal credit might well
undermine small farmers, rather than helping them to get out of the poverty trap.
38 Again, the main inference for that comes from the fact that interest rates calculated on loans repaid in monetary terms are sensibly lower that those repaid “in kind”.
33
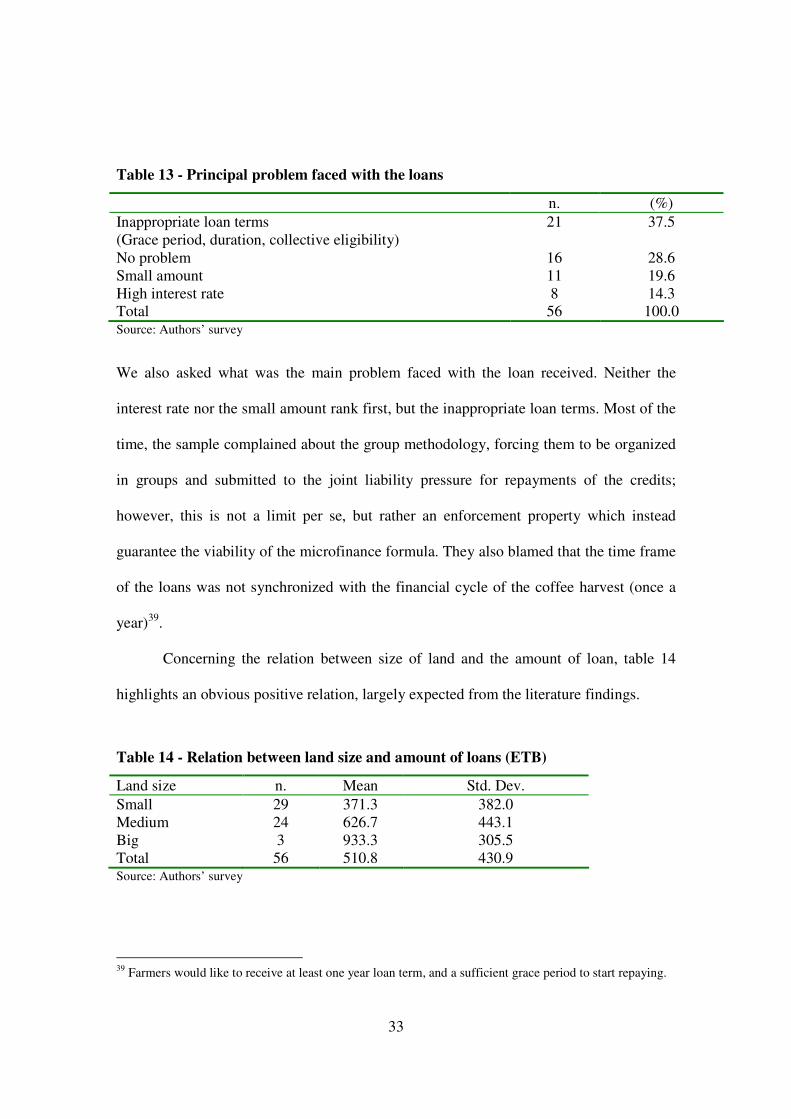
Table 13 - Principal problem faced with the loans
n. (%)
Inappropriate loan terms (Grace period, duration, collective eligibility)
21 37.5
No problem 16 28.6 Small amount 11 19.6 High interest rate 8 14.3 Total 56 100.0 Source: Authors’ survey
We also asked what was the main problem faced with the loan received. Neither the
interest rate nor the small amount rank first, but the inappropriate loan terms. Most of the
time, the sample complained about the group methodology, forcing them to be organized
in groups and submitted to the joint liability pressure for repayments of the credits;
however, this is not a limit per se, but rather an enforcement property which instead
guarantee the viability of the microfinance formula. They also blamed that the time frame
of the loans was not synchronized with the financial cycle of the coffee harvest (once a
year)39.
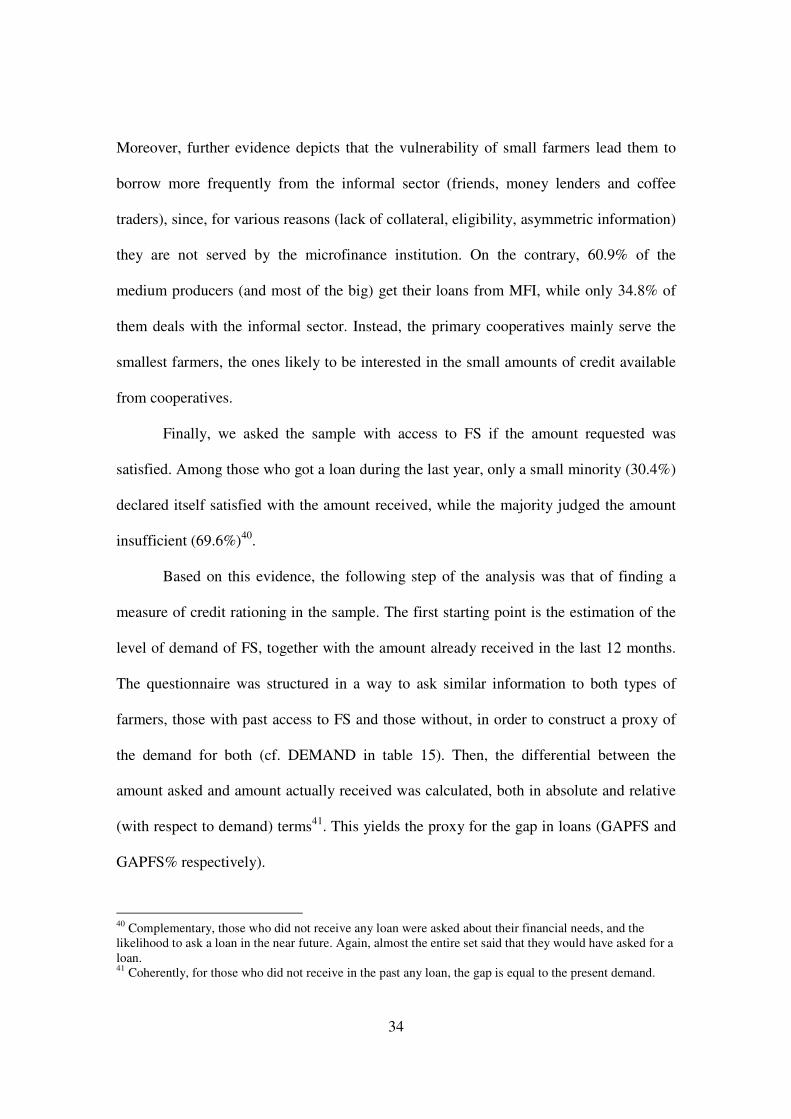
Concerning the relation between size of land and the amount of loan, table 14
highlights an obvious positive relation, largely expected from the literature findings.
Table 14 - Relation between land size and amount of loans (ETB)
Land size n. Mean Std. Dev.
Small 29 371.3 382.0 Medium 24 626.7 443.1 Big 3 933.3 305.5 Total 56 510.8 430.9 Source: Authors’ survey
39 Farmers would like to receive at least one year loan term, and a sufficient grace period to start repaying.
34
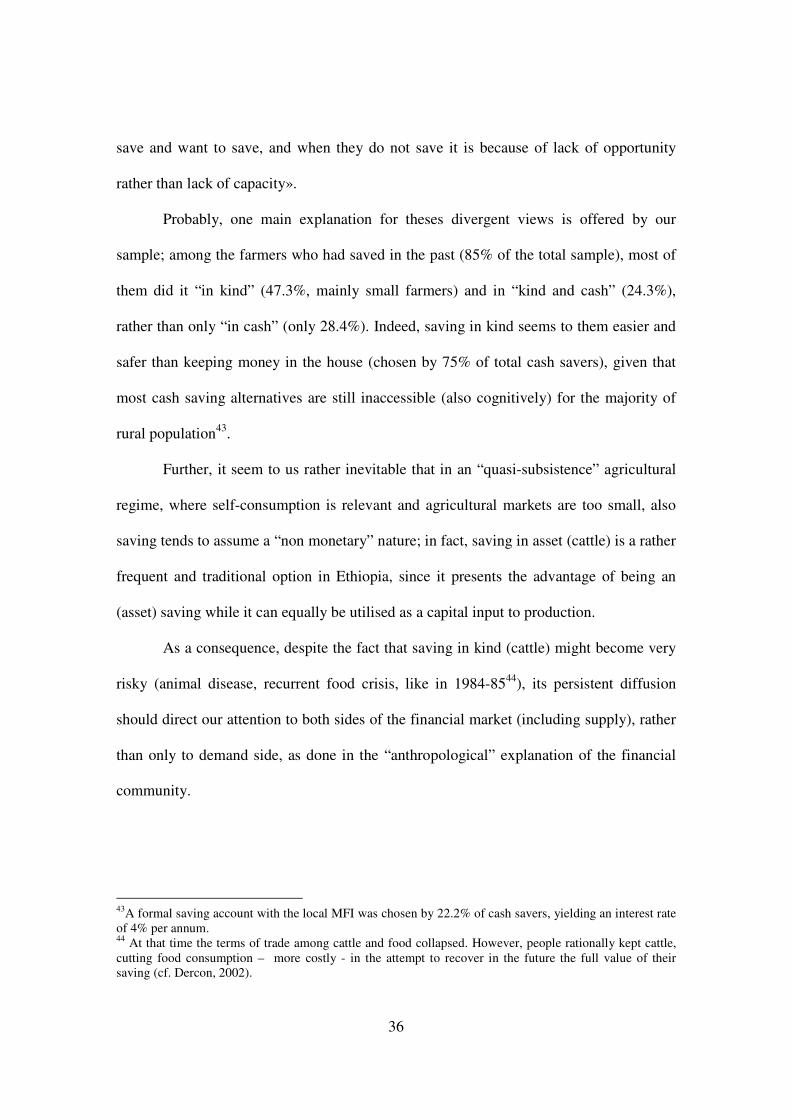
Moreover, further evidence depicts that the vulnerability of small farmers lead them to
borrow more frequently from the informal sector (friends, money lenders and coffee
traders), since, for various reasons (lack of collateral, eligibility, asymmetric information)
they are not served by the microfinance institution. On the contrary, 60.9% of the
medium producers (and most of the big) get their loans from MFI, while only 34.8% of
them deals with the informal sector. Instead, the primary cooperatives mainly serve the
smallest farmers, the ones likely to be interested in the small amounts of credit available
from cooperatives.
Finally, we asked the sample with access to FS if the amount requested was
satisfied. Among those who got a loan during the last year, only a small minority (30.4%)
declared itself satisfied with the amount received, while the majority judged the amount
insufficient (69.6%)40.
Based on this evidence, the following step of the analysis was that of finding a
measure of credit rationing in the sample. The first starting point is the estimation of the
level of demand of FS, together with the amount already received in the last 12 months.
The questionnaire was structured in a way to ask similar information to both types of
farmers, those with past access to FS and those without, in order to construct a proxy of
the demand for both (cf. DEMAND in table 15). Then, the differential between the
amount asked and amount actually received was calculated, both in absolute and relative
(with respect to demand) terms41. This yields the proxy for the gap in loans (GAPFS and
GAPFS% respectively).
40 Complementary, those who did not receive any loan were asked about their financial needs, and the likelihood to ask a loan in the near future. Again, almost the entire set said that they would have asked for a loan. 41 Coherently, for those who did not receive in the past any loan, the gap is equal to the present demand.
35
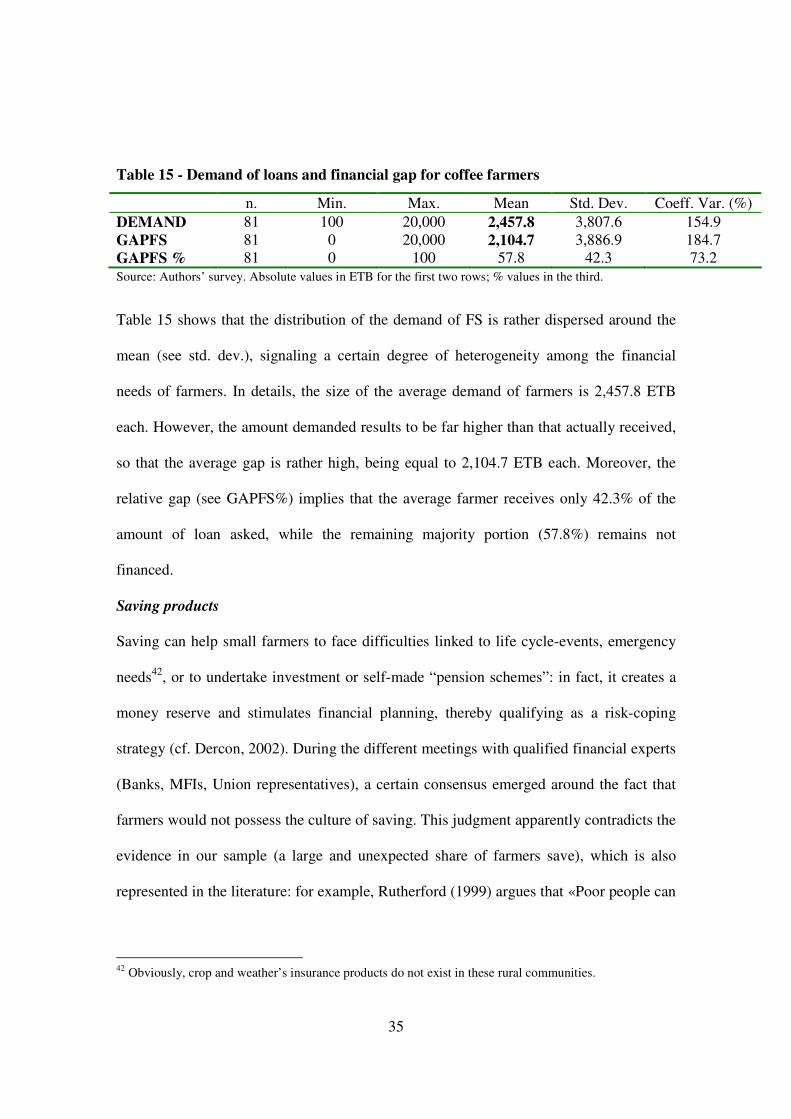
Table 15 - Demand of loans and financial gap for coffee farmers
n. Min. Max. Mean Std. Dev. Coeff. Var. (%)
DEMAND 81 100 20,000 2,457.8 3,807.6 154.9
GAPFS 81 0 20,000 2,104.7 3,886.9 184.7 GAPFS % 81 0 100 57.8 42.3 73.2 Source: Authors’ survey. Absolute values in ETB for the first two rows; % values in the third.
Table 15 shows that the distribution of the demand of FS is rather dispersed around the
mean (see std. dev.), signaling a certain degree of heterogeneity among the financial
needs of farmers. In details, the size of the average demand of farmers is 2,457.8 ETB
each. However, the amount demanded results to be far higher than that actually received,
so that the average gap is rather high, being equal to 2,104.7 ETB each. Moreover, the
relative gap (see GAPFS%) implies that the average farmer receives only 42.3% of the
amount of loan asked, while the remaining majority portion (57.8%) remains not
financed.
Saving products
Saving can help small farmers to face difficulties linked to life cycle-events, emergency
needs42, or to undertake investment or self-made “pension schemes”: in fact, it creates a
money reserve and stimulates financial planning, thereby qualifying as a risk-coping
strategy (cf. Dercon, 2002). During the different meetings with qualified financial experts
(Banks, MFIs, Union representatives), a certain consensus emerged around the fact that
farmers would not possess the culture of saving. This judgment apparently contradicts the
evidence in our sample (a large and unexpected share of farmers save), which is also
represented in the literature: for example, Rutherford (1999) argues that «Poor people can
42 Obviously, crop and weather’s insurance products do not exist in these rural communities.
36
save and want to save, and when they do not save it is because of lack of opportunity
rather than lack of capacity».
Probably, one main explanation for theses divergent views is offered by our
sample; among the farmers who had saved in the past (85% of the total sample), most of
them did it “in kind” (47.3%, mainly small farmers) and in “kind and cash” (24.3%),
rather than only “in cash” (only 28.4%). Indeed, saving in kind seems to them easier and
safer than keeping money in the house (chosen by 75% of total cash savers), given that
most cash saving alternatives are still inaccessible (also cognitively) for the majority of
rural population43.
Further, it seem to us rather inevitable that in an “quasi-subsistence” agricultural
regime, where self-consumption is relevant and agricultural markets are too small, also
saving tends to assume a “non monetary” nature; in fact, saving in asset (cattle) is a rather
frequent and traditional option in Ethiopia, since it presents the advantage of being an
(asset) saving while it can equally be utilised as a capital input to production.
As a consequence, despite the fact that saving in kind (cattle) might become very
risky (animal disease, recurrent food crisis, like in 1984-8544), its persistent diffusion
should direct our attention to both sides of the financial market (including supply), rather
than only to demand side, as done in the “anthropological” explanation of the financial
community.
43A formal saving account with the local MFI was chosen by 22.2% of cash savers, yielding an interest rate of 4% per annum. 44 At that time the terms of trade among cattle and food collapsed. However, people rationally kept cattle, cutting food consumption – more costly - in the attempt to recover in the future the full value of their saving (cf. Dercon, 2002).
37
In sum, there are macroeconomic (endemic poverty and coffee price decline) and
seasonal (lean period) reasons which mainly account for the reduced saving flow45. In
this context, a substantial part of saving follows the traditional pattern “in kind”, while
the low accessibility and scarce information about the new saving products (MFI and
financial cooperatives arrived recently in the area surveyed), contribute to dampen their
diffusion.
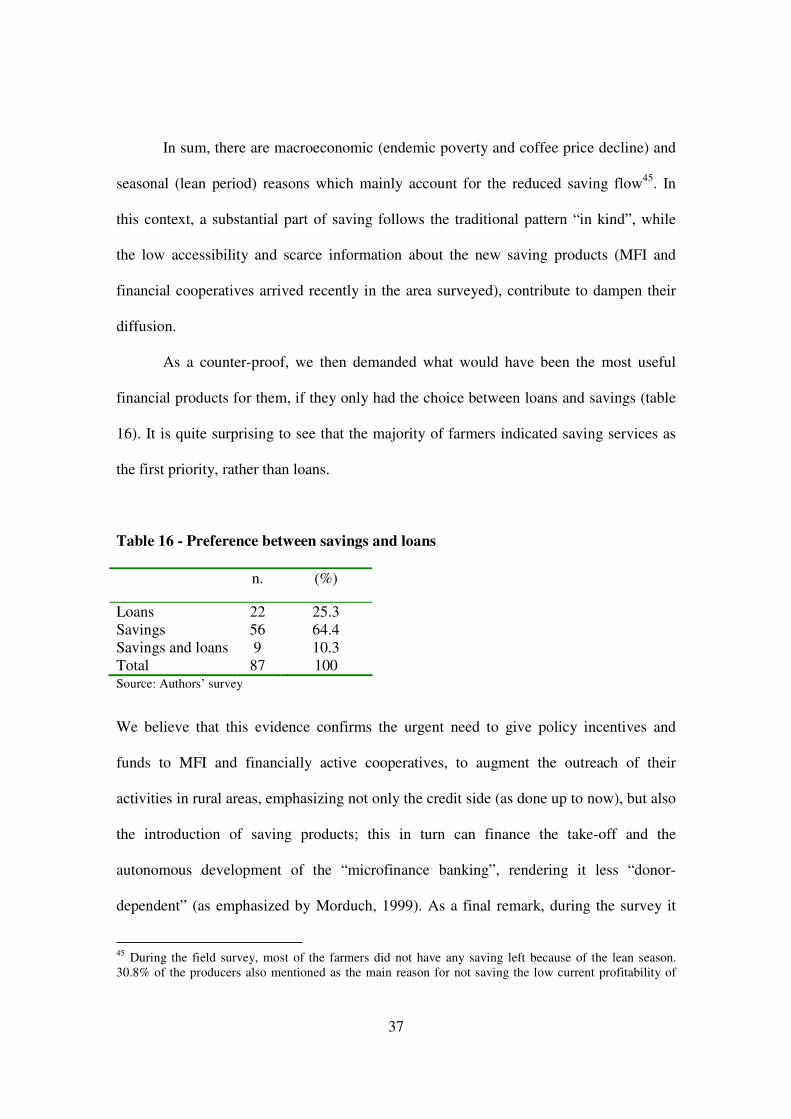
As a counter-proof, we then demanded what would have been the most useful
financial products for them, if they only had the choice between loans and savings (table
16). It is quite surprising to see that the majority of farmers indicated saving services as
the first priority, rather than loans.
Table 16 - Preference between savings and loans
n. (%)
Loans 22 25.3 Savings 56 64.4 Savings and loans 9 10.3 Total 87 100 Source: Authors’ survey
We believe that this evidence confirms the urgent need to give policy incentives and
funds to MFI and financially active cooperatives, to augment the outreach of their
activities in rural areas, emphasizing not only the credit side (as done up to now), but also
the introduction of saving products; this in turn can finance the take-off and the
autonomous development of the “microfinance banking”, rendering it less “donor-
dependent” (as emphasized by Morduch, 1999). As a final remark, during the survey it
45 During the field survey, most of the farmers did not have any saving left because of the lean season. 30.8% of the producers also mentioned as the main reason for not saving the low current profitability of
38
was frequent to hear the local or administrative agents of the woreda complaining about
the fact that farmers earning “lots of money” upon harvest do not save for emergency
events. The above evidence suggests that, if more providers were operating and offering
these new services in the study area, people would probably earn and save more.
We also argue that the introduction of suitable saving products could alleviate the
absence of specific insurance products, whose introduction appears far more difficult46
due to prevalent systemic character of the risks faced in rural underdeveloped countries
(were risk diversification is less feasible). Although the two instruments are not
substitutes, deposits and other simple saving products can enable farmers to better
manage their financial cycle; currently, the most typical “financial instrument” consists in
pre-selling to merchants (sebsabies and ackrabies) the coffee harvest at a fixed price, in
order to get financed; but this instrument is too costly (in terms of a lower negotiated
price for coffee) and rather inappropriate.
5. CONCLUSIONS
Financing rural areas and communities, although economically and ethically necessary
(and socially inclusive), is a difficult business, where traditional financial markets fail, in
Ethiopia as elsewhere in developing countries. Farmers result to be typically excluded (or
credit-rationed) by banks and traditional financial institutions, and they finish to get
access to alternative informal sources which often worsen their financial situation. This
study is a first attempt to uncover the current situation of Ethiopian coffee farmers which,
coffee production. 46 Recently, the MFI OCSSCO has launched a “micro life insurance”, protecting both the household and the MFI in case of death of the borrower (indeed, out of 24 MFIs in the country, OCSSCO is one of the first to offer this kind of product).
39
for a variety of reasons, have been recently facing the negative consequences of radical
institutional reforms, market liberalization and agricultural price volatility, while
remaining in a condition of land fragmentation and low productivity. The study has
focused on representative Ethiopian coffee farmers (smallholders), who account for 95%
of the country’s production.
Roughly, 65% of the sample received financial services, while the remaining had
no access at all, although needed. Among the available financial sources, the first
important provider result to be the microfinance institution (MFI), which has recently
appeared on these rural markets. The MFI resulted to be the most suitable source in terms
of conditions (low interest rates, longest duration for the loan and biggest amount), but its
outreach remain limited, touching only 33.8% of the sample. Further progress is needed
also in the types of financial products offered: for example, the surveyed MFI does not
provide consumption loans, mostly needed during the lean season. Second, the informal
sector brings some relief to rural people, especially during the lean period: it is very
flexible and quick in access but, except for friends, the interest rates charged are
unsustainable, so that in the long term these loans worsen the poverty trap of farmers. As
far as the primary cooperatives are concerned, they are usually not perceived as an
“official” financial institution, since they have been entering the microfinance market
only recently. In the only case surveyed, the size of its operations (average amount and
loan duration) appeared rather insufficient face to farmers’ demand.
We also assessed the relative gap between demand and supply of credit: it came
out that only 42.3% of the original demand was satisfied. Regarding saving products,
there was a certain evidence of a potential demand for deposit products, which could

40
gradually replace traditional saving “in kind”. In particular, saving constitutes a “de
facto” risk-coping strategy for farmers, although mostly unconscious.
To summarize, there is a limited supply of financial services (loans and savings
products) to the coffee farmers of Jimma Zone. One third of the credit is informal, and
the market power enjoyed by its suppliers renders it highly costly and inefficient. The
main resulting effect is that most lending activities in this area do not contribute to
achieve the financial sustainability of farmers and their productive growth, but are simply
limited to ensuring subsistence, at the most. This situation in turn affects their future
financial eligibility as potential customers of “financial” cooperatives and MFIs. As a
consequence, based on this evidence, a further diffusion of new microfinance
intermediaries across the whole country is urgently needed.
More generally, given the current poverty trends of Ethiopia, further
complementary policy instruments (and foreign aid) are equally necessary and urgent,
beginning with traditional public infrastructure, such as transport, telecom (where
Ethiopia falls well behind) and health services. In particular, the undergoing process of
market and trade liberalization should be closely monitored and carefully co-adapted to
its institutions, to avoid that the costs of the structural adjustment further damage the
poorest.
List of Acronyms and rate of exchange
ADLI Agricultural Development Led Industrialization
AEMFI Association of Ethiopian Microfinance Institutions
CBE Commercial Bank of Ethiopia
CIP Coffee Improvement Program ( EU program)
CSA Central Statistical Agency
41
CTA Coffee and Tea Authority
DBE Development Bank of Ethiopia
EPRDF Ethiopian People Revolutionary Democratic Front
FCE Facilitators for Change Ethiopia (local NGO)
MFI Microfinance Institutions
MOA/RD Ministry of Agriculture, Rural Development
NBE National Bank of Ethiopia
NGO Non Governmental Organization
PA Peasant Association (or Kebele)
OCFCU Oromia Coffee Farmers Cooperative Union
OCSSCO Oromia Credit and Savings Share Company (MFI)
RUFIP Rural Financial Intermediation Programme
USAID United States Agency for International Development
Birr (ETB): Ethiopian currency. US$ 1= 8,65 Birrs (August 2005)
42
REFERENCES:
Amha, W., Gabre-Medhin, E. (2003), “Coffee Marketing and Risk Management in Ethiopia”, mimeo, August. Assefa, A., Gebrehiwot, A., Mulat, D. (2005), “Rural Finance in Ethiopia: Assessment of the Financial Products of Microfinance Institutions”, Occasional Paper n. 12, Association of Ethiopian Microfinance Institutions, Addis Ababa. Bastin, A. (2005) Financing Coffee Farmers In Jimma Zone, Ethiopia: Challenges And
Opportunities Master Thesis in Microfinance, State University of Bergamo (Italy), October. Bezabih, E., Kejela, G., Dhunfa, L., Gezehegn, A. (2005), “Informal Finance in Ethiopia”, Occasional Paper n. 13, Association of Ethiopian Microfinance Institutions, Addis Ababa. Dercon, S. (2002), “Income Risk, Coping Strategies, and Safety Nets”, The World Bank
Research Observer, Vol. 17, n.2, pp. 141-166. Diagnostic Trade Integration Study (DTIS), (2004), Ethiopia. Trade and Transformation, Final version, Vol. II, July. FAO (2007), “Key Statistics of Food and Agriculture External Trade”, available from www.fao.org/es/ess/toptrade. Gabre-Medhin, E. (2001), “Market Institutions, Transaction Costs, and Social Capital in the Ethiopian Grain Market”, IFPRI Research Report, n.124. IFAD-World Bank, (2001), Enhancing Rural Financial Intermediation in Ethiopia. LMC International (2000), ICO/CFC Study of Marketing and Trading Policies and
Systems in Selected Coffee Producing Countries, February, London.
Mekuria, T., Neuhoff, D., Köpke, U., (2004), “The Status of Coffee Production and the Potential for Organic Conversion in Ethiopia”, paper presented at the Deutscher Tropentag, 5-7 October, Berlin. Meyer, R.L., Nagarajan, G., (2000), Rural financial markets in Asia: Policies, paradigms,
and performance,” Oxford University press for the Asian Development Bank. MOFED, (2002), Ethiopia: Sustainable Development and Poverty Reduction Program, Addis Ababa, July.

43
Morduch, J. (1999), “The Microfinance Promise”, Journal of Economic Literature, Vol. XXXVII, December, pp. 1569-1614. Myrdal, G. (1957) Economic Theory and Under-Developed Regions, Duckworth, London. Otero, M. (1999), “Bringing Development back into Microfinance”, Journal of
Microfinance, Vol. 1, n. 1, pp. 8-19. Oxfam International. (2002), “Crisis in the Birthplace of Coffee”, Oxfam International Research Paper. Regassa, Y., (2004), The Effect of Land Use Changes on Rural Household Economy
along Highways: the case study of Addis Ababa, March RUFIP-Republic of Ethiopia. (2001), “The Micro-finance Sub-sector”, Appraisal Report, Working paper n.1. Rutherford, S. (1999), “The poor and their money: an essay about financial services for
poor people”, Institute for Development Policy and Management- University of Manchester, January Stiglitz, J. E, (2006), Making Globalization Work, W. W. Norton. UNDP, (2006), Human Development Report, Palgrave Macmillan, New York. Viganò, L. (1996), Agricultural Credit Training Manual, FAO, TCAS and Foundation Giordano Dell’ Amore, Rome. Von Pischke, J.D., Rouse, J.G., (2004) New strategies for mobilizing capital in
agricultural cooperatives, FAO, Rome. Women’s World Banking, (2005), Country Overview, Federal Democratic Republic of
Ethiopia, New York. World Bank (2006a) “Ethiopia at a glance”, available from www.worldbank.org. World Bank (2006b), Africa Development Indicators, available from www.worldbank.org. World Bank, (2006c), World Development Indicators, dataset release of 1 July. Yaron, J., Mithka, M., (2004), “International Experience in Rural Finance”, paper presented in Kenya, 26 February, Nairobi.