international approaches to access to and success in higher education dirk van damme
TRANSCRIPT

INTERNATIONAL APPROACHES TO ACCESS TO AND SUCCESS IN
HIGHER EDUCATION
Dirk Van DammeOECD/EDU/IMEP

2
• The social contract with students• The international context• For what kind of problems are entrance tests the
solution?• Risks• Conclusion
Outline

3
THE SOCIAL CONTRACT WITH STUDENTS

4
• Components of the social contract of higher education– Public funding– The cost: tuition fees, other direct and indirect costs,
scholarships, loans, other support services– Indirect financial consequences: tax benefits, family
allowances, social security– Open or closed entry regulation, choice of study and
flexibility in progression– The quality of educational provision– Success rates– Expected monetary and non-monetary benefits
Entry regulation is part of a wider social contract with students

5
Public funding
Estonia
Slovak Republic
Chile
Hungary
Korea
Czech Republic
Finland
Slovenia
Denmark
Russian Federation
Israel
Japan
United Kingdom
Italy
Poland
OECD average
EU21 average
Netherlands
Switzerland
France
Sweden
Germany
Australia
BrazilSpain
NorwayMexico
BelgiumPortugal
Austria
United States
IrelandIceland
80
90
100
110
120
130
140
150
Chan ge i n ex pe nd iture Cha ng e in the nu mber of stud en ts ( in ful l-t ime eq ui val ents ) Cha ng e in e xp end iture per stud en t
Ind ex of ch an ge (2 00 8= 10 0)
Chart B1 .6 . C ha nge s in the num be r of stude nts a nd c hanges in ex pe nditure pe r s tude nt by e duc ationa l ins titutions , by lev el of e duc a tion (2 0 05 , 2 01 0)In d ex o f c ha ng e b etwe e n 20 0 5 an d 2 01 0 (2 0 05 = 10 0, 2 01 0 co n stan t p ri ce s )

6
Tuition fees

7
Tuition fees and support

Less than 70% of students entering tertiary education actually graduate
Proportion of students who enter tertiary education and graduate with at least a first degree
Japa
n
Aus
tralia
Den
mar
k
Fran
ce
Spa
in
Finl
and
Ger
man
y
Turk
ey
Bel
gium
(Fl.)
Net
herla
nds
Cze
ch R
epu.
..
Uni
ted
Kin
...
Slo
vak
Rep
u...
EU
21 a
vera
ge
OE
CD
ave
...
Por
tuga
l
Mex
ico
Aus
tria
Pol
and
New
Zea
land
Nor
way
Sw
eden
Uni
ted
Sta
tes
Hun
gary
0
10
20
30
40
50
60
70
80
90
100%

9
• Gradual privatisation of costs (although still moderate in BE)
• Less transparency on relationship between costs and benefits, while students are expected to make ‘smart’ choices
• Higher pressures on orientation and success• From consumption to investment
The changing social contract with students
10
THE INTERNATIONAL CONTEXT


12
Exams and testing are the rule, not the exception

13
FOR WHAT KIND OF PROBLEMS ARE ENTRY TESTS THE SOLUTION?

14
• Excessively high entry rates, over-consumption?• Field-of-study mismatch?• Deficient prior knowledge and skills, resulting in
high failure rates?• Lack of quality in learning outcomes?• Graduate output?
For what kind of problems are entry tests the solution?

15
Entry rates to higher education

16
Field of study

17
Field-of-study mismatch?

18
The cost of field-of-study mismatch
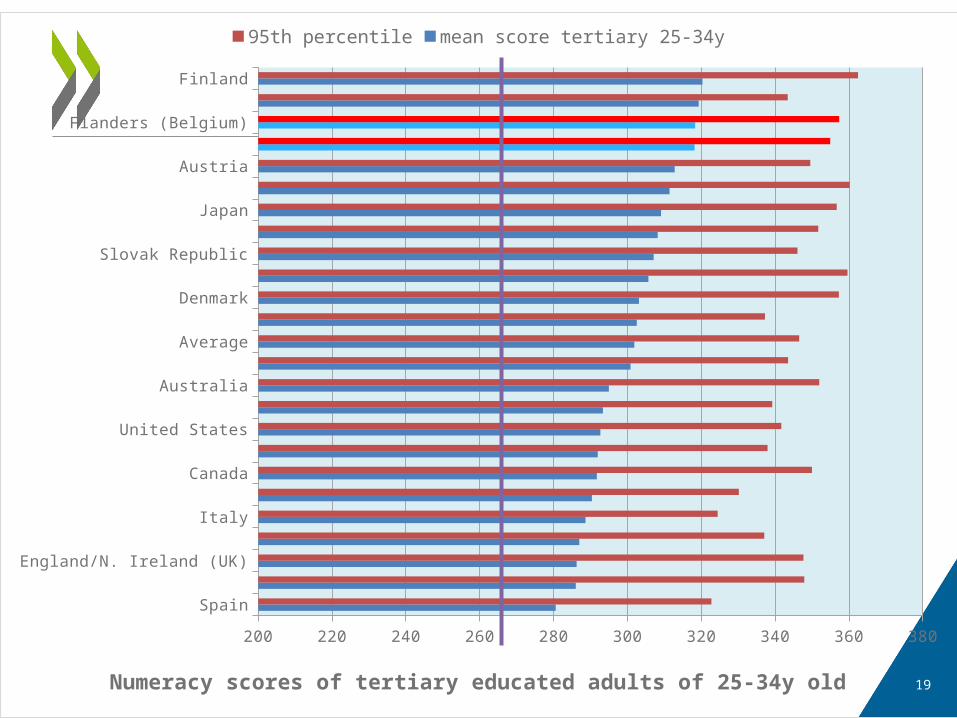
SpainEngland (UK)
England/N. Ireland (UK)Ireland
ItalyKorea
CanadaPoland
United StatesNorthern Ireland (UK)
AustraliaEstonia
AverageFrance
DenmarkNorway
Slovak RepublicGermany
JapanSweden
AustriaNetherlands
Flanders (Belgium)Czech Republic
Finland
200 220 240 260 280 300 320 340 360 380
95th percentile mean score tertiary 25-34y
Numeracy scores of tertiary educated adults of 25-34y old

20
Graduate outputCh
ina
Sout
h Af
rica
Indo
nesia
Braz
ilTu
rkey
Italy
Chile
Mex
ico
Port
ugal
Slov
ak R
epub
licCz
ech
Repu
blic
Colo
mbi
aAu
stria
Hung
ary
Pola
ndSl
oven
iaGr
eece
Germ
any
Latv
iaEU
21 a
vera
geFr
ance
Spai
nO
ECD
aver
age
Neth
erla
nds
Denm
ark
Icel
and
Belg
ium
Swed
enSw
itzer
land
Esto
nia
Norw
ayLu
xem
bour
gFi
nlan
dIre
land
New
Zea
land
Unite
d Ki
ngdo
mAu
stra
liaKo
rea
Unite
d St
ates
Israe
lJa
pan
Cana
daRu
ssia
n Fe
dera
tion
0
10
20
30
40
50
60
2000 2012%

21
Over-qualification

22
RISKS

23
• The risk of decreasing participation, graduation and attainment– Entrance tests should not frighten off students and
decrease student intake• Social equity risks
– Entrance tests should not aggravate equity deficit, but improve opportunities for deserving students from disadvantaged backgrounds
• Quality of entrance tests– Low-quality tests are worse than open entry, but high-
quality tests are better than open entry
Main risks of entrance tests

24
Tertiary attainment rate among 25-34y-olds, 2000-2013
Kor
ea
Pol
and
Luxe
mbo
urg
Latv
iaIre
land
Uni
ted
Kin
gdom
Slo
vak
Rep
ublic
Slo
veni
aC
zech
Rep
ublic
Sw
itzer
land
Por
tuga
lH
unga
ryN
ethe
rland
sA
ustra
liaO
EC
D a
vera
geTu
rkey
Gre
ece
Fran
ceIta
lyE
ston
iaD
enm
ark
Nor
way
New
Zea
land
Sw
eden
Aus
tria
Japa
nIc
elan
dC
anad
aM
exic
oS
pain
Uni
ted
Sta
tes
Bel
gium
Ger
man
yFi
nlan
d
0
10
20
30
40
50
60
702000 2013%

25
Average annual increase in tertiary attainment rate among 25-34y-olds, 2000-2013
%
Finlan
d
Belgium
Spain
Japa
n
Sweden
Estonia
France
Mexico
OECD avera
ge
Netherl
ands
United
King
dom
Irelan
dKore
a
Hunga
ryIta
ly
Turkey
Slovak
Rep
ublic
0
1
2
3
4
5
6
7
8
9

26
Losing talent: equity issues remain and educational mobility slows down
1234567891015
20
25
30
35
40
45
50
35.90
21.22
27.4127.94
23.35
39.1939.89
18.74
44.6345.40
24.49
38.18
22.39
36.28
41.09
24.4723.51
34.54
32.52
43.57
31.93
Odds ratio
Upw
ard
mob
ility
inequality of opportunitylow educational mobility
inequality of opportunityhigh educational mobility
equality of opportunityhigh educational mobility
equality of opportunitylow educational mobility

27
CONCLUSION

28
• When implemented seriously, tests can empower students to make smarter choices and enjoy a more rewarding study trajectory– Better understanding of one’s prior knowledge
and skills and one’s capabilities– Better guarantees for successful study– Improving quality of teaching and learning
environments for deserving students– Higher efficiency of education system
Better information, orientation is the only powerful argument
