internaliliacanduterinearteriesdoppler ultrasound in the ... ·...
TRANSCRIPT
Internal iliac and uterine arteries Dopplerultrasound in the assessment ofnormotensive and chronic hypertensivepregnant womenL. Guedes-Martins1,2,3, A. Cunha3, J. Saraiva3, R. Gaio4,5, F. Macedo6,7 & H. Almeida1,2,8
1Departamento de Biologia Experimental, Faculdade de Medicina da Universidade do Porto, 4200–319 Porto, Portugal,2IBMC-Instituto de Biologia Molecular e Celular, 4150–180 Porto, Portugal, 3Centro Hospitalar do Porto EPE, Departamento daMulher e da Medicina Reprodutiva, Largo Prof. Abel Salazar, 4099–001 Porto, Portugal, 4Department of Mathematics, Faculty ofSciences of the University of Porto, 5CMUP-Centre of Mathematics of the University of Porto, Portugal, 6Departamento de Medicina,Faculdade de Medicina da Universidade do Porto, 4200–319 Porto, Portugal, 7Centro Hospitalar S. Joao, 4200–319 Porto,Portugal, 8Ginecologia-Obstetrıcia, Hospital-CUF Porto, 4100 180 Porto, Portugal.
The objective of this work was to compare Doppler flows pulsatility index (PI) and resistance indexes (RI) ofuterine and internal iliac arteries during pregnancy in low risk women and in those with stage-1 essentialhypertension. From January 2010 and December 2012, a longitudinal and prospective study was carried outin 103 singleton uneventful pregnancies (72 low-risk pregnancies and 31 with stage 1 essentialhypertension)at the 1st, 2nd and 3rd trimesters. Multiple linear regression models, fitted using generalizedleast squares and whose errors were allowed to be correlated and/or have unequal variances, were employed;a model for the relative differences of both arteries impedance was utilized. In both groups, uterine artery PIand RI exhibited a gestational age related decreasing trend whereas internal iliac artery PI and RI increased.The model testing the hemodynamic adaptation in women with and without hypertension showed similartrend. Irrespective of blood pressure conditions, the internal iliac artery resistance pattern contrasts with thecapacitance pattern of its immediate pelvic division, suggesting a pregnancy-related regulatory mechanismin the pelvic circulation.
Shortly after the establishment of pregnancy, the maternal circulation undergoes a substantial change tomeet the increasing demands of the growing uterus and foetus.
Noteworthy, there is a decrease in total peripheral resistance until midpregnancy1,2 and a .40% increase ofcardiac output measured at the aortic valve2 that results from enhanced heart rate, a slight increment in the aorticvalve area and an increased blood flow velocity across the valve1,2. This change is reflected in the pelvic circulation,where volume flow and mean velocity also increase in common iliac arteries3. However, past this point, anotorious difference is noticed.
In fact, while in the external iliac artery, that feeds the lower limb, mean velocity and volume flow are reducedalong the pregnancy, in contrast, the uterine artery (UtA) exhibits a progressive and persistent increase in volumeflow and mean velocity3,4. This pregnancy related redistribution of blood to the pelvis is particularly important asthe uterine artery provides most of the blood to the uterus and is thus critical to the continuous and adequatefoetal nourishment.
In the mid-1990s, the procedures employed in the acquisition of those data, many of them based in velocitymeasurement, were replaced in part by indices relying on the computerized analysis of Doppler ultrasoundfrequency spectrum. Such indices include the pulsatility index (PI) and the resistance index (RI), both derivedfrom blood velocity measurements at specific points of the systolic/diastolic cycle. As they are easy to obtain, donot require cumbersome adjustments and are more objective, they have been widely applied in the assessment ofthe uteroplacental circulation in normal pregnancies4 and also when they are complicated by pathologicalconditions as hypertensive disorders5–7. In this setting, the uterine artery became an important target in theapplication of those procedures8–15.
OPEN
SUBJECT AREAS:MEDICAL RESEARCH
CARDIOVASCULAR DISEASES
Received14 November 2013
Accepted2 January 2014
Published21 January 2014
Correspondence andrequests for materials
should be addressed toL.G.-M. ([email protected])
SCIENTIFIC REPORTS | 4 : 3785 | DOI: 10.1038/srep03785 1
The enhanced blood volume that is transported by the uterinearteries along the pregnancy is associated with a reduced impedanceof flow consequent to the impressive structural changes that takeplace at the placental bed. In normal pregnancy, placental tropho-blastic cells migrate across the decidua, invade the inner third of themyometrium and replace most of the muscular and endothelial cellsof the maternal spiral arteries, rendering them low impedance, highcapacitance vessels that optimize the delivery of oxygen and nutri-ents to the foetus. That change is reflected in the uterine artery flowvelocity as measured by Doppler ultrasound spectrum5,6,13.
It was noticed that in the non-pregnant state there is a rapid riseand sudden fall in flow velocity during systole and a ‘‘notch’’ in earlydiastole16, a property that reflects an high impedance vessel. As thepregnancy evolves normally from 8 weeks onwards, a progressiveincrease in uterine artery compliance is noticed, which continuesthrough 26 weeks’ gestation, albeit at a lesser extent16, during whichthe «notch» is smoothed and lost.
However, when the trophoblast invasion is defective, an enhancedplacental vascular resistance is likely to occur as evidenced in abnor-mal Doppler ultrasound spectrum of the uterine vessels, indicatingwomen at risk for serious pregnancy disorders like preeclamp-sia5,12–14. In fact, abnormal uterine artery blood flow employingDoppler ultrasound assessment, at both the first and second trime-sters, was shown to associate with subsequent perinatal complica-tions17–21 and some studies even referred the analysis of Doppler wavevariations as a means to assess the potential benefits of therapeuticinterventions20–23.
The results of the hemodynamic studies of the UtA made so far areevidence of its close relation to the changes taking place in the grow-ing uterus. Such studies contrast with the scarcity of data concerningother pelvic arteries as was pointed out24. In fact, it is noteworthythat, while the UtA has been a subject of extensive research, itspredecessor, the internal iliac artery (IIA), has not. This is unexpec-ted because it is an easily accessible artery, both in pregnant and non-pregnant women, and is also the first artery entering the pelvis. Thus,it was hypothesized that such unique property would render the IIAan important means for the understanding of the pelvic circulationalong the pregnancy.
For this purpose, the most immediate approach would be a lon-gitudinal study of uneventful pregnancies in healthy women. Yet, it
was also reasoned that additional information on artery performancealong the pregnancy would be provided by a parallel study in womenhaving long term, stable, essential hypertension, a prevalent con-dition and also a known risk factor for serious disorders of thepregnancy25–29.
On account of those considerations, particularly the lack of know-ledge on the internal iliac artery hemodynamics, in contrast with thelarger knowledge on the uterine artery, it was purposed to compareblood flow of both at several time points throughout the pregnancy,employing Doppler ultrasound spectrum analysis.
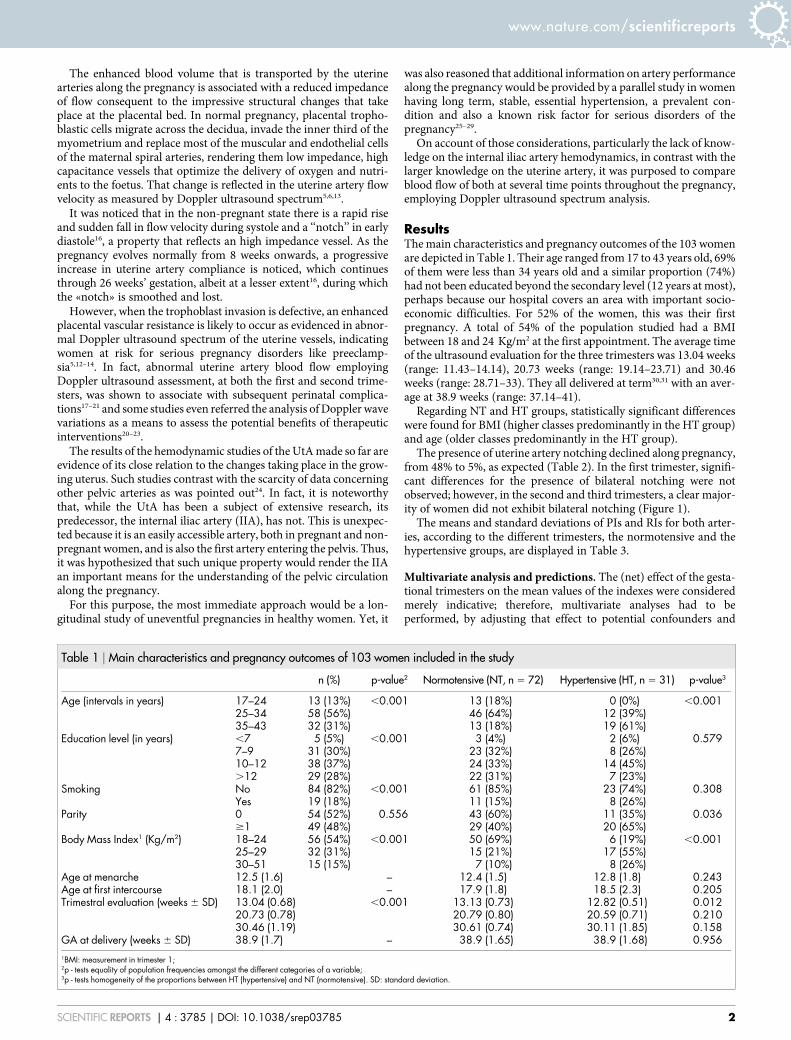
ResultsThe main characteristics and pregnancy outcomes of the 103 womenare depicted in Table 1. Their age ranged from 17 to 43 years old, 69%of them were less than 34 years old and a similar proportion (74%)had not been educated beyond the secondary level (12 years at most),perhaps because our hospital covers an area with important socio-economic difficulties. For 52% of the women, this was their firstpregnancy. A total of 54% of the population studied had a BMIbetween 18 and 24 Kg/m2 at the first appointment. The average timeof the ultrasound evaluation for the three trimesters was 13.04 weeks(range: 11.43–14.14), 20.73 weeks (range: 19.14–23.71) and 30.46weeks (range: 28.71–33). They all delivered at term30,31 with an aver-age at 38.9 weeks (range: 37.14–41).
Regarding NT and HT groups, statistically significant differenceswere found for BMI (higher classes predominantly in the HT group)and age (older classes predominantly in the HT group).
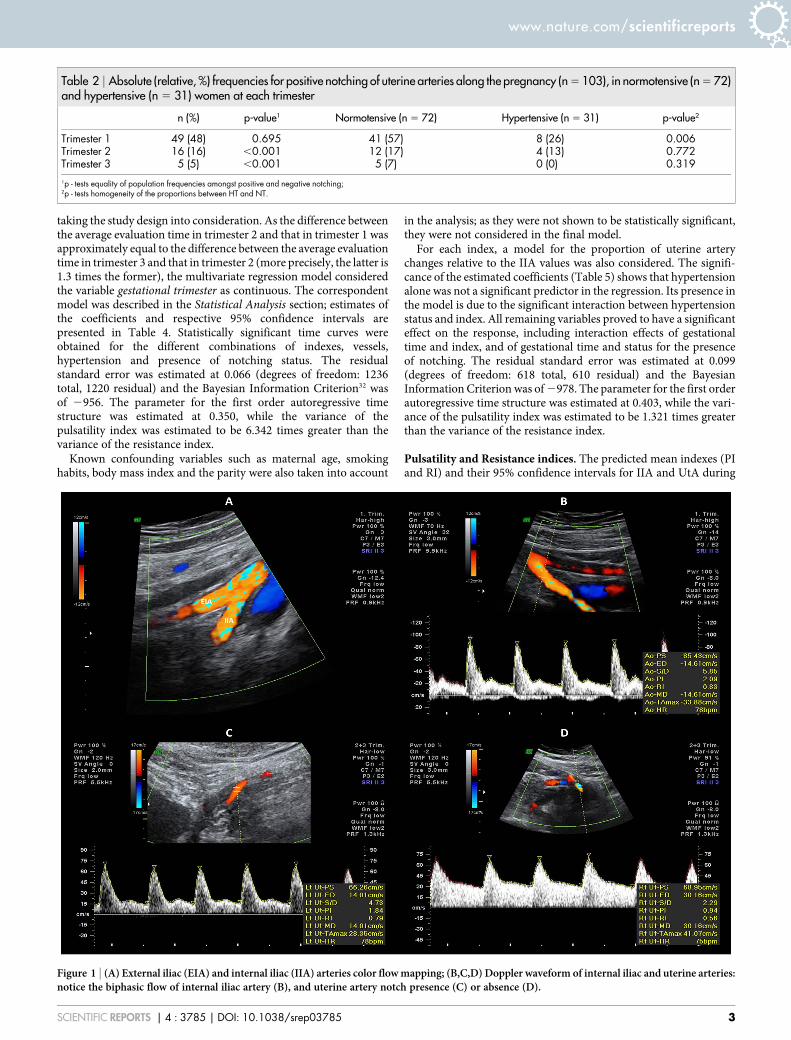
The presence of uterine artery notching declined along pregnancy,from 48% to 5%, as expected (Table 2). In the first trimester, signifi-cant differences for the presence of bilateral notching were notobserved; however, in the second and third trimesters, a clear major-ity of women did not exhibit bilateral notching (Figure 1).
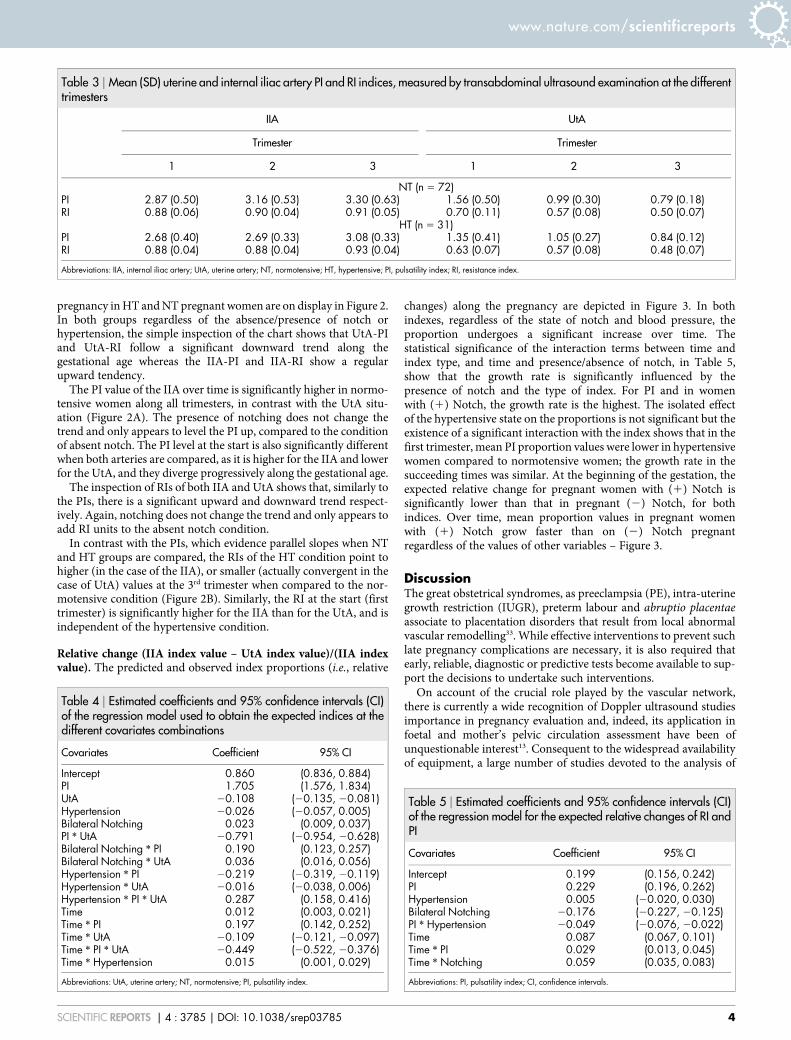
The means and standard deviations of PIs and RIs for both arter-ies, according to the different trimesters, the normotensive and thehypertensive groups, are displayed in Table 3.
Multivariate analysis and predictions. The (net) effect of the gesta-tional trimesters on the mean values of the indexes were consideredmerely indicative; therefore, multivariate analyses had to beperformed, by adjusting that effect to potential confounders and
Table 1 | Main characteristics and pregnancy outcomes of 103 women included in the study
n (%) p-value2 Normotensive (NT, n 5 72) Hypertensive (HT, n 5 31) p-value3
Age (intervals in years) 17–24 13 (13%) ,0.001 13 (18%) 0 (0%) ,0.00125–34 58 (56%) 46 (64%) 12 (39%)35–43 32 (31%) 13 (18%) 19 (61%)
Education level (in years) ,7 5 (5%) ,0.001 3 (4%) 2 (6%) 0.5797–9 31 (30%) 23 (32%) 8 (26%)10–12 38 (37%) 24 (33%) 14 (45%).12 29 (28%) 22 (31%) 7 (23%)
Smoking No 84 (82%) ,0.001 61 (85%) 23 (74%) 0.308Yes 19 (18%) 11 (15%) 8 (26%)
Parity 0 54 (52%) 0.556 43 (60%) 11 (35%) 0.036$1 49 (48%) 29 (40%) 20 (65%)
Body Mass Index1 (Kg/m2) 18–24 56 (54%) ,0.001 50 (69%) 6 (19%) ,0.00125–29 32 (31%) 15 (21%) 17 (55%)30–51 15 (15%) 7 (10%) 8 (26%)
Age at menarche 12.5 (1.6) – 12.4 (1.5) 12.8 (1.8) 0.243Age at first intercourse 18.1 (2.0) – 17.9 (1.8) 18.5 (2.3) 0.205Trimestral evaluation (weeks 6 SD) 13.04 (0.68) ,0.001 13.13 (0.73) 12.82 (0.51) 0.012
20.73 (0.78) 20.79 (0.80) 20.59 (0.71) 0.21030.46 (1.19) 30.61 (0.74) 30.11 (1.85) 0.158
GA at delivery (weeks 6 SD) 38.9 (1.7) – 38.9 (1.65) 38.9 (1.68) 0.9561BMI: measurement in trimester 1;2p - tests equality of population frequencies amongst the different categories of a variable;3p - tests homogeneity of the proportions between HT (hypertensive) and NT (normotensive). SD: standard deviation.
www.nature.com/scientificreports
SCIENTIFIC REPORTS | 4 : 3785 | DOI: 10.1038/srep03785 2
taking the study design into consideration. As the difference betweenthe average evaluation time in trimester 2 and that in trimester 1 wasapproximately equal to the difference between the average evaluationtime in trimester 3 and that in trimester 2 (more precisely, the latter is1.3 times the former), the multivariate regression model consideredthe variable gestational trimester as continuous. The correspondentmodel was described in the Statistical Analysis section; estimates ofthe coefficients and respective 95% confidence intervals arepresented in Table 4. Statistically significant time curves wereobtained for the different combinations of indexes, vessels,hypertension and presence of notching status. The residualstandard error was estimated at 0.066 (degrees of freedom: 1236total, 1220 residual) and the Bayesian Information Criterion32 wasof 2956. The parameter for the first order autoregressive timestructure was estimated at 0.350, while the variance of thepulsatility index was estimated to be 6.342 times greater than thevariance of the resistance index.
Known confounding variables such as maternal age, smokinghabits, body mass index and the parity were also taken into account
in the analysis; as they were not shown to be statistically significant,they were not considered in the final model.
For each index, a model for the proportion of uterine arterychanges relative to the IIA values was also considered. The signifi-cance of the estimated coefficients (Table 5) shows that hypertensionalone was not a significant predictor in the regression. Its presence inthe model is due to the significant interaction between hypertensionstatus and index. All remaining variables proved to have a significanteffect on the response, including interaction effects of gestationaltime and index, and of gestational time and status for the presenceof notching. The residual standard error was estimated at 0.099(degrees of freedom: 618 total, 610 residual) and the BayesianInformation Criterion was of 2978. The parameter for the first orderautoregressive time structure was estimated at 0.403, while the vari-ance of the pulsatility index was estimated to be 1.321 times greaterthan the variance of the resistance index.
Pulsatility and Resistance indices. The predicted mean indexes (PIand RI) and their 95% confidence intervals for IIA and UtA during
Table 2 | Absolute (relative, %) frequencies for positive notching of uterine arteries along the pregnancy (n 5 103), in normotensive (n 5 72)and hypertensive (n 5 31) women at each trimester
n (%) p-value1 Normotensive (n 5 72) Hypertensive (n 5 31) p-value2
Trimester 1 49 (48) 0.695 41 (57) 8 (26) 0.006Trimester 2 16 (16) ,0.001 12 (17) 4 (13) 0.772Trimester 3 5 (5) ,0.001 5 (7) 0 (0) 0.3191p - tests equality of population frequencies amongst positive and negative notching;2p - tests homogeneity of the proportions between HT and NT.
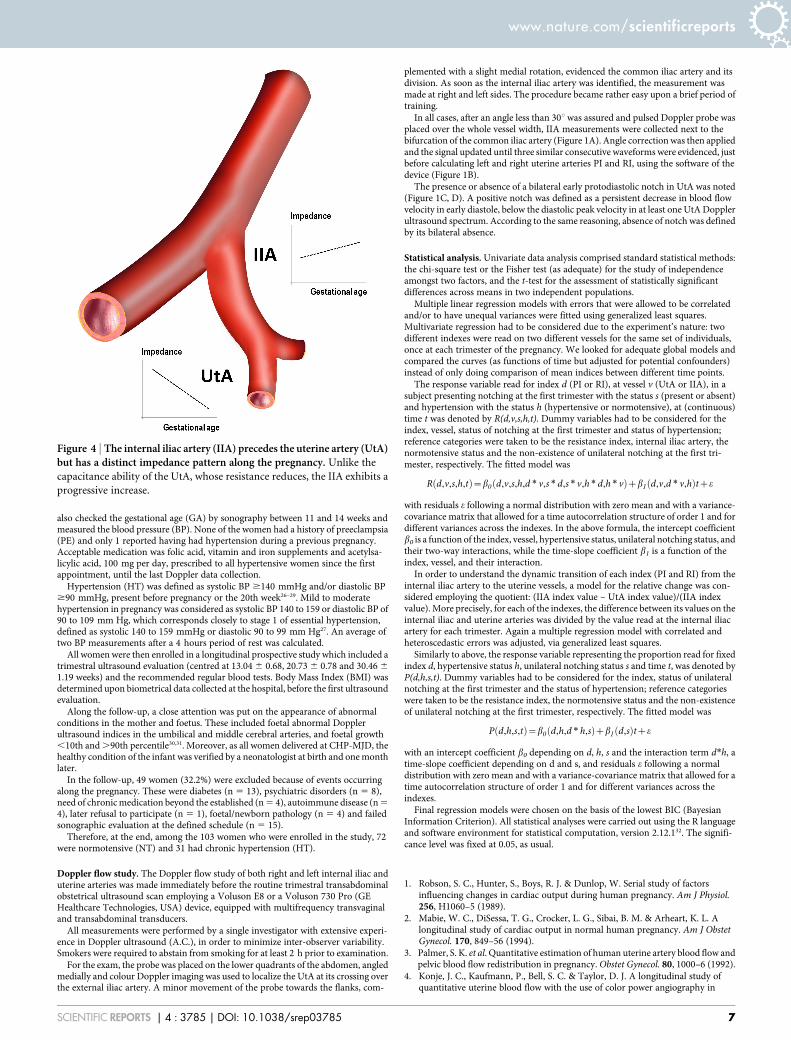
Figure 1 | (A) External iliac (EIA) and internal iliac (IIA) arteries color flow mapping; (B,C,D) Doppler waveform of internal iliac and uterine arteries:notice the biphasic flow of internal iliac artery (B), and uterine artery notch presence (C) or absence (D).
www.nature.com/scientificreports
SCIENTIFIC REPORTS | 4 : 3785 | DOI: 10.1038/srep03785 3
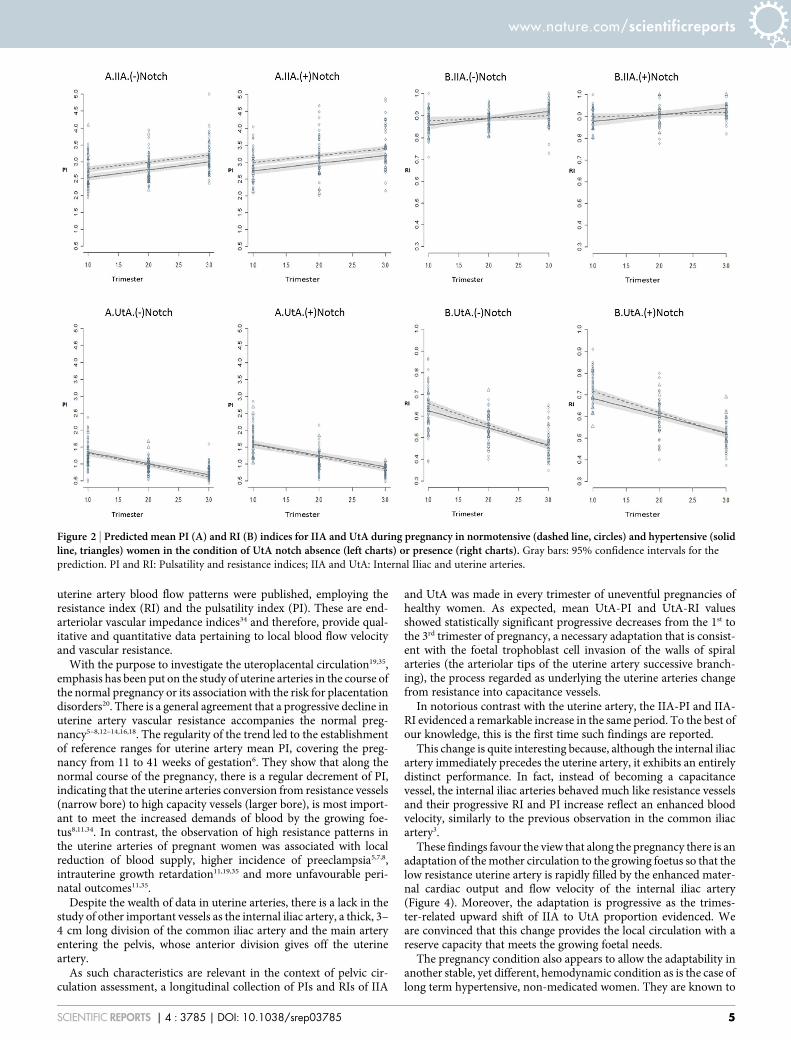
pregnancy in HT and NT pregnant women are on display in Figure 2.In both groups regardless of the absence/presence of notch orhypertension, the simple inspection of the chart shows that UtA-PIand UtA-RI follow a significant downward trend along thegestational age whereas the IIA-PI and IIA-RI show a regularupward tendency.
The PI value of the IIA over time is significantly higher in normo-tensive women along all trimesters, in contrast with the UtA situ-ation (Figure 2A). The presence of notching does not change thetrend and only appears to level the PI up, compared to the conditionof absent notch. The PI level at the start is also significantly differentwhen both arteries are compared, as it is higher for the IIA and lowerfor the UtA, and they diverge progressively along the gestational age.
The inspection of RIs of both IIA and UtA shows that, similarly tothe PIs, there is a significant upward and downward trend respect-ively. Again, notching does not change the trend and only appears toadd RI units to the absent notch condition.
In contrast with the PIs, which evidence parallel slopes when NTand HT groups are compared, the RIs of the HT condition point tohigher (in the case of the IIA), or smaller (actually convergent in thecase of UtA) values at the 3rd trimester when compared to the nor-motensive condition (Figure 2B). Similarly, the RI at the start (firsttrimester) is significantly higher for the IIA than for the UtA, and isindependent of the hypertensive condition.
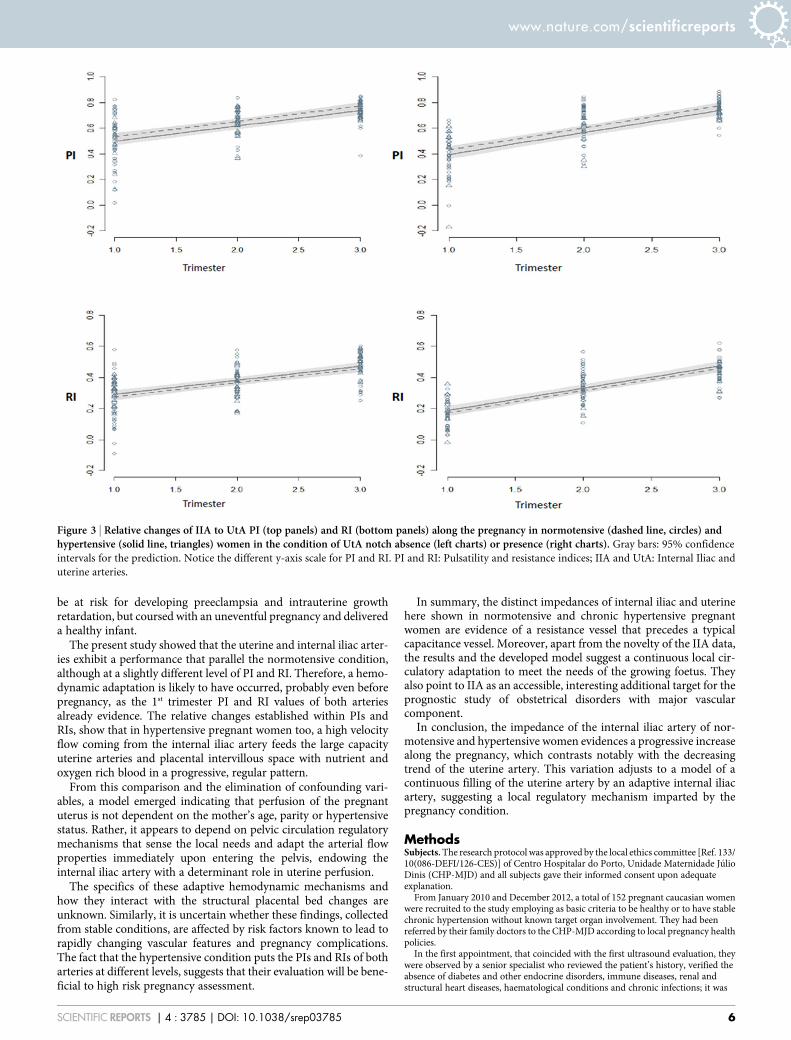
Relative change (IIA index value – UtA index value)/(IIA indexvalue). The predicted and observed index proportions (i.e., relative
changes) along the pregnancy are depicted in Figure 3. In bothindexes, regardless of the state of notch and blood pressure, theproportion undergoes a significant increase over time. Thestatistical significance of the interaction terms between time andindex type, and time and presence/absence of notch, in Table 5,show that the growth rate is significantly influenced by thepresence of notch and the type of index. For PI and in womenwith (1) Notch, the growth rate is the highest. The isolated effectof the hypertensive state on the proportions is not significant but theexistence of a significant interaction with the index shows that in thefirst trimester, mean PI proportion values were lower in hypertensivewomen compared to normotensive women; the growth rate in thesucceeding times was similar. At the beginning of the gestation, theexpected relative change for pregnant women with (1) Notch issignificantly lower than that in pregnant (2) Notch, for bothindices. Over time, mean proportion values in pregnant womenwith (1) Notch grow faster than on (2) Notch pregnantregardless of the values of other variables – Figure 3.
DiscussionThe great obstetrical syndromes, as preeclampsia (PE), intra-uterinegrowth restriction (IUGR), preterm labour and abruptio placentaeassociate to placentation disorders that result from local abnormalvascular remodelling33. While effective interventions to prevent suchlate pregnancy complications are necessary, it is also required thatearly, reliable, diagnostic or predictive tests become available to sup-port the decisions to undertake such interventions.
On account of the crucial role played by the vascular network,there is currently a wide recognition of Doppler ultrasound studiesimportance in pregnancy evaluation and, indeed, its application infoetal and mother’s pelvic circulation assessment have been ofunquestionable interest13. Consequent to the widespread availabilityof equipment, a large number of studies devoted to the analysis of
Table 3 | Mean (SD) uterine and internal iliac artery PI and RI indices, measured by transabdominal ultrasound examination at the differenttrimesters
IIA UtA
Trimester Trimester
1 2 3 1 2 3
NT (n 5 72)PI 2.87 (0.50) 3.16 (0.53) 3.30 (0.63) 1.56 (0.50) 0.99 (0.30) 0.79 (0.18)RI 0.88 (0.06) 0.90 (0.04) 0.91 (0.05) 0.70 (0.11) 0.57 (0.08) 0.50 (0.07)
HT (n 5 31)PI 2.68 (0.40) 2.69 (0.33) 3.08 (0.33) 1.35 (0.41) 1.05 (0.27) 0.84 (0.12)RI 0.88 (0.04) 0.88 (0.04) 0.93 (0.04) 0.63 (0.07) 0.57 (0.08) 0.48 (0.07)
Abbreviations: IIA, internal iliac artery; UtA, uterine artery; NT, normotensive; HT, hypertensive; PI, pulsatility index; RI, resistance index.
Table 4 | Estimated coefficients and 95% confidence intervals (CI)of the regression model used to obtain the expected indices at thedifferent covariates combinations
Covariates Coefficient 95% CI
Intercept 0.860 (0.836, 0.884)PI 1.705 (1.576, 1.834)UtA 20.108 (20.135, 20.081)Hypertension 20.026 (20.057, 0.005)Bilateral Notching 0.023 (0.009, 0.037)PI * UtA 20.791 (20.954, 20.628)Bilateral Notching * PI 0.190 (0.123, 0.257)Bilateral Notching * UtA 0.036 (0.016, 0.056)Hypertension * PI 20.219 (20.319, 20.119)Hypertension * UtA 20.016 (20.038, 0.006)Hypertension * PI * UtA 0.287 (0.158, 0.416)Time 0.012 (0.003, 0.021)Time * PI 0.197 (0.142, 0.252)Time * UtA 20.109 (20.121, 20.097)Time * PI * UtA 20.449 (20.522, 20.376)Time * Hypertension 0.015 (0.001, 0.029)
Abbreviations: UtA, uterine artery; NT, normotensive; PI, pulsatility index.
Table 5 | Estimated coefficients and 95% confidence intervals (CI)of the regression model for the expected relative changes of RI andPI
Covariates Coefficient 95% CI
Intercept 0.199 (0.156, 0.242)PI 0.229 (0.196, 0.262)Hypertension 0.005 (20.020, 0.030)Bilateral Notching 20.176 (20.227, 20.125)PI * Hypertension 20.049 (20.076, 20.022)Time 0.087 (0.067, 0.101)Time * PI 0.029 (0.013, 0.045)Time * Notching 0.059 (0.035, 0.083)
Abbreviations: PI, pulsatility index; CI, confidence intervals.
www.nature.com/scientificreports
SCIENTIFIC REPORTS | 4 : 3785 | DOI: 10.1038/srep03785 4
uterine artery blood flow patterns were published, employing theresistance index (RI) and the pulsatility index (PI). These are end-arteriolar vascular impedance indices34 and therefore, provide qual-itative and quantitative data pertaining to local blood flow velocityand vascular resistance.
With the purpose to investigate the uteroplacental circulation19,35,emphasis has been put on the study of uterine arteries in the course ofthe normal pregnancy or its association with the risk for placentationdisorders20. There is a general agreement that a progressive decline inuterine artery vascular resistance accompanies the normal preg-nancy5–8,12–14,16,18. The regularity of the trend led to the establishmentof reference ranges for uterine artery mean PI, covering the preg-nancy from 11 to 41 weeks of gestation6. They show that along thenormal course of the pregnancy, there is a regular decrement of PI,indicating that the uterine arteries conversion from resistance vessels(narrow bore) to high capacity vessels (larger bore), is most import-ant to meet the increased demands of blood by the growing foe-tus8,11,34. In contrast, the observation of high resistance patterns inthe uterine arteries of pregnant women was associated with localreduction of blood supply, higher incidence of preeclampsia5,7,8,intrauterine growth retardation11,19,35 and more unfavourable peri-natal outcomes11,35.
Despite the wealth of data in uterine arteries, there is a lack in thestudy of other important vessels as the internal iliac artery, a thick, 3–4 cm long division of the common iliac artery and the main arteryentering the pelvis, whose anterior division gives off the uterineartery.
As such characteristics are relevant in the context of pelvic cir-culation assessment, a longitudinal collection of PIs and RIs of IIA
and UtA was made in every trimester of uneventful pregnancies ofhealthy women. As expected, mean UtA-PI and UtA-RI valuesshowed statistically significant progressive decreases from the 1st tothe 3rd trimester of pregnancy, a necessary adaptation that is consist-ent with the foetal trophoblast cell invasion of the walls of spiralarteries (the arteriolar tips of the uterine artery successive branch-ing), the process regarded as underlying the uterine arteries changefrom resistance into capacitance vessels.
In notorious contrast with the uterine artery, the IIA-PI and IIA-RI evidenced a remarkable increase in the same period. To the best ofour knowledge, this is the first time such findings are reported.
This change is quite interesting because, although the internal iliacartery immediately precedes the uterine artery, it exhibits an entirelydistinct performance. In fact, instead of becoming a capacitancevessel, the internal iliac arteries behaved much like resistance vesselsand their progressive RI and PI increase reflect an enhanced bloodvelocity, similarly to the previous observation in the common iliacartery3.
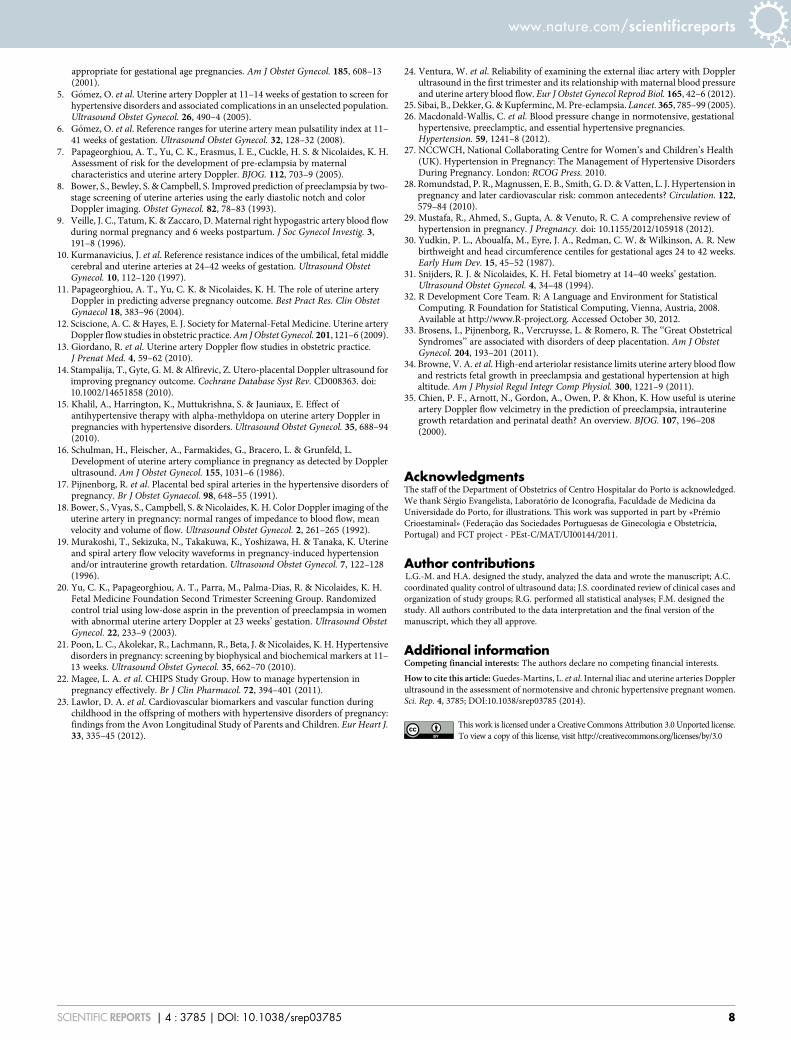
These findings favour the view that along the pregnancy there is anadaptation of the mother circulation to the growing foetus so that thelow resistance uterine artery is rapidly filled by the enhanced mater-nal cardiac output and flow velocity of the internal iliac artery(Figure 4). Moreover, the adaptation is progressive as the trimes-ter-related upward shift of IIA to UtA proportion evidenced. Weare convinced that this change provides the local circulation with areserve capacity that meets the growing foetal needs.
The pregnancy condition also appears to allow the adaptability inanother stable, yet different, hemodynamic condition as is the case oflong term hypertensive, non-medicated women. They are known to
Figure 2 | Predicted mean PI (A) and RI (B) indices for IIA and UtA during pregnancy in normotensive (dashed line, circles) and hypertensive (solidline, triangles) women in the condition of UtA notch absence (left charts) or presence (right charts). Gray bars: 95% confidence intervals for the
prediction. PI and RI: Pulsatility and resistance indices; IIA and UtA: Internal Iliac and uterine arteries.
www.nature.com/scientificreports
SCIENTIFIC REPORTS | 4 : 3785 | DOI: 10.1038/srep03785 5
be at risk for developing preeclampsia and intrauterine growthretardation, but coursed with an uneventful pregnancy and delivereda healthy infant.
The present study showed that the uterine and internal iliac arter-ies exhibit a performance that parallel the normotensive condition,although at a slightly different level of PI and RI. Therefore, a hemo-dynamic adaptation is likely to have occurred, probably even beforepregnancy, as the 1st trimester PI and RI values of both arteriesalready evidence. The relative changes established within PIs andRIs, show that in hypertensive pregnant women too, a high velocityflow coming from the internal iliac artery feeds the large capacityuterine arteries and placental intervillous space with nutrient andoxygen rich blood in a progressive, regular pattern.
From this comparison and the elimination of confounding vari-ables, a model emerged indicating that perfusion of the pregnantuterus is not dependent on the mother’s age, parity or hypertensivestatus. Rather, it appears to depend on pelvic circulation regulatorymechanisms that sense the local needs and adapt the arterial flowproperties immediately upon entering the pelvis, endowing theinternal iliac artery with a determinant role in uterine perfusion.
The specifics of these adaptive hemodynamic mechanisms andhow they interact with the structural placental bed changes areunknown. Similarly, it is uncertain whether these findings, collectedfrom stable conditions, are affected by risk factors known to lead torapidly changing vascular features and pregnancy complications.The fact that the hypertensive condition puts the PIs and RIs of botharteries at different levels, suggests that their evaluation will be bene-ficial to high risk pregnancy assessment.
In summary, the distinct impedances of internal iliac and uterinehere shown in normotensive and chronic hypertensive pregnantwomen are evidence of a resistance vessel that precedes a typicalcapacitance vessel. Moreover, apart from the novelty of the IIA data,the results and the developed model suggest a continuous local cir-culatory adaptation to meet the needs of the growing foetus. Theyalso point to IIA as an accessible, interesting additional target for theprognostic study of obstetrical disorders with major vascularcomponent.
In conclusion, the impedance of the internal iliac artery of nor-motensive and hypertensive women evidences a progressive increasealong the pregnancy, which contrasts notably with the decreasingtrend of the uterine artery. This variation adjusts to a model of acontinuous filling of the uterine artery by an adaptive internal iliacartery, suggesting a local regulatory mechanism imparted by thepregnancy condition.
MethodsSubjects. The research protocol was approved by the local ethics committee [Ref. 133/10(086-DEFI/126-CES)] of Centro Hospitalar do Porto, Unidade Maternidade JulioDinis (CHP-MJD) and all subjects gave their informed consent upon adequateexplanation.
From January 2010 and December 2012, a total of 152 pregnant caucasian womenwere recruited to the study employing as basic criteria to be healthy or to have stablechronic hypertension without known target organ involvement. They had beenreferred by their family doctors to the CHP-MJD according to local pregnancy healthpolicies.
In the first appointment, that coincided with the first ultrasound evaluation, theywere observed by a senior specialist who reviewed the patient’s history, verified theabsence of diabetes and other endocrine disorders, immune diseases, renal andstructural heart diseases, haematological conditions and chronic infections; it was
Figure 3 | Relative changes of IIA to UtA PI (top panels) and RI (bottom panels) along the pregnancy in normotensive (dashed line, circles) andhypertensive (solid line, triangles) women in the condition of UtA notch absence (left charts) or presence (right charts). Gray bars: 95% confidence
intervals for the prediction. Notice the different y-axis scale for PI and RI. PI and RI: Pulsatility and resistance indices; IIA and UtA: Internal Iliac and
uterine arteries.
www.nature.com/scientificreports
SCIENTIFIC REPORTS | 4 : 3785 | DOI: 10.1038/srep03785 6
also checked the gestational age (GA) by sonography between 11 and 14 weeks andmeasured the blood pressure (BP). None of the women had a history of preeclampsia(PE) and only 1 reported having had hypertension during a previous pregnancy.Acceptable medication was folic acid, vitamin and iron supplements and acetylsa-licylic acid, 100 mg per day, prescribed to all hypertensive women since the firstappointment, until the last Doppler data collection.
Hypertension (HT) was defined as systolic BP $140 mmHg and/or diastolic BP$90 mmHg, present before pregnancy or the 20th week26–29. Mild to moderatehypertension in pregnancy was considered as systolic BP 140 to 159 or diastolic BP of90 to 109 mm Hg, which corresponds closely to stage 1 of essential hypertension,defined as systolic 140 to 159 mmHg or diastolic 90 to 99 mm Hg27. An average oftwo BP measurements after a 4 hours period of rest was calculated.
All women were then enrolled in a longitudinal prospective study which included atrimestral ultrasound evaluation (centred at 13.04 6 0.68, 20.73 6 0.78 and 30.46 6
1.19 weeks) and the recommended regular blood tests. Body Mass Index (BMI) wasdetermined upon biometrical data collected at the hospital, before the first ultrasoundevaluation.
Along the follow-up, a close attention was put on the appearance of abnormalconditions in the mother and foetus. These included foetal abnormal Dopplerultrasound indices in the umbilical and middle cerebral arteries, and foetal growth,10th and .90th percentile30,31. Moreover, as all women delivered at CHP-MJD, thehealthy condition of the infant was verified by a neonatologist at birth and one monthlater.
In the follow-up, 49 women (32.2%) were excluded because of events occurringalong the pregnancy. These were diabetes (n 5 13), psychiatric disorders (n 5 8),need of chronic medication beyond the established (n 5 4), autoimmune disease (n 5
4), later refusal to participate (n 5 1), foetal/newborn pathology (n 5 4) and failedsonographic evaluation at the defined schedule (n 5 15).
Therefore, at the end, among the 103 women who were enrolled in the study, 72were normotensive (NT) and 31 had chronic hypertension (HT).
Doppler flow study. The Doppler flow study of both right and left internal iliac anduterine arteries was made immediately before the routine trimestral transabdominalobstetrical ultrasound scan employing a Voluson E8 or a Voluson 730 Pro (GEHealthcare Technologies, USA) device, equipped with multifrequency transvaginaland transabdominal transducers.
All measurements were performed by a single investigator with extensive experi-ence in Doppler ultrasound (A.C.), in order to minimize inter-observer variability.Smokers were required to abstain from smoking for at least 2 h prior to examination.
For the exam, the probe was placed on the lower quadrants of the abdomen, angledmedially and colour Doppler imaging was used to localize the UtA at its crossing overthe external iliac artery. A minor movement of the probe towards the flanks, com-
plemented with a slight medial rotation, evidenced the common iliac artery and itsdivision. As soon as the internal iliac artery was identified, the measurement wasmade at right and left sides. The procedure became rather easy upon a brief period oftraining.
In all cases, after an angle less than 30u was assured and pulsed Doppler probe wasplaced over the whole vessel width, IIA measurements were collected next to thebifurcation of the common iliac artery (Figure 1A). Angle correction was then appliedand the signal updated until three similar consecutive waveforms were evidenced, justbefore calculating left and right uterine arteries PI and RI, using the software of thedevice (Figure 1B).
The presence or absence of a bilateral early protodiastolic notch in UtA was noted(Figure 1C, D). A positive notch was defined as a persistent decrease in blood flowvelocity in early diastole, below the diastolic peak velocity in at least one UtA Dopplerultrasound spectrum. According to the same reasoning, absence of notch was definedby its bilateral absence.
Statistical analysis. Univariate data analysis comprised standard statistical methods:the chi-square test or the Fisher test (as adequate) for the study of independenceamongst two factors, and the t-test for the assessment of statistically significantdifferences across means in two independent populations.
Multiple linear regression models with errors that were allowed to be correlatedand/or to have unequal variances were fitted using generalized least squares.Multivariate regression had to be considered due to the experiment’s nature: twodifferent indexes were read on two different vessels for the same set of individuals,once at each trimester of the pregnancy. We looked for adequate global models andcompared the curves (as functions of time but adjusted for potential confounders)instead of only doing comparison of mean indices between different time points.
The response variable read for index d (PI or RI), at vessel v (UtA or IIA), in asubject presenting notching at the first trimester with the status s (present or absent)and hypertension with the status h (hypertensive or normotensive), at (continuous)time t was denoted by R(d,v,s,h,t). Dummy variables had to be considered for theindex, vessel, status of notching at the first trimester and status of hypertension;reference categories were taken to be the resistance index, internal iliac artery, thenormotensive status and the non-existence of unilateral notching at the first tri-mester, respectively. The fitted model was
R d,v,s,h,tð Þ~b0 d,v,s,h,d 1 v,s 1 d,s 1 v,h 1 d,h 1 vð Þzb1 d,v,d 1 v,hð Þtze
with residuals e following a normal distribution with zero mean and with a variance-covariance matrix that allowed for a time autocorrelation structure of order 1 and fordifferent variances across the indexes. In the above formula, the intercept coefficientb0 is a function of the index, vessel, hypertensive status, unilateral notching status, andtheir two-way interactions, while the time-slope coefficient b1 is a function of theindex, vessel, and their interaction.
In order to understand the dynamic transition of each index (PI and RI) from theinternal iliac artery to the uterine vessels, a model for the relative change was con-sidered employing the quotient: (IIA index value – UtA index value)/(IIA indexvalue). More precisely, for each of the indexes, the difference between its values on theinternal iliac and uterine arteries was divided by the value read at the internal iliacartery for each trimester. Again a multiple regression model with correlated andheteroscedastic errors was adjusted, via generalized least squares.
Similarly to above, the response variable representing the proportion read for fixedindex d, hypertensive status h, unilateral notching status s and time t, was denoted byP(d,h,s,t). Dummy variables had to be considered for the index, status of unilateralnotching at the first trimester and the status of hypertension; reference categorieswere taken to be the resistance index, the normotensive status and the non-existenceof unilateral notching at the first trimester, respectively. The fitted model was
P d,h,s,tð Þ~b0 d,h,d 1 h,sð Þzb1 d,sð Þtze
with an intercept coefficient b0 depending on d, h, s and the interaction term d*h, atime-slope coefficient depending on d and s, and residuals e following a normaldistribution with zero mean and with a variance-covariance matrix that allowed for atime autocorrelation structure of order 1 and for different variances across theindexes.
Final regression models were chosen on the basis of the lowest BIC (BayesianInformation Criterion). All statistical analyses were carried out using the R languageand software environment for statistical computation, version 2.12.132. The signifi-cance level was fixed at 0.05, as usual.
1. Robson, S. C., Hunter, S., Boys, R. J. & Dunlop, W. Serial study of factorsinfluencing changes in cardiac output during human pregnancy. Am J Physiol.256, H1060–5 (1989).
2. Mabie, W. C., DiSessa, T. G., Crocker, L. G., Sibai, B. M. & Arheart, K. L. Alongitudinal study of cardiac output in normal human pregnancy. Am J ObstetGynecol. 170, 849–56 (1994).
3. Palmer, S. K. et al. Quantitative estimation of human uterine artery blood flow andpelvic blood flow redistribution in pregnancy. Obstet Gynecol. 80, 1000–6 (1992).
4. Konje, J. C., Kaufmann, P., Bell, S. C. & Taylor, D. J. A longitudinal study ofquantitative uterine blood flow with the use of color power angiography in
Figure 4 | The internal iliac artery (IIA) precedes the uterine artery (UtA)but has a distinct impedance pattern along the pregnancy. Unlike the
capacitance ability of the UtA, whose resistance reduces, the IIA exhibits a
progressive increase.
www.nature.com/scientificreports
SCIENTIFIC REPORTS | 4 : 3785 | DOI: 10.1038/srep03785 7
appropriate for gestational age pregnancies. Am J Obstet Gynecol. 185, 608–13(2001).
5. Gomez, O. et al. Uterine artery Doppler at 11–14 weeks of gestation to screen forhypertensive disorders and associated complications in an unselected population.Ultrasound Obstet Gynecol. 26, 490–4 (2005).
6. Gomez, O. et al. Reference ranges for uterine artery mean pulsatility index at 11–41 weeks of gestation. Ultrasound Obstet Gynecol. 32, 128–32 (2008).
7. Papageorghiou, A. T., Yu, C. K., Erasmus, I. E., Cuckle, H. S. & Nicolaides, K. H.Assessment of risk for the development of pre-eclampsia by maternalcharacteristics and uterine artery Doppler. BJOG. 112, 703–9 (2005).
8. Bower, S., Bewley, S. & Campbell, S. Improved prediction of preeclampsia by two-stage screening of uterine arteries using the early diastolic notch and colorDoppler imaging. Obstet Gynecol. 82, 78–83 (1993).
9. Veille, J. C., Tatum, K. & Zaccaro, D. Maternal right hypogastric artery blood flowduring normal pregnancy and 6 weeks postpartum. J Soc Gynecol Investig. 3,191–8 (1996).
10. Kurmanavicius, J. et al. Reference resistance indices of the umbilical, fetal middlecerebral and uterine arteries at 24–42 weeks of gestation. Ultrasound ObstetGynecol. 10, 112–120 (1997).
11. Papageorghiou, A. T., Yu, C. K. & Nicolaides, K. H. The role of uterine arteryDoppler in predicting adverse pregnancy outcome. Best Pract Res. Clin ObstetGynaecol 18, 383–96 (2004).
12. Sciscione, A. C. & Hayes, E. J. Society for Maternal-Fetal Medicine. Uterine arteryDoppler flow studies in obstetric practice. Am J Obstet Gynecol. 201, 121–6 (2009).
13. Giordano, R. et al. Uterine artery Doppler flow studies in obstetric practice.J Prenat Med. 4, 59–62 (2010).
14. Stampalija, T., Gyte, G. M. & Alfirevic, Z. Utero-placental Doppler ultrasound forimproving pregnancy outcome. Cochrane Database Syst Rev. CD008363. doi:10.1002/14651858 (2010).
15. Khalil, A., Harrington, K., Muttukrishna, S. & Jauniaux, E. Effect ofantihypertensive therapy with alpha-methyldopa on uterine artery Doppler inpregnancies with hypertensive disorders. Ultrasound Obstet Gynecol. 35, 688–94(2010).
16. Schulman, H., Fleischer, A., Farmakides, G., Bracero, L. & Grunfeld, L.Development of uterine artery compliance in pregnancy as detected by Dopplerultrasound. Am J Obstet Gynecol. 155, 1031–6 (1986).
17. Pijnenborg, R. et al. Placental bed spiral arteries in the hypertensive disorders ofpregnancy. Br J Obstet Gynaecol. 98, 648–55 (1991).
18. Bower, S., Vyas, S., Campbell, S. & Nicolaides, K. H. Color Doppler imaging of theuterine artery in pregnancy: normal ranges of impedance to blood flow, meanvelocity and volume of flow. Ultrasound Obstet Gynecol. 2, 261–265 (1992).
19. Murakoshi, T., Sekizuka, N., Takakuwa, K., Yoshizawa, H. & Tanaka, K. Uterineand spiral artery flow velocity waveforms in pregnancy-induced hypertensionand/or intrauterine growth retardation. Ultrasound Obstet Gynecol. 7, 122–128(1996).
20. Yu, C. K., Papageorghiou, A. T., Parra, M., Palma-Dias, R. & Nicolaides, K. H.Fetal Medicine Foundation Second Trimester Screening Group. Randomizedcontrol trial using low-dose asprin in the prevention of preeclampsia in womenwith abnormal uterine artery Doppler at 23 weeks’ gestation. Ultrasound ObstetGynecol. 22, 233–9 (2003).
21. Poon, L. C., Akolekar, R., Lachmann, R., Beta, J. & Nicolaides, K. H. Hypertensivedisorders in pregnancy: screening by biophysical and biochemical markers at 11–13 weeks. Ultrasound Obstet Gynecol. 35, 662–70 (2010).
22. Magee, L. A. et al. CHIPS Study Group. How to manage hypertension inpregnancy effectively. Br J Clin Pharmacol. 72, 394–401 (2011).
23. Lawlor, D. A. et al. Cardiovascular biomarkers and vascular function duringchildhood in the offspring of mothers with hypertensive disorders of pregnancy:findings from the Avon Longitudinal Study of Parents and Children. Eur Heart J.33, 335–45 (2012).
24. Ventura, W. et al. Reliability of examining the external iliac artery with Dopplerultrasound in the first trimester and its relationship with maternal blood pressureand uterine artery blood flow. Eur J Obstet Gynecol Reprod Biol. 165, 42–6 (2012).
25. Sibai, B., Dekker, G. & Kupferminc, M. Pre-eclampsia. Lancet. 365, 785–99 (2005).26. Macdonald-Wallis, C. et al. Blood pressure change in normotensive, gestational
hypertensive, preeclamptic, and essential hypertensive pregnancies.Hypertension. 59, 1241–8 (2012).
27. NCCWCH, National Collaborating Centre for Women’s and Children’s Health(UK). Hypertension in Pregnancy: The Management of Hypertensive DisordersDuring Pregnancy. London: RCOG Press. 2010.
28. Romundstad, P. R., Magnussen, E. B., Smith, G. D. & Vatten, L. J. Hypertension inpregnancy and later cardiovascular risk: common antecedents? Circulation. 122,579–84 (2010).
29. Mustafa, R., Ahmed, S., Gupta, A. & Venuto, R. C. A comprehensive review ofhypertension in pregnancy. J Pregnancy. doi: 10.1155/2012/105918 (2012).
30. Yudkin, P. L., Aboualfa, M., Eyre, J. A., Redman, C. W. & Wilkinson, A. R. Newbirthweight and head circumference centiles for gestational ages 24 to 42 weeks.Early Hum Dev. 15, 45–52 (1987).
31. Snijders, R. J. & Nicolaides, K. H. Fetal biometry at 14–40 weeks’ gestation.Ultrasound Obstet Gynecol. 4, 34–48 (1994).
32. R Development Core Team. R: A Language and Environment for StatisticalComputing. R Foundation for Statistical Computing, Vienna, Austria, 2008.Available at http://www.R-project.org. Accessed October 30, 2012.
33. Brosens, I., Pijnenborg, R., Vercruysse, L. & Romero, R. The ‘‘Great ObstetricalSyndromes’’ are associated with disorders of deep placentation. Am J ObstetGynecol. 204, 193–201 (2011).
34. Browne, V. A. et al. High-end arteriolar resistance limits uterine artery blood flowand restricts fetal growth in preeclampsia and gestational hypertension at highaltitude. Am J Physiol Regul Integr Comp Physiol. 300, 1221–9 (2011).
35. Chien, P. F., Arnott, N., Gordon, A., Owen, P. & Khon, K. How useful is uterineartery Doppler flow velcimetry in the prediction of preeclampsia, intrauterinegrowth retardation and perinatal death? An overview. BJOG. 107, 196–208(2000).
AcknowledgmentsThe staff of the Department of Obstetrics of Centro Hospitalar do Porto is acknowledged.We thank Sergio Evangelista, Laboratorio de Iconografia, Faculdade de Medicina daUniversidade do Porto, for illustrations. This work was supported in part by «PremioCrioestaminal» (Federaçao das Sociedades Portuguesas de Ginecologia e Obstetrıcia,Portugal) and FCT project - PEst-C/MAT/UI00144/2011.
Author contributionsL.G.-M. and H.A. designed the study, analyzed the data and wrote the manuscript; A.C.coordinated quality control of ultrasound data; J.S. coordinated review of clinical cases andorganization of study groups; R.G. performed all statistical analyses; F.M. designed thestudy. All authors contributed to the data interpretation and the final version of themanuscript, which they all approve.
Additional informationCompeting financial interests: The authors declare no competing financial interests.
How to cite this article: Guedes-Martins, L. et al. Internal iliac and uterine arteries Dopplerultrasound in the assessment of normotensive and chronic hypertensive pregnant women.Sci. Rep. 4, 3785; DOI:10.1038/srep03785 (2014).
This work is licensed under a Creative Commons Attribution 3.0 Unported license.To view a copy of this license, visit http://creativecommons.org/licenses/by/3.0
www.nature.com/scientificreports
SCIENTIFIC REPORTS | 4 : 3785 | DOI: 10.1038/srep03785 8