internal curing of high performance concrete using
TRANSCRIPT

American University in Cairo American University in Cairo
AUC Knowledge Fountain AUC Knowledge Fountain
Theses and Dissertations Student Research
6-1-2016
Internal curing of high performance concrete using lightweight Internal curing of high performance concrete using lightweight
and recycled aggregates and recycled aggregates
Mohamed Afifi
Follow this and additional works at: https://fount.aucegypt.edu/etds
Recommended Citation Recommended Citation
APA Citation Afifi, M. (2016).Internal curing of high performance concrete using lightweight and recycled aggregates [Master's Thesis, the American University in Cairo]. AUC Knowledge Fountain. https://fount.aucegypt.edu/etds/247
MLA Citation Afifi, Mohamed. Internal curing of high performance concrete using lightweight and recycled aggregates. 2016. American University in Cairo, Master's Thesis. AUC Knowledge Fountain. https://fount.aucegypt.edu/etds/247
This Master's Thesis is brought to you for free and open access by the Student Research at AUC Knowledge Fountain. It has been accepted for inclusion in Theses and Dissertations by an authorized administrator of AUC Knowledge Fountain. For more information, please contact [email protected].

The American University in Cairo
The School of Sciences and Engineering
INTERNAL CURING OF HIGH PERFORMANCE
CONCRETE USING LIGHTWEIGHT AND RECYCLED
AGGREGATES
A Thesis Submitted to
The Department of Construction Engineering
In partial fulfillment of the requirements for the degree of
Masters of Science in Construction Engineering
By
Mohamed Sameer Afifi
B.Sc. in Construction Engineering, 2013
The American University in Cairo
Under the supervision of
Dr. Mohamed Nagib Abou-Zeid
Dean of The School of Sciences and Engineering
Professor, The Department of Construction Engineering
The American University in Cairo
April 2016
i
DEDICATION
This thesis work is dedicated to my wife, Reem, who has been a constant source of
support and encouragement during the challenges of graduate school and life. This thesis
is just the beginning.
This thesis is also dedicated to Hany Abdel Rahman, my 4th grade teacher who passed
away in March 2013. May your soul rest in peace. Thanks for everything you taught me.

ii
ACKNOWLEDGEMENTS
In the Name of Allah, the Most Merciful, the Most Compassionate all praise be to Allah,
the Lord of the worlds; and prayers and peace be upon Mohamed His servant and
messenger.
There are a number of people without whom this thesis might not have been written, and
to whom I am greatly indebted.
I am thankful to Prof. Dr. Mohamed Nagib Abou-Zeid for his patience and guidance. He
has been very generous with his knowledge, and his trust in my abilities has made my
journey more rewarding. It has been a pleasure working under his supervision.
To my wife, Reem, who continues to learn, grow and develop and who has been a source
of encouragement and inspiration to me throughout my life, a very special thank you for
providing a ‘writing space’ and for nurturing me through the months of writing. And also
for the myriad of ways in which, throughout my life, you have actively supported me in
my determination to find and realize my potential, and to make this contribution to our
world.
Loving thanks to my friends and learning partners, Abdel-Monem, Sirag, Mansour and
Shalakany, who played such important roles along the journey, as we mutually engaged
in making sense of the various challenges we faced and in providing encouragement to
each other at those times when it seemed impossible to continue.

iii
ABSTRACT
Concrete curing is of paramount importance in order for concrete to meet performance
requirements. Conventionally, curing has been conducted by means of water sparkling,
wet burlap or a curing compound. For performance and environmental reasons, internal
curing has been gaining increased attention. However, more data is needed for the
effectiveness of this curing technique when used in various concrete mixtures.
This investigation addresses potential utilization of internal curing in high performance
concrete (HPC). Internal curing was introduced by means of three aggregates: perlite,
pumice and recycled aggregates; all of which were incorporated into HPC mixtures.
Conventional mixtures were prepared and were thoroughly cured either by water or by a
curing compound or left non-cured. Fresh concrete and Hardened concrete properties
were assessed including slump, unit weight, compressive and flexural strength, and
durability tests as shrinkage assessment, rapid chloride permeability test (RCPT) and
abrasion resistance. Experimental work is backed up with a simplified feasibility analysis
with case study, incorporating initial and future costs to better judge potential of this
technique.
The outcome of this study uncovers that the addition of pre-wetted lightweight aggregates
can prompt an enhancement in concrete workability and durability accompanied by a
reduced shrinkage. Compressive and flexural strengths decreased with the increased
replacement dosages, however several dosages were tested to reach a figure of optimum
replacement. Results of this study reveal the potential of this technology in saving fresh
water as well as the costs saved in maintenance and rehabilitation works.
Keywords: (Internal, Curing, High Performance, Concrete, Perlite, Recycled, Pumice)
iv
TABLE OF CONTENTS
DEDICATION ..................................................................................................................... i
ACKNOWLEDGEMENTS ................................................................................................ ii
ABSTRACT ....................................................................................................................... iii
CHAPTER 1: INTRODUCTION ....................................................................................... 1
1.1 BACKGROUND ................................................................................................... 1
1.2 HIGHLIGHTS ON EGYPT’S INFRASTRUTURE BOOM ................................ 5
1.3 RESEARCH MOTIVATION ................................................................................ 7
1.4 RESEARCH OBJECTIVES AND SCOPE ........................................................... 7
1.5 RESEARCH METHODOLOGY........................................................................... 8
1.6 ORGANIZATION OF CHAPTERS ..................................................................... 8
CHAPTER 2: LITERATURE REVIEW .......................................................................... 10
2.1 INTRODUCTION ............................................................................................... 10
2.2 HISTORY AND DEVELOPMENT .................................................................... 10
2.3 THEORY ............................................................................................................. 12
2.4 PRACTICE: MIX PPROPORTIONING ............................................................. 14
2.5 LAB STUDIES .................................................................................................... 17
2.5.1 PLASTIC SHRINKAGE ................................................................................. 17
2.5.2 AUTOGENOUS SHRINKAGE & RELATIVE HUMIDITY ........................ 19
2.5.3 STRENGTH & ELASTIC MODULUS .......................................................... 21

v
2.5.4 CREEP ............................................................................................................. 23
2.5.5 CURLING AND WARPING .......................................................................... 24
2.5.6 TRANSPORT COEFFICIENTS AND SERVICE LIFE ................................. 24
2.6 FIELD EXPERIENCES....................................................................................... 27
2.7 POTENTIAL OF INTERNAL CURING ............................................................ 29
2.8 SUPPOSITIONS .................................................................................................. 30
CHAPTER 3: METHODOLOGY .................................................................................... 32
3.1 GENERAL ........................................................................................................... 32
3.2 MATERIALS AND PROPORTIONING ............................................................ 32
3.2.1 PORTLAND CEMENT ................................................................................... 33
3.2.2 FINE AGGREGATES ..................................................................................... 33
3.2.3 COARSE AGGREGATES .......................................................................... 35
3.2.4 RECYCLED AGGREGATES ..................................................................... 36
3.2.5 LIGHTWEIGHT AGGREGATES .............................................................. 37
3.2.6 ADMIXTURES ........................................................................................... 39
3.2.7 MIXING AND CURING WATER ............................................................. 39
3.2.8 CURING COMPOUND .............................................................................. 39
3.2.9 MIXTURE PROPORTIONING .................................................................. 40
3.3 EXPERIMENTAL WORK .................................................................................. 43
3.3.1 AGGREGATES TESTING ............................................................................. 43

vi
3.3.2 CEMENT TESTING ....................................................................................... 44
3.3.3 SPECIMEN PREPARATION ......................................................................... 44
3.3.4 MIXING ........................................................................................................... 45
3.3.5 CASTING ........................................................................................................ 46
3.3.6 CURING .......................................................................................................... 46
3.3.7 FRESH TESTING ........................................................................................... 47
3.3.8 HARDENED CONCRETE TESTING ............................................................ 47
3.3.9 DURABILITY TESTING ............................................................................... 47
CHAPTER 4: RESULTS AND DISCUSSION ................................................................ 49
4.1 FRESH TESTING ............................................................................................... 49
4.1.1 SLUMP ............................................................................................................ 50
4.1.2 AIR CONTENT ............................................................................................... 51
4.1.3 UNIT WEIGHT ............................................................................................... 53
4.1.4 TEMPEREATURE .......................................................................................... 54
4.2 HARDENED TESTING ...................................................................................... 56
4.2.1 COMPRESSIVE STRENGTH ........................................................................ 57
4.2.2 FLEXURAL STRENGTH ............................................................................... 60
4.2.3 FLEXURAL STRENGTH TO COMPRESSIVE STRENGTH RATIO ......... 63
4.3 DURABILITY TESTING ................................................................................... 64
4.3.1 SHRINKAGE ASSESSMENT ........................................................................ 64

vii
4.3.2 RAPID CHLORIDE PERMEABILITY TEST (RCPT) .................................. 67
4.3.3 ABRASION TEST........................................................................................... 69
CHAPTER 5: PRELMINARY FEASIBILITY ANALYSIS ........................................... 71
5.1 AVAILABILITY ................................................................................................. 71
5.2 SPECIAL EQUIPMENT ..................................................................................... 71
5.3 TRANSPORTATION .......................................................................................... 72
5.4 WATER ............................................................................................................... 73
5.5 SIMPLE LIFE CYCLE COST ANALYSIS ........................................................ 74
5.6 CASE STUDY – EGYPT’S NEW CAPITAL..................................................... 79
CHAPTER 6: CONCLUSIONS AND RECOMMENDATIONS .................................... 83
6.1 CONCLUSIONS.................................................................................................. 83
6.2 RECOMMENDATIONS FOR FUTURE WORK .............................................. 86
6.3 RECOMMENDATIONS FOR APPLICATORS ................................................ 87
REFERENCES ................................................................................................................. 88
APPENDIX ..................................................................................................................... 100
APPENDIX A: Tables ................................................................................................ 100
APPENDIX B: Data Sheets of Materials.................................................................... 101
viii
LIST OF FIGURES
Figure 1-1: Effect of Curing time on concrete strength gain (Gonnerman & Shuman,
1928) ................................................................................................................................... 2
Figure 1-2: Water adding curing methods: water spraying (left) - wet burlap (right)
(Foster Supply, 2012).......................................................................................................... 3
Figure 1-3: Sealed curing plastic sheeting (left) - curing compound (right) (Suryakanta,
2014) ................................................................................................................................... 4
Figure 1-4:Illustration of the difference between external & internal curing (Weiss et al.,
2012) ................................................................................................................................... 5
Figure 1-5: Pictures shows the current case of Egypt's Infrastructure, collapsed bridge in
Qalyobiya (left) and deteriorated road (right) (Alwafd, 2016) ........................................... 6
Figure 2-1: Illustrations showing the protected paste volume of two mixtures with similar
LWA replacements of (a) coarse aggregate, and (b) fine aggregate (Henkensiefken, 2008)
........................................................................................................................................... 17
Figure 2-2: Probability distribution of crack width occurrences in concrete with different
replacement volumes of Pre-wetted LWA (Henkensiefken, Briatka, Bentz, Nantung, &
Weiss, 2010) ..................................................................................................................... 18
Figure 2-3: Internal relative humidity (top) and autogenous deformation measurements
(bottom) with various levels of pre-wetted LWA replacement (Henkensiefken, Bentz,
Nantung, & Weiss, 2009).................................................................................................. 20
Figure 2-4: Reduced cracking with increased LWA replacements (Henkensiefken, Bentz,
Nantung, & Weiss, 2009).................................................................................................. 21

ix
Figure 2-5: Influence of internal curing on elastic modulus of specimens (Golias, 2010).
........................................................................................................................................... 22
Figure 2-6: Influence of reduced elastic modulus on residual stress development (Raoufi,
Schlitter, Bentz, & Weiss, 2012). ..................................................................................... 23
Figure 2-7: The diffusivity ratio S/Sc (proportional to the diffusion coefficient) for
w/c=0.4 mortars with and without internal curing (Bentz, Snyder, & Peltz, 2010). ........ 26
Figure 2-8: Service life predictions from deterministic service life models (Cusson,
Lounis, and Daigle, 2010 ) ................................................................................................ 27
Figure 2-9: Left - Internally cured concrete being cast at Bartell Road in New York
(Wolfe, 2010), and Right - Internally cured concrete bridge deck being cast near
Bloomington, IN (Di Bella, Schlitter, & Weiss, 2010). .................................................... 29
Figure 3-1: Demolishing of Science building of the American University in Cairo Tahrir
Campus, October 2015, and crushing the concrete to the desired size. ............................ 37
Figure 3-2: Structural Perlite bag and its grain size compared to crushed sand ............... 38
Figure 3-4: BASF MasterCure 181 was used as a curing compound. It was added to a
sprayer to be sprayed over the finished surface of concrete ............................................. 39
Figure 3-6: Mixing of concrete constituents using 0.06m3 mixer .................................... 45
Figure 3-7: Placing and finishing of concrete specimens ................................................. 46
Figure 3-8: Prisms and apparatus used to perform shrinkage assessment test (Abou-Zeid,
et al. 2015) ........................................................................................................................ 48
Figure 3-9: Setup of the Rapid Chloride Permeability Test ............................................. 48
Figure 4-1: Slump test results for different concrete mixtures ......................................... 50

x
Figure 4-2: Picture showing difference in slump between Conventional mixture (left) and
Perlite mixture (right) ....................................................................................................... 51
Figure 4-3: Air Content test readings for 2 different mixtures ......................................... 52
Figure 4-4: Air content results for different concrete mixtures ........................................ 52
Figure 4-5: Unit weight results for different concrete mixtures ....................................... 54
Figure 4-6: Results of fresh concrete temperature ............................................................ 55
Figure 4-7: Compressive strength results for different concrete mixtures ....................... 59
Figure 4-8: Flexural strength results for different concrete mixtures ............................... 62
Figure 4-9: Flexural Strength to compressive strength ratio for different concrete
mixtures............................................................................................................................. 63
Figure 4-10: Results of Shrinkage test for different concrete mixtures ............................ 66
Figure 4-11: Results of Rapid Chloride Permeability Test (RCPT) ................................. 68
Figure 4-12: Results of Abrasion Test .............................................................................. 70
Figure 5-1: Simple recycled concrete aggregate crusher (Eagle Crushers, 2016) ............ 72
Figure 5-2: Picture showing construction of Ethiopian Grand Dam (Daily news Egypt,
2014) ................................................................................................................................. 74
Figure 5-3: Expenditures over life cycle costs of concrete structures (Cusson et al., 2010)
........................................................................................................................................... 75
Figure 5-4: Cumulative costs of different concrete mixtures over time in years .............. 78
Figure 5-5: Location of New Capital (The Capital Website, 2015) ................................. 79
Figure 5-6: New Capital prototype unveiled in EEDC 2015 (Al-Jazeera, 2015). ............ 81

xi
LIST OF TABLES
Table 3-1: Type I Portland cement characteristics ........................................................... 33
Table 3-2: Typical results of standard testing of the cement used .................................... 33
Table 3-3: Fine aggregates Sieve analysis, % passing ...................................................... 34
Table 3-4: Typical results of standard testing of the fine aggregates used ....................... 34
Table 3-5: Coarse aggregates sieve analysis, % passing .................................................. 35
Table 3-6: Typical results of standard testing of the coarse aggregates used ................... 36
Table 3-7: Conventional Concrete mixture....................................................................... 41
Table 3-8: Mixtures with replacements of Recycled Concrete Aggregates ..................... 41
Table 3-9: Mixtures with replacements of Perlite lightweight aggregates ....................... 42
Table 3-10: Mixtures with replacements of Pumice lightweight aggregates .................... 43
Table 4-1: Fresh Testing Results of all concrete mixtures ............................................... 49
Table 4-2: Hardened concrete test results for different mixtures ..................................... 56
Table 4-3: Durability testing results for different concrete mixtures ............................... 64
Table 5-1: Estimated Cost of different concrete mixtures ................................................ 76
Table 5-2: Life Cycle Cost Analysis of different concrete mixtures ................................ 77
Table 5-3: Assumptions of New Capital Infrastructure, (The Capital Website, 2015) .... 80
Table 5-4: Economical Savings from incorporating ICC in New Capital ........................ 82
Table 5-5: Water Savings from using ICC in New Capital Infrastructure ....................... 82
Table A-1: Detailed Calculations of Present value Life Cycle Cost (PVLCC) of different
concrete mixtures, over a comparison period of 60 years .............................................. 100

1
CHAPTER 1
INTRODUCTION
1.1 BACKGROUND
After placing and finishing of concrete, maintaining adequate moisture and
temperature is of paramount importance; this happens through a process referred to as
Curing. Appropriate curing of concrete structures is vital to assure they meet their
anticipated performance and durability requirements (Kovler and Mejhade, 2007)
(NPCA, 2013) (Babcock and Taylor, 2015) (Joseph, 2016) … to name only some. Proper
curing entails creating the optimum environment to promote the hardening or hydration
of freshly cast concrete (NPCA, 2013). The American concrete Institute (ACI) defines
curing as the process by which hydraulic-cement concrete matures and develops
hardened properties as a result of continued hydration of the cement in the presence of
adequate water and heat (ACI 308R-01, 2015). Hence, an incomplete hydration process
will affect both the strength and durability of produced concrete. Historically known for
its importance, curing has a strong influence on hardened concrete; adequate curing will
aid achieving desired durability, strength, water tightness, abrasion resistance, volume
stability, and resistance to freezing and thawing and deicers (ACI 308R-01, 2015). Also,
defined as maintaining satisfactory moisture content in concrete during its early stages in
order to develop the desired properties (Joseph, 2016).
Water loss, during or after concrete finishing (i.e. evaporation), may delay or
prevent sufficient hydration. The achievement of maximum strength is dependent on the
extent of cement hydration and with proper curing, cement can more fully hydrate and
achieve maximum strength (Bediako et al., 2015). Figure 1-1 is a classical demonstration

2
of the effect of different curing periods on strength gain; it improves quickly at early
ages, and then continues slowly for an indefinite period (Gonnerman & Shuman, 1928).
There is an additional aspect of curing, which is sometimes overlooked. Curing is
carried out not only to promote hydration, but also to minimize shrinkage (Kovler and
Mejhade, 2007). Water loss will cause the concrete to shrink introducing tensile stresses
that may cause surface cracking. In High performance concrete (HPC); concrete with
high cement content and low w/c ratio, a major concern is self-desiccation, which is
internal drying of concrete due to the consumption of water by hydration (Neville 1996;
Parrot 1986; Patel et al. 1988, Spears 1983). Self desiccation results in hindered strength
development, reduced durability and potential for autogenous shrinkage and cracking
(Weiss et al., 2010). Historical records prove that if no sufficient water is provided, the
paste can self-desiccate preventing concrete from achieving targeted properties.
Appropriate mitigation methods to reduce shrinkage in combination with careful curing
practices should be used to minimize and control shrinkage (Huo and Wong 2000).
Figure 1-1: Effect of Curing time on concrete strength gain (Gonnerman & Shuman, 1928)

3
There are various techniques for curing; external & Internal Curing. Most of the
traditional methods are based on external curing. Generally, external curing can be
grouped as follows (Aitcin, 1998):
Water Adding Curing – by supplying additional moisture to prevent/compensate
water loss. This is achieved by water ponding, water spraying/sparkling, or by
water coverings such as wet burlap. As shown in Figure 1-2 (Foster Supply, 2012)
Sealed curing – by preventing the loss of moisture. This is achieved by
Waterproof paper, plastic sheeting, and membrane forming compounds (also
known as curing compounds). Shown in Figure 1-3 (Suryakanta, 2014).
Figure 1-2: Water adding curing methods: water spraying (left) - wet burlap (right) (Foster
Supply, 2012)

4
Figure 1-3: Sealed curing plastic sheeting (left) - curing compound (right) (Suryakanta,
2014)
Internal curing is another concept of curing concrete, which is basically
incorporation of a component that serves as curing agent to the concrete mixture. As
defined by ACI, process by which the hydration of cement continues because of the
availability of internal water that is not part of the mixing water (ACI 213-03R, 2012).
Internal curing can be classified as follows:
Internal Water Curing – embedded component is a water reservoir that gradually
releases water into the system. The most popular methods are pre-wetted light
weight aggregates and super absorbent polymers (SAP).
Internal Sealing – component is meant to delay or prevent water loss from the
system by adding special types of chemicals to mixing water (Kovler and
Mejhade, 2007)
Internal curing proved to be promising in producing concrete with increased resistance to
early-age cracking and enhanced durability (Bentz and Weiss, 2011). This is due to the
enhanced curing reach inside the concrete section as illustrated in Figure 1-4,

5
conventional external curing provides curing mainly to outer concrete surface whereas in
internal curing, water is simultaneously distributed inside of concrete and hence provide
more uniform and extended curing of concrete (Abou-Zeid, 2015)
Figure 1-4:Illustration of the difference between external & internal curing (Weiss et al.,
2012)
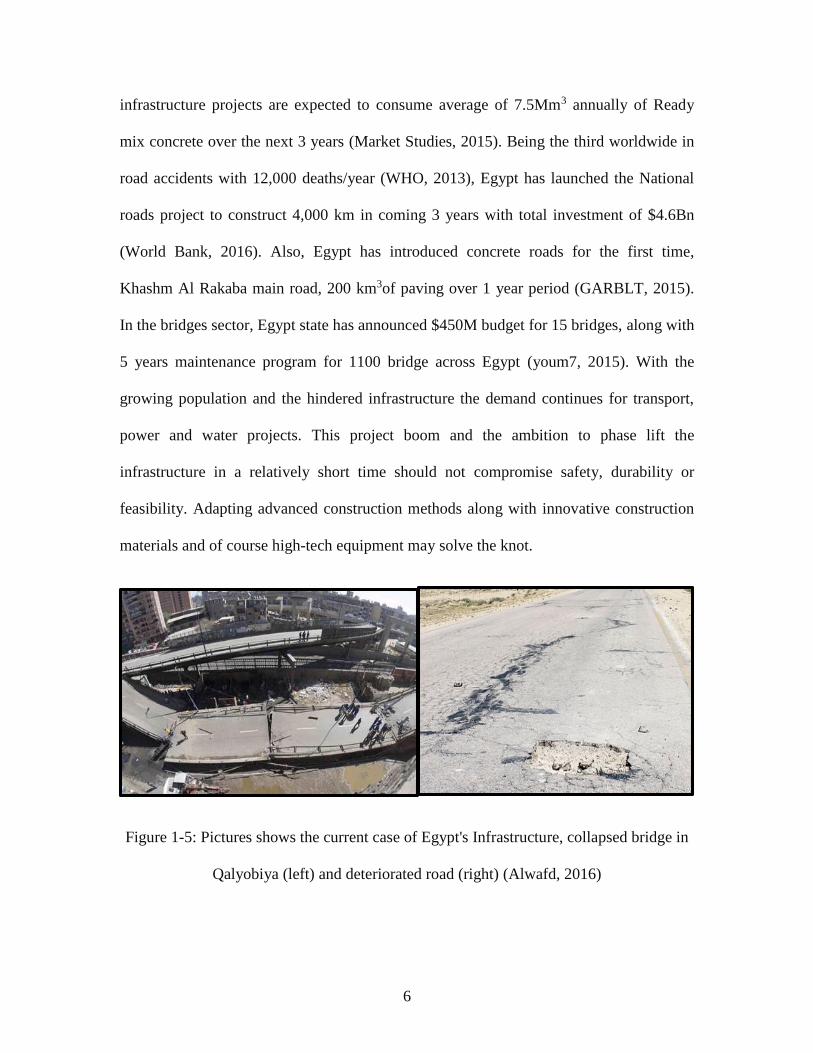
1.2 HIGHLIGHTS ON EGYPT’S INFRASTRUTURE BOOM
After the long period of projects recession that Egypt has experienced over the
period of 2011-2014, the Egyptian economy is expected to recover after the resolution of
the political instability. This rise up is coupled with a huge backlog in many projects.
Needless to say, infrastructure projects, represented in bridges, roads, tunnels, power
plants and water structures (water/waste water treatment plants), are expected to boom in
a very short period. Earlier in 2015, the state announced investment budget of $40Bn
over the period of 2015-2018 dedicated for series of construction and repairs
infrastructure projects which was announced during the Egyptian Economic
Development Conference (EEDC) held in Sharm El Sheikh, March 2015. Egypt
6
infrastructure projects are expected to consume average of 7.5Mm3 annually of Ready
mix concrete over the next 3 years (Market Studies, 2015). Being the third worldwide in
road accidents with 12,000 deaths/year (WHO, 2013), Egypt has launched the National
roads project to construct 4,000 km in coming 3 years with total investment of $4.6Bn
(World Bank, 2016). Also, Egypt has introduced concrete roads for the first time,
Khashm Al Rakaba main road, 200 km3of paving over 1 year period (GARBLT, 2015).
In the bridges sector, Egypt state has announced $450M budget for 15 bridges, along with
5 years maintenance program for 1100 bridge across Egypt (youm7, 2015). With the
growing population and the hindered infrastructure the demand continues for transport,
power and water projects. This project boom and the ambition to phase lift the
infrastructure in a relatively short time should not compromise safety, durability or
feasibility. Adapting advanced construction methods along with innovative construction
materials and of course high-tech equipment may solve the knot.
Figure 1-5: Pictures shows the current case of Egypt's Infrastructure, collapsed bridge in
Qalyobiya (left) and deteriorated road (right) (Alwafd, 2016)

7
1.3 RESEARCH MOTIVATION
This study is of crucial importance particularly in these days of Egyptian
economical rise up. As discussed in section 1.2, the infrastructure boom will increase the
need for high productivity and high performing structures without compromising
durability or feasibility. In addition to Egypt’s water scarcity challenge, makes it very
important to use resources wisely. Two main aspects have the major contribution behind
this study: (1) Egypt’s need for durable structures for its strategic projects, and (2)
Feasibility and Environmental aspects that should be carefully studied and adapted.
1.4 RESEARCH OBJECTIVES AND SCOPE
This investigation aims at exploring the influence of internal curing on the
properties of high performance concrete. This is followed by a desire to transfer internal
curing from research and lab to field experience. This work is dedicated to promoting the
application of internal concrete curing in high performance concrete structures in Egypt
(mainly infrastructure projects) and study economic and environmental aspects related.
Detailed objectives of this work are:
1. Investigate the development, manufacture, and performance aspects of internal
concrete curing.
2. Evaluate the benefits of internal curing by examining short term and long term
properties and comparing it to conventional ways.
3. Develop preliminary feasibility model evaluating economical aspects of
implementing such technology incorporating short and long-term related costs.
A case study to be implemented to validate feasibility outcomes.
4. Analyze environmental aspects of the technology and impact on Egypt resources.

8
1.5 RESEARCH METHODOLOGY
The approach employed in this study to achieve the above mentioned objectives is:
1. Conduct an extensive literature review on internal concrete curing, its history and
development, theory, proportioning, properties, production and applications
2. Perform standard materials testing to examine fresh and hardened properties of
concrete produced through internal curing and compare it to conventionally cured
concrete. Results are listed, compared and interpreted to fully understand this new
technology
3. Execute a simple feasibility study to analyze economic and environmental
features of applying this technology in Egypt. All related aspect of construction
and life cycle cost should be taken in consideration for a comprehensive model.
4. Propose set of recommendations and guidelines for applicators in Egypt for a
smooth technology transfer to allow internal curing to be developed, specified,
produced and implemented in Egypt.
1.6 ORGANIZATION OF CHAPTERS
This study will consist of five other chapters outlined as follows:
Chapter 2: Presents a literature review regarding the internal concrete curing discussing
history and development, theory, proportioning, mechanical properties, production
aspects and application. A review on recent papers and studies are performed to achieve
comprehensive perspective on the technology.
Chapter 3: Introduces the methodology of evaluation of the internal concrete curing.
This chapter will discuss materials used and corresponding properties. Mixture

9
proportioning and mixing procedure will be illustrated in detail. Also, Experimental
methods, testing standards and purposes of each test shall be addressed.
Chapter 4: Displays the results of the fresh, hardened and durability testing of the
concrete specimens. Internal concrete curing results should be listed and compared to the
conventionally cured concrete, to better understand properties of this new technology.
Results will also be explained and interpreted to identify behavior and reasons of
occurrence.
Chapter 5: Executes a simplified feasibility analysis of applying internal concrete curing
in Egypt. Taking in consideration materials, production and application costs, as initial
costs of the system. Life cycle cost analysis based on serviceability of structures will also
be evaluated to be able to correctly judge the feasibility of this technology.
Environmental aspects of water will also be discussed. A case study is discussed to
validate and further emphasize on the benefits.
Chapter 6: Offers conclusions to the whole study. Conclusions are drawn from
experimental and feasibility results obtained from chapters 4 and 5. A set of
recommendations to industry applicators are highlighted for smooth implementation of
the technology. The importance for future research and work continuation is highly
emphasized.
10
CHAPTER 2
LITERATURE REVIEW
2.1 INTRODUCTION
In the 21st century, internal curing has developed as a new innovation that holds
guarantee for delivering concrete with enhanced resistance to early-age cracking and
improved durability (Bentz and Weiss, 2011). Since concrete service life is a key part of
developing practical infrastructure, internal curing can positively impact the sustainability
of Egypt’s infrastructure. The American Concrete Institute (ACI) defined internal curing in
its ACI Terminology Guide as “supplying water throughout a freshly placed cementitious
mixture using reservoirs, via pre-wetted lightweight aggregates, that readily release water as
needed for hydration or to replace moisture lost through evaporation or self-desiccation”
(ACI 308R-01, 2015). This definition defines the two noteworthy goals of internal curing;
boosting hydration and minimizing self-desiccation, along with stresses that may create
early-age cracking (Bentz and Weiss, 2011). The main objective of this chapter is to give a
wide perspective on the internal curing technology taking in consideration previous
developments and researches. This review was expedited with information from assembled
papers that discussed development, theory, mixture proportioning, and applications of
internal curing.
2.2 HISTORY AND DEVELOPMENT
History of natural lightweight aggregates dates back to the Roman times, in the
famous Pantheon in Rome; “The dome of the Pantheon was constructed using a
lightweight concrete with natural vesicular aggregates, where the density of the concrete
was reduced as its height within the dome increased (Bremner & Ries, 2009). In 1918

11
Stephen J. Hayde started the production and development of artificial lightweight
aggregates from clay, shale, and slate rocks (Bremner & Ries, 2009). Hayed’s innovation
was used to produce concrete ships for world wars I &II. Interestingly, many of these
concrete ships are still floating till now, which gives an indication of the high durability
of lightweight concrete (Holm, Bremner, & Newman, 1984), however, nothing about
internal curing was revealed.
Paul Klieger was the first to highlight the curing capabilities of
lightweight aggregates in 1957, he wrote “lightweight aggregates absorb considerable
water during mixing which apparently can transfer to the paste during hydration”
(Klieger, 1957). Few years later, specifically in 1991, concrete technologist Robert
Philleo whose research interests are in high strength concrete wrote “Either the basic
nature of Portland cement must be changed so that self-desiccation is reduced, or a
way must be found to get curing water into the interior of high-strength structural
members” (Philleo, 1991). Researches and investigations on internal concrete curing
using pre-wetted lightweight aggregates continued through “a variety of research
groups in Germany (Weber & Reinhardt, 1995), the Netherlands (van Breugel & de
Vries, 1998), and Israel (Bentur, Igarishi, & Kovler, 1999) (Bentz and Weiss, 2011).
Likewise with numerous new advancements, the way from research and examination
to practice has been a moderate one, however starting 2010, a huge number of cubic
meters of concrete containing pre-wetted LWA for internal curing have been
effectively set all through the U.S. (Villareal, 2008).

12
2.3 THEORY
“So if we add 1 + 1 we have 1.8!” Said professor Jason Weiss commenting on
cement hydration (Weiss, 2011). In this manner, the hydration reactions are joined by
a net chemical shrinkage as the items involve less space than the reactants (Bentz and
Weiss, 2011). Then again, after a cement paste sets and builds up a limited resistance
to deformation, the chemical shrinkage, without extra water, will develop self-
desiccation, as incompletely filled pores will be made inside of the microstructure
(Lura, Couch, Jensen, & Weiss, 2009). Young’s Equation (Alberty & Daniels, 1980)
best describes the relationship between the capillary pressure in the system (σ), the
surface tension of the fluid in pores (γ), contact angle (θ) and the pore radius (r),
equation (1) below shows the formula:
σ =(−2γcosθ)
r
[Equation1]
from equation (1), it is obvious that to decrease the capillary pressure, either reduce
the surface tension of the fluid in pores by using shrinkage-reducing admixture (Shah,
Weiss, & Yang, 1998) (Bentz, Geiker, & Hansen, 2001), or by increasing the pore size by
incorporating water reservoirs inside the larger pores (internal curing) (Bentz and Weiss,
2011).
As the water inside the pore start to empty for the hydration process to continue,
capillary pressure increases, as a result a measurable shrinkage of the system could be

13
produced. The strain cause by the capillary pressure is described by the Mackenzie’s
equation below:
ε =σS
3[(1
K) − (
1
Ks)]
[Equation 2]
where the linear strain (ε) is directly proportional to the capillary pressure. S, K and
Ks are the saturation in pores (0-1), bulk modulus of porous material, bulk modulus of
solid backbone, respectively (Bentz and Weiss, 2011). At the point when these
autogenous stresses and strains get to be enough, they may add to, or independently
cause, early-age cracking that will sacrifice the expected design and service life of a
concrete structure by giving open pathways to the ingress of unwanted materials.
Taking into account the above investigation, the goal of internal curing is to give
a source of promptly accessible extra water so that the hydrating cement paste stays
saturated, and consequently minimizing the autogenous stresses and strains. This
extra water will likewise advance hydration of the cement in the blend. Traditionally,
some of this extra water has been given by external curing systems, for example,
ponding, hazing, moistening, and the utilization of wet burlap. On the other hand, in
the higher performance concretes that are currently being utilized, the fine porosity
gets to be separated in the first couple of days of hydration (Powers, Copeland, &
Mann, 1959), such that this outer water might just penetrate a couple of millimeters
into the concrete from the curing-applied surfaces (Bentz, 2002), while the inside of
the concrete experiences self-desiccation. The objective of internal curing is to give
extra water in the best possible sum and with a fitting spatial distribution so that the

14
whole three-dimensional microstructure of hydrating cement paste stays moist and
autogenous stress free. (Bentz and Weiss, 2011)
2.4 PRACTICE: MIX PPROPORTIONING
Mix proportioning with internal curing gives the fundamental extra water to extend
time of saturated conditions in the hydrating cement paste. The upkeep of these saturated
conditions will both add to the accomplished level of reaction of the cement, furthermore
minimize the advancement of autogenous stresses and strains that cause early-age
cracking. Three key inquiries to consider in this outline procedure are accordingly: 1)
How much internal curing water is required for a given arrangement of mixture contents,
2) How far from the surfaces of the internal reservoirs into the cement paste can the water
travel, and 3) How are the internal stores dispersed inside of the mortar's structure or
concrete sample? (Bentz and Weiss, 2011).
To answer the first question of how much water is needed, a simple logic is used.
Equation (3) is developed to predict the mass/volume of required internal reservoirs, by
equating the water demand of the hydrating mixture to the supply that is available from
the internal reservoirs.
Cf × Cs × αmax = S × ∅LWA ×MLWA
[Equation 3]
In this form of the equation, the left side represents the water demand through the
cement content (Cf), the chemical shrinkage of the binder at 100% saturation (Cs) –
approximately equals 0.07 mL/g cement for Portland cement, and the expected degree of
reaction of the cement (αmax). The right side represents the water supplied by internal
15
curing through pre-wetted aggregates. Water supply is represented through the mass of
lightweight aggregates (MLWA), the saturation level (S) - equals 1 for w/c of 0.36, and the
absorption capacity of the aggregates (ΦLWA) (Bentz, Lura, & Roberts, 2005). This same
approach could be employed when using crushed returned concrete aggregates as the
internal curing reservoirs (Kim & Bentz, 2008). When equation (3) is used to figure the
required amount of LWA, the last substitution of normal weight aggregates (NWAs) by
LWAs ought to be performed on a volume premise, because of their critical contrasts in
density (Bentz, Lura, & Roberts, 2005).
It is very important to replace NWA with LWA of similar or close sizes and keep
the final overall gradation to produce quality concrete (Villarreal & Crocker, 2007). One
last issue to address concerning mix proportioning for internal curing is the potential for
either "undercuring" or "overcuring". Undercuring can happen when the water gave by
internal curing is not as much as that prescribed by equation (3) and just keeps up
saturated conditions for some limited timeframe, when a portion of the internal curing
water is uprooted by surface dissipation, or when the internal curing water is not
adequately all around appropriated all through the three-dimensional microstructure.
Overcuring may possibly happen when water ponding or wet burlap is utilized to give
outer curing to a concrete proportioned with internal curing (Cusson & Hoogeveen,
2008). At the point when a concrete is proportioned for internal curing as per equation
(3), all the needed water is incorporated in the internal reservoirs. If that extra water is
given at the concrete's surface, a water's segment in the internal reservoirs may remain in
place instead of moving to the hydrating cement paste. In the event that such specimens
were presented to freezing conditions before this water has had an opportunity to move

16
out of the internal stores, its durability may be compromised. At the point when internal
curing is proportioned for a concrete mixture taking after the methodology of equation
(3), external curing is best used to seal up the outside surfaces so that the internal curing
water will stay inside of the concrete to fill its proposed needs (Bentz and Weiss, 2011).
Knowing how much water is required for internal curing, the last issue that should be
comprehended is the circulation of the LWA all through the microstructure. Regardless
of the fact that an adequate volume of water is supplied to a system, if the water is
inadequately distributed, the system will probably display poor shrinkage performance.
This has been concluded by looking at the adequacy of coarse LWA and fine LWA when
the same volume of water is considered (van Breugel and Lura, 2000; Zhutovsky et al.
2002). Despite the fact that the volume of water may be the same, the distribution of the
LWA particles will be entirely different, bringing about an alternate volume of secured
paste (i.e., the volume division of the paste inside of a given separation from a LWA
molecule).
The coarse LWA ended up being less effective than the fine LWA despite the fact
that they had the same volume of water, clear distinction can be made in the secured
paste volume in these two figures. Due to the better particle distribution, the fine total can
possibly ensure the encompassing cement paste than coarse total. Utilizing fine
aggregates rather than coarse aggregates could have implications on strength. Replacing
the coarse typical weight aggregate with coarse LWA could have inconvenient
consequences for the quality of the concrete. At the point when managing higher quality
concretes, the aggregate particles will probably be the point of failure, and bringing weak
particles into the system could decrease the quality. By replacing the fine typical weight

17
aggregates with fine LWA, the impacts if including a weaker total could be eliminated
knowing that the fine aggregates do not influence the concrete's quality as much as the
coarse aggregates (Weiss et al., 2010)
Figure 2-1: Illustrations showing the protected paste volume of two mixtures with similar
LWA replacements of (a) coarse aggregate, and (b) fine aggregate (Henkensiefken, 2008)
2.5 LAB STUDIES
It is of crucial importance to study past lab studies to understand how mechanical
properties are affected by replacing normal weight aggregates by lightweight aggregates.
This section shall conclude past experiences of LWA replacement on plastic shrinkage,
autogenous shrinkage & relative humidity, strength, elastic modulus, curling & wrapping,
and transport coefficients, and service life.
2.5.1 PLASTIC SHRINKAGE
Concrete can crack at the placement time if the dissipation rate is high (Villarreal and
Crocker, 2007). While these cracks are not by large a reason for worry as far as the load

18
the structure can carry, they are unwanted and can prompt the ingress of undesired
elements that could expedite the corrosion of the reinforcing steel. Studies have been
recently directed to look at the plastic shrinkage and cracking tendencies of concretes
with and without internal curing (Henkensiefken, Briatka, Bentz, Nantung, and Weiss,
2010). To assess their potential for plastic shrinkage cracking, examples were tried after
ASTM C1579 "Standard Test Method for Evaluating Plastic Shrinkage Cracking of
Restrained Fiber Reinforced Concrete (Using a Steel Form Insert)" (Lamond, and Pielert,
2006). Lab studies conclude that in plastic shrinkage cracks are heavily reduced with
higher replacements of lightweight aggregates. This is mainly because the water in the
LWA compensates for water lost by evaporation or bleeding. Figure 2-2 shows crack
width versus probability of cracking for different replacements of LWA. (Henkensiefken,
Briatka, Bentz, Nantung, & Weiss, 2010).
Figure 2-2: Probability distribution of crack width occurrences in concrete with different
replacement volumes of Pre-wetted LWA (Henkensiefken, Briatka, Bentz, Nantung, &
Weiss, 2010)
19
It is obvious that the use of pre-wetted lightweight aggregates greatly reduces
both plastic shrinkage potential and crack width through compensating moisture lost in
the system. However, it is worth notching that any water lost at this stage will not be
available to reduce autogenous shrinkage that may cause self-desiccation.
2.5.2 AUTOGENOUS SHRINKAGE & RELATIVE HUMIDITY
Since one of the real targets of adding internal curing into a concrete blend is to
lessen autogenous shrinkage and the cracking that may go with it, various studies have
given estimations of autogenous deformation in concretes with and without internal
curing (Kovler and Mejhade, 2007). All the more as of late, mortars with different
replacement levels of pre-wetted LWA have been assessed for an assortment of early-age
properties, including internal relative humidity and autogenous deformation
(Henkensiefken, Bentz, Nantung, and Weiss, 2009). In that study, mortars with a w/c=0.3
were readied with replacement levels of LWA underneath. Figure 2-3 gives the deliberate
internal relative humidity and autogenous deformations for the mortars with eight unique
levels of internal curing. The outcomes show the normal movement in execution, as the
internal relative humidity increments with expanding replacement level of LWA, while
the autogenous shrinkage simultaneously diminishes.

20
Figure 2-3: Internal relative humidity (top) and autogenous deformation measurements
(bottom) with various levels of pre-wetted LWA replacement (Henkensiefken, Bentz,
Nantung, & Weiss, 2009).
Utilizing the ASTM C1581 restrained ring shrinkage test it was exhibited that the
decrease in autogenous shrinkage undoubtedly brought about a lessening in cracking as
appeared in Figure 2-4 (Henkensiefken, Bentz, Nantung, and Weiss, 2009). For these
mortars, cracking was adequately wiped out for replacement levels more noteworthy than
or equivalent to the 23.7 % of LWA by volume figured utilizing equation (3).

21
Figure 2-4: Reduced cracking with increased LWA replacements (Henkensiefken, Bentz,
Nantung, & Weiss, 2009).
2.5.3 STRENGTH & ELASTIC MODULUS
The impacts of internal curing on compressive strength and elasticity rely on the
mix design, curing conditions, and testing age. While mixtures with internal curing could
enhance strengths and moduli because of enhanced level of hydration of the cementitious
binder, on the other hand, a reduction in strength could be seen as the internal curing
agents are mechanically weaker than the Normal Weight aggregates that they are
replacing (Weiss, 2011). In general, declines are seen at before testing ages (< 7 d) while
increments are acquired at later testing ages (Bentz and Weiss, 2011)
To better grasp the impact of curing conditions on compressive strength, Golias
analyzed four mortar mixtures with w/c of 0.3 or 0.5 (Golias, 2010). For every w/c, one
mixture had internal curing while the other did not. In the water-cured specimens, little
contrast exists between the internally cured mortar and the plain mortar without internal

22
curing. This is normal since both mortars were given adequate outside water to help in
hydration. In spite of the fact that the execution of the fixed examples was like that of the
wet cured ones at early ages, the impact of extra curing water gets to be clear at the latest
age (e.g., 91 d).
The impact of internal curing on modulus of elasticity is appeared can be
concluded in figure 2-5. The modulus is lower for both frameworks containing LWA. A
lessened elastic modulus can likewise be identified with the decrease in cracking
potential (Weiss, Yang, and Shah, 1999) (Shah and Weiss, 2000) (Shin, Bucher, and
Weiss, 2011) (Raoufi, Schlitter, Bentz, and Weiss, 2012).
Figure 2-5: Influence of internal curing on elastic modulus of specimens (Golias, 2010).
Reducing the elastic modulus impacts lessening the residual stress because of
restraint as a function of time. Raoufi et al. led a progression of reproductions to better
comprehend the impact of lessened stiffness on early age cracking potential (Raoufi,
23
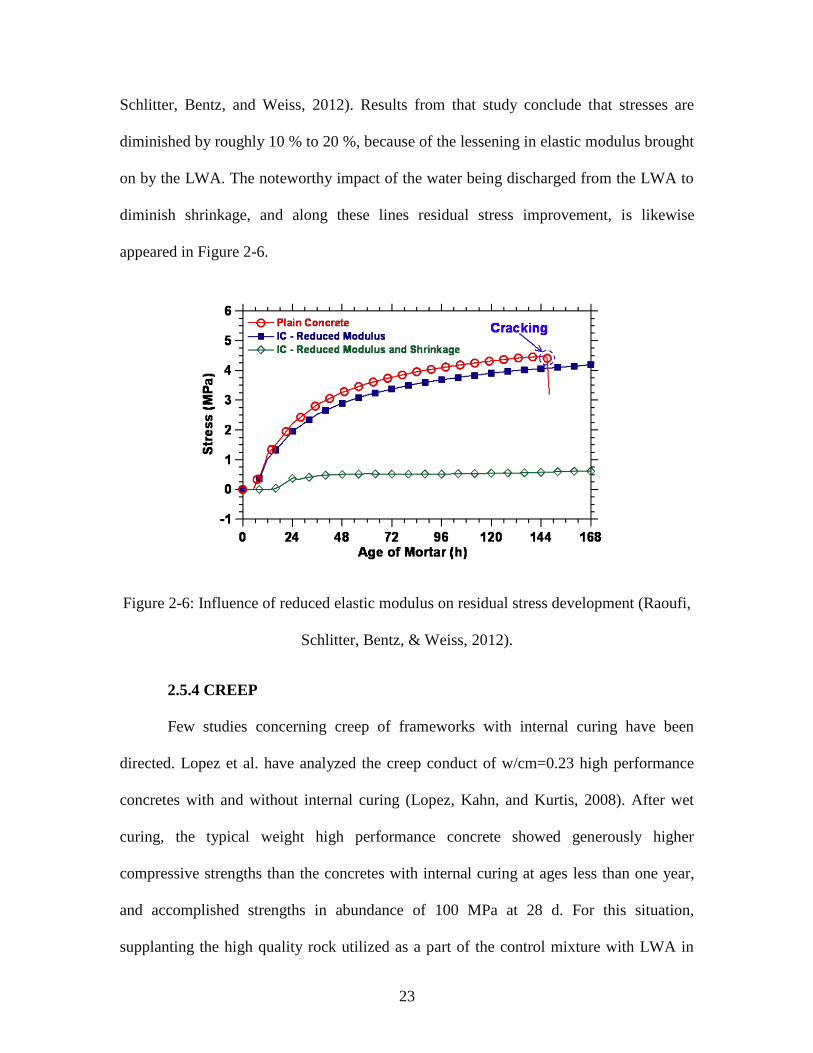
Schlitter, Bentz, and Weiss, 2012). Results from that study conclude that stresses are
diminished by roughly 10 % to 20 %, because of the lessening in elastic modulus brought
on by the LWA. The noteworthy impact of the water being discharged from the LWA to
diminish shrinkage, and along these lines residual stress improvement, is likewise
appeared in Figure 2-6.
Figure 2-6: Influence of reduced elastic modulus on residual stress development (Raoufi,
Schlitter, Bentz, & Weiss, 2012).
2.5.4 CREEP
Few studies concerning creep of frameworks with internal curing have been
directed. Lopez et al. have analyzed the creep conduct of w/cm=0.23 high performance
concretes with and without internal curing (Lopez, Kahn, and Kurtis, 2008). After wet
curing, the typical weight high performance concrete showed generously higher
compressive strengths than the concretes with internal curing at ages less than one year,
and accomplished strengths in abundance of 100 MPa at 28 d. For this situation,
supplanting the high quality rock utilized as a part of the control mixture with LWA in

24
the mixtures with internal curing delivered a sufficiently vast decrease in compressive
strength that it couldn't be balance by upgraded hydration. The mixture with pre-wetted
LWA displayed less creep (around 10 %) than the control mixture, while the mixture
with dry LWA showed the best creep. On the other hand, Cusson and Hoogeveen
measured a moderate increment in the tensile creep coefficient of w/c=0.34 concrete
mixtures with internal curing measured at 7 d versus a control mixture (Cusson and
Hoogeveen, 2008).
2.5.5 CURLING AND WARPING
By keeping up a higher and more uniform RH through the thickness of a concrete
part, internal curing may give the extra advantage of lowering curling/warping. Wei and
Hansen have watched that during a drying time of 16 d, warping was diminished by 70 %
by mixing internal curing into a w/c=0.45 concrete (Wei and Hansen, 2008). This change
in performance was expected both to the presence of water from the LWA throughout
drying and the improved hydration delivering a denser layer of concrete at the top
surface, along these lines diminishing the dissipation. Such results should be stretched out
to longer drying periods to confirm the adequacy of internal curing for lessening warping
in the more drawn out term.
2.5.6 TRANSPORT COEFFICIENTS AND SERVICE LIFE
Internal curing positively affects the transport coefficients and service life of
cement-based materials. Improved hydration densifies the pore structure of the material,
bringing about lessened transport. Regularly, the districts encompassing NWAs are a
larger number of porous than the bulk hydrated cement paste and can give particular
pathways to the ingress of harmful elements (Halamickova, Detwiler, Bentz, and

25
Garboczi, 1995). The replacement of a part of the NWAs by LWA could altogether
decrease the availability of the districts encompassing the NWAs, and additionally lessen
the volume division of this more porous paste (Bentz, 2009).
These positive characteristics of the LWA must be adjusted against the way that
the LWA itself is a porous element that can contribute its own transport pathways. In
light of this, the net impact of internal curing on transport will probably rely on upon the
way of the cementitious framework. On the off chance that a high w/cm (> 0.45) is
utilized, the narrow porosity may remain permeated and its permeated pathways can
without much of a stretch connection up with those in the LWA to give expanded
transport. Notwithstanding, in a lower w/cm grid, the narrow porosity will depercolate
(Powers, Copeland, and Mann, 1959) and the porous LWA particles will soon be
encompassed by a thick layer of hydration items. For sure, Zhang and Gjorv have
watched that the penetrability of high-strength lightweight concrete is more reliant on the
properties of the cement paste than the porosity of the LWA (Zhang and Gjorv, 1991).
Moreover, Pyc et al. what's more, Castro et al. have as of late performed mass estimations
that propose that once the pores in LWA void while supplying water to the hydrating
cement paste amid internal curing, they are not accordingly resaturated, even upon
complete inundation of the example (Pyc, Caldarone, Broton, and Reeves, 2008) (Castro,
Keiser, Golias, and Weiss, 2011).
A few late studies have specifically inspected the impact of internal curing on
chloride dissemination coefficients of mortars. Figure 2-7 demonstrates the assessed
dispersion coefficients for w/c=0.4 mortars with and without internal curing (Bentz,
Snyder, and Peltz, 2010). Huge diminishments in dissemination coefficients for high-
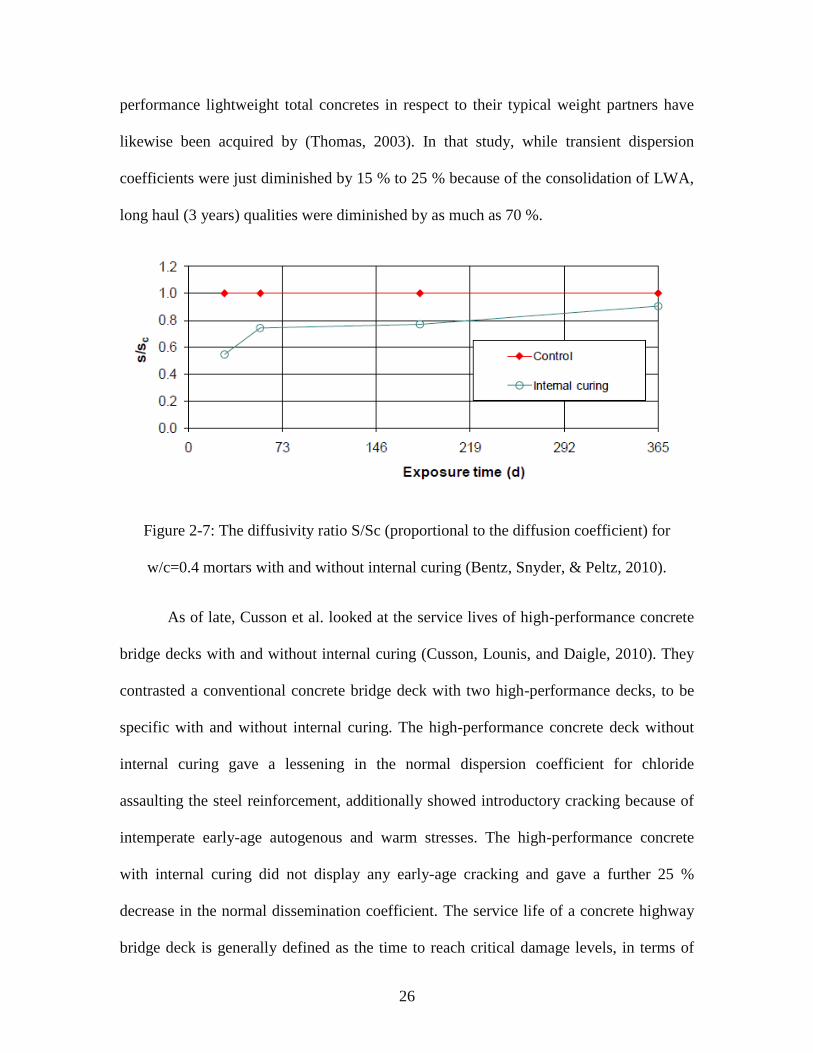
26
performance lightweight total concretes in respect to their typical weight partners have
likewise been acquired by (Thomas, 2003). In that study, while transient dispersion
coefficients were just diminished by 15 % to 25 % because of the consolidation of LWA,
long haul (3 years) qualities were diminished by as much as 70 %.
Figure 2-7: The diffusivity ratio S/Sc (proportional to the diffusion coefficient) for
w/c=0.4 mortars with and without internal curing (Bentz, Snyder, & Peltz, 2010).
As of late, Cusson et al. looked at the service lives of high-performance concrete
bridge decks with and without internal curing (Cusson, Lounis, and Daigle, 2010). They
contrasted a conventional concrete bridge deck with two high-performance decks, to be
specific with and without internal curing. The high-performance concrete deck without
internal curing gave a lessening in the normal dispersion coefficient for chloride
assaulting the steel reinforcement, additionally showed introductory cracking because of
intemperate early-age autogenous and warm stresses. The high-performance concrete
with internal curing did not display any early-age cracking and gave a further 25 %
decrease in the normal dissemination coefficient. The service life of a concrete highway
bridge deck is generally defined as the time to reach critical damage levels, in terms of

27
delamination or spalling (Falling of concrete cover). In light of these and different
suspicions exhibited in the study (Cusson, Lounis, and Daigle, 2010), the accompanying
service life evaluations were acquired for the bridge decks: conventional concrete – 22
years, high-performance concrete without internal curing – 40 years, and high-
performance concrete with internal curing – 63 years. For this situation, internal curing
ought to create a bridge deck with an expanded service life and a fundamentally lessened
life cycle cost
Figure 2-8: Service life predictions from deterministic service life models (Cusson, Lounis,
and Daigle, 2010 )
2.6 FIELD EXPERIENCES
As of the end of 2010, internal curing has been utilized in an assortment of concrete
mixtures for differing applications including bridge decks, pavements, travel yards, and
water tanks.
One of the initially recorded field investigations of concrete with internal curing was
a vast railway travel yard in Texas requiring 190,000 m3 of concrete, developed in 2005
28
(Villarreal and Crocker, 2007). In this application, a halfway measured LWA (178 kg/m3
concrete) was mixed with NWAs to fill in a hole in the general total degree. The internal
curing gave by the pre-wetted middle LWA brought about an observable (> 15 %)
expansion in 28 day strength, disposal of plastic and drying shrinkage cracking, and a
decrease in concrete unit weight that may interpret into diminishments in fuel
prerequisites and gear wear (Villarreal and Crocker, 2007). Since 2007, a few informal
break reviews have been directed at the railway travel yard, with just a few splits
discovered (one of these being the place a development joint was coincidentally
excluded). This concrete blend outline has relentlessly expanded in prevalence in the
north Texas district (Villareal, 2008), with more than 2,000,000 m3 of internally-cured
concrete now set up.
In 2006, internal curing was utilized for persistently strengthened concrete asphalt set
utilizing a slip-form clearing machine (Friggle and Reeves, 2008). The concrete mixture
with internal curing was formulated to meet the Texas Department of Transportation
(TxDOT) necessities of a base flexural strength of 3.93 MPa and a base compressive
strength of 24.1 MPa, both at 7 days. Ten months after the effective placement of the
asphalt, a break overview designated "a mind-boggling decrease in the quantity of splits
(21 versus 52 in a similar segment of typical concrete) and a huge lessening in the
deliberate width of the breaks" for the test area set utilizing the blend with internal curing
in respect to a control segment put with the TxDOT standard blend (Friggle and Reeves,
2008).
Villarreal (2008) surveys past work by Villarreal and Crocker (2007) and talks about
real usage and difficulties of utilizing lightweight aggregates in field. The most basic

29
challenge for utilizing lightweight aggregates as a part of the field for the reasons of
internal curing is to accurately decide the moisture content of the aggregate. The
aggregates must be soaked uniformly so that pumping of concrete with lightweight total
is not influenced
Figure 2-9: Left - Internally cured concrete being cast at Bartell Road in New York
(Wolfe, 2010), and Right - Internally cured concrete bridge deck being cast near
Bloomington, IN (Di Bella, Schlitter, & Weiss, 2010).
2.7 POTENTIAL OF INTERNAL CURING
As internal curing keeps on progressing, examination on this point keeps on finding
new roads for investigation. A standout amongst the most critical of these is the usage of
crushed returned concrete aggregates as internal curing reservoirs. A late study has
considered the mixing of crushed returned concrete aggregates (CCA) as a supportable
way to deal with produce mortars with decreased autogenous deformation, yet
comparable strength in respect to a control mortar arranged without internal curing (Kim
and Bentz, 2008). While some decrease in measured autogenous deformation was
delivered with the CCA alone as a replacement material, generously lower mortar shape

30
compressive strengths were likewise measured. Conversely, mixtures with a pre-wetted
LWA as the replacement material showed a significant diminishment in autogenous
shrinkage and a 10 % to 20 % strength increment at ages of 28 d and 56 d.
Using recycled aggregates as replacement to the coarse aggregates proved its
soundness in previous research. Not only that, CCA proved to have high economic
feasibility as well as major contribution to the environment (Abou-Zeid et al., 1998).
Recycled aggregates have shown some potentiality to serve as internal curing agents.
However, this opportunity was not given much attention in research, lab or field
experiments.
2.8 SUPPOSITIONS
The literature review conducted reveals several primary lessons for efficient use of
lightweight aggregates to provide internal curing:
There is an optimal amount of aggregate replacement that will ensure that
internal curing can occur. Increasing the aggregate replacement beyond this
value has only a small effect on improving shrinkage properties and may have
a detrimental effect on other important concrete properties (such as strength
and abrasion resistance) (Ye et al., 2006).
Lightweight aggregate replacement beyond 20% by volume of the total
aggregate may significantly reduce strength (Ye et al., 2006).
The effectiveness of the total is needy upon the total pore structure. By and
large, bigger aggregates have a bigger pore structure, which brings about more
productive internal curing (Hammer et al., 2004).

31
Like the thought that adequately scattered air bubbles enhances durability,
appropriately scattered lightweight aggregates enhances internal curing.
Smaller total sizes are better scattered over bigger aggregates (Bentz, Snyder,
and Peltz, 2010).
Proper handling in the field is a critical thought that impacts the estimation of
the LWA moisture content, even immersion of the LWA, and contamination
of the aggregate. Consideration regarding appropriate handling strategies must
be furnished to evade issues with yield, slump loss, pumping, and finishing
(Villareal , 2008).
There are few unexplored materials that have potential in internal curing that
have not been yet examined or given enough attention. Using Recycled
concrete aggregates for internal curing purposes shall be given more
consideration
It appears that internal curing has the potential to make a substantial impact on
the durability and life-cycle costs of concrete structures. the reduced risk of
cracking and the reduced chloride ingress should contribute to a more durable
structure that has a longer life and lower life-cycle costs (Bentz and Weiss,
2011)

32
CHAPTER 3
METHODOLOGY
3.1 GENERAL
The mechanical properties of concrete can play an important role in early age
durability performance. Since concrete is a heterogeneous material, mechanical
properties are affected by the independent properties of the concrete paste and aggregate.
Therefore, substituting lightweight aggregate that is weaker and softer for normal weight
aggregate may affect the overall mechanical properties of concrete. This chapter
describes the procedures used in the laboratory, the materials, and equipment used to
perform the evaluation of the mix designs as well as the test programs.
The experimental work herein includes fourteen core concrete mixtures prepared
with four types of aggregates. The first is conventional dolomite aggregates. The second
is recycled concrete aggregates. The third is perlite lightweight aggregate. The fourth and
last is pumice lightweight aggregate. Water-cement ratio used was 0.35 to simulate the
commonly used range in infrastructure concrete mixtures in Egypt.
3.2 MATERIALS AND PROPORTIONING
All the materials used in the experimental work were obtained from local
Egyptian sources, with the exception of pumice lightweight aggregate that was imported
from Greece. Their types and brands were selected from commonly used constituents of
concrete mixtures in the Egyptian construction market. Each time a new aggregate
sample was obtained, a new sieve analysis and specific gravity test were performed. The
following sections describe the materials used in the study.

33
3.2.1 PORTLAND CEMENT
Ordinary Portland cement (ASTM C 150 Type I) was used. The cement was
produced by Lafarge cement Egypt in Ain Sokhna plant. The cement had a specific
gravity of 3.15 and a Blaine fineness of 313 m2/kg. The Bogue compounds of the cement
were as follows: C3S = 61.07%, C2S = 14.99%, C3A = 2.06% and C4AF = 15.03%.
Chemical composition of cement used is shown in table 3-1 below
Table 3-1: Type I Portland cement characteristics
Table 3-2: Typical results of standard testing of the cement used
Test Standard(s) Property Results
Fineness of Portland
Cement ASTM C204 Fineness 313 m2/kg
Density of Portland
Cement ASTM C188 Density 3.15
Setting Time of
Portland Cement ASTM C191
Initial setting 145 minutes
Final setting 235 minutes
Compressive Strength
of Cement Mortar ASTM C109
3-day Comp. Strength 17.9 MPa
28-day Comp. Strength 47.3 MPa
3.2.2 FINE AGGREGATES
Siliceous sand was used in all concrete mixtures. Fine aggregates were obtained
from natural Wadi Sand, Bani Youssef. The sand had a fineness modulus of 2.547, a
Element SiO2 Al2O3 Fe2O3 CaO MgO SO3 K2O Na2O Cl
Weight % 21.29% 3.93% 4.94% 64.37% 1.80% 1.99% 0.32% 0.35% 0.30%

34
saturated surface dry specific gravity of 2.64 and a percent absorption of 0.52%. Typical
sieve analysis results of the sand are presented in Table 3-3 (along with the ASTM C33
limits for fine aggregate grading). Sieve analysis test was conducted according to ASTM
C136. Several other tests were also conducted on the sand in order to determine its
properties and the results were recorded as shown in table 3-4 below
Table 3-3: Fine aggregates Sieve analysis, % passing
Sieve Size (mm) % Passing ASTM C33 Limits
10.0 100.0 100
5.00 100.0 95-100
2.36 95.0 80-100
1.18 84.0 50-85
0.60 49.0 25-60
0.30 14.2 10-30
0.15 3.1 2-10
0.0075 0.6 0-2
Table 3-4: Typical results of standard testing of the fine aggregates used
Test Standard(s) Property Results
Materials Finer Than 75m
(No. 200) ASTM C117
Percent of Materials Finer
Than 75m (No. 200) 0.60 %
Chemical Analysis BS 812 – Part
117/118
Chloride (CL) 0.0453%
Sulphate (SO3) 0.40%
Clay Lumps & Friable
Materials ASTM C - 142
Percent of Clay Lumps &
Friable Materials 0.65%
Specific Gravity &
Absorption ASTM C128
Bulk S.G (SSD) 2.638
% Absorption 0.52 %

35
3.2.3 COARSE AGGREGATES
The conventional coarse aggregates used were crushed dolomite aggregate.
Coarse aggregates were obtained from OCI Crusher, Attakah. The dolomite had a
maximum nominal size of 20 mm, a saturated surface dry specific gravity of 2.57 and a
percent absorption of 1.98%. Typical sieve analysis results of the dolomite are presented
in Table 3-4 (along with the ASTM C33 limits for coarse aggregate grading). Sieve
analysis test was conducted according to ASTM C136. Several other tests were also
conducted on the dolomite in order to assess the properties and the results were recorded
in table 3-6 shown below
Table 3-5: Coarse aggregates sieve analysis, % passing
Sieve Size (mm) % Passing
ASTM C33 limits Dolomite Size 1 Dolomite Size 2
37.50 100.0 100.0
20.00 100.0 80.6 90-100
14.00 97.0 27.8 -
10.00 57.3 12.7 30-60
5.00 6.1 3.6 0-10
2.36 2.8 1.8 -
0.075 0.7 0.7 0-1

36
Table 3-6: Typical results of standard testing of the coarse aggregates used
Test Standards Property Dolomite Size 1 Dolomite Size 2
Materials Finer
Than 75m (Sieve
No. 200)
ASTM C117 % of Materials
Finer Than 75m 0.7 % 0.7%
Specific Gravity
and Absorption of
Coarse Aggregate
ASTM C127
Bulk S.G 2.570 2.572
Absorption 1.98% 1.88%
Clay lumps &
Friable Materials ASTM C - 142
Clay Lumps &
Friable Materials 0.07% 0.05%
Chemical Analysis BS 812 – Part
117/118
Chlorides (CL) 0.021% 0.020%
Sulphates (SO3) 0.28% 0.25%
Resistance to
Abrasion (LAA) ASTM C131 Percent loss 19.5% 19.5%
3.2.4 RECYCLED AGGREGATES
Concrete chunks resulting from the demolition of concrete which had an original
strength 25-30 MPa was used. Recycled concrete aggregates were obtained from crushed
concrete from demolishing works of science building in AUC’s old campus, Tahrir
square. The crushed material had a maximum size of 38 mm, a saturated surface dry
specific gravity of 2.36 and absorption of 5.3%.

37
Figure 3-1: Demolishing of Science building of the American University in Cairo Tahrir
Campus, October 2015, and crushing the concrete to the desired size.
3.2.5 LIGHTWEIGHT AGGREGATES
Two types of lightweight aggregates were used in different dosages. This was
done to compare the effect of different lightweight aggregates in internal curing process.
The two types were as follows:
3.2.5.1 STRUCTURAL PERLITE
Perlite was obtained from The Egyptian Company for Manufacturing Perlite
plant, located in industrial district of Burj Al Arab city, Alexandria. Perlite had a specific
gravity of only 0.32, and absorption of 32%. Perlite was supplied in 100 Litters plastic
bags which weight almost only 9kg.

38
Figure 3-2: Structural Perlite bag and its grain size compared to crushed sand
3.2.5.2 PUMICE
Pumice was obtained from Laval mining and quarrying company, Greece. Its pumice
quarry is located in Yali, Nissiros, a natural pumice deposit located in northern Greece.
Pumice had a specific gravity of 1.1, and absorption of 18%
Figure 3-3: Pumice lightweight aggregates used

39
3.2.6 ADMIXTURES
The admixture used was a common ASTM C494 Type G; its commercial name is
BASF MasterRheobuild-2270. The product is a modified lignosulfonate based with an
approximate solid content of 39% and a specific gravity of 1.21
3.2.7 MIXING AND CURING WATER
Municipal water was used for washing aggregates as well as for mixing and
curing concrete. The water used is drinkable water that is free from excessive amounts of
acids, salts, alkalis and other materials that are harmful to concrete.
3.2.8 CURING COMPOUND
Curing compound used was BASF MasterKure 181, with specific gravity of 0.82.
Curing compound assists in the retention of water during hydration. The resultant film
retains sufficient moisture in the concrete to ensure full hydration of the cement; essential
for optimum strength development.
Figure 3-4: BASF MasterCure 181 was used as a curing compound. It was added to a
sprayer to be sprayed over the finished surface of concrete

40
3.2.9 MIXTURE PROPORTIONING
The 14 concrete mixtures had w/c of 0.35, Type “G” admixture, and cement content of 450 kg/m3. It is very important to
highlight that aggregates replacements were done on volume basis and not weight. Figure 3-2 illustrates the Mixutres used.
Concrete Mixtures
Mixtures with Natural Crushed Dolomite
Aggregates
No Curing
Curing Compound
Water Curing
Mixtures with Recycled Aggregates from Old Demolished Concrete
10% Replacement from Coarse Aggregates
15% Replacement from Coarse Aggregates
25% Replacement from Coarse Aggregates
Mixtures with Perlite Lightweight aggregates
3% Replacement from Crushed Sand
7% Replacement from Crushed Sand
10% Replacement from Crushed Sand
15% Replacement from Crushed Sand
25% Replacement from Crushed Sand
Mixtures with Pumice Lightweight aggregates
10% Replacement from Coarse Aggregates
15% Replacement from Coarse Aggregates
25% Replacement from Coarse Aggregates
Figure 3-5: Diagram Illustrating all mixtures used in this study

41
First set is conventional concrete mixtures; which was cured in three different
ways: Full curing by submerging specimens in curing tanks, the use of a curing
compound and with no curing.
Table 3-7: Conventional Concrete mixture
Material (kg/m3) C-50 Conventional
Concrete
Cement 450
Aggregate Size 1 525
Aggregate Size 2 525
Fine Aggregates 662
Free Water 147
Absorption Water 23
Crushed Sand 112
Admixture – RH 2270 7.5
Second set constitutes 3 mixtures of prewetted recycled concrete aggregates with
dosages of 10%, 15% and 25%. Recycled aggregates replaced size 1 and size 2
aggregates because of similar size to obtain similar gradation.
Table 3-8: Mixtures with replacements of Recycled Concrete Aggregates
Material (kg/m3) 10% Recycled 15% Recycled 25% Recycled
Cement 450 450 450
Aggregate Size 1 472.5 446.25 393.75
Aggregate Size 2 472.5 446.25 393.75
Fine Aggregates 662 662 662
Free Water 147 147 147
Absorption Water 20.7 19.6 17.25

42
Crushed Sand 112 112 112
Admixture – RH 7.5 7.5 7.5
Recycled Aggregates 105 157.5 262.5
Perlite specimens come with 5 different dosages of prewetted pelite aggregates,
3%,7%,10%,15% and 25%. Perlite aggregates replaced crushed sand because of similar
size to obtain similar gradation
Table 3-9: Mixtures with replacements of Perlite lightweight aggregates
Material (kg/m3) 3% Perlite 7% Perlite 10% Perlite 15% Perlite 25% Perlite
Cement 450 450 450 450 450
Aggregate Size 1 525 525 525 525 525
Aggregate Size 2 525 525 525 525 525
Fine Aggregates 642 615 596 562 496
Free Water 147 147 147 147 147
Absorption Water 23 23 23 23 23
Crushed Sand 110 108 106 103 98
Admixture – RH 7.5 7.5 7.5 7.5 7.5
Perlite 2.6 6 8.7 13 21.7
The remaining 3 mixtures contain prewetted pumice aggregates with
concentrations of 10%, 15% and 25%. Pumice lightweight aggregates replaced size 1 and
size 2 aggregates because of similar size to obtain similar gradation.

43
Table 3-10: Mixtures with replacements of Pumice lightweight aggregates
Material (kg/m3) 10% Pumice 15% Pumice 25% Pumice
Cement 450 450 450
Aggregate Size 1 472.5 446.25 393.75
Aggregate Size 2 472.5 446.25 393.75
Fine Aggregates 662 662 662
Free Water 147 147 147
Absorption Water 20.7 19.6 17.25
Crushed Sand 112 112 112
Admixture – RH 7.5 7.5 7.5
Pumice 49.5 74 123.7
3.3 EXPERIMENTAL WORK
This section describes the testing carried on constituent raw materials, and
preparation, mixing, casting and curing of concrete specimens. This section also
discusses fresh and hardened testing of concrete as well as the durability testing.
3.3.1 AGGREGATES TESTING
The following tests were carried out in compliance with the following ASTM standard
specifications:
Sieve analysis of fine and coarse aggregates in accordance with ASTM C136.
Materials finer than 75m (No. 200) sieve in mineral aggregates by washing in
accordance with ASTM C117.

44
Specific gravity & absorption of fine aggregate in accordance with ASTM C128.
Specific gravity & absorption of coarse aggregate in accordance with ASTM
C127
Resistance to abrasion of small size coarse aggregate by use of the Los Angeles
machine in accordance with ASTM C131.
3.3.2 CEMENT TESTING
The following tests were carried out in compliance with the following ASTM standard
specifications:
Fineness of Portland cement by air permeability apparatus in accordance with
ASTM C204.
Density of hydraulic cement in accordance with ASTM C188.
Time of setting of hydraulic cement by Vicat needle in accordance with
ASTM C191.
Compressive Strength of Hydraulic Cement Mortar in accordance with ASTM
C109.
3.3.3 SPECIMEN PREPARATION
Concrete specimens for each one of the 14 mixtures. Each mixture had the following
specimens:
Standard cubes complying with BS 1881 (150 x 150 x 150 mm) for testing
7,28 and 56 days
Standard ASTM C 78 flexural strength beams (150 x 150 x 75 mm) for
testing 28 and 56 days.

45
Standard ASTM C 39 for preparing concrete cylinders (150 x 300 mm), for
Rapid Chloride Permeability Test (RCPT) in 28 and 56 days.
Standard tile (200 x 200 x 25mm) for testing Abrasion resistance throughout
age of specimen.
Standard ASTM C157/C157M prism of 100-mm square cross-section and
approximately 285 mm long for testing shrinkage.
3.3.4 MIXING
Mixing was performed in accordance with ASTM C192-07. The LWA was oven
dried, air cooled, and then submerged in water for 24 h ± 1 h before mixing. All
aggregates were mixed in SSD condition. All batches were mixed using a counter-current
pan mixer. The batch size for all of the batches was 0.06 m3. Mixing procedure went as
follows: first, aggregate was loaded into the mixer. The mixer was started and 50% of the
total water was added. The cement and remaining mixing water containing the admixture
were then added. The mortar was mixed for 3 min, and then rested for 1 min while the
sides of the mixer were scraped, then mixed for a final 2 min.
Figure 3-6: Mixing of concrete constituents using 0.06m3 mixer

46
3.3.5 CASTING
Specimens were cast immediately following the testing of the concrete slump, air
content and unit weight. After the molds were coated with a layer of oil (to help in the
removal of the specimens), concrete was placed within the molds in three equal layers.
After adding each layer of concrete, the concrete was consolidated using a tamping rod as
per specification. Specimens were de-molded 24 hours after casting.
Figure 3-7: Placing and finishing of concrete specimens
3.3.6 CURING
Specimens were cured in 3 different modes. The first one was full curing, were
the specimens were submerged in curing tank till testing day, this was once made for the
conventional concrete mixture with full curing mode. The second one was curing using
curing compound. After casting, curing compound (diluted with 1:6 water) was sprayed
on the exposed surface of the specimen. This was done once for the conventional
concrete mixture with curing compound mode. All the remaining mixtures were not
cured, left in the open air to simulate reality. These mixtures were done to simulate no
curing mode of the conventional concrete mixture and allow for simulation of internal
curing of the 3 different aggregate types.

47
3.3.7 FRESH TESTING
Slump of Portland Cement Concrete in accordance with ASTM C 143.
Unit weight of Fresh Concrete in accordance with ASTM C 231
Air Content of Freshly Mixed Concrete by the Pressure Method in accordance
with ASTM C 231.
3.3.8 HARDENED CONCRETE TESTING
Compressive Strength: Compressive strength of Concrete Cubes This test was carried
out according to standard after 7, 28 and 56 days using an “ELE” brand machine of
2000 kN capacity.
Flexural Strength: Flexural strength of Concrete Using Simple Beam with Third-Point
Loading (ASTM C78). This test was carried out after 28 and 56 days using the same
“ELE” brand machine used for the compressive strength test.
3.3.9 DURABILITY TESTING
Rapid Chloride Permeability Test: The rapid chloride-ion penetration test was conducted
through passing electric charges into concrete discs according to ASTM C 1202.
Abrasion: Resistance to abrasion resistance was evaluated through applying rotary
abrasion of gritty sand on 200x200x25 mm specimens. Assessment is carried out based
on weight loss criteria.
Shrinkage Assessment: Shrinkage was evaluated through dimension inspection of the
200x200x25mm specimen in 7, 28 and 56 days. This was used to assess the volumetric
change in each mixture.

48
Figure 3-8: Prisms and apparatus used to perform shrinkage assessment test (Abou-Zeid,
et al. 2015)
Figure 3-9: Setup of the Rapid Chloride Permeability Test

49
CHAPTER 4
RESULTS AND ANALYSIS
This section describes the properties and test results of fresh concrete, handed
concrete and durability. Results are presented and analyzed to better understand the
technology of internal curing using different replacements of different aggregate types. It
is worth mentioning that workmanship does not often do good curing, so perfect curing is
theoretical.
4.1 FRESH TESTING
The following are the results of the air content, unit weight, and slump of lightweight,
recycled as well as conventional concrete specimens:
Table 4-1: Fresh Testing Results of all concrete mixtures
Mixture Slump (mm) Air Content (%) Unit Weight (kg/m3) Temperature (oC)
Conventional 130 2 2444 22
Recycled 10% 130 2.4 2401 24
Recycled 15% 140 2.6 2358 25
Recycled 25% 160 3.0 2339 24
Perlite 3% 140 2.0 2424 26
Perlite 7% 160 2.1 2407 25
Perlite 10% 190 2.2 2393 24
Perlite 15% 220 2.4 2336 24
Perlite 25% 250 2.7 2325 25
Pumice 10% 150 2.6 2384 23
Pumice 15% 180 3.0 2327 23
Pumice 25% 210 3.3 2248 23

50
4.1.1 SLUMP
The results of slump test are listed in table 4-1 and are illustrated in figure 4-1. As can
be seen in figure 4-1, the slump ranges from 130 to 250 mm. The highest values were
obtained from the samples with lightweight aggregates replacements, especially perlite.
Slump values are highest for perlite mixtures, followed by pumice then recycled
aggregates. The lowest slump values were those of the concrete made with conventional
aggregates. Slump values increased with higher replacements of saturated aggregates.
The higher slump values of the pre wetted aggregate mixtures can be attributed to the
desorption property of those types of aggregates, or their ability to lose their internal
water. This water was released from the aggregates during mixing causing an increase in
the flow ability of the concrete mixture.
Figure 4-1: Slump test results for different concrete mixtures
100
120
140
160
180
200
220
240
260
Slu
mp (
mm
)
Concrete Mixtures

51
Desorption shows to be lower for recycled aggregates and pumice compared to the
perlite mixtures, thus yielding slightly lower slump values. Results also reveal that
conventional concrete had the lowest slump of 130 mm. This is due to the absence of
additional water in the aggregate, since the conventional aggregates were SSD state.
Slump test results reveal an important advantage of using pre-wetted aggregates, which is
enhanced workability that shall ease concrete handling and finishing.
Figure 4-2: Picture showing difference in slump between Conventional mixture (left) and
Perlite mixture (right)
4.1.2 AIR CONTENT
Results of Air content test are listed in table 4-1 and are illustrated in figure 4-3. As
can be seen in figure 4-3, the air content percentage ranges between 2 to 3.3%. The
highest values were obtained for mixtures with pre-wetted lightweight and recycled
aggregates, pumice, recycled and perlite mixtures, respectively. Generally, Air content
increased with the elevated replacements. The lowest air content results were those of the
conventional mixtures.
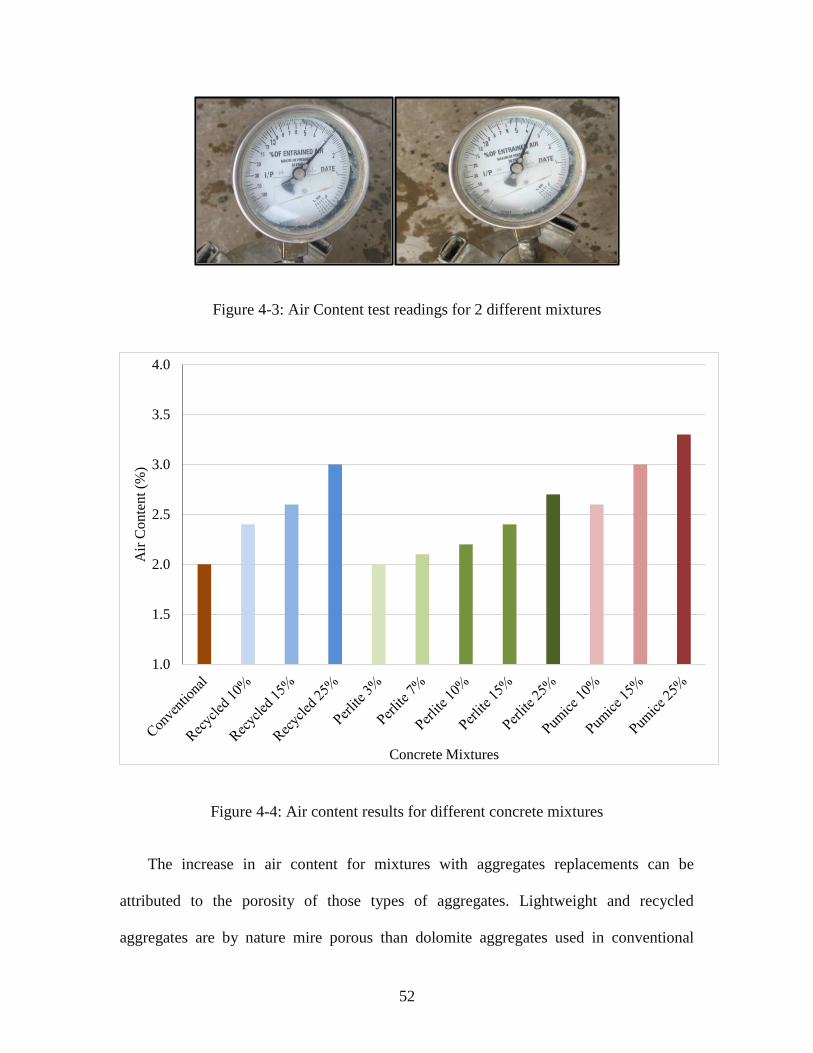
52
Figure 4-3: Air Content test readings for 2 different mixtures
Figure 4-4: Air content results for different concrete mixtures
The increase in air content for mixtures with aggregates replacements can be
attributed to the porosity of those types of aggregates. Lightweight and recycled
aggregates are by nature mire porous than dolomite aggregates used in conventional
1.0
1.5
2.0
2.5
3.0
3.5
4.0
Air
Conte
nt
(%)
Concrete Mixtures

53
concrete mixtures. This increased the entrapped air in the concrete mixture. Among the
saturated aggregates mixtures, perlite mixtures appeared to be the least. This can be
explained mainly because perlite replaced crushed sand, which occupies the least volume
compared to the coarse aggregates. Also, from visual inspection, Pumice appears to be
the most porous, which is reflected on the results. Generally, Air content results reveal
that mixtures with replacements of lightweight and recycled aggregates yield slightly
higher air content.
4.1.3 UNIT WEIGHT
The results of unit weight test are listed in table 4-1 and are illustrated in figure 4-
5. As can be seen in figure 4-5, unit weight results range from 2248 to 23444 kg/m3. The
highest value was obtained for concrete mixtures made with conventional dolomite
aggregates. Unit weight values were slightly decreased for mixtures with aggregate
replacements of recycled, perlite, and pumice, respectively. Also, unit weight dropped
with increased replacement percentage of pre wetted lightweight and recycled aggregates.
This behavior can be attributed to the increased porosity and decreased unit weight of the
replacement aggregates compared to the dolomite aggregates used in conventional
mixtures. Within the replacement aggregates mixtures, unit weight decreased for
aggregates with lower unit weight. However, it is worth noting that the decrease in unit
weight for replacing aggregates mixtures was slight compared to conventional dolomite
aggregate mixtures. This happened mainly because the replacing aggregates were
saturated with water, which makes such aggregates closer in density to those
conventional aggregates. Generally, replacing conventional aggregates with recycled or
lightweight aggregates led to slight drop in unit weight in the concrete mixture.

54
Figure 4-5: Unit weight results for different concrete mixtures
4.1.4 TEMPEREATURE
Results of temperature test are listed in table 4-1 and are illustrated in figure 4-6.
As can be seen in figure 4-6, temperature results range from 22 to 25 degree Celsius.
There was no clear correlation between temperature and the mixture, temperature was
rather affected by both ambient temperature and temperature of the mixing water.
Generally, replacing conventional aggregates with pre wetted lightweight or recycled
aggregates have no effect on the temperature of the mixture.
2000
2200
2400
2600
2800
Unit
Wei
ght
(kg/m
3)
Concrete Mixtures

55
Figure 4-6: Results of fresh concrete temperature
Incorporating lightweight and recycled concrete aggregates affected the fresh
properties of concrete. Mixtures with lightweight or recycled concrete aggregate
replacements enjoyed better workability. As these aggregates were pre-wetted for 24 h ±
1 h, they may have lost some of this water to the surrounding paste, causing lower slumps
and hence better workability. Aggregate replacement also affected the air content. As
these aggregates are by generally more porous than the dolomite aggregates, they may
experience higher voids. Air content was higher towards use of coarser replacing
aggregates like recycled concrete and pumice aggregates, this may happened because of
better interlocking of smaller sized aggregates like perlite. Unit weight was slightly
affected. Mixtures with replacements of lightweight or recycled concrete aggregates
showed lower unit weight. Unit weight decreased with the increased dosages of
lightweight and recycled concrete aggregates. This happened because of porous
0
5
10
15
20
25
30
Tem
pre
atu
re (
oC
)
Concrete Mixtures

56
aggregates used. Temperature results showed no significant effect in cases of
replacement, temperature was rather affected by ambient and mixing water temperatures.
It can be concluded that mixtures with replacements of lightweight and recycled concrete
aggregates have higher workability and air contents and lower unit weights.
4.2 HARDENED TESTING
The following are the results of the compressive strength, and flexural strength of
lightweight, recycled as well as conventional concrete specimens:
Table 4-2: Hardened concrete test results for different mixtures
Mixture
Compressive Strength
(MPa)
Flexural Strength
(MPa)
Flexure to
Compression Ratio
7d 28d 56d 28d 56d 56d
No Curing 54.5 59.7 61.8 5.5 5.8 9%
Curing Compound 57.2 63.3 65.6 6.1 6.4 10%
Water Curing 54.1 63.4 66.5 6.3 6.6 10%
Recycled 10% 50.3 56.0 58.7 7.2 7.5 13%
Recycled 15% 49.5 52.3 54.9 7.7 8 14%
Recycled 25% 46.3 51.9 54.5 6.9 7.1 13%
Perlite 3% 53.1 57.4 60.6 5.7 5.9 10%
Perlite 7% 52.7 58.8 61.7 5.8 6.1 10%
Perlite 10% 52.3 59.7 62.7 6.1 6.4 10%
Perlite 15% 51.8 57.4 60.8 5.2 5.5 9%
Perlite 25% 48.3 55.3 57.9 4.4 4.6 8%
Pumice 10% 50.6 57.1 59.9 4.6 4.8 8%
Pumice 15% 47.8 51.1 53.8 4.7 4.9 9%
Pumice 25% 40.6 45.7 48.2 5.1 5.3 11%

57
4.2.1 COMPRESSIVE STRENGTH
Results of the compressive strength test are listed in table 4-2 and are illustrated in
figure 4-7. As can be seen in figure 4-7, the 56-day compressive strength results range
from 48.2 to 66.5 MPa. The highest value was obtained for the standard concrete mixture
made with conventional dolomite aggregates namely full curing followed by curing
compound and no curing modes. The high values of compressive strength can be
attributed to the strength of the conventional dolomite aggregates compared to the
replacement aggregates. Curing mode and its effect on the strength can be clearly
outlined, a drop in strength is found between fully and non-cured samples. This can be
explained through the incomplete hydration process in non-cured samples compared to
curing compound or full curing samples.
As for the pre wetted lightweight and recycled aggregates results, as can be seen in
figure 4-7, perlite showed the highest results followed by recycled then pumice
aggregates mixtures. This is mainly due to the fact that both recycled and pumice
replaces coarse aggregates size one and two contrasting to perlite, which replaces crushed
sand. Coarse aggregates are the main load carrier and hence the replacement directly
affected the strength. It is worth noting that 10% replacement with perlite aggregates
surpassed the no curing sample of conventional concrete. This is primarily explained by
the enhanced hydration process through the internal moisture supplied by water stored
inside the perlite aggregates. Perlite is also considered to be better dispersed through the
concrete section compared to the pumice and recycled aggregates due to its finer grain
size. Generally, results show that compressive strength is mainly affected by the strength
of the replacing aggregates and the replacing aggregate type (coarse or crushed sand).

58
Dispersion is also an important factor that affect internal curing performance of the
aggregates, the finer the aggregate the better dispersion and scatter through the concrete
section. The 10% aggregate replacement with perlite lightweight aggregate showed to be
promising after surpassing the non-cured sample after 56 days.
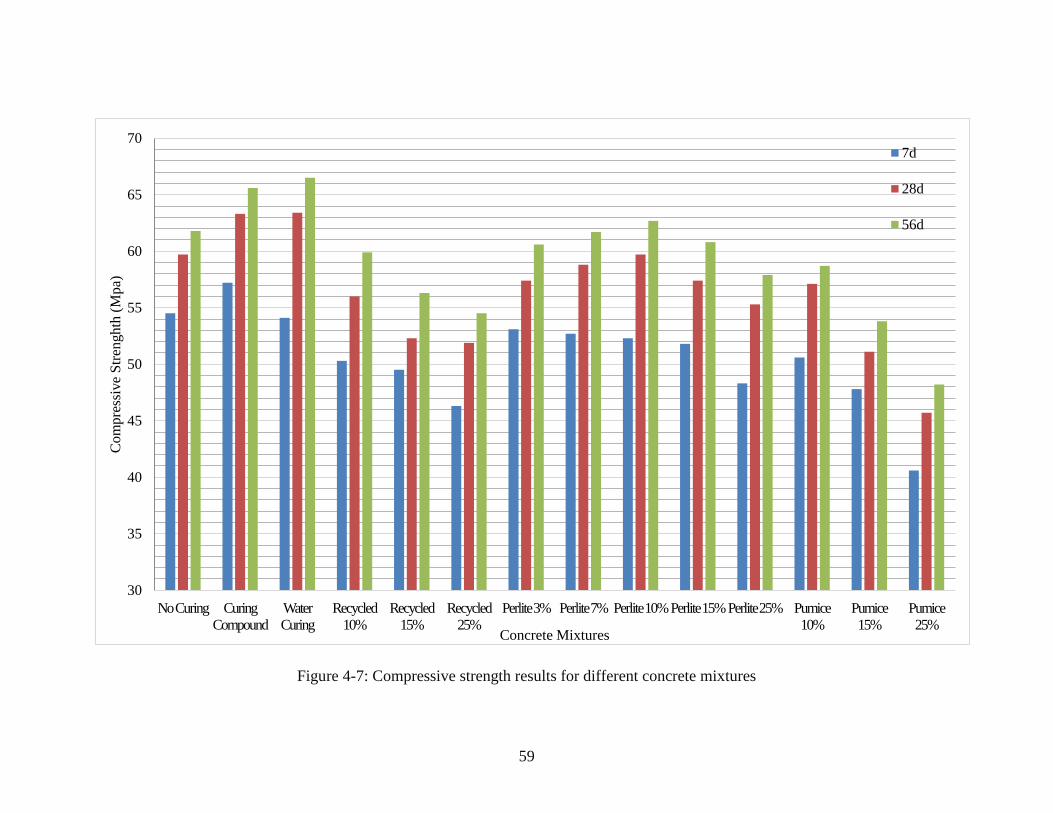
59
Figure 4-7: Compressive strength results for different concrete mixtures
30
35
40
45
50
55
60
65
70
No Curing Curing
Compound
Water
Curing
Recycled
10%
Recycled
15%
Recycled
25%
Perlite 3% Perlite 7% Perlite 10%Perlite 15%Perlite 25% Pumice
10%
Pumice
15%
Pumice
25%
Com
pre
ssiv
e S
tren
ghth
(M
pa)
Concrete Mixtures
7d
28d
56d

60
It can be concluded that Compressive strength showed to be clearly affected by
both aggregate type and curing mode. Within the same testing date, strength differed
from one aggregate type to the other based also on replacement dosages. So, the weaker
the aggregate used with higher dosages the more the strength in affected. Perlite is the
weakest aggregate type followed by pumice, recycled concrete and conventional
aggregates, respectively. Strength gaps appeared clearly in recycled aggregates and
Pumice mixtures as they were used in high dosages, in contrast to perlite, which was used
with lower dosages (by volume). Curing mode affected strength, as observed no curing
mixture showed highest values at 7 days however was surpassed by curing compound
and full curing later in 28 and 56 days. This can be explained because of the potential
inside cracks (desiccation) caused by the incomplete hydration due to the lost water.
Despite the fact the perlite is the weakest aggregate type, it yielded the most strength
within the internally cured specimens, principally the 10% dosage. This can be explained
due to the better dispersion of the aggregate throughout the concrete section, compared to
the coarse aggregates. Also, perlite dosage replaced the crushed sand aggregates, which is
not the primary load carrier in concrete. At 56 days, 10% perlite surpassed the standard
no curing mixtures, asserting on the importance of curing and its role in strength
development. Aggregate type, dosage and dispersion are the 3 principal factors that affect
the strength of internally cured concrete.
4.2.2 FLEXURAL STRENGTH
The results of the flexural strength test are listed in table 4-2 and are illustrated in
figure 4-8. As can be seen in figure 4-8, flexural strength results range from 4.6 to 8.0
MPa. The highest value was that of the 15% recycled aggregates. This can be attributed
61
to the Interfacial Transition Zone (ITZ) between aggregate surface and concrete paste.
The ITZ has enhanced the properties internally, which means less tendency of aggregate
pop out, thereby higher flexural strength. Also, Recycled aggregates have a angular
texture, causing better interlocking of aggregates with the paste. It is worth noting that
flexural strength dropped for the increased replacement percentage, mainly because of the
excessive replacement of dolomite aggregate which has higher strength compared to
other replacing aggregates.
These outcomes have fairly comparable patterns to the patterns of the compressive
strength as in increasing the percentage of perlite or recycled aggregates leads to some
decrease in flexural strength. Contrastingly, a large portion of the mixtures made with
perlite or recycled aggregates recorded a flexural strength that is higher than the
conventional concrete mixtures. This highlights the internal curing impact of the perlite
and recycled aggregates in minimizing cracking.. With respect to conventional mixtures,
the impact of curing was more proclaimed than the compressive strength mixtures.
Generally, the consolidation of perlite prompted a reduction in flexural strength while the
replacements of recycled aggregates prompted flexural strength that is comparative or
surpassing ordinary mixtures. The outcomes in this propose the flexural strength test has
a superiority to distinguish the impact of internal curing than compressive strength.

62
Figure 4-8: Flexural strength results for different concrete mixtures
0.0
2.0
4.0
6.0
8.0
10.0
Fle
xura
l S
tren
gth
(M
pa)
Concrete Mixtures
28d
56d

63
4.2.3 FLEXURAL STRENGTH TO COMPRESSIVE STRENGTH RATIO
Results of the flexural/compressive ratio are listed in table 4-2 and are illustrated in
figure 4-9. As can be seen in figure 4-9, the ratio of flexural/compressive values range
from 8% to 14%. The highest value is that of the 15% recycled concrete mixture. This
can be attributed to the high flexural strength results obtained for the same mixture. The
high values of flexural strength was reached mainly due to the enhanced Interfacial
Transition Zone that gave better bonding of recycled aggregates and the rest of the
concrete mixture. The relatively high percentage of flexural to compressive strength gives
indication of better resistance to tensile forces that eventually should lead to lowered
cracking.
Figure 4-9: Flexural Strength to compressive strength ratio for different concrete
mixtures
0%
5%
10%
15%
20%
25%
Fle
xura
l/C
om
pre
ssiv
e S
tren
gth
Rat
io (
%)
Concrete Mixtures
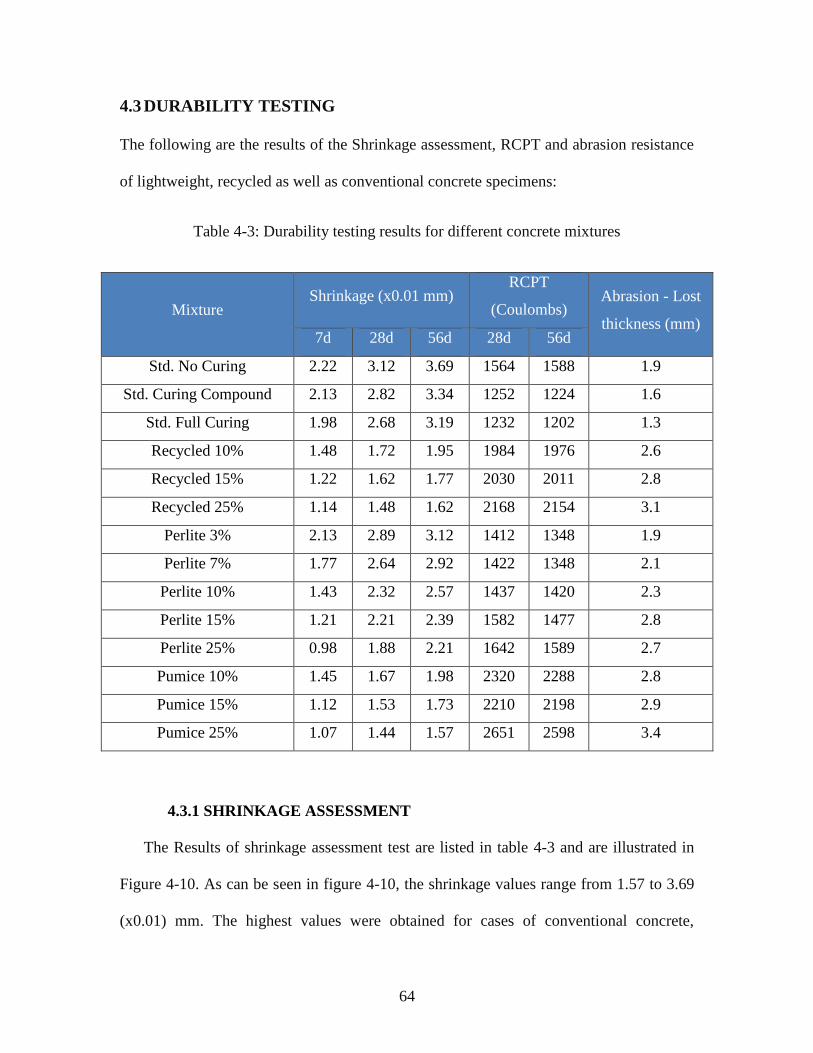
64
4.3 DURABILITY TESTING
The following are the results of the Shrinkage assessment, RCPT and abrasion resistance
of lightweight, recycled as well as conventional concrete specimens:
Table 4-3: Durability testing results for different concrete mixtures
Mixture Shrinkage (x0.01 mm)
RCPT
(Coulombs) Abrasion - Lost
thickness (mm) 7d 28d 56d 28d 56d
Std. No Curing 2.22 3.12 3.69 1564 1588 1.9
Std. Curing Compound 2.13 2.82 3.34 1252 1224 1.6
Std. Full Curing 1.98 2.68 3.19 1232 1202 1.3
Recycled 10% 1.48 1.72 1.95 1984 1976 2.6
Recycled 15% 1.22 1.62 1.77 2030 2011 2.8
Recycled 25% 1.14 1.48 1.62 2168 2154 3.1
Perlite 3% 2.13 2.89 3.12 1412 1348 1.9
Perlite 7% 1.77 2.64 2.92 1422 1348 2.1
Perlite 10% 1.43 2.32 2.57 1437 1420 2.3
Perlite 15% 1.21 2.21 2.39 1582 1477 2.8
Perlite 25% 0.98 1.88 2.21 1642 1589 2.7
Pumice 10% 1.45 1.67 1.98 2320 2288 2.8
Pumice 15% 1.12 1.53 1.73 2210 2198 2.9
Pumice 25% 1.07 1.44 1.57 2651 2598 3.4
4.3.1 SHRINKAGE ASSESSMENT
The Results of shrinkage assessment test are listed in table 4-3 and are illustrated in
Figure 4-10. As can be seen in figure 4-10, the shrinkage values range from 1.57 to 3.69
(x0.01) mm. The highest values were obtained for cases of conventional concrete,

65
particularly the non-cured specimens. This can be attributed to the poor hydration
performance of the non-cured specimens. To the contrary, the internally cured mixtures
showed decreased shrinkage; the mixtures with 25% recycled aggregates, with shrinkage
of 0.0162 mm, had almost half of value of the conventional concrete shrinkage of 0.0369
mm. At the start, one can see that the vast majority of the shrinkage occurred until 28
days and less increment in shrinkage was seen in the interim somewhere around 28 and
56 days. All internal curing mixtures of perlite, pumice and the recycled aggregates had
critical impact in decreasing shrinkage. Such reduction in shrinkage qualities was higher
after increasing the perlite, pumice and reused aggregates dosages. The recycled
aggregates and pumice, in any case, demonstrated the most reduced shrinkage of all
mixtures notwithstanding when contrasted with perlite blend.
Shrinkage assessment test highlights the significance of internal curing. The
internally cured concrete mixtures had the lowest shrinkage values and lowest shrinkage
development through the 56 days. This is clearly due to the enhanced hydration process.
The internal moist stored inside the concrete section helped in better commencement of
strength and durability development of the mixture and lowered or eliminated self
desiccation. Decreased shrinkage of internally cured concrete reveals the potential of this
technology, especially in concretes with special functions that require minimizes
shrinkage and accordingly, cracking.

66
Figure 4-10: Results of Shrinkage test for different concrete mixtures
No Curing
Curing Compound
Water Curing
Recycled 10%
Recycled 15%
Perlite 3%
Perlite 7%
Perlite 10%
Perlite 15%
Perlite 25%
Pumice 10%
Pumice 15%
Pumice 25%
1.0
1.5
2.0
2.5
3.0
3.5
4.0
7d 28d 56d
Shri
nkag
e (
x 0
.01m
m)
Time (Days)

67
4.3.2 RAPID CHLORIDE PERMEABILITY TEST (RCPT)
The results of RCPT are listed in table 4-3 and are illustrated in figure 4-11. As can
be seen in figure 4-11, the passing charges ranged from 1202 to 2598 coulombs. The case
of lowest passing charges was that of concrete made with conventional dolomite
aggregates, full curing followed by curing compound. This can be mainly because of the
high unit weight/density of conventional aggregate mixtures in comparison to the
internally cured ones because of their decreased densities due to aggregate replacement.
Another factor is the amount of cracking inside the concrete section itself. Results of
RCPT strongly assures on the issue of curing. All cured specimens, whether internally or
externally cured have shown decreasing penetrability through the 28 and 56 days testing.
Only the no curing specimen showed an increased penetrability as it passed 1588 charges
in 56 days increasing by 24 units than the 28 days results. Conventional mixtures’
passing charges, on average, decreased by 29 charges from 28 to 56 days. Perlite
mixtures had the most decreased passing charges with 63 less passing charges from 56 to
28 days. Pumice showed the worst performance, this can be explained because of the
high porosity of this kind of aggregate. It is concluded that unit weight, curing,
interlocking (voids percentage), and aggregate porosity are the main factors that affect
the penetrability of the concrete section.

68
Figure 4-11: Results of Rapid Chloride Permeability Test (RCPT)
Std. No Curing
Std. Curing Compound
Std. Full Curing
Recycled 10%
Recycled 15%Recycled 25%
Perlite 3%Perlite 7% Perlite 10%
Perlite 15%
Perlite 25%
Pumice 10%
Pumice 15%
Pumice 25%
1000
1500
2000
2500
3000
28d 56d
Pas
sing C
har
ges
(C
olo
um
b)
Time (Days)

69
4.3.3 ABRASION TEST
The Results of Abrasion Test are listed in table 4-3 and are illustrated in Figure 4-12.
As can be seen in figure 4-12, the Abrasion values range from 1.3 to 3.44 mm of lost
thickness. Conventional concrete specimens have demonstrated the best abrasion
performance as it lost only 1.6 mm on average that is the least amount, followed by
perlite specimens with 2.36 mm, then recycled concrete specimens with 2.83mm. Pumice
was at the worst at abrasion resistance, averaging almost 3mm of lost thickness. This
behavior is explained through the abrasion resistance of the aggregates themselves.
Dispersion plays an important role here. Perlite demonstrated similar behavior to the
conventional specimens because of the well dispersion of perlite throughout the section,
in contrast with both the Recycled concrete aggregates and the pumice specimens. Aging
may also be a reason for the poor abrasion performance of specimens with recycled
concrete aggregates. This recycled concrete dates back to the 60’s, which is the time of
construction of the famous AUC science building. Generally, abrasion was slightly
affected with aggregates replacements, specifically the coarser replacements.
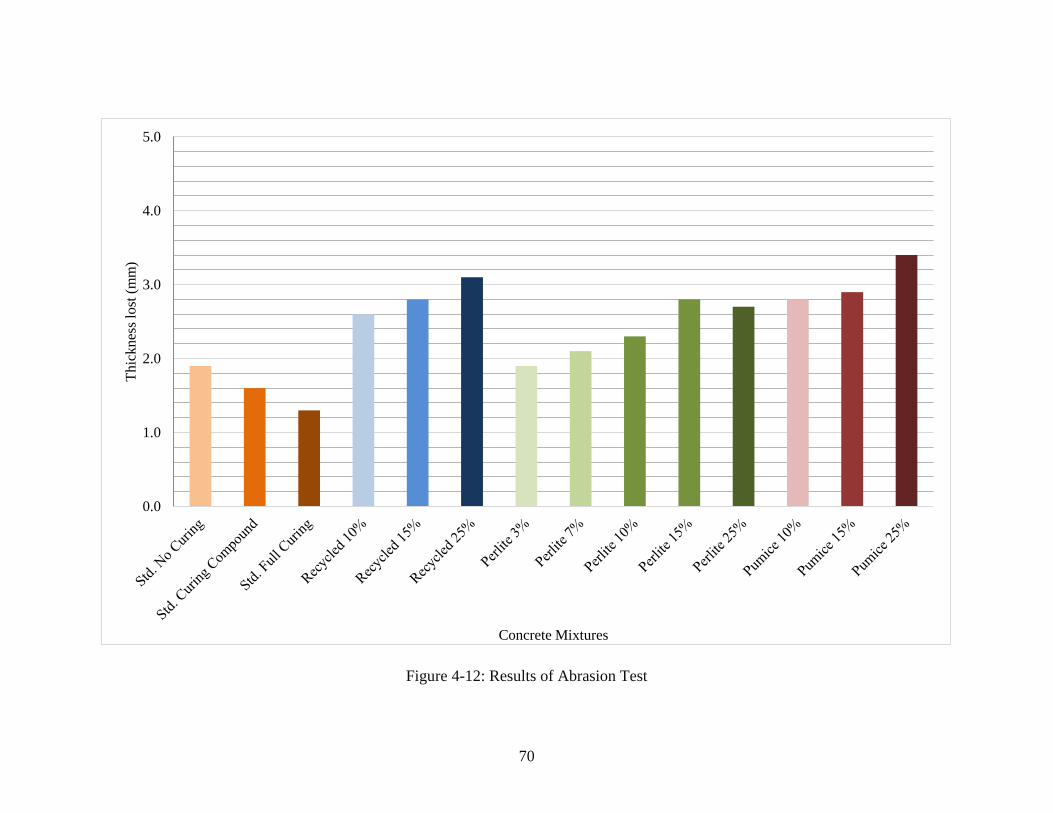
70
Figure 4-12: Results of Abrasion Test
0.0
1.0
2.0
3.0
4.0
5.0T
hic
knes
s lo
st (
mm
)
Concrete Mixtures

71
CHAPTER 5
PRELIMINARY FEASIBILITY ANALYSIS
The feasibility of internal curing technology is directly related to its technical
properties and long term performance. Its economic feasibility is determined in the light
of a complexity of parameters, which are summarized in this section.
5.1 AVAILABILITY
Perlite aggregates are manufactured locally. Perlite is widely available in areas of
Burj Al Arab, Alexandria and Atakkah, Suez. Perlite is widely used in other industries
and in producing lightweight concrete. Egypt produces almost 250 Km3 of perlite
annually, only 10% is used for concrete purposes. Needless to say, internal curing is not
one of these concrete applications.
The annual amount of recycled aggregates from destroyed structures is assessed as
2% of aggregate volume of existing concrete. Obviously, areas of normal disasters or
clashes can have higher percent than this one. Moreover, the assessed measure of rejected
fresh concrete created can be as high as 3%. The last is advantageous since it incorporates
insignificant measure of contaminants (Abou-Zeid et. al, 1998).
5.2 SPECIAL EQUIPMENT
The only special equipment used may be crusher for recycled concrete aggregates
production and special storage area with sprinklers for pre-wetting of aggregates. One
challenge that faces the concrete crushing is the impurities problem. The overall
efficiency of the crushing process cannot be separated from the handling of impurities
present in demolished concrete (e.g. paints or reinforcing steel). This matter can become

72
a cumbersome one particularly in residential building demolition (Abou-Zeid, et al.,
1998). However, advanced systems are now established for purposes of separation and
sorting. As for the pre-wetting of the aggregates, at the ready-mix plant, a separate bin
may be used for the aggregates or they may be kept in (sprinkled) piles. The time
required for sprinkling a new pile prior its use in concrete is dependent on the application
rate of the water and the aggregates’ absorption characteristics (Villareal, 2008). Villareal
also suggests a system to save more water by recycling the excess runoff water back into
the sprinkler system.
Figure 5-1: Simple recycled concrete aggregate crusher (Eagle Crushers, 2016)
5.3 TRANSPORTATION
The feasibility of the internally cured concrete is exceedingly affected by
transportation costs. In roads construction, transportation expense can be decisive. This is
likewise the case for projects in centers of urban zones where transportation and access to
destinations is difficult and the utilization of site accessible concrete is thus considered.

73
Likewise, transporting extra water for curing to versatile locales could be very costly in a
few nations like Egypt. In coming years, and after relative political stability, Egypt is
undergoing numerous numbers of gigantic projects; New Capital, New Suez canal, Port
Saied, and national roads project; to name only some. Most of these projects are in
mobile areas to encourage stretching the outskirts of the country to decrease dense
populations in the Cairo and Delta areas. This comes with its drawbacks of transportation
of raw materials like concrete and water. Internally cured concrete would save a
considerable amounts of water transported to these mobile sites.
5.4 WATER
Water scarcity threat has been a global center of focus for many decades in areas with
no fresh water access, unlike Egypt. However, this issue has been raised in Egypt from
over 30 years ago coinciding with many Nile river countries building dams to secure its
share from fresh water. Grand Ethiopian renaissance dam, commonly known as Al Nahda
dam, which is expected to operate by July 2017 is one of the most critical challenges
facing Egyptians. This dam is forecasted to decrease Egypt’s share by almost 8-10 Billion
cubic meters of water, and almost 40% less effect on electricity production throughout
the period to fill the tanks (Elbaradei, 2016). Based upon these facts, Egypt should adapt
to these changes by enforcing some strict rules and encouraging other water saving ideas
and activities. Internal curing decreases water consumption drastically, and shall wisely
save water from being randomly and uncontrollably splashed over concrete.

74
Figure 5-2: Picture showing construction of Ethiopian Grand Dam (Daily news Egypt, 2014)
5.5 SIMPLIFIED LIFE CYCLE COST ANALYSIS
A Life Cycle Cost Analysis (LCCA) is done when there is a need to assess and
compare the monetary performance of competing design and maintenance
alternatives. A LCCA was led to survey the life-cycle costs of conventional concrete
versus internally cured concrete, for which various sorts of exercises may be booked
at diverse focuses in time, for instance: periodical assessments, required maintenance
and repairs, and also replacement; figure 5-2. This is typically accomplished by
ascertaining the Present Value Life-Cycle Costs (PVLCC) of the options over a given
time period (Hawk H., 2003):
PVLCC = C0 +∑Ci
(1 + r)t
T
t=1
−Rv
(1 + r)T
[Equation 4]
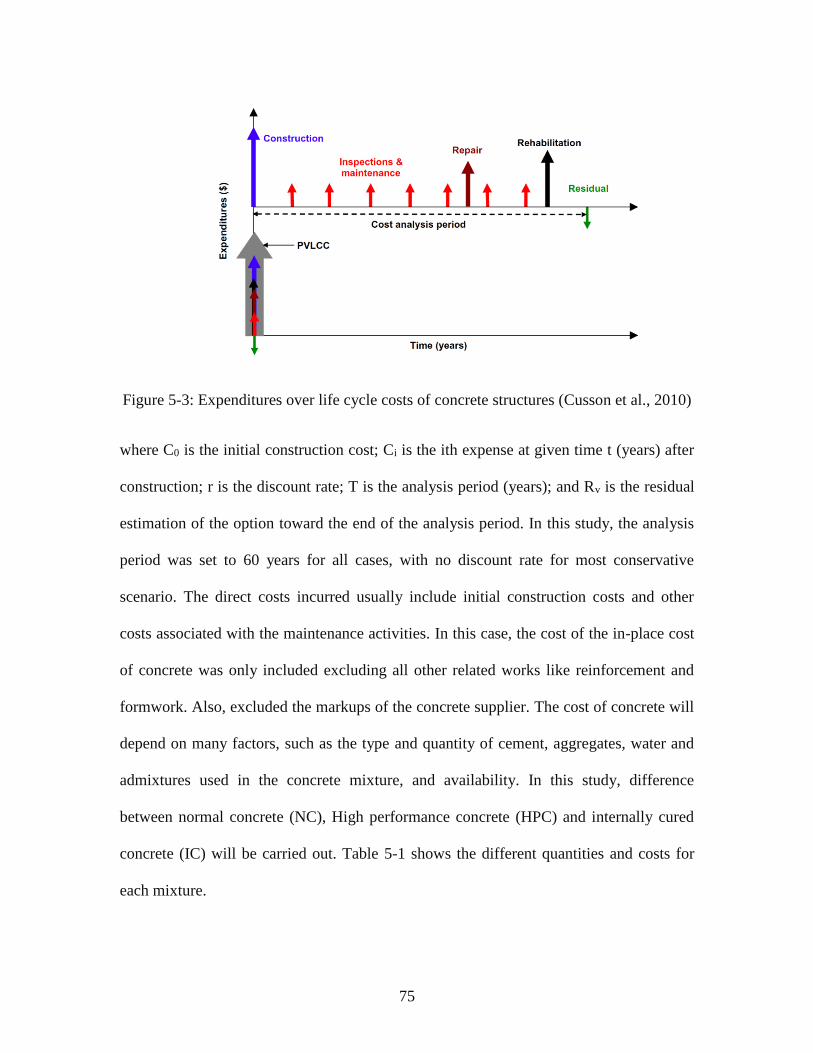
75
Figure 5-3: Expenditures over life cycle costs of concrete structures (Cusson et al., 2010)
where C0 is the initial construction cost; Ci is the ith expense at given time t (years) after
construction; r is the discount rate; T is the analysis period (years); and Rv is the residual
estimation of the option toward the end of the analysis period. In this study, the analysis
period was set to 60 years for all cases, with no discount rate for most conservative
scenario. The direct costs incurred usually include initial construction costs and other
costs associated with the maintenance activities. In this case, the cost of the in-place cost
of concrete was only included excluding all other related works like reinforcement and
formwork. Also, excluded the markups of the concrete supplier. The cost of concrete will
depend on many factors, such as the type and quantity of cement, aggregates, water and
admixtures used in the concrete mixture, and availability. In this study, difference
between normal concrete (NC), High performance concrete (HPC) and internally cured
concrete (IC) will be carried out. Table 5-1 shows the different quantities and costs for
each mixture.

76
Table 5-1: Estimated Cost of different concrete mixtures
Material NC - C40 HPC - C55 ICC - 10% Perlite - C55
Quantity Unit price Cost Quantity Unit price Cost Quantity Unit price Cost
Cement (kg) 400 0.6 240 450 0.6 270 450 0.6 270
Coarse Aggregates
(kg) 1,060 0.0 47.7 1,050 0.0 47.3 1,050 0.0 47.3
Fine Aggregates (kg) 790 0.0 14.2 662 0.0 11.9 590 0.0 10.6
Crushed Sand (kg) 112 0.1 5.6 112 0.1 5.6 105 0.1 5.3
Water (L) 172 0.00015 0.026 170 0.00015 0.026 180 0.00015 0.027
Admixture (L) 5 8 40 7.5 8 60 7.5 8 60
Perlite (kg) - 1.5 - - 1.5 - 100 1.5 150
Curing Water (L)
Including Transportation 200 0.025 5.0 200 0.025 5 -
-
Total (LE/m3) 352 399 543
The unit cost of HPC (LE 400/m3) was evaluated to be 13% higher than that of
ordinary C-40 concrete (LE 350/m3), basically because of the increased amount of
cement in the mixture. The unit cost of ICC was set to that of HPC in addition to a 35%
expansion to represent the cost contrast connected with the procurement and
transportation of the lightweight aggregate (with a purchase cost of LE 1,500/m3) used to
substitute a small amount of the ordinary aggregates.
For this situation consider, an arrangement of different maintenance exercises
were expected to occur over the life cycles. For normal concrete (NC) for example,
destructive (NDT) assessment and protection exercises were planned to happen at regular
intervals, while patch repairs were scheduled when 10% and 25% of the concrete surface
would be spalled. In this study, replacement was esteemed vital when half of the concrete
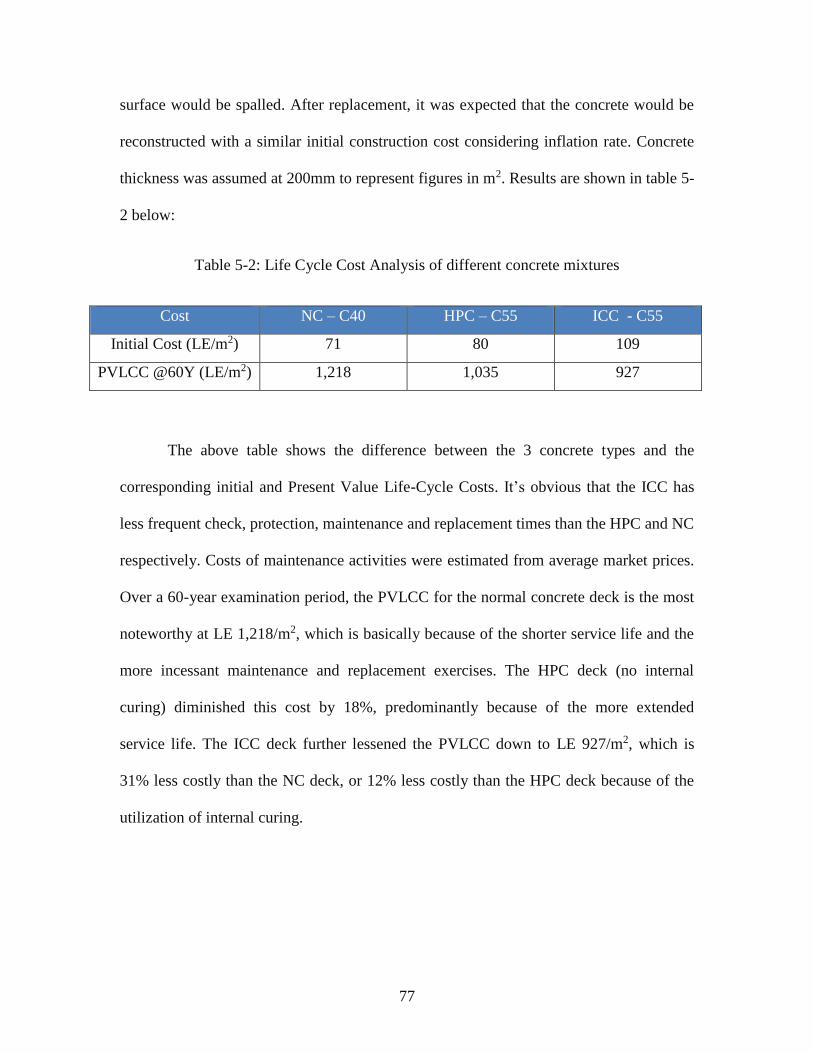
77
surface would be spalled. After replacement, it was expected that the concrete would be
reconstructed with a similar initial construction cost considering inflation rate. Concrete
thickness was assumed at 200mm to represent figures in m2. Results are shown in table 5-
2 below:
Table 5-2: Life Cycle Cost Analysis of different concrete mixtures
Cost NC – C40 HPC – C55 ICC - C55
Initial Cost (LE/m2) 71 80 109
PVLCC @60Y (LE/m2) 1,218 1,035 927
The above table shows the difference between the 3 concrete types and the
corresponding initial and Present Value Life-Cycle Costs. It’s obvious that the ICC has
less frequent check, protection, maintenance and replacement times than the HPC and NC
respectively. Costs of maintenance activities were estimated from average market prices.
Over a 60-year examination period, the PVLCC for the normal concrete deck is the most
noteworthy at LE 1,218/m2, which is basically because of the shorter service life and the
more incessant maintenance and replacement exercises. The HPC deck (no internal
curing) diminished this cost by 18%, predominantly because of the more extended
service life. The ICC deck further lessened the PVLCC down to LE 927/m2, which is
31% less costly than the NC deck, or 12% less costly than the HPC deck because of the
utilization of internal curing.

78
Figure 5-4: Cumulative costs of different concrete mixtures over time in years
It can be concluded that contrasted with normal concrete, internally cured
concrete provided an extra 40 years of service life. This is because of the utilization of
lower water–cement ratio (expanding strength and diminishing permeability) joined with
the utilization of internal curing (both lessening porousness and danger of cracking). The
life-cycle cost of a bridge deck can be significantly lessened when utilizing high
performance concrete over ordinary concrete, particularly with internal curing. This can
be ascribed to less maintenance exercises and a more extended serviceability. Figure 5-4
demonstrates the present value cumulative costs incurred over the first 15 years of the 60-
year period for the three concrete deck options. It is clearly demonstrated that the higher
initial investment in the ICC deck, contrasted with the NC deck, can be counterbalanced
in just 5 years and can counterbalance the HPC cost in just 10 years, mainly because of
0
50
100
150
200
250
300
350
400
0 5 10 15
Cum
ula
tive
Cost
(L
E/m
2)
Age (Years)
NC
HPC
ICC
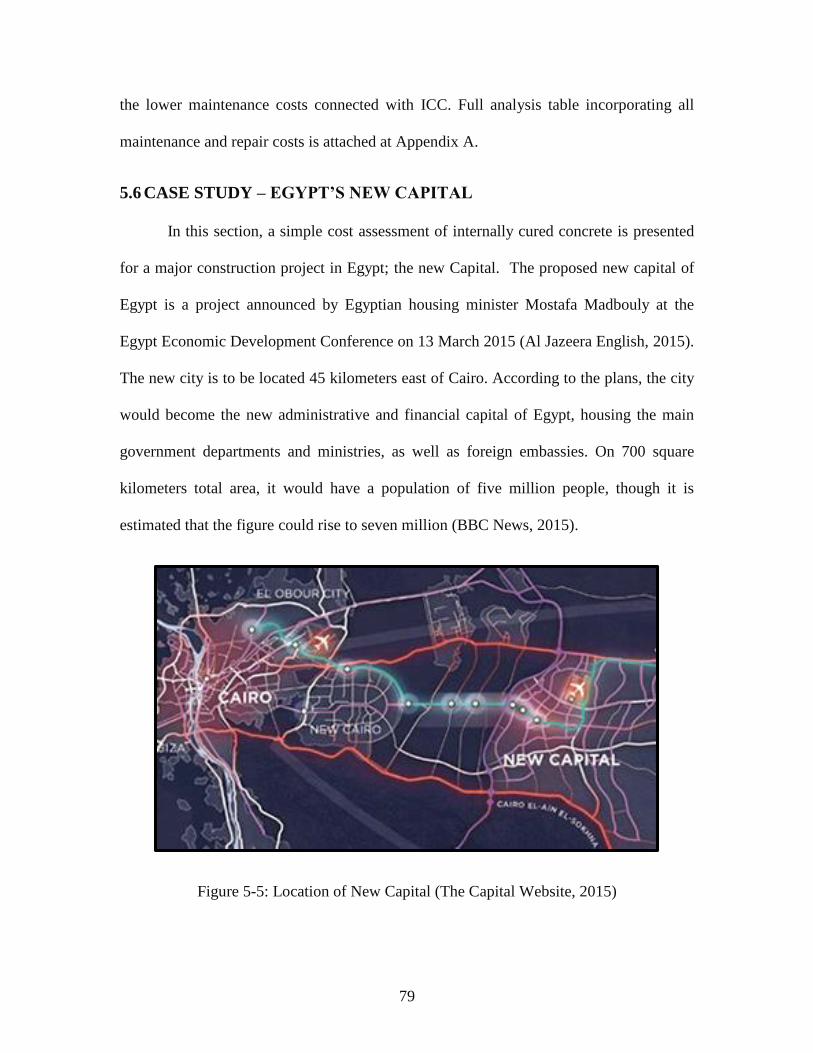
79
the lower maintenance costs connected with ICC. Full analysis table incorporating all
maintenance and repair costs is attached at Appendix A.
5.6 CASE STUDY – EGYPT’S NEW CAPITAL
In this section, a simple cost assessment of internally cured concrete is presented
for a major construction project in Egypt; the new Capital. The proposed new capital of
Egypt is a project announced by Egyptian housing minister Mostafa Madbouly at the
Egypt Economic Development Conference on 13 March 2015 (Al Jazeera English, 2015).
The new city is to be located 45 kilometers east of Cairo. According to the plans, the city
would become the new administrative and financial capital of Egypt, housing the main
government departments and ministries, as well as foreign embassies. On 700 square
kilometers total area, it would have a population of five million people, though it is
estimated that the figure could rise to seven million (BBC News, 2015).
Figure 5-5: Location of New Capital (The Capital Website, 2015)
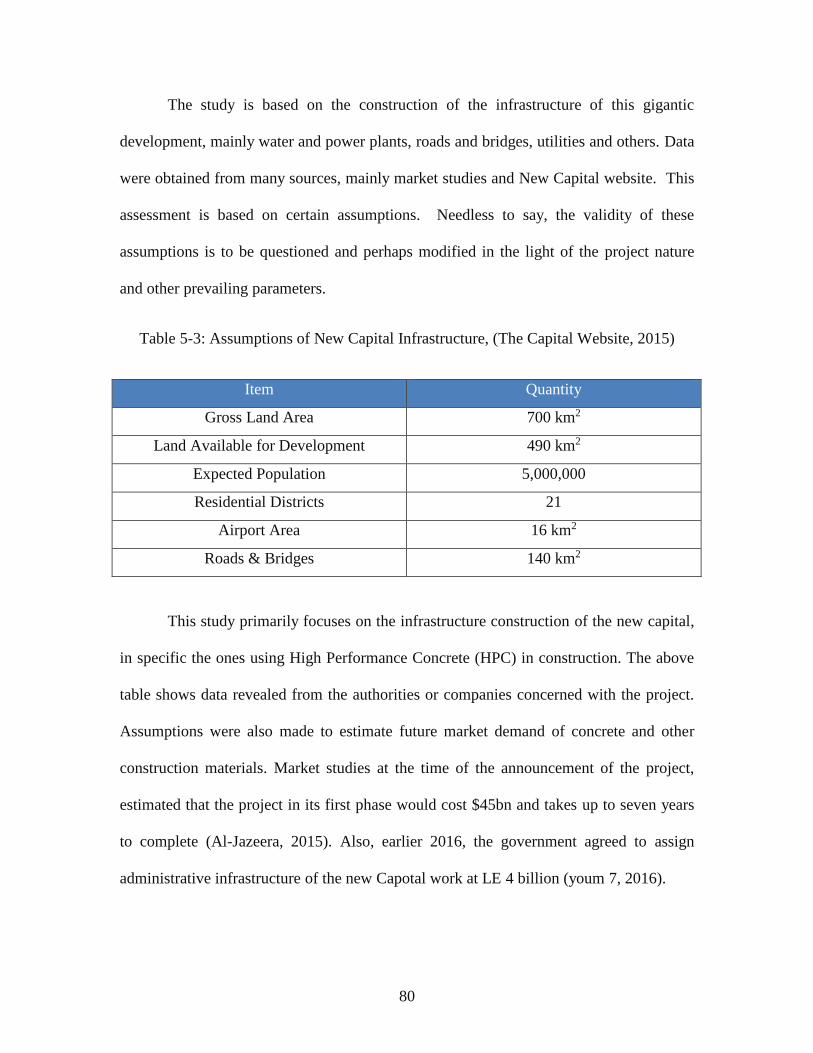
80
The study is based on the construction of the infrastructure of this gigantic
development, mainly water and power plants, roads and bridges, utilities and others. Data
were obtained from many sources, mainly market studies and New Capital website. This
assessment is based on certain assumptions. Needless to say, the validity of these
assumptions is to be questioned and perhaps modified in the light of the project nature
and other prevailing parameters.
Table 5-3: Assumptions of New Capital Infrastructure, (The Capital Website, 2015)
Item Quantity
Gross Land Area 700 km2
Land Available for Development 490 km2
Expected Population 5,000,000
Residential Districts 21
Airport Area 16 km2
Roads & Bridges 140 km2
This study primarily focuses on the infrastructure construction of the new capital,
in specific the ones using High Performance Concrete (HPC) in construction. The above
table shows data revealed from the authorities or companies concerned with the project.
Assumptions were also made to estimate future market demand of concrete and other
construction materials. Market studies at the time of the announcement of the project,
estimated that the project in its first phase would cost $45bn and takes up to seven years
to complete (Al-Jazeera, 2015). Also, earlier 2016, the government agreed to assign
administrative infrastructure of the new Capotal work at LE 4 billion (youm 7, 2016).

81
Figure 5-6: New Capital prototype unveiled in EEDC 2015 (Al-Jazeera, 2015).
The case study will focus on the advantages incorporated upon using Internally
Cured Concrete (ICC) versus using conventional high performance concrete (HPC). The
aspects examined are mainly economical and environmental. The economical aspect,
carried out in the previous section, is represented through the costs saved in the entire
service life of a certain structure and the costs saved in maintenance and repairs.
Environmental aspect is mainly the water saved during the conventional water curing
through surface splashing. Assuming a service life of 60 years, and incorporating all
maintenance and repair costs, previous section concluded a cost saving of LE 1,965 per
cubic meter of concrete between HPC and ICC. Also water saving of 192 Liters per cubic
meter of concrete including mixing and curing water. Market studies and analysis
estimated additional 35 Million cubic meters of concrete dedicated for the construction of
first stage of the new Capital (EIU, 2015). It can be assumed that 20% of this quantity is

82
dedicated for infrastructure and utilities, summing 7 Million cubic meters. Following are
the carried out calculations:
Table 5-4: Economical Savings from incorporating ICC in New Capital
Concrete Quantity for Infrastructure 7,000,000 m3
Cost Saving per m3 LE 1,455
Total Cost Saving LE 10.2 Billion
Results listed in table 5-4 conclude that the use of internally cured concrete for the
infrastructure projects as an alternative to the conventional concrete can save up to LE
10.2 billion, or alternatively, 1.15 billion US dollars which is almost 3% from the entire
project budget.
Table 5-5: Water Savings from using ICC in New Capital Infrastructure
Concrete Quantity for Infrastructure 7,000,000 m3
Water Saving per m3 0.195 m3
Total Water Saving 1.365 Million m3
Results listed in table 5-5 reveal environmental aspect of adapting ICC
technology in the new capital. Almost 1.5 Million cubic meters of water are saved from
being randomly and uncontrollably splashed over concrete structures for curing.
Both cost and water saving assert on the potential of adapting the technology of
internally cured concrete for infrastructure uses. The ICC, if used in the new capital, can
save up to 3% of total project budget and almost 1.5 Million cubic meters of fresh water
over the 7 years of the first stage of the project.

83
CHAPTER 6
CONCLUSIONS AND RECOMMENDATIONS
In this chapter, an overall summary as concluding remarks of this study as well as
recommendations for applicators and future research work are provided.
6.1 CONCLUSIONS
In the light of scope, types and dosages of materials investigated as well as other
experimental parameters and variability associated with this work, the following key
conclusions can be warranted:
1. The concrete mixtures incorporating saturated lightweight and recycled concrete
aggregates demonstrate increase in slump values that increases with the increase
of pre-wetted aggregate content. The slump increase reflects an overall enhanced
workability of Internally cured concrete
2. Incorporating pre-wetted lightweight and recycled concrete aggregates led to a
slight increase in air content. Air content increased with higher replacement
dosages possibly due to the porosity nature of lightweight and recycled
aggregates. However, such increase is considered insignificant.
3. Lightweight and recycled concrete aggregates mixtures possess slightly less unit
weight compared to conventional concrete mixtures.
4. Compressive strength of concrete showed to be clearly affected by curing mode,
tests reveal highest values for full curing followed by ones cured by curing
compound and least values for non-cured specimens.

84
5. Compressive strength of internally cured concrete was lower than conventional
concrete made with conventional aggregates. The drop in strength was higher as
the lightweight and recycled concrete aggregates dosages increased.
6. Aggregate type, dosage and dispersion are three principal factors that affect
compressive strength of internally cured concrete.
7. Internally cured concrete yielded similar strength development from 7-28 days
compared to conventional concrete. However, the 28-56 days strength
development is significantly higher for internally cured concrete, due to the
enhanced hydration process that maintained the relative humidity levels in the
internally cured concrete mixtures.
8. Flexural strength results have fairly comparable patterns to those of compressive
strength as increased dosages yield lower strength. Recycled aggregates concrete
promoted flexural strength that is comparative or surpassing conventional
mixtures. Possibly due to the Interfacial Transition Zone (ITZ) between aggregate
surface and concrete paste, which enhanced internal properties and caused better
aggregate-paste interlocking.
9. Flexural-compressive strength ratio for mixtures of internally cured concrete is
higher than mixtures of conventional concrete. Also possibly due to to the
Interfacial Transition Zone (ITZ) between aggregate surface and concrete paste.
10. Internally cured concrete mixtures had critical impact in decreasing shrinkage and
shrinkage cracking. Such reduction was higher after increasing the replacement
dosages of lightweight and recycled concrete aggregates.

85
11. Rapid chloride permeability test (RCPT) reveal that concrete’s unit weight, curing
mode and aggregate porosity are the main factors that affect the penetrability of
the concrete section.
12. RCPT also revealed that internally cured concrete yielded slightly lower
performance compared to conventional concrete. However, Internally cured
mixtures yielded significantly better improvement from 56-28 days.
13. Abrasion resistance of internally cured concrete is similar to that of conventional
concrete. This was the case for mixtures made with both lightweight and recycled
concrete aggregates.
14. Internally cured concrete can save considerable amounts of water transported
specially to mobile areas. This is of high importance since Egypt is undergoing
numerous number of gigantic projects in areas of not steadily fresh water supply.
15. As Egypt faces a water scarcity challenge, internally cured concrete decreases
water consumption drastically and saves water from being randomly and
uncontrollably splashed on concrete
16. A simple Life-Cycle Cost Analysis reveals that internally cured concrete saves up
to 31% of cost throughout its service life compared to conventional concrete
17. The higher initial investment of internally cured concrete can be counterbalanced
because of the lower maintenance costs associated.
18. Egypt, if utilizes internally cured concrete in the New Capital Project for example,
can save up to LE 10.2 Billion and 1.5 Million cubic meters of water throughout
the duration of the first stage of the project on Infrastructure construction &
maintenance.

86
6.2 RECOMMENDATIONS FOR FUTURE WORK
This investigation pinpoints specific areas where recommendations can be made and
further studies to be conducted including the following:
1. Other types of lightweight aggregates need to be examined and in different
dosages to compare to current tested ones
2. The influence of age of crushing the aggregates and storage time need to be
further examined.
3. Nature of interference between lightweight aggregates and other cementitious
binding materials (i.e. slag, silica fumes, etc.) shall be further examined
4. Fire resistance should be tested to assess performance of internally cured concrete
in cases of increased temperatures.
5. Further durability tests are needed such as freezing and thawing, scaling, chemical
durability and water permeability.
6. It is recommended that field trials be performed with instrumentation,
documentation and monitoring and on extended periods of time to be able to
quantify benefits of technology to enable it to be more commonly used.

87
6.3 RECOMMENDATIONS FOR APPLICATORS
Methodologies for executing internal curing underway are basically the same as those
utilized for delivering lightweight concretes for over 50 years.
1. At the ready-mix plant, a separate bin may be used for the lightweight aggregates
or could be kept in sprinkled piles at the site, The time required for sprinkling a
new pile before use in concrete is dependent on the application rate of the water
and the aggregate’s absorption characteristics
2. As with any aggregate being incorporated into a concrete, the moisture content
and absorption capacity of the LWA must be known prior to the final
proportioning of the concrete
3. Crushing of concrete to be used as recycled concrete aggregates must follow a
standard procedure of crushing, removing impurities and finally grading.
4. Mixing saturated aggregates with other ingredients of concrete follows the same
standard procedure of mixing and batching of ready-mix concrete.
5. Applicators must be aware that they are dealing with a material that has a
different nature and characteristics than conventional concrete. Handling time
must be controlled, so that the lightweight aggregates don't lose its water before
setting. Also, pumping should be something well handled to prevent segregation
or separation of lightweight aggregates from concrete (common defect in ultra
lightweight aggregates)
6. Concrete finishing is basically the same as that of the conventional concrete.
88
REFERENCES
Abou-Zeid, M. N., Khandil, A. A. and El-Saaran, I. M. “Recycled Concrete: Myth or
Reality”. 8th International Colloquium on Structural and Geotechnical Engineering,
Ain Shams University, Proceedings, December 1998.
Abou-Zeid, M. N., Ismael, M. and Hammam, A. “ Incorporation of lightweight and
recycled aggregates for concrete curing”. CSCE Annual Conference, 2015
ACI 213R-03: Guide for Structural Lightweight-Aggregate Concrete. ACI Committee
213. American Concrete Institute, Farmington Hills, Michigan, 2012.
ACI 308R-01: Guide to Curing Concrete. ACI Committee 308. American Concrete
Institute, Farmington Hills, Michigan, 2015.
Aitcin, Pierre-Claude, and Barbara B. Stern. High-performance Concrete. London: E&FN
Spon, 1998.
Alberty, R., & Daniels, F. Physical Chemistry. New York: John Wiley & Sons, 1980
Al Jazeera English. "Egypt Plans New Capital Adjacent to Cairo." 14 Mar. 2015.
<http://www.aljazeera.com/news/2015/03/egypt-plans-capitaladjacent-cairo
150314014400946.html>.
Al Wafd. Report: 40% of Bridges Egypt at Risk and in Danger of Collapse. 8 Feb. 2016.
<http://alwafd.org/>.

89
Babcock, Anthony, and Peter Taylor., IMPACTS OF INTERNAL CURING ON
CONCRETE PROPERTIES: Literature Review. Iowa Highway Research Board,
2015.
BBC News. "Egypt Unveils Plans to Build New Capital East of Cairo " BBC News. 13
Mar. 2015. <http://www.bbc.com/news/business-31874886>.
Bediako, Mark, J. T. Kevern, and Eric Opoku Amankwah, Effect of Curing Environment
on the Strength Properties of Cement and Cement Extenders. Scientific Research
Publishing Inc., 2015.
Bentur, A., Igarishi, S., & Kovler, K., Control of Autogenous Stresses and Cracking in
High Strength Concretes. Proceedings of the 5th International Symposium on
High Strength/High Performance Concrete, Sandefjord, 1999.
Bentz, D.P., "Influence of Internal Curing Using Lightweight Aggregates on Interfacial
Transition Zone Percolation and Chloride Ingress in Mortars," Cement and
Concrete Composites, 2009.
Bentz, Dale P., Transport Properties and Durability of Concrete Literature Review and
Research Plan. McLean, VA: U.S. Dept. of Transportation, Federal Highway
Administration, 2002.
Bentz, Dale P., Pietro Lura, and John W. Roberts. Mixture Proportioning for Internal
Curing. Concrete International, 2005.

90
Bentz, Dale P., and W. Weiss. Internal Curing: A 2010 State-of-the-art Review.
Gaithersburg, MD: U.S. Dept. of Commerce, National Institute of Standards and
Technology, 2011.
Bentz, D., Hansen, K., Madsen, H., Vallee, F., & Griesel, E. Drying/Hydration in
Cement Pastes during Curing. Materials and Structures, 2001.
Bentz, D., Lura, P., & Roberts, J. Mixture Proportioning for Internal Curing.
Concrete International, 2005.
Bentz, D., Snyder, K., & Peltz, M., Doubling the Service Life of Concrete Structures. II:
Performance of Nanoscale Viscosity Modifiers in Mortars. Cement and Concrete
Composites, 2010.
Bremner, T., & Ries, J., Stephen J. Hayde: Father of the Lightweight Concrete
Industry. Concrete International , 2009
Castro, J., Keiser, L., Golias, M., & Weiss, W., Absorption and Desorption of Fine
Lightweight Aggregate for Applications to Internally Cured Concrete
Mixtures. Cement and Concrete Composites, 2011.
Cusson, D., & Hoogeveen, T., Internal Curing of High-Performance Concrete with
Pre-soaked Lightweight Aggregate Sand for Prevention of Autogenous
Shrinkage Cracking. Cement and Concrete Research, 2008
Cusson, D., Lounis, Z., & Daigle, L., Benefits of Internal Curing on Service Life and
Life-Cycle Cost of High-Performance Concrete Bridge Decks - A Case Study.
Cement and Concrete Composites, 2010

91
Daily News Egypt. "Shoukry in Addis Ababa for Talks over Grand Ethiopian
Renaissance Dam, 2014 <http://www.dailynewsegypt.com/2014/11/02/shoukry
addisababa-talks-grandethiopian-renaissance-dam/>.
Di Bella, C., Schlitter, J., & Weiss, W., Construction Documentation of Bloomington
Bridges, 2010.
Eagle Crushers. 2016. <http://www.eaglecrusher.com/>.
EIU: The Economist Intelligence Unit. "Egypt: Annual Report”. Mar. 2015.
<http://country.eiu.com/egypt>.
ElBaradei, Sherine. "Ethiopia's Renaissance Dam: What Options Are Left for Egypt?"
Ahram Online. 11 Mar. 2016.
Foster Supply. 2012. <http://www.fostersupply.com>.
Friggle, T., & Reeves, D. Internal Curing of Concrete Paving: Laboratory and Field
Experience. In D. Bentz, & B. Mohr (Ed.), Internal Curing of High Performance
Concretes: Laboratory and Field Experiences Farmington Hills: American
Concrete Institute, 2008.
GARBLT. "National Roads Project 2015." - General Authority For Roads, Bridges &
Land Transport. Web. 04 Nov. 2015.
Golias, M., The Use of Soy Methyl Ester-Polystyrene Sealants and Internal Curing
to Enhance Concrete Durability, M.S. Thesis. West Lafayette: Purdue
University, 2010.

92
Gonnerman HF, Shuman EC., Flexure and tension tests of plain concrete. Major series
171, 209 and 210. Report of the Director of Research. Port. Cem. Assoc., 1928.
Hammer, T.A., Bjontegaard, O., and Sellevold, E.J., Internal Curing - Role of
Absorbed Water in Aggregates, ACI SP-218, High Performance Structural
Lightweight Concrete, Eds. J.P. Ries and T.A. Holm, 2004.
Halamickova, P., Detwiler, R., Bentz, D., & Garboczi, E., Water Permeability and
Chloride Ion Diffusion in Portland Cement Mortars: Relationship to Sand Content
and Critical Pore Diameter. Cement and Concrete Research, 1995.
Hawk, H. Life-Cycle Cost Analysis. Washington: Transportation Research Board.
NCHRP Report 483, 2003.
Henkensiefken, R., Briatka, P., Bentz, D., Nantung, T., & Weiss, J. Plastic Shrinkage
Cracking in Internally Cured Mixtures Made with Pre-wetted Lightweight
Aggregate. Concrete International, 2010.
Henkensiefken, R., Castro, J., Bentz, D., Nantung, T., & Weiss, J. Water Absorption in
Internally Cured Mortar Made with Water-Filled Lightweight Aggregate.
Cement and Concrete Research, 2009.
Henkensiefken, R., Nantung, T., & Weiss, W., Internal Curing - From the Laboratory to
Implementation. International Bridge Conference, 2009
Henkensiefken, R., Nantung, T, and Weiss, J. Reducing Restrained Shrinkage
Cracking in Concrete: Examining the Behavior of Self-Curing Concrete Made
using Different Volumes of Saturated Lightweight Aggregate, 2008.
93
Holm, T., Bremner, T., & Newman, J. Lightweight Aggregate Concrete Subject to Severe
Weathering. Concrete International , 1984.
Huo, Sharon Xiaoming and Wong, Ling Ung, Early-Age Shrinkage of HPC Decks Under
Different Curing Methods. Http://ascelibrary.org/doi/ Cookeville, TN: ASCE,
2000.
Joseph, Basil. Studies On Properties Of Self-Curing Concrete Using Polyethylene Glycol.
IOSR Journal of Mechanical and Civil Engineering (IOSR-JMCE), 2016.
Kim, H., & Bentz, D., Internal Curing with Crushed Returned Concrete Aggregates.
NRMCA Technology Forum: Focus on Sustainable Development, 2008.
Klieger, Paul., Curing Requirements for Scale Resistance of Concrete. Chicago: Portland
Cement Association, 1957.
Kovler, K., and Ole Mejlhede. Jensen. Internal Curing of Concrete: State of the Art
Report of RILEM Technical Committee TC 196-ICC--"Internal Curing of
Concrete" Bagneux, France: RILEM Publications, 2007.
Lamond, Joseph F., and J. H. Pielert. Significance of Tests and Properties of Concrete
and Concrete-making Materials. Philadelphia, PA: ASTM, 2006.
Lopez, M., Kahn, L., & Kurtis, K., Effect of Internally Stored Water on Creep of High
Performance Concrete. ACI Materials Journal , 2008.
Lura, P., Couch, J., Jensen, O., & Weiss, W., Early-Age Acoustic Emission
Measurements in Hydrating Cement Paste: Evidence for Cavitation during

94
Solidification Due to Self-Desiccation. Cement and Concrete Research , accepted
for publication, 2009.
Neville, A. M., Properties of Concrete, 4th Edition, Wiley, 1996
NPCA: NATIONAL PRECAST CONCRETE ASSOCIATION. Curing Wet-Cast Precast
Concrete, 2013.
Parrott, L. J.; Killoh, D. C.; and Patel, R. G., “Cement Hydration under Partially
Saturated Conditions,” Proceedings, 8th Congress on Chemistry of Cement, Rio
de Janeiro, V. 3, 1986.
Philleo, R. Concrete Science and Reality. In J. Skalny, & S. Mindess (Eds.),
Materials Science of Concrete II. Westerville, OH: American Ceramic
Society, 1991.
Powers, T., Copeland, L., & Mann, H., Capillary Continuity or Discontinuity in
Cement Pastes. The Research Bulletin of the Portland Cement Association , 1959.
Pyc, W., Caldarone, M., Broton, D., & Reeves, D., Internal Curing Study with
Intermediate Lightweight Aggregates. In D. Bentz, & B. Mohr (Ed.), Internal
Curing of High-Performance Concretes: Laboratory and Field Experiences.
Farmington Hills: American Concrete Institute, 2008.
Raoufi, K., Schlitter, J., Bentz, D., & Weiss, J., Parametric Assessment of Stress
Development and Cracking in Internally-cured Restrained Mortars Experiencing
Autogenous Deformations and Thermal Loading. Cement and Concrete
Composites, 2012.

95
Shah, S., Weiss, W., & Yang, W., Shrinkage Cracking - Can It Be Prevented?
Concrete International, 1998.
Shah, S., & Weiss, W., High Strength Concrete: Strength, Permeability, an Cracking.
Proceedings of the PCI/FHWA International Symposium on High Performance
Concrete, Orlando, 2000.
Shin, K., Bucher, B., & Weiss, W. The Role of Low Stiffness Aggregate Particles on the
Restrained Shrinkage Cracking Behavior of Mortar. ASCE Journal of
Materials in Civil Engineering, 2011.
Spears, R.E., “The 80% Solution to Inadequate Curing Problems,” Concrete
International, V. 5, No. 4, Apr., 1983.
Standard Method of Test for Specific Gravity of Hydraulic Cement. Philadelphia, PA:
American Society for Testing and Materials, 1964.
Standard Practice for Making and Curing Concrete Test Specimens in the Laboratory.
West Conshohocken, PA: ASTM International, 2007.
Standard Test Method for Compressive Strength of Cylindrical Concrete Specimens.
West Conshohocken, PA: ASTM International, 2010.
Standard Test Method for Compressive Strength of Hydraulic Cement Mortars (using 2
in. or Cube Specimens). West Conshohocken, PA: ASTM International, 2011.
Standard Test Method for Density, Relative Density (specific Gravity), and Absorption of
Coarse Aggregate. Philadelphia, PA: ASTM International, 2007.

96
Standard Test Method for Density, Relative Density (specific Gravity), and Absorption of
Fine Aggregate. Philadelphia, PA: ASTM International, 2007.
Standard Test Method for Determining Age at Cracking and Induced Tensile Stress
Characteristics of Mortar and Concrete under Restrained Shrinkage.
Standard Test Method for Electrical Indication of Concrete's Ability to Resist Chloride
Ion Penetration: Designation C1202-12. West Conshohocken: ASTM
International, 2013.
Standard Test Method for Evaluating Plastic Shrinkage Cracking of Restrained Fiber
Reinforced Concrete (using a Steel Form Insert). West Conshohocken, PA, 2006.
Standard Test Method for Fineness of Hydraulic Cement by Air Permability
Apparatus. West Conshihocken, PA: ASTM International, 2007
Standard Test Method for Sieve Analysis of Fine and Coarse Aggregates. West
Conshohocken, PA: American Society for Testing and Materials, 2001
Standard Test Method for Slump of Hydraulic-cement Concrete. West Conshohocken,
PA: ASTM International, 2015.
Suryakanta. "WHAT ARE THE EFFECTS OF IMPROPER CURING?" CivilBlogOrg.
24 July 2014. <http://civilblog.org/2014/07/25/what-are-the effects-of-improper
curing/>.
Taylor, Peter C. Moving Advancements into Practice: Curing. Iowa State U, 2015.
The Capital Cairo. 25 April. 2015. <http://thecapitalcairo.com/>.

97
Thomas, M., Chloride Diffusion in High-Performance Lightweight Aggregate
Concrete. In J. Ries, & T. Holm (Ed.), Theodore Bremner Symposium on High
Performance Lightweight Concrete, 2003.
Van Breugel, K., and Lura, P., Effect of Initial Moisture Content and Particle Size
Distribution of Lightweight Aggregates on Autogenous Deformation, Proceedings
of the 2nd International Symposium on Structural Lightweight Aggregate
Concrete, Eds. S. Helland, I. Holand, and S. Smeplass, Kristiansand, Norway,
2000.
Van Breugel, K., & de Vries, H., Mixture Optimization of Low Water/Cement Ratio,
High-Strength Concrete in View of Reduction of Autogenous Shrinkage, 1998.
Villareal, V., Internal Curing - Real World Ready Mix Production and Applications:
A Practical Approach to Lightweight Modified Concrete. In D.Bentz, & B.Mohr
(Ed.), ACI SP-256, Internal Curing of High-Performance Concrete: Laboratory
and Field Experiences.Farmington Hills: American Concrete Institute,
2008.
Villarreal, V., & Crocker, D., Better Pavements through Internal Hydration.
Concrete International, 2007.
Weber, S., & Reinhardt, H., A Blend of Aggregates to Support Curing of Concrete. In I.
Holand, T. Hammer, & F. Fluge (Ed.), Proceedings of the International
Symposium on Structural Lightweight Aggregate Concrete, 1995.

98
Wei, Y., & Hansen, W., Pre-soaked Lightweight Fine Aggregates as Additives for
Internal Curing in Concrete. In D. Bentz, & B. Mohr (Ed.), Internal Curing of
High-performance concrete, 2008.
Weiss, Jason. “Internal Concrete Curing Presentation”. Purdue University. November
19th 2011.<http:/ www.youtube.com/watch?v=Ee0HGlwKvMY>.
Weiss, Jason, Dale Bentz, Anton Schindler, and Pietro Lura. Internal Curing:
Constructing More Robust Concrete. Construction Issuees, 2012.
Weiss, Jason. Raoufi, K., Castro, J. “DEVELOPMENT OF INTERNALLY CURED
CONCRETE FOR INCREASED SERVICE LIFE”. JOINT TRANSPORTATION
RESEARCH PROGRAM. FHWA/IN/JTRP-2010/10. Final Report
Weiss, W., Yang, W., & Shah, S., Factors Influencing Durability and Early-Age
Cracking in High Strength Concrete Structures. SP-189-22 High Performance
Concrete: Research to Practice Farmington Hills: American Concrete
Institute, 1999.
WHO: World Health Organization Global Status Report on Road Safety 2013:
Supporting a Decade of Action. Geneva, 2013.
World Bank. "Egypt Signs $1 Bn Loan with World Bank for Infrastructure
Development" Egypt Home. 04 Feb. 2016.
Ye, J., Hu, S., Wang, F., Zhou, Y., Liu, Z., Effect of Pre-wetted Lightweight
Aggregate on Internal Relative Humidity and Autogenous Shrinkage of
Concrete. Journal of Wuhan University of Technology – Mater, 2006

99
Youm 7. "The government agrees to assign administrative infrastructure of the capital
work at 4 billion pounds”. 25 Jan. 2016. <http://www.youm7.com>.
Zhang, M.-H., & Gjorv, O., Permeability of High-strength Lightweight Concrete. ACI
Materials Journal , 1991.
Zhutovsky, S., Kovler, K., and Bentur, A., Efficiency of Lightweight Aggregates for
Internal Curing of High Strength Concrete to Eliminate Autogenous Shrinkage.
Materials and Structures, 2002.
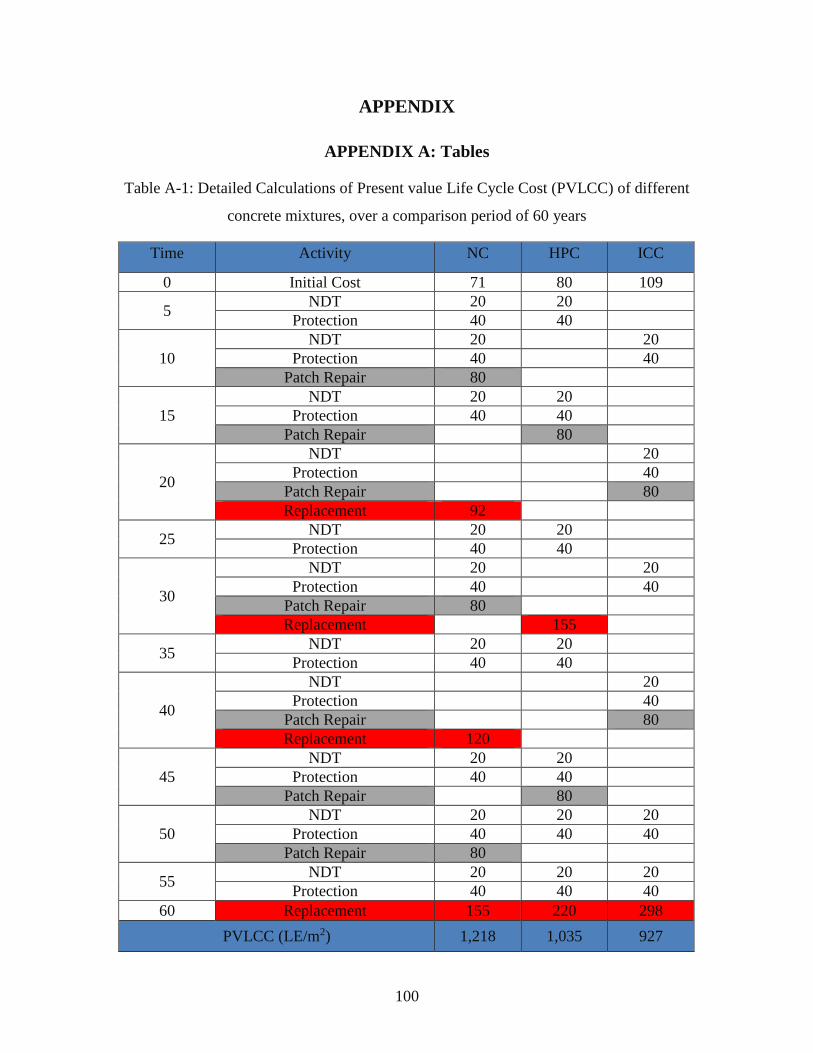
100
APPENDIX
APPENDIX A: Tables
Table A-1: Detailed Calculations of Present value Life Cycle Cost (PVLCC) of different
concrete mixtures, over a comparison period of 60 years
Time Activity NC HPC ICC
0 Initial Cost 71 80 109
5 NDT 20 20
Protection 40 40
10
NDT 20
20
Protection 40
40
Patch Repair 80
15
NDT 20 20
Protection 40 40
Patch Repair
80
20
NDT
20
Protection
40
Patch Repair
80
Replacement 92
25 NDT 20 20
Protection 40 40
30
NDT 20
20
Protection 40
40
Patch Repair 80
Replacement
155
35 NDT 20 20
Protection 40 40
40
NDT
20
Protection
40
Patch Repair
80
Replacement 120
45
NDT 20 20
Protection 40 40
Patch Repair
80
50
NDT 20 20 20
Protection 40 40 40
Patch Repair 80
55 NDT 20 20 20
Protection 40 40 40
60 Replacement 155 220 298
PVLCC (LE/m2) 1,218 1,035 927
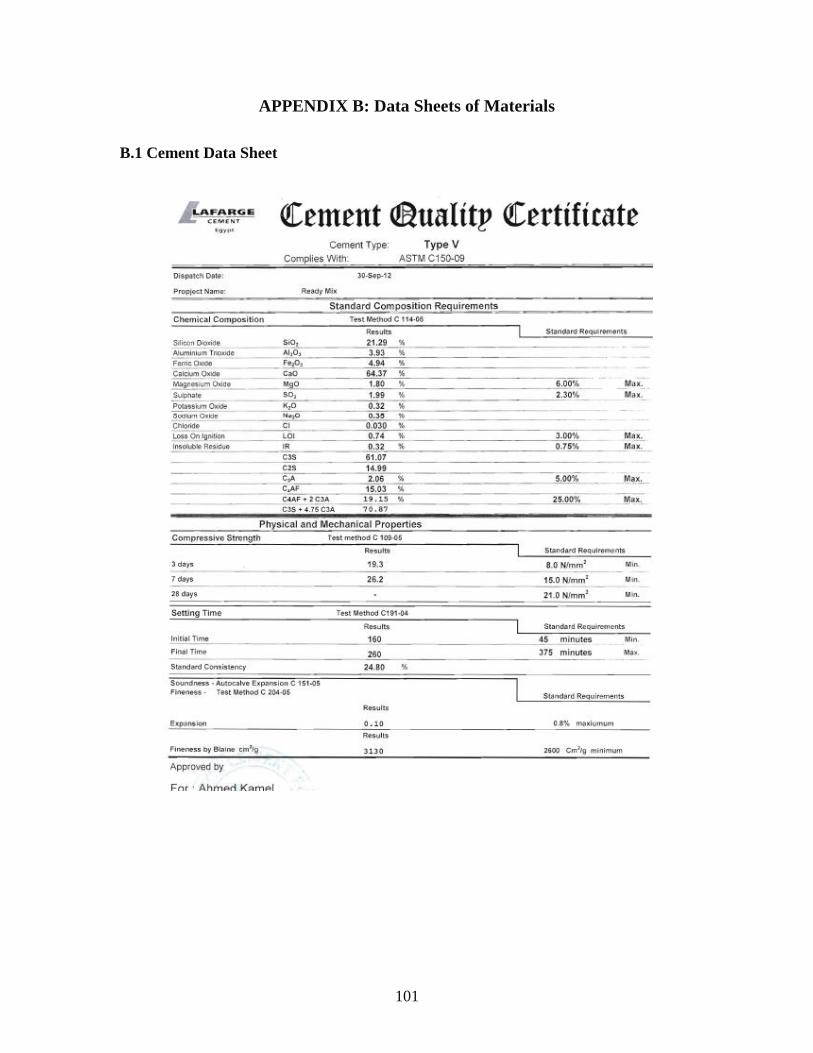
101
APPENDIX B: Data Sheets of Materials
B.1 Cement Data Sheet

102
B.2 Perlite Data Sheet

103
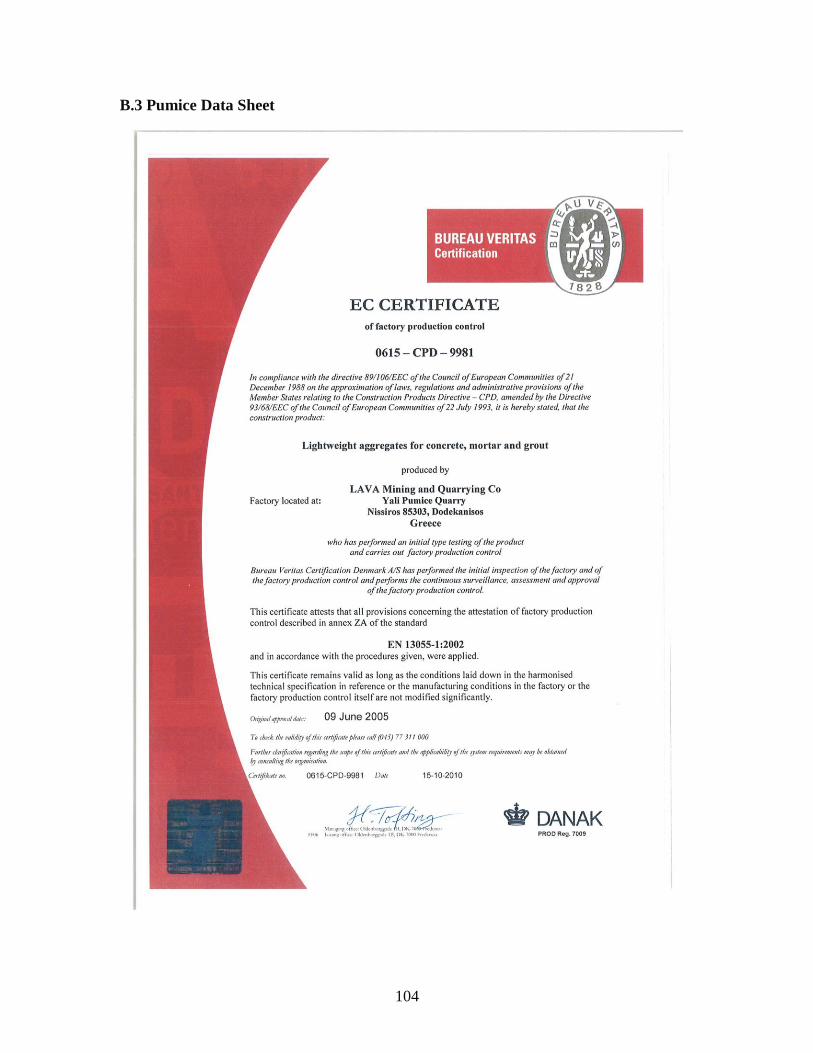
104
B.3 Pumice Data Sheet
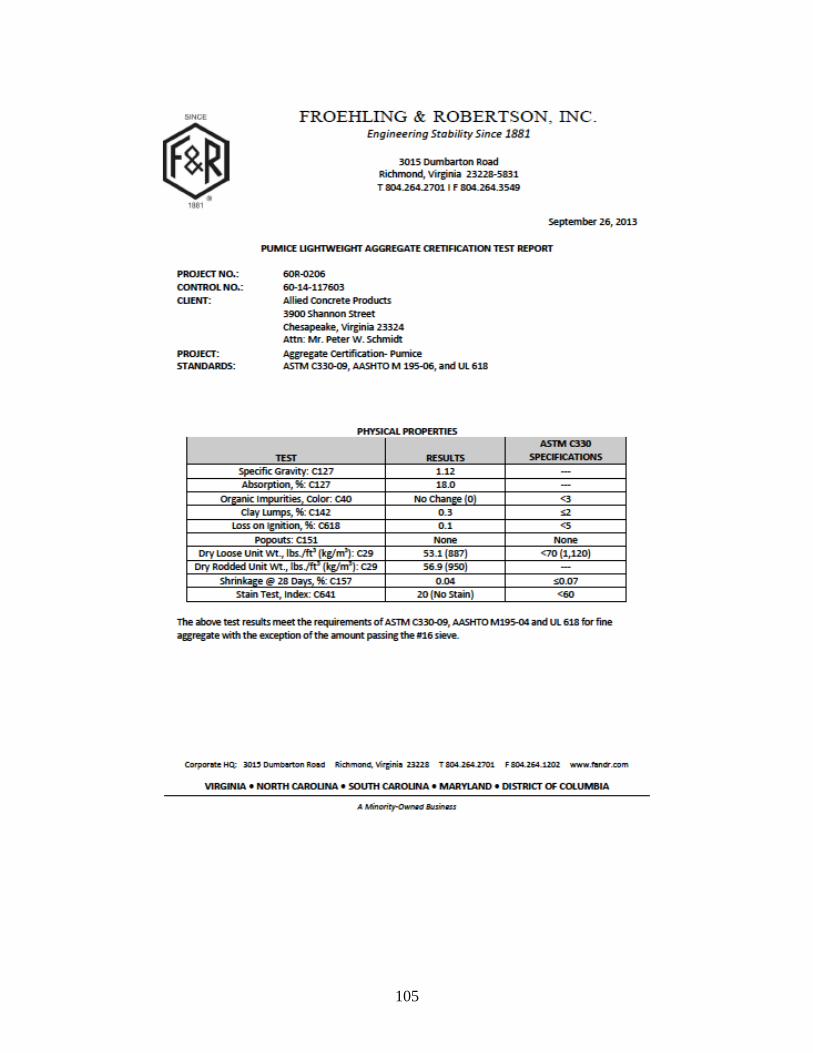
105

106
B.4 Admixture Data Sheet

107

108
B.5 Curing Compound Data Sheet

109