interlake variation and environmental controls of ... · time for this site was increased. the...
TRANSCRIPT
AQUATIC MICROBIAL ECOLOGYAquat Microb Ecol
Vol. 69: 1–16, 2013doi: 10.3354/ame01619
Published online April 3
INTRODUCTION
Lakes function as natural filters of excess nitrogen(N) load, significantly reducing the transport of Nfrom land to coastal ecosystems (e.g. Lepistö et al.2006, Seitzinger et al. 2006, Harrison et al. 2009).This takes place through sedimentation of organic Ncompounds and through microbially mediated emis-sions of N2 gas (Saunders & Kalff 2001a), primarilythrough denitrification (e.g. Seitzinger 1988) butpotentially also through anaerobic ammonium oxida-tion (anammox) (Schubert et al. 2006, Yoshinaga etal. 2011). Both processes mainly take place just
© Inter-Research 2013 · www.int-res.com*Email: [email protected]
FEATURE ARTICLE
Interlake variation and environmental controls ofdenitrification across different geographical scales
Antti Juhani Rissanen1,2,*, Marja Tiirola1, Susanna Hietanen3, Anne Ojala4
1Department of Biological and Environmental Science, University of Jyväskylä, Survontie 9, 40500 Jyväskylä, Finland2Lammi Biological Station, University of Helsinki, Pääjärventie 320, 16900 Lammi, Finland
3Department of Environmental Sciences, University of Helsinki, PO Box 65 (Viikinkaari 1), 00014 University of Helsinki, Finland4Department of Environmental Sciences, University of Helsinki, Niemenkatu 73, 15140 Lahti, Finland
FREEREE ACCESSCCESS
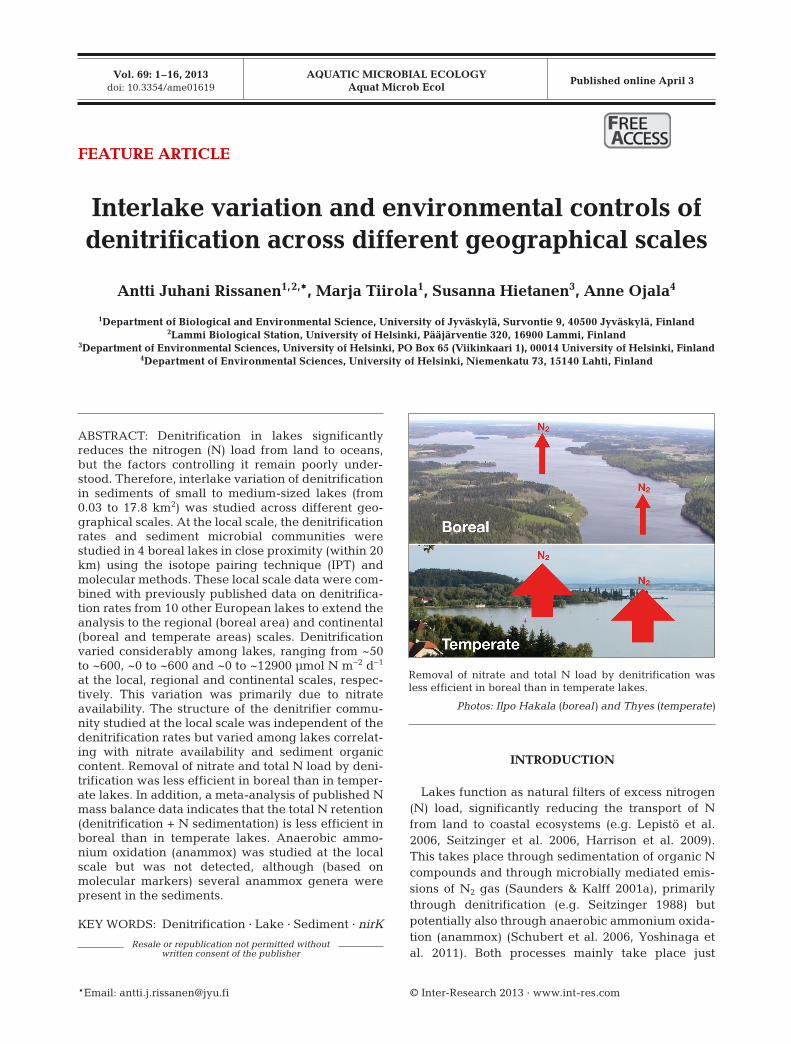
ABSTRACT: Denitrification in lakes significantlyreduces the nitrogen (N) load from land to oceans,but the factors controlling it remain poorly under-stood. Therefore, interlake variation of denitrificationin sediments of small to medium-sized lakes (from0.03 to 17.8 km2) was studied across different geo-graphical scales. At the local scale, the denitrificationrates and sediment microbial communities werestudied in 4 boreal lakes in close proximity (within 20km) using the isotope pairing technique (IPT) andmolecular methods. These local scale data were com-bined with previously published data on denitrifica-tion rates from 10 other European lakes to extend theanalysis to the regional (boreal area) and continental(boreal and temperate areas) scales. Denitrificationvaried considerably among lakes, ranging from ~50to ~600, ~0 to ~600 and ~0 to ~12900 µmol N m−2 d−1
at the local, regional and continental scales, respec-tively. This variation was primarily due to nitrateavailability. The structure of the denitrifier commu-nity studied at the local scale was independent of thedenitrification rates but varied among lakes correlat-ing with nitrate availability and sediment organiccontent. Removal of nitrate and total N load by deni-trification was less efficient in boreal than in temper-ate lakes. In addition, a meta-analysis of published Nmass balance data indicates that the total N retention(denitrification + N sedimentation) is less efficient inboreal than in temperate lakes. Anaerobic ammo-nium oxidation (anammox) was studied at the localscale but was not detected, although (based onmolecular markers) several anammox genera werepresent in the sediments.
KEY WORDS: Denitrification · Lake · Sediment · nirK
Resale or republication not permitted withoutwritten consent of the publisher
Removal of nitrate and total N load by denitrification wasless efficient in boreal than in temperate lakes.
Photos: Ilpo Hakala (boreal) and Thyes (temperate)
Aquat Microb Ecol 69: 1–16, 2013
below the oxic-anoxic interface of sediments. There,the processes are fed both by nitrate/nitrite diffusingto the anoxic zone from the overlying water and bynitrate/nitrite produced in the oxic surface zone bynitrification. Knowledge of the abiotic and biotic fac-tors affecting N2 production over variable spatialscales is important in lake management, where oneof the aims is to retain the N removal capacity oflakes.
Studies on single lakes have produced varyingresults in terms of the environmental factors affectingdenitrification in lake sediments, such as tempera-ture (Ahlgren et al. 1994, Saunders & Kalff 2001b),nitrate concentration in the water above the sedi-ment (e.g. Risgaard-Petersen et al. 1999, Rissanen etal. 2011) or the organic matter content of sediment(Saunders & Kalff 2001b). Environmental controlsdiffer between denitrification supported by nitratefrom nitrification (coupled nitrification-denitrification[Dn]) and denitrification supported by nitrate fromthe overlying water (Dw) (e.g. Cornwell et al. 1999).For instance, increasing temperature of the wateroverlying the sediment enhances nitrification, whichin turn would support higher Dn (Berounsky & Nixon1990, Rysgaard et al. 1994, Bruesewitz et al. 2009),whereas Dw depends on the nitrate concentration inthe water above the sediment (e.g. Rysgaard et al.1994). In addition, the oxygen concentration of thewater overlying the sediment affects the relativeimportance of Dn and Dw by controlling the thick-ness of the oxic sediment surface (e.g. Rysgaard et al.1994). The variable results in single lake studies,therefore, reflect interlake differences in the domi-nance of Dw and Dn in denitrification. In contrast,interlake studies undertaken in Norway (Kelly et al.1987, McCrackin & Elser 2010) and the USA (Kelly etal. 1987, McCrackin & Elser 2012) indicate that ingeneral, nitrate concentration in the water above thesediment correlates with the sediment denitrificationrate and could thus be used as an easily measurablepredictor of lacustrine N2 production at the interlakescale. These studies, however, were conducted usingeither the acetylene inhibition technique (McCrackin& Elser 2012) or 15N-labelling (Kelly et al. 1987),which do not account for Dn (e.g. Groffman et al.2006). In addition, except for Kelly et al. (1987), suchstudies have not been performed on large geograph-ical scales, probably because data on denitrificationin boreal, lake-rich areas have been scarce (Ahlgrenet al. 1994, Rissanen et al. 2011, Holmroos et al.2012). Therefore, additional interlake studies, utiliz-ing a technique, such as the isotope pairing tech-nique (IPT), that accounts for both Dw and Dn
(Nielsen 1992, Steingruber et al. 2001), should beperformed on different spatial scales to gain deeperinsights into factors affecting denitrification.
Besides environmental factors, differences in theprocess rates can also be related to variations in thestructure of microbial communities (e.g. Magalhãeset al. 2008, Enwall et al. 2010). However, onlyrecently has attention been paid to denitrifier andanammox communities in lake sediments (e.g. Kim etal. 2011, Rissanen et al. 2011, Yoshinaga et al. 2011).Anammox communities have usually been studiedby characterizing 16S rRNA gene sequence librariesgenerated using specific primers targeted at theanammox-branch within the Planctomycetes (e.g.Dale et al. 2009), while the denitrifier communitieshave most often been studied by microbial commu-nity fingerprinting (e.g. denaturing gradient gel elec-trophoresis [DGGE]) (Muyzer et al. 1993) of thesequence variation of nitrite reductase genes, nirKand nirS (Wallenstein et al. 2006). The only previouslake sediment study combining denitrification ratemeasurements with community analyses (nirK-genebased DGGE) showed that temporal and spatial vari-ation of denitrification rates in a boreal lake was notrelated to the nirK-community structure (Rissanen etal. 2011). Whether the same holds true for interlakedifferences requires further studies.
Here, we evaluated the interlake variations andfactors affecting denitrification in lakes. The studywas carried out at a local scale in boreal lakes ofclose proximity (within 20 km) as well as at regional(boreal lakes within 500 km) and continental scales(boreal and temperate lakes within 2300 km). At thelocal scale, we collected data on denitrificationrates, environmental factors and microbial commu-nities from 3 boreal lakes and complemented thisdata set with previously published data from LakeOrmajärvi (Rissanen et al. 2011). For the broadergeographical scales, we supplemented our data setwith denitrification data from 10 previously studiedEuropean lakes. We tested whether nitrate concen-tration in the water above the sediment is the mostimportant factor affecting and predicting denitrifi-cation across different geographical scales, as sug-gested by previous studies (e.g. McCrackin & Elser2010, 2012). Additionally, we tested whether otherenvironmental factors, i.e. temperature, oxygen con-centration and organic matter content of sedimentas well as the structure of microbial communities,affect denitrification. Finally, we assessed the vari-ability, efficiency and controlling factors of denitrifi-cation and N removal capacities of lakes at differentgeographical scales.
2

Rissanen et al.: Denitrification in lakes
MATERIALS AND METHODS
Study lakes
Lakes Pääjärvi, Ormajärvi, Suolijärvi and Lehee, located in southern Finland, represent typical small tomedium-sized boreal lakes with differences in mor-phometry and trophic status (Fig. 1, Table 1). Pääjärviand the chain of Ormajärvi, Suolijärvi and Lehee form2 separate headwater lake systems of the Kokemäen-joki River Basin draining to the Bothnian Sea in thenorthern part of the Baltic Sea (Fig. 1). Pääjärvi isdeep, with a maximum depth of 87 m, whereas Suoli-järvi and especially Lehee are shallow. The mean res-idence time in Pääjärvi and Ormajärvi is ~3 yr, butSuolijärvi and Lehee are flushed very quickly (meanresidence time < 0.5 yr) (Table 1). Pääjärvi is mesotro-phic, whereas the lake chain is classified as eutrophic.
Except for the polymictic Lehee, all of the lakes aredimictic and stratify thermally in summer, but theyhave an oxic hypolimnion throughout the open waterperiod. Ormajärvi has a lower TOC concentration andcolour value (TOC: 9.0 g C m−3; colour 34 g Pt m−3)than Pääjärvi, Suolijärvi and Lehee (TOC: 11 to 12.3 gC m−3; colour 87 to 100 g Pt m−3). All of the lakes haveforested catchments; forests cover ~60% of catch-ments around Pääjärvi and Ormajärvi and ~70%around Suolijärvi and Lehee. Agricultural land useis highest in the catchment area of Ormajärvi (26%)followed by Pääjärvi and Suolijärvi (18%), whereasthe agricultural land use is lowest in the catchmentarea of Lehee (13%).
Sample collection
The profundal sediments of Pääjärvi, Suolijärvi andLehee were sampled in June and October 2007 from3 sites of differing depths (A, B and C; Fig. 1) usingplexiglass tubes (diameter = 7 cm) connected to agravity corer. For the denitrification incubations, 6 to7 sediment cores were collected from each Site A dur-ing both months and from Site C in Pääjärvi in Octo-ber. In addition, 3 cores from each Site A and fromSite C in Pääjärvi in October and 1 core from the restof the Sites B and C were collected for physico-chem-ical and molecular analyses. Since almost half of theincubations in Site As in Pääjärvi in June gave negli-gible denitrification rates (see ‘Results’), the sampling
3
Pääjärvi Ormajärvi Suolijärvi Lehee
Latitude (° N) 61.07 61.10 61.13 61.17Longitude (° E) 25.13 24.97 24.81 24.79Area (km2) 13.4 6.5 2.1 1.1Catchment area (km2) 199 116 214 243Max. depth (m) 87 31 10 4Mean depth (m) 15 9 5 1Mean residence 3.3 2.9 0.4 0.1time (yr)
Table 1. Characteristics of the study lakes at the local scale analysis
Fig. 1. Europe (left) showing the location of the boreal study lakes in the local scale analysis (black square) and the location ofother lakes in the regional and continental scale analysis (grey squares) and study lakes (right) showing the location of the
sampling sites (A, B and C, black squares, depths shown). Lakes are 1: Pääjärvi, 2: Ormajärvi, 3: Suolijärvi, 4: Lehee

Aquat Microb Ecol 69: 1–16, 2013
in October was changed to Site Aa, and the incubationtime for this site was increased. The littoral (Sites Lit1and Lit3) and profundal cores (Site A) from Ormajärvi(on each occasion, 3 for denitrification incubationsand molecular biological analyses and 1 for physico-chemical analyses and 3 additional cores for determi-nation of 15NO3
− concentration in October 2006) werecollected 3 times during the open-water period 2006(June, August and October) and once in winter 2007(February and March) (Rissanen et al. 2011) (Fig. 1).Immediately after sampling, the cores were sealedwith rubber stoppers at both ends, covered with blackplastic, placed in a cool box in an upright position andcarefully transported to the laboratory for processingwithin 1 to 2 h of sampling.
Background data analyses
Concurrent with the sediment coring, profiles ofoxygen concentrations, oxygen saturation and tem-perature were taken for the whole water columnusing a portable field meter (YSI model 58, YellowSprings Instruments) starting ~10 cm above thesediment surface. Concentrations of dissolved inor-ganic nutrients ([NO3
−+NO2−], [NH4
+] and [PO43−])
were measured from samples taken 2 to 3 cmabove the sediment surface. In Pääjärvi, Suolijärviand Lehee, inorganic nutrients were also deter-mined from the sediment pore-water (top-most 0 to2 cm), which was extracted by centrifugation. Foranalyses of water column nutrients, samples werefiltered through a 0.2 µm pre-rinsed filter (Milli-pore). Inorganic phosphorus (Murphy & Riley1962), ammonium (Solorzano 1969) and nitrate+nitrite N (Wood et al. 1967) were determined withflow injection analysis using standard methods(QuikChem®8000, Lachat Instruments). In addition,sediments were characterized for their content oforganic matter (LOI, %) and porosity. LOI wasmeasured as a ratio of loss of mass after combustionat high temperature (450°C, 4 h) to the dry mass(determined by drying at 60°C for 48 h).
Denitrification measurements
Denitrification was assayed in the laboratory usingthe isotope pairing technique (IPT) (Nielsen 1992,Risgaard-Petersen et al. 2003). A total of 1 to 3 intactsubsamples of sediment and water from each sam-pling core were taken with plexiglass tubes of 16 cmin length and 2.6 cm in diameter. The subsamples
were enriched with K15NO3 (98 atom %; CambridgeIsotope Laboratories) to concentrations of 40, 80, 120and 160 µmol l−1 (n = 2 to 4 in each concentration).After incubations (3 to 4 h, except 6 h for Site Aa, indarkness at in situ temperature), microbial activitywas terminated by adding 1 ml ZnCl2 (1 g ml−1), thesamples were mixed, and subsamples of the sedi-ment−water slurry were transferred to gas-tight glassvials (12 ml; Exetainer®, Labco). The samples wereanalysed for their mass ratios of N2 using a massspectrometer (Europa Scientific, Roboprep-G-Plusand Tracermass) at the National EnvironmentalResearch Institute in Silkeborg, Denmark.
D15 (the denitrification rate of added 15NO3−) was
calculated as the sum of all 15N species formed(Nielsen 1992):
D15 = (14N15N) + 2(15N15N) (1)
D14 (the denitrification rate of natural 14NO3−,
henceforth referred to as denitrification) is thenderived from the following equation (Nielsen 1992):
D14 = D15 × (14N15N)/[2(15N15N)] (2)
Denitrification is then converted to units of µmol Nm−2 d−1 by multiplying by the total volume of the sample (= volume of the water phase + volume ofsediment × porosity) and by dividing by the surfacearea of the sample and the incubation time.
Dw (denitrification based on natural 14NO3− dif-
fused to the denitrification zone from the water over-lying the sediment) was calculated using the ratio of14NO3
− and 15NO3− available in the water phase:
Dw = D15 × (a/b) (3)
where a is the natural concentration of 14NO3− close
to the sediment surface (here assumed to be approx-imately the same as combined [NO2
−+ NO3−]), and b
is the added concentration of 15NO3−. Thereafter, Dn
(coupled nitrification-denitrification, i.e. denitrifica-tion of 14NO3
− produced in the oxic sediment surfacezone via nitrification) can be calculated as follows:
Dn = D14 − Dw (4)
The different concentrations of 15NO3− were used
both to test the underlying assumptions of IPT onindependence of denitrification and positive depend-ence of D15 on added [15NO3
−] (Nielsen 1992) and todetect the possible anammox activity. Presence ofanammox compromises the assumption that denitrifi-cation does not depend on the added [15NO3
−]because more 14N15N is produced (via pairing of15NO3
− and 14NH4+) than would be the case due to
denitrification only (Risgaard-Petersen et al. 2003).
4

Rissanen et al.: Denitrification in lakes
Molecular characterization of sediment samples
The microbial communities in the surface layer (0to 2 cm) of the sediment were studied from the corescollected from Sites A, B and C in June and October2007 and compared with the profundal samples (SiteA, 0 to 1 cm) of Ormajärvi taken in June and October2006 (Rissanen et al. 2011). In addition, a samplefrom the 0 to 5 cm surface layer of an additional corein Ormajärvi was taken on both occasions. Sedimentswere slurried, divided into 200 µl aliquots and storedat −20°C before nucleic acid extraction within 1 to5 mo. Nucleic acids were extracted using a modifiedversion of the bead-beating and phenol–chloroformextraction protocol of Griffiths et al. (2000) (see Rissa-nen et al. 2010 for further details).
16S rRNA gene PCR for anammox community stud-ies was conducted using anammox-specific primersand a nested PCR protocol, which is highly specific forsequences related to known anammox genera (Dale etal. 2009). The primer pairs used in the analyses werePla46F (5’-GGA TTA GGC ATG CAA GTC-3’) (Neefet al. 1998)/1037R (5’-CGA CAA GGA ATT TCG CTAC-3’) (Ludwig et al. 1992) and Amx368 (5’-TTC GCAATG CCC GAA AGG-3’) (Schmid et al. 2003, Amanoet al. 2007)/Amx820 (5’-AAA ACC CCT CTA CTTAGT GCC C-3’) (Schmid et al. 2000, Amano et al.2007) for the first and second-round PCR, respectively.The PCR was conducted in mixtures consisting of 1×DreamTaq Buffer (Fermentas), 0.3 µmol l−1 forward/reverse primer, 0.2 mmol l−1 dNTPs, 1 mg ml−1 BSA(bovine serum albumin) and 0.4 U DreamTaq (Fer-mentas). PCR products of the samples from Sites Aa
and C in Pääjärvi in October and Site A in Ormajärvi inOctober were subjected to cloning and sequencing toverify the specificity of the primers. 16S rRNA geneamplicons were cloned using EZ-cells (Qiagen) and aTOPO TA Cloning Kit for Sequencing (Invitrogen) according to the manufacturer’s instructions. Cloneswere se quenced using T7 plasmid primer, a Big Dye3.1 kit and an ABI3700 capillary sequencer (AppliedBio systems). Sequences were edited using SequenceScanner 1.0 (Applied Biosystems). Sequence align-ment, chimera-checking (Chimera-Slayer) (Haas et al.2011) and classification to operational taxonomic units(OTUs) using 97% identity threshold were conductedin Mothur (Schloss et al. 2009). No chimeric sequenceswere detected. A representative sequence of eachOTU was searched against databases using BLASTN(Altschul et al. 1997). 16S rRNA gene sequences weredeposited in the EMBL database (European Bioinfor-matics Institute, www. ebi. ac. uk/ embl/) under acces-sion numbers HE583312 to 583387.
Studies of interlake and seasonal variations in denitrifier communities were carried out using nirKPCR and DGGE analysis from DNA extractions as inRissanen et al. (2011) with the following modifications.PCR reactions of each sample were made in duplicateand pooled for DGGE analysis. A DGGE standard wasmade by pooling PCR products of different samplesand was run between every 5 to 6 samples. TheDGGE gel was stained using Sybr® Green I (Invitro-gen), illuminated in blue light (Safe Imager™, Invitro-gen) and photographed. DNA density curves for eachlane were created after a rolling disc background sub-traction, and bands (peaks) were recognized semi- automatically using Quantity One software (BioRad).Selected bands in standard lanes were aligned. Eachstandard band was given a pseudo-size number, i.e.the average relative front (fr) value multiplied by1000. Pseudo-sizes were then calculated for eachband in samples using Quantity-One (BioRad). Sam-ple bands were aligned and divided into OTUs usinga clustering-based peak alignment algorithm (Ishii etal. 2009) in R with a cut-off value representing 1% tol-erance for migration shifts. The relative abundance(%) of each OTU in each lane was quantified fromDNA density curves as a ratio of the total peak area tothe sum of all peak areas in a lane.
Statistical analyses
The assumptions underlying the IPT regarding thefirst-order kinetics of D15 and independence of den-itrification on the added concentration of 15NO3
−
were tested using ANOVA (Pääjärvi, Suolijärvi andLehee) and t-tests (Ormajärvi). A t-test was usedin Ormajärvi because there were only 2 replicatesfor one of the 15NO3
− - concentration measurements.Subsamples, i.e. incubation cores, were used asreplicates in these analyses. In addition, temporalvariation of denitrification was tested for each lakeseparately using either t-tests or 1-way ANOVA,and interlake variations were tested using 1-wayANOVA. As a post-hoc test in ANOVA, we used theLSD technique (least significant difference) withHochberg-Bonferroni corrections (Hochberg 1988).The averages of subsamples taken from each sam-pling core were used as replicates in these analyses(i.e. n = 3 to 7 for each site/season combination). Fornormality and homoscedasticity of variances, thedenitrification and D15 values were log10-trans-formed in the above-mentioned analyses.
Relationships between the environmental factorsand denitrification parameters (denitrification, Dw,
5

Aquat Microb Ecol 69: 1–16, 2013
Dn, Dw% and Dn%) were studied using the data ofthe present study supplemented with the profundaland littoral data from Ormajärvi (Rissanen et al.2011). Site/season-specific average values of sam-pling cores were used in these analyses. Relation-ships between nitrate concentration and denitrifica-tion parameters were studied using Spearmancorrelation analysis and simple regression analyses.The correlations among other environmental factorsand denitrification parameters were also studiedusing Spearman correlation. Multiple regressionanalyses were run for predictive relationships ondenitrification, Dw and Dn. Three separate modelswere fitted; selected variables (temperature, O2 con-centration and LOI) were fitted in pairs with nitrate(i.e. NO3
− and T; NO3− and O2; NO3
− and LOI). Whennecessary, the variables were ln-transformed for thelinearity, normality and homoscedasticity of the vari-ances. Multicollinearity was evaluated using toler-ance values (always > 0.5). All statistical analyseswere conducted using PASW 18.0 (PASW Statistics18, Release Version 18.0.0, SPSS, 2009).
Multivariate analyses of the nirK-DGGE data werebased on Bray-Curtis dissimilarities calculated amongsamples using square-root transformed data of rela-tive abundances of OTUs. The interlake and seasonalvariations in the structure of the profundal nirK-carry-ing communities were analysed using permutationalmultivariate analysis of variance (PERMANOVA)(9999 permutations) (Anderson 2001, McArdle & An-derson 2001) by applying a factorial design with sea-son and lake as fixed factors (3 sites per lake, n = 3).Ormajärvi was excluded from these tests becauseonly 1 profundal site had been analysed. The nirK-community data were further assessed graphically us-ing non-metric multidimensional scaling (NMS). TheNMS was constrained to 2 ordination axes. To mini-mize the Kruskal’s stress and to avoid local minimumsolutions, NMS was performed with 100 runs with thereal data, a random starting configuration in each runand an instability criterion of 0.0001. Monte Carlotests of the real data versus randomized data (200 runswith randomized data) were used to assess the signifi-cance of the solution. A final solution with minimumstress (16.2%) was achieved with 43 iterations. Therelationship between environmental factors and nirK-community structure and the effect of communitystructure on the denitrification parameters was stud-ied using Mantel’s test. Variables correlating signifi-cantly with the nirK community in Mantel’s test wereadditionally correlated (Pearson) separately with bothof the NMS axes, and the R2 values of these correla-tions were displayed as vectors radiating from the
centre of the plot (McCune & Grace 2002). NMS andMantel’s test were performed using PC-ORD version4.01 (B. McCune and M. J. Mefford, PC-ORD for Windows: multivariate analysis of ecological data,4.01 edn, MjM Software, 1999), and PERMANOVAwas conducted using the program freely availablefrom the following website: www. stat. auckland. ac. nz/~mja/ Programs. htm.
Regional (boreal zone) and continental (boreal andtemperate zones) scale analyses
Data on denitrification rates, nitrate and oxygenconcentrations and temperature in the water overly-ing the sediment, as well as the average area-specificN load rates, were obtained for 10 previously studiedsmall to medium-sized lakes, located in the borealand temperate zone in Europe (Ahlgren et al. 1994,Mengis et al. 1997, Risgaard-Petersen et al. 1999,Friedrich et al. 2003, Nizzoli et al. 2010, Holmroos etal. 2012) (Fig. 1, see Table S1 in the supplement atwww. int-res. com/ articles/ suppl/ a069 p001_ supp. pdf).In these studies, denitrification was always measuredwith IPT in laboratory incubations of undisturbedsediment cores. Information on nitrate and oxygenconcentrations and temperature in Ahlgren et al.(1994), Friedrich et al. (2003) and Nizzoli et al. (2010)were kindly provided by I. Ahlgren, J. Friedrich andD. Nizzoli, respectively. The obtained data werecombined with the data from our own studies. Lake-specific average values of each parameter were usedin subsequent analyses because of large interlakedifferences in the number of observations. The corre-lation and simple regression analyses were con-ducted as explained in the section ‘Statistical analy-ses’. In addition, 3 multiple regression models wererun for the continental data set to get a predictiverelationship for denitrification as explained in thesection ‘Statistical analyses’. Three models wheretemperature, O2 concentration and latitude were fit-ted in pairs with nitrate concentration were created.Multiple regression analysis was not attempted withthe regional data set nor with Dw and Dn of the con-tinental data set due to low number of observations.
RESULTS
Environmental factors in the study lakes
In Lehee and Suolijärvi, sediments had very similarLOI and porosity, which were generally higher than in
6
Rissanen et al.: Denitrification in lakes
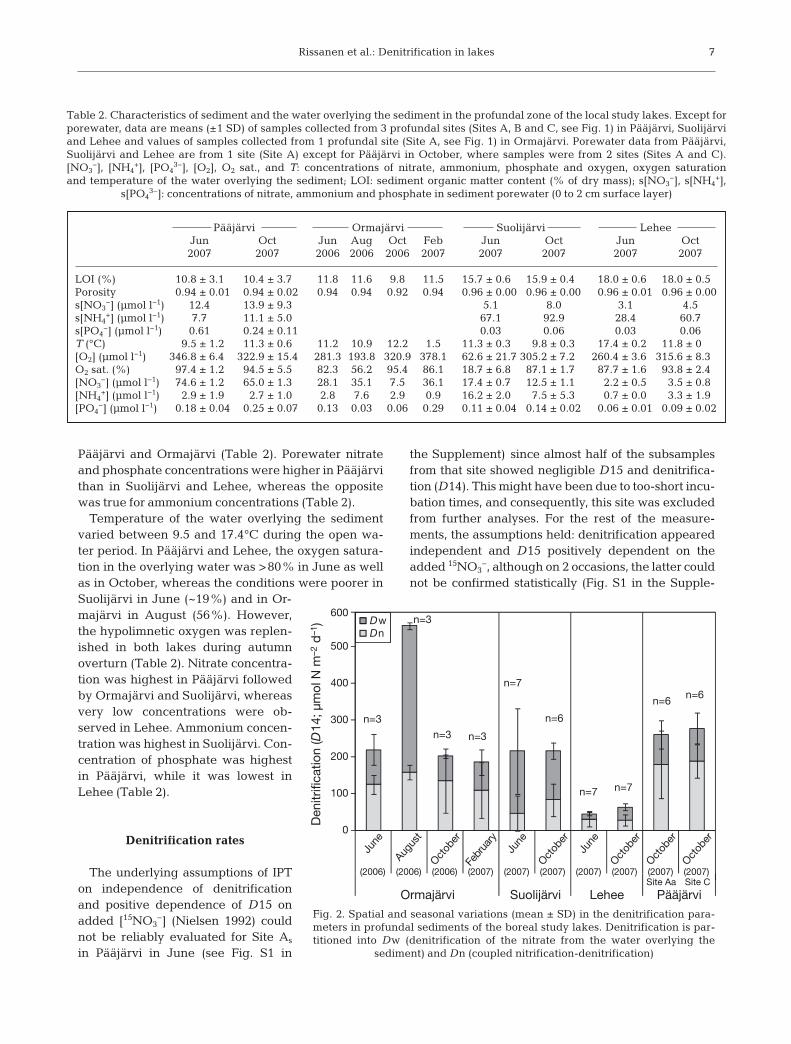
Pääjärvi and Ormajärvi (Table 2). Porewater nitrateand phosphate concentrations were higher in Pääjärvithan in Suolijärvi and Lehee, whereas the oppositewas true for ammonium concentrations (Table 2).
Temperature of the water overlying the sedimentvaried between 9.5 and 17.4°C during the open wa-ter period. In Pääjärvi and Lehee, the oxygen satura-tion in the overlying water was >80% in June as wellas in October, whereas the conditions were poorer inSuolijärvi in June (~19%) and in Or-majärvi in August (56%). However,the hypolimnetic oxygen was replen-ished in both lakes during autumnoverturn (Table 2). Nitrate concentra-tion was highest in Pääjärvi followedby Ormajärvi and Suolijärvi, whereasvery low concentrations were ob-served in Lehee. Ammonium concen-tration was highest in Suolijärvi. Con-centration of phosphate was highestin Pääjärvi, while it was lowest inLehee (Table 2).
Denitrification rates
The underlying assumptions of IPTon independence of denitrificationand positive dependence of D15 onadded [15NO3
−] (Nielsen 1992) couldnot be reliably evaluated for Site As
in Pääjärvi in June (see Fig. S1 in
the Supplement) since almost half of the subsamplesfrom that site showed negligible D15 and denitrifica-tion (D14). This might have been due to too-short incu-bation times, and consequently, this site was excludedfrom further analyses. For the rest of the measure-ments, the assumptions held: denitrification appearedindependent and D15 positively dependent on theadded 15NO3
−, although on 2 occasions, the latter couldnot be confirmed statistically (Fig. S1 in the Supple-
7
Pääjärvi Ormajärvi Suolijärvi LeheeJun Oct Jun Aug Oct Feb Jun Oct Jun Oct2007 2007 2006 2006 2006 2007 2007 2007 2007 2007
LOI (%) 10.8 ± 3.1 10.4 ± 3.7 11.8 11.6 9.8 11.5 15.7 ± 0.6 15.9 ± 0.4 18.0 ± 0.6 18.0 ± 0.5Porosity 0.94 ± 0.01 0.94 ± 0.02 0.94 0.94 0.92 0.94 0.96 ± 0.00 0.96 ± 0.00 0.96 ± 0.01 0.96 ± 0.00s[NO3
−] (µmol l−1) 12.4 13.9 ± 9.3 5.1 8.0 3.1 4.5s[NH4
+] (µmol l−1) 7.7 11.1 ± 5.0 67.1 92.9 28.4 60.7s[PO4
−] (µmol l−1) 0.61 0.24 ± 0.11 0.03 0.06 0.03 0.06T (°C) 9.5 ± 1.2 11.3 ± 0.6 11.2 10.9 12.2 1.5 11.3 ± 0.3 9.8 ± 0.3 17.4 ± 0.2 11.8 ± 0[O2] (µmol l−1) 346.8 ± 6.4 322.9 ± 15.4 281.3 193.8 320.9 378.1 62.6 ± 21.7 305.2 ± 7.2 260.4 ± 3.6 315.6 ± 8.3O2 sat. (%) 97.4 ± 1.2 94.5 ± 5.5 82.3 56.2 95.4 86.1 18.7 ± 6.8 87.1 ± 1.7 87.7 ± 1.6 93.8 ± 2.4[NO3
−] (µmol l−1) 74.6 ± 1.2 65.0 ± 1.3 28.1 35.1 7.5 36.1 17.4 ± 0.7 12.5 ± 1.1 2.2 ± 0.5 3.5 ± 0.8[NH4
+] (µmol l−1) 2.9 ± 1.9 2.7 ± 1.0 2.8 7.6 2.9 0.9 16.2 ± 2.0 7.5 ± 5.3 0.7 ± 0.0 3.3 ± 1.9[PO4
−] (µmol l−1) 0.18 ± 0.04 0.25 ± 0.07 0.13 0.03 0.06 0.29 0.11 ± 0.04 0.14 ± 0.02 0.06 ± 0.01 0.09 ± 0.02
Table 2. Characteristics of sediment and the water overlying the sediment in the profundal zone of the local study lakes. Except forporewater, data are means (±1 SD) of samples collected from 3 profundal sites (Sites A, B and C, see Fig. 1) in Pääjärvi, Suolijärviand Lehee and values of samples collected from 1 profundal site (Site A, see Fig. 1) in Ormajärvi. Porewater data from Pääjärvi,Suolijärvi and Lehee are from 1 site (Site A) except for Pääjärvi in October, where samples were from 2 sites (Sites A and C).[NO3
−], [NH4+], [PO4
3−], [O2], O2 sat., and T: concentrations of nitrate, ammonium, phosphate and oxygen, oxygen saturationand temperature of the water overlying the sediment; LOI: sediment organic matter content (% of dry mass); s[NO3
−], s[NH4+],
s[PO43−]: concentrations of nitrate, ammonium and phosphate in sediment porewater (0 to 2 cm surface layer)
0
100
200
300
400
500
600
June
(2006)
Augus
t
(2006)
Octob
er
(2006)
Febr
uary
(2007)
June
(2007)
Octob
er
(2007)
June
(2007)
Octob
er
(2007)
Octob
er
(2007) Site Aa
Octob
er
(2007) Site C
Ormajärvi Suolijärvi Lehee Pääjärvi
DwDn
Den
itrifi
catio
n (D
14; µ
mol
N m
–2 d
–1)
n=3n=3
n=3
n=3
n=7
n=7
n=6
n=7
n=6n=6
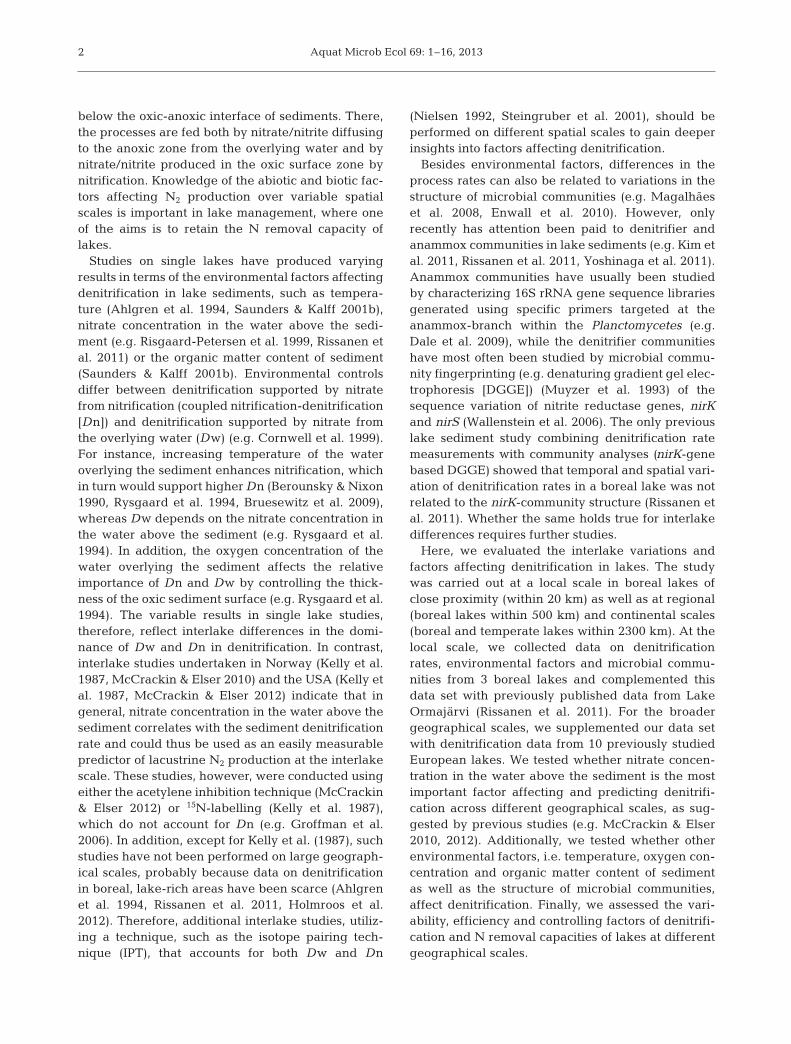
Fig. 2. Spatial and seasonal variations (mean ± SD) in the denitrification para -meters in profundal sediments of the boreal study lakes. Denitrification is par -titioned into Dw (denitrification of the nitrate from the water overlying the
sediment) and Dn (coupled nitrification-denitrification)

Aquat Microb Ecol 69: 1–16, 2013
ment). Independence of denitrification on added[15NO3
−] also indicates that there was no anammox activity in the studied sediments.
Mean rates of denitrification, Dw and Dn variedfrom 45 to 561, from 14 to 404 and from 27 to 188µmol N m−2 d−1, respectively (Fig. 2). There wereinterlake differences in denitrification in June and inOctober (June: F = 10.2, p < 0.01; October: F = 23.5,p < 0.001), with denitrification being lowest in Lehee(LSD: p < 0.01). Denitrification was the same inOrmajärvi, Suolijärvi and Pääjärvi, and no differ-ences were found between Sites Aa and C in Pääjärvi(LSD: p > 0.05). Denitrification did not vary betweenJune and October in Suolijärvi (t = −0.72, p > 0.05) norin Lehee (t = −1.81, p > 0.05). In Ormajärvi, denitrifi-cation peaked in August, but was otherwise stable(F = 10.9, p < 0.01; LSD, p < 0.05) (Fig. 2). Differences
in Dn and Dw among lakes and seasons were alsodetected. Dn dominated the denitrification in Orma-järvi and Pääjärvi except for August in Ormajärviand was also higher in these lakes than in Lehee andSuolijärvi (Fig. 2). In contrast, Dw dominated inSuolijärvi. The seasonal change from summer strati-fication to autumn overturn led to a decrease in Dwin Ormajärvi and Suolijärvi in October but also to anincrease in Dn in Suolijärvi.
Denitrification and its components, Dn and Dw,were positively correlated with nitrate concentrationin the water overlying the sediment (Table 3, Fig. 3).A nonlinear relationship between denitrification andDw and nitrate concentration suggests that denitrifi-cation efficiency decreased as nitrate concentrationincreased (Fig. 3A,B). In addition, denitrification andnitrate concentration in the water overlying the sedi-
8
Den Dn Dw Dn% Dw% LOI Porosity T [O2] O2 sat. [NO3−] [PO4
3−]
Dn 0.77 Dw 0.73 Dn% 0.59 −0.53 Dw% −0.59 0.53 −1.0 LOI Porosity 0.83 T −0.66 −0.53 [O2] −0.51 −0.49 −0.45 O2 sat. −0.58 −0.54 0.70 [NO3
−] 0.77 0.70 0.54 −0.47 −0.67 0.50 [PO4
3−] −0.59 0.54 0.77 [NH4
+] 0.58 −0.64 0.64 0.42 −0.40 −0.51 s[NO3
−] 0.83 −0.82 0.86 0.78s[PO4
3−] 0.85 −0.80 0.78 0.80 s[NH4
+] −0.89 0.89 −0.86
Table 3. Significant correlations (Spearman’s rho) (p < 0.05) between denitrification parameters and environmental factors inthe 4 boreal study lakes at the local scale. Den: denitrification; Dn: coupled nitrification-denitrification; Dw: denitrification ofnitrate from the water overlying the sediment; Dn%: share of Dn in Den; Dw%: share of Dw in Den. See Table 2 for other def-initions. n = 18 in correlations between denitrification parameters and environmental factors except for porewater concentra-tions, where n = 6. n = 31 in correlations among environmental factors except for porewater concentrations, where n = 7
0
100
200
300
400
500
600
0 20 40 60 80 0 20 40 60 80 0 20 40 60 80
Den
itrifi
catio
n(D
14; µ
mol
N m
–2 d
–1)
Den = 69.6× [NO3–]0.367
R2 = 0.56, p < 0.001
Dw = 30.9× [NO3–]0.363
R2 = 0.36, p < 0.01
Dn = 2.1× [NO3–]+59.7
R2 = 0.48, p < 0.01
0
100
200
300
400
500
600
[NO3–] (µmol l–1)
Dw
(µm
ol N
m–2
d–1
)
0
100
200
300
400
500
600
Dn
(µm
ol N
m–2
d–1
)PääjärviOrmajärviSuolijärviLehee
A B C
Fig. 3. Relationship between (A) denitrification, (B) Dw and (C) Dn and concentration of nitrate in the water overlying the sediment in the boreal lakes at the local study scale
Rissanen et al.: Denitrification in lakes
ment were correlated with the concentration ofnitrate and phosphate in the sediment porewater. Dwand Dw% correlated positively with ammonium con-centrations in the water overlying the sediment, andDw% correlated also with porewater ammoniumconcentration (Table 3). Temperature and nitrateconcentration were negatively correlated, and there-fore, the negative dependency of denitrification andDw on temperature can be explained by co-variation.Oxygen and nitrate concentrations were negativelycorrelated with the organic matter content of the sed-iment, and nitrate concentration was positively corre-lated with the oxygen concentration (Table 3).
The multiple regression models with oxygen con-centration, temperature and LOI fitted together withnitrate concentration revealed that except for nitrateconcentration in the water above thesediment, none of the variables affecteddenitri fication or Dn. However, oxygenconcentration combined with nitrateconcentration explained 54% of thevaria tion in Dw, and thus, Dw in-creased when nitrate concentration in-creased and oxygen concentration inthe water above the sediment de-creased (Table 4).
Molecular analyses
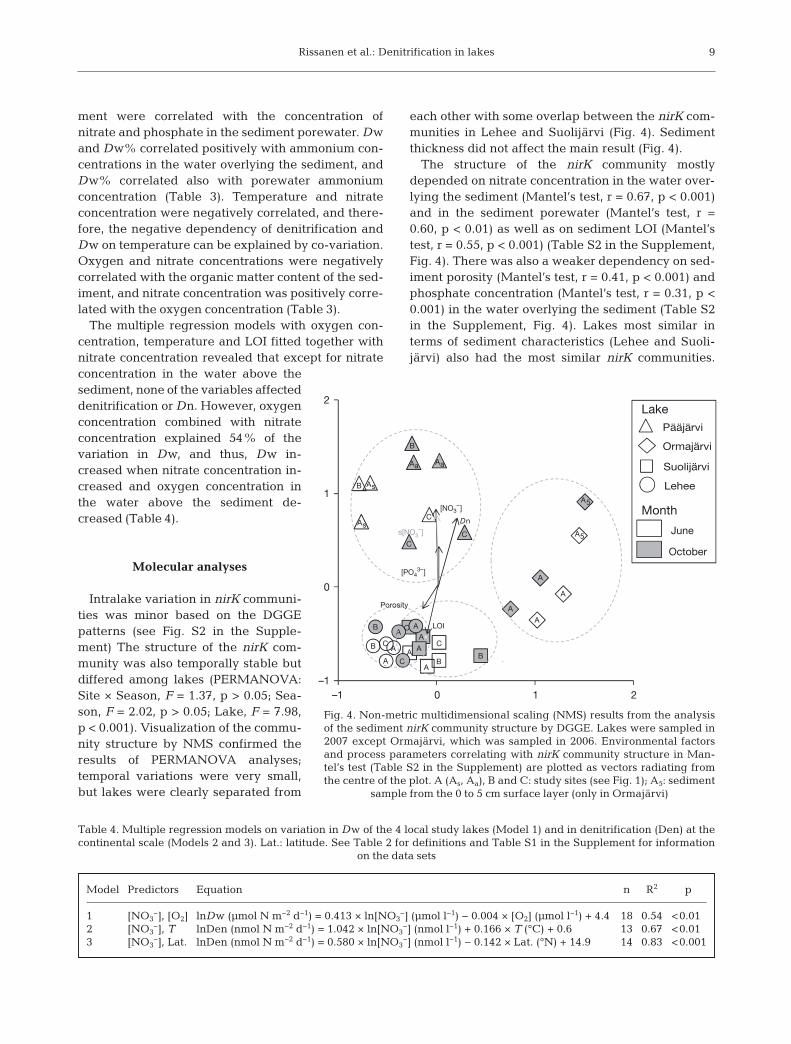
Intralake variation in nirK communi-ties was minor based on the DGGEpatterns (see Fig. S2 in the Supple-ment) The structure of the nirK com-munity was also temporally stable butdiffered among lakes (PERMANOVA:Site × Season, F = 1.37, p > 0.05; Sea-son, F = 2.02, p > 0.05; Lake, F = 7.98,p < 0.001). Visualization of the commu-nity structure by NMS confirmed theresults of PERMANOVA analyses;temporal variations were very small,but lakes were clearly separated from
each other with some overlap between the nirK com-munities in Lehee and Suolijärvi (Fig. 4). Sedimentthickness did not affect the main result (Fig. 4).
The structure of the nirK community mostlydepended on nitrate concentration in the water over-lying the sediment (Mantel’s test, r = 0.67, p < 0.001)and in the sediment porewater (Mantel’s test, r =0.60, p < 0.01) as well as on sediment LOI (Mantel’stest, r = 0.55, p < 0.001) (Table S2 in the Supplement,Fig. 4). There was also a weaker dependency on sed-iment porosity (Mantel’s test, r = 0.41, p < 0.001) andphosphate concentration (Mantel’s test, r = 0.31, p <0.001) in the water overlying the sediment (Table S2in the Supplement, Fig. 4). Lakes most similar interms of sediment characteristics (Lehee and Suoli-järvi) also had the most similar nirK communities.
9
Model Predictors Equation n R2 p
1 [NO3−], [O2] lnDw (µmol N m−2 d−1) = 0.413 × ln[NO3
−] (µmol l−1) − 0.004 × [O2] (µmol l−1) + 4.4 18 0.54 <0.012 [NO3
−], T lnDen (nmol N m−2 d−1) = 1.042 × ln[NO3−] (nmol l−1) + 0.166 × T (°C) + 0.6 13 0.67 <0.01
3 [NO3−], Lat. lnDen (nmol N m−2 d−1) = 0.580 × ln[NO3
−] (nmol l−1) − 0.142 × Lat. (°N) + 14.9 14 0.83 <0.001
Table 4. Multiple regression models on variation in Dw of the 4 local study lakes (Model 1) and in denitrification (Den) at thecon tinental scale (Models 2 and 3). Lat.: latitude. See Table 2 for definitions and Table S1 in the Supplement for information
on the data sets
As
AsC
B
Aa Aa
CC
B
A
AB
CA
AB
C
A
A
B C
AA
B
C
A
A
A
A
A5
A5
–1
0
1
2
–1 0 1 2
LakePääjärvi
Ormajärvi
Suolijärvi
Lehee
Month
June
October
LOI
Porosity
[NO3–]
s[NO3–]
[PO43–]
Dn
Fig. 4. Non-metric multidimensional scaling (NMS) results from the analysisof the sediment nirK community structure by DGGE. Lakes were sampled in2007 except Ormajärvi, which was sampled in 2006. Environmental factorsand process parameters correlating with nirK community structure in Man-tel’s test (Table S2 in the Supplement) are plotted as vectors radiating fromthe centre of the plot. A (As, Aa), B and C: study sites (see Fig. 1); A5: sediment
sample from the 0 to 5 cm surface layer (only in Ormajärvi)

Aquat Microb Ecol 69: 1–16, 2013
The decrease of LOI and porosity and the increase innitrate and phosphorus concentrations correspondedto the change in nirK communities from Lehee andSuolijärvi to Ormajärvi and Pääjärvi (Fig. 4). Therewas a correlation between community structure andDn (Mantel’s test, Dn: r = 0.63, p < 0.001; Fig. 4) butno correlation between community structure andother denitrification parameters (Mantel’s test, deni-trification: r = 0.17, p > 0.05; Dw: r = −0.21, p > 0.05;Dw%: r = −0.07, p > 0.05; Dn%: r = −0.07, p > 0.05).
Using the highly anammox−specific protocol, posi-tive PCR products could only be amplified from sam-ples of Ormajärvi and Pääjärvi. This suggests thatorganisms capable of anammox were present in sed-iments of Ormajärvi and Pääjärvi but not in Suolijärviand Lehee. Results of cloning and sequencing veri-fied the high specificity of the PCR protocol: the rep-resentative sequences of OTUs showed 89 to 96%identities to 4 anammox genera, Brocadia, Jettenia,Kuenenia and Anammoxoglobus (see Table S3 in theSupplement).
Comparison of denitrification between regional(boreal zone) and continental (temperate and
boreal zone) scales
At the regional (boreal) scale, denitrification andDn were positively correlated with nitrate concentra-tion of the water overlying the sediment (Denitrifica-tion, ρ = 0.93, p < 0.01; Dn, ρ = 0.96, p < 0.001)(Fig. 5A,C, Fig. S3 in the Supplement). Other signifi-cant correlations at the regional scale were notdetected. In general, denitrification rates, nitrate
concentrations and N loads were much lower inboreal lakes (>59° N latitude) than in temperatelakes (Table S1 in the Supplement). Indeed, at thecontinental scale, denitrification correlated nega-tively with latitude (Table 5). Denitrification and Dwcorrelated positively with NO3
− concentration of thewater overlying the sediment, and NO3
− concentra-tion correlated positively with N load (Table 5,Fig. 5A,B, Fig. S3 in the Supplement). In addition,Dw and Dw% correlated negatively with oxygenconcentration in the water above the sediment, andDw% correlated negatively with temperature(Table 5). The nonlinear relationship between deni-trification and nitrate concentration suggests thatdenitrification efficiency decreased as nitrate con-centration increased at regional as well as continen-tal scales (Fig. 5A). There were also differences inregression curves (Fig. 5A, Fig. S3 in the Supple-ment). At a given nitrate concentration, denitrifica-
10
Den Dw Dn% Dw% N load
Dw 0.90Dn% −0.64 −0.86Dw% 0.64 0.86 −1.00[NO3
−] 0.75 0.84 1.00T 0.66 −0.66[O2] −0.67 0.77 −0.77Latitude −0.65
Table 5. Significant correlations (Spearman’s rho) (p < 0.05)between denitrification parameters and environmental fac-tors at the continental scale. N load: average, area-specificN load. See Tables 2 & 3 for other definitions and Table S1 in
the Supplement for information on the data set
0
500
1000
1500
2000
2500
3000
3500
4000
0 50 100 150 200
10500
11000
11500
Den (boreal) = 25.0×[NO3–]0.632
R2 = 0.74, p < 0.05
Dw (boreal) = 13.2×[NO3–]0.579
R2 = 0.51, p = 0.07Dn (boreal) = 2.7×[NO3
–]+27.4R2 = 0.87, p < 0.01
Den (continental) = 55.7×[NO3–]0.694
R2 = 0.45, p < 0.01
Dw (continental) = 21.8×[NO3–]–294.8
R2 = 0.84, p < 0.001
Dn (continental) = 2.2×[NO3–]+55.3
R2 = 0.37, p = 0.06
Den (temperate) = 353.0×[NO3–]0.446
R2 = 0.47, p = 0.09
BorealTemperate
Den
itrifi
catio
n (D
14; µ
mol
N m
–2 d
–1)
A
0
500
1000
1500
2000
2500
3000
3500
4000
0 50 100 150 200
[NO3–] (µmol l–1)
B
0
100
200
300
400
500
600
700
0 50 100 150 200
Dn
(µm
ol N
m–2
d–1
)
Dw
(µm
ol N
m–2
d–1
)
C
Fig. 5. Relationship between (A) denitrification, (B) Dw and (C) Dn and concentration of nitrate in the water overlying the sediment in thecombined data set of the 4 boreal study lakes and 10 other European lakes (see Fig. 1 and Table S1 in the Supplement for information on thedata set). Regression lines were fitted to the whole continental data set (black, solid lines) and separately to boreal (grey lines) and (A)
temperate (black, dashed line) data sets

Rissanen et al.: Denitrification in lakes
tion rates estimated by the models were higher in thecontinental than in the regional scale. In addition, aregression model fitted for temperate data, althoughnot statistically significant (p = 0.09), estimated high-est denitrification rates. Thus, the areal variations indenitrification cannot be explained only by variablenitrate concentrations. The multiple regressionanalysis of the continental data set showing a posi-tive effect of decreasing latitude on denitrificationconfirmed the finding (Table 4). The results suggestthat nitrate removal by denitrification was less effi-cient in boreal than in temperate lakes. Anotherregression model also suggested that at the continen-tal scale, temperature together with nitrate has a positive effect on denitrification (Table 4).
DISCUSSION
Our studies, together with previous studies, showthat denitrification rates in lake sediments vary con-siderably seasonally (e.g. Ahlgren et al. 1994, Rissa-nen et al. 2011) as well as spatially, i.e. there areintralake (e.g. Saunders & Kalff 2001b, Rissanen etal. 2011) and interlake variations (e.g. McCrackin &Elser 2010). In conjunction with Kelly et al. (1987)and McCrackin & Elser (2010, 2012), our study indi-cates that nitrate concentration in the water abovethe sediment is the most important factor predictingdenitrification at variable geographical scales. This isin accordance with studies on wetlands (Kjellin et al.2007), streams (Mulholland et al. 2008) and estuaries(Nielsen et al. 1995, Kana et al. 1998) as well as witha meta-analysis on various aquatic systems (oceans,coastal ecosystems, estuaries, lakes and rivers) (Piña-Ochoa & Álvarez-Cobelas 2006). Nitrate concentra-tions are partially explained by N loads (e.g.McCrackin & Elser 2010), and thus, the results indi-cate that lake sediments have capacity to respond toincreases in N loading (e.g. Seitzinger et al. 2006,McCrackin & Elser 2010). However, the non-linearregressions suggest that denitrification efficiency(the proportion of the nitrate removed by the process)decreases as the nitrate concentration (and N load)increases, as has been previously shown in streams(Mulholland et al. 2008).
Increasing nitrate concentration in the water abovethe sediment affected denitrification through in -crease in Dw, as also shown before (e.g. Nielsen et al.1995). In addition, decreasing oxygen concentrationin the water further stimulated Dw at the local aswell as continental scale by reducing the diffusionaldistance of nitrate from the water column to the de -
nitrification zone (e.g. Rysgaard et al. 1994). Theeffect of oxygen concentration was especially clear inthe seasonal variation at the local scale, when Dw inOrmajärvi and Suolijärvi decreased from summer toautumn coinciding with the autumn turnover andresulting replenishment of oxygen conditions. How-ever, Dn also correlated positively with nitrate con-centration. This suggests that the relationshipbetween nitrate concentration and denitrification isnot a simple causality because Dn, unlike Dw, shouldnot depend on nitrate concentration in the wateroverlying the sediment. Correlation analyses at thelocal scale indicated that nitrate concentrationsincreased when oxygen concentration was high andsediment organic matter content low. In these condi-tions, nitrification was probably increased via exten-sion of the oxic nitrification zone (Rysgaard et al.1994) and by less severe microbial competition forinorganic nitrogen (Strauss & Lamberti 2000). Thisled to increased Dn but also to increased flux ofnitrate from sediment to the water above the sedi-ment, resulting in the positive correlation betweenDn and nitrate concentration. This was seen in inter-lake differences, where, in comparison to Suolijärviand Lehee, Pääjärvi and Ormajärvi had higher Dnand concentrations of nitrate in the water column(and sediment porewater) and lower concentrationsof organic matter in the sediment. Denitrification andnitrate concentrations were especially low in thepolymictic, shallow Lehee, where the euphotic zonecovers the whole water column and competition fornutrients is presumably severe. Similarly, competi-tion between algae and nitrifiers/denitrifiers for inor-ganic N was suggested to limit denitrification in thelittoral zone of Ormajärvi (Rissanen et al. 2011).Thus, besides N load, interlake variation in nitrateconcentration in the water overlying the sediment iscaused by differences in processes producing/con-suming nitrate. The concentration of nitrate reflectsthus the overall availability of nitrate to denitrifiers.
According to studies on 5 Finnish lakes (Rissanenet al. 2011, Holmroos et al. 2012, present study) andthose on 2 lakes in central Sweden (Ahlgren et al.1994), the denitrification rates (~0 to ~600 µmol N m−2
d−1) of boreal lakes are among the lowest reported-from lacustrine sediments (global range 0 to15 000 µmol N m−2 d−1) (Rissanen et al. 2011 and ref-erences therein). Positive correlation between nitrateconcentration and N load suggests that the higherdenitrification rates of temperate lakes stem at leastpartly from higher anthropogenic N loads (Seitzingeret al. 2002). The less efficient removal of nitrate bydenitrification at the boreal zone, however, suggests
11
Aquat Microb Ecol 69: 1–16, 2013
that other factors besides co-varying N loads andnitrate concentrations contribute to the areal differ-ences. The lower temperatures in the boreal than inthe temperate zone might underlie this pattern, asindicated by multiple regression analysis at the con-tinental scale. In addition, areal variations in theamount and/or quality of electron donors (organicmatter), which were not assessed in the presentstudy, might contribute to the observed differences(e.g. Hietanen & Kuparinen 2008); more eutrophictemperate lakes with higher primary production pro-vide more labile organic matter to denitrifiers thanmore oligotrophic boreal lakes. There can also beareal differences in other nitrate-consuming pro-cesses, such as dissimi latory nitrate reduction toammonium (DNRA). In 2 Italian lakes (Lake Ca’S-tanga and Lake Verde, DNRA: 70 to 120 µmol m−2
d−1, 3 to 9% of the denitrification rate) (Nizzoli et al.2010) and 1 Swiss lake (Lake Baldegg, DNRA: 160 to180 µmol m−2 d−1, 4 to 5% of the denitrification rate)(Mengis et al. 1997), DNRA is, however, of minorimportance, but unfortunately there are no studies onboreal lakes. Finally, areal variations in the structureand abundance of denitrifier communities can alsounderlie the differences. Further studies are requiredto elucidate the role of these factors.
Studies on denitrifier community composition inrelation to denitrification indicate that the activitycan be affected by community composition (e.g.Magalhães et al. 2008, Enwall et al. 2010). However,our results on uncoupling of the nirK-communitystructure and denitrification activity both within (Ris-sanen et al. 2011) and among lakes suggest that de -nitrification is controlled by environmental factorsrather than by the structure of the nirK community. Inaddition, the nirK community was seasonally verystable, despite clear seasonality in environmentalfactors, which contrasts with previous studies of nirKcommunities in aquatic sediments (Fortunato et al.2009) and agricultural land (Wolsing & Priemé 2004,Wertz et al. 2009) and with the nosZ communities insediments (Scala & Kerkhof 2000, Magalhães et al.2008). However, the result is consistent with thestudy of Desnues et al. (2007) in a hypersaline micro-bial mat. Different denitrifier communities may thusrespond differently to changes in environmental con-ditions. Lehee and Suolijärvi, with low Dn, low con-centrations of nitrate in the water overlying the sedi-ment and in the sediment porewater and highcontents of organic matter in the sediment, had verysimilar nirK communities, whereas the communitieswere different in Pääjärvi and Ormajärvi. Ourresults, thus, suggest that the structure of the nirK
community is regulated by the availability of nitrateand sediment characteristics, which is consistentwith earlier studies (Angeloni et al. 2006, Wallensteinet al. 2006, Kjellin et al. 2007, Magalhães et al. 2008,Wu et al. 2008). Thus, although availability of nitratemay immediately affect denitrification, it also actsmore slowly through changes in community compo-sition of denitrifiers (Wallenstein et al. 2006). Thetotal abundance of nirK denitrifiers may also varyspatially and temporally (Dandie et al. 2008), and ithas been reported to correlate with denitrificationactivity in stream sediments (O’Connor et al. 2006).The nirS community was not addressed in the pres-ent study, due to technical problems in the nirS-DGGE, but it is possible that the response to environ-mental factors varies between nirK and nirScommunities (Desnues et al. 2007, Junier et al. 2008,Enwall et al. 2010, Kim et al. 2011). A more completepicture of the denitrifier community could beacquired by concurrent analyses of nirS-containingcommunities and the total abundance of denitrifica-tion genes by qPCR.
Although we found genetic potential for anammoxin sediments of 2 out of the 4 study lakes, denitrifica-tion was the primary microbial process producing N2
gas in the IPT incubation. However, anammox activ-ity can be strictly seasonal (Hietanen 2007, Jäntti etal. 2011), possibly due to temporary release of com-petition between denitrifiers and anammox organ-isms for nitrate/nitrite (Jäntti et al. 2011). Since the15NO3
− concentration series experiments in lakeswith genetic potential for anammox were conductedonly in autumn, it is possible that we missed the timeof active anammox. It is also possible that there wasanammox but the activities were below the detectionlimit of the r-IPT assay. The development of anam-mox communities requires stable environmental con-ditions due to slow growth of these bacteria (e.g. Huet al. 2011), and it is thus likely that the conditions inlakes undergoing seasonal variations in physico-chemical conditions are not stable enough. Lacus-trine anammox activities in situ have only beendetected in very stable conditions, i.e. in anoxicwater columns of meromictic lakes (Schubert et al.2006, Hamersley et al. 2009). In the future, the in situanammox activity of lake sediments should beassessed with more sensitive techniques than 15NO3
−
concentration series through seasonal sampling inlakes with genetic potential for the process (Tham-drup & Dalsgaard 2002, Trimmer et al. 2006).
The annual N removal by denitrification in Suoli-järvi, Lehee and Pääjärvi was crudely estimated bymultiplying the mean daily denitrification rate by the
12

lake area and 365 d. In Ormajärvi, we also took intoaccount the spatial and temporal integration (Rissa-nen et al. 2011). The estimated annual removal of Nwas 17900, 7400, 2400 and 300 kg for Pääjärvi, Or-majärvi, Suolijärvi and Lehee, respectively. Dividingthis by the annual N load for 2 years of contrastinghydrological conditions representing low (year 2003)and high (year 2004) N inputs to lakes (L. Arvola etal. unpubl., S. Mäkelä et al. unpubl.), gives estimatesof the upper and lower limits for the annual removalof N by denitrification (Fig. 6A). This varied between0.4 and 26.6% depending on the average hydraulicresidence time (cf. Seitzinger et al. 2006) (Fig. 6A).With a longer residence time, there are more oppor-tunities for sediment-water contact (Saunders & Kalff2001a). Indeed, Dn, which represents nitrification-denitrification of ammonium released from organicmatter during decomposition, was much higher inPääjärvi and Ormajärvi, both with long residencetimes, than in Lehee and Suolijärvi. The interlake dif-ferences might also be explained by differences inthe quality of N loads, i.e. the proportion of easily re-cyclable inorganic N to organic N in the N loadsmight be higher in Pääjärvi and Ormajärvi, whichhave lower forest coverage and higher agriculturalland use in the catchment areas.
The proportion of the N load denitrified in ourstudy lakes, however, is considerably lower thanreported by Seitzinger et al. (2006) (Fig. 6A). Our
estimates are in agreement with those from 2 boreallakes in Sweden (Ahlgren et al. 1994), but the esti-mates from 2 temperate lakes in Denmark (Risgaard-Petersen et al. 1999) and Switzerland (Mengis et al.1997) are higher (Fig. 6A). These results indicate thatboreal lakes are less efficient in removing their Nloads as N2 gas than temperate lakes. Total N reten-tion (denitrification + N sedimentation) of boreal andtemperate lakes was also compared with the findingthat in both areas N retention depends positively onhydraulic residence time (Fig. 6B, Table S4 in theSupplement). However, boreal lakes were generallyless efficient in total N retention. These results mightbe due to the above-mentioned reasons underlyingthe areal differences in the efficiency of denitrifica-tion but might also stem from differences in the qual-ity of N load, since in temperate zones, agriculture ismore intensive with higher use of inorganic fertiliz-ers (Seitzinger et al. 2002).
IPT and other measurement methods based on lab-oratory assays usually give lower estimates of denitri-fication compared to annual whole-lake estimatesusing indirect mass balance methods (e.g. Ahlgren etal. 1994). This has been attributed to inadequate spa-tial and temporal coverage (e.g. Mengis et al. 1997)or to unsuccessful simulation of in situ conditions(Risgaard-Petersen et al. 1999). On the other hand,mass balance methods may also yield inaccurate esti-mates due to difficulties in measuring or estimating
Rissanen et al.: Denitrification in lakes 13
0
10
20
30
40
50
60
70
80
90
0 1 2 3 4
N r
eten
tion
(% o
f an
nu
al N
load
)
Boreal lakes
Temperate lakes
0
10
20
30
40
50
60
70
80
90
0 1 2 3 4 5 6
Hydraulic residence time (yr)
Den
itrifi
catio
n (%
of a
nn
ual
N lo
ad) Boreal study lakes (Finland) (low N input)
Boreal study lakes (Finland) (high N input)
Boreal Lake Norrviken andLake Vallentuna (Sweden)
Temperate Lake Sobygaard (Denmark)and Lake Baldegg (Switzerland) Den = 38.8×0.204
(Seitzinger et al. 2006)
Den (boreal study lakes, low N input) = 7.0× + 3.5R2 = 0.94, p < 0.05
Den (boreal study lakes, high N input) = 3.6× + 0.9R2 = 0.96, p < 0.05
A B
N-ret (boreal) = 13.4× ln(residence time) + 37.8R2 = 0.32, p < 0.05
N-ret (temperate) = 5.6× ln(residence time) + 48.3R2 = 0.15, p < 0.05
Fig. 6. (A) Proportion (%) of the annual N load removed by denitrification (Den) in the boreal study lakes (Rissanen et al. 2011,present study) and in some other European lakes (Ahlgren et al. 1994, Mengis et al. 1997, Risgaard-Petersen et al. 1999) and(B) the proportion of the annual N load retained (N-ret; sedimented + denitrified) in boreal (Finland, Sweden, Estonia) andtemperate lakes (see Table S4 in the Supplement for references), plotted against the average hydraulic residence time. N loaddata of the boreal study lakes (A) were for 2 years of contrasting hydrological conditions with low (year 2003) and high (year2004) N inputs (L. Arvola et al. unpubl., S. Mäkelä et al. unpubl.). Also shown are the regression lines of the relationships for(A) the boreal study lakes (grey, solid lines) and aquatic systems in general as summarized by Seitzinger et al. (2006) (black,
dotted line), and for (B) the boreal (grey, solid line) and temperate (black, solid line) lakes

Aquat Microb Ecol 69: 1–16, 2013
all of the components of the N budget. In futuremeasurements of denitrification, more attentionshould be paid to adequate coverage of spatial andtemporal variation. Mesocosm measurements (Ris-gaard-Petersen et al. 1999) and methods based on insitu measurements of isotopic composition and con-centration of accumulating nitrogen gas (and nitrousoxide) (Deemer et al. 2011, Tiirola et al. 2011) de -serve further exploration.
CONCLUSIONS
Denitrification was the primary process producingN2 gas in lakes, but rates varied considerably amonglakes at the local, regional and continental scales,mainly as a result of varying nitrate availability.Nitrate concentration in the water above the sedi-ment was a good predictor of denitrification at thelocal and regional scales. At a given nitrate concen-tration, however, denitrification was less efficient inboreal than in temperate lakes. Future studies shouldfocus on factors explaining the slow rates of denitrifi-cation in the boreal region despite the relatively highnitrate concentrations.
Acknowledgements. We thank the staff of Lammi BiologicalStation, University of Helsinki, where most of the analysesas well as denitrification incubations were performed. Wethank D. Nizzoli, I. Ahlgren and J. Friedrich for providingdata on nitrate and oxygen concentrations and temperature.In addition, we thank H. Devlin, R. Jones, S. Hallin and B.Thamdrup for their helpful comments on the manuscript.The comments and suggestions of the 3 anonymous review-ers and the editor are also highly appreciated. This studywas funded by the Finnish Cultural Foundation, Maa- jaVesitekniikan Tuki ry, Maj and Tor Nessling Foundationand the Academy of Finland (Projects 120089 and 123725).
LITERATURE CITED
Ahlgren I, Sörensson F, Waara T, Vrede K (1994) Nitrogenbudgets in relation to microbial transformations in lakes.Ambio 23: 367−377
Altschul SF, Madden TL, Schäffer AA, Zhang J, Zhang Z,Miller W, Lipman DJ (1997) Gapped BLAST and PSI-BLAST: a new generation of protein database searchprograms. Nucleic Acids Res 25: 3389−3402
Amano T, Yoshinaga I, Okada K, Yamagishi T and others(2007) Detection of anammox activity and diversity ofanammox bacteria-related 16S rRNA genes in coastalmarine sediment in Japan. Microbes Environ 22: 232−242
Andersen JM (1974) Nitrogen and phosphorus budgets andthe role of sediments in six shallow Danish lakes. ArchHydrobiol 74: 528−550
Anderson MJ (2001) A new method for non-parametric multivariate analysis of variance. Austral Ecol 26: 32−46
Angeloni NL, Jankowski KJ, Tuchman NC, Kelly JJ (2006)Effects of an invasive cattail species (Typhaxglauca) onsediment nitrogen and microbial community composi-tion in a freshwater wetland. FEMS Microbiol Lett 263: 86−92
Berounsky VM, Nixon SW (1990) Temperature and theannual cycle of nitrification in waters of NarragansettBay. Limnol Oceanogr 35: 1610−1617
Bruesewitz DA, Tank JL, Hamilton SK (2009) Seasonaleffects of zebra mussels on littoral nitrogen transforma-tion rates in Gull Lake, Michigan, U.S.A. Freshw Biol 54: 1427−1443
Cornwell JC, Kemp WM, Kana TM (1999) Denitrification incoastal ecosystems: methods, environmental controls,and ecosystem level controls, a review. Aquat Ecol 33: 41−54
Dale OR, Tobias CR, Song B (2009) Biogeographical distri-bution of diverse anaerobic ammonium oxidizing (anam-mox) bacteria in Cape Fear River Estuary. EnvironMicrobiol 11: 1194−1207
Dandie CE, Burton DL, Zebarth BJ, Henderson SL, TrevorsJT, Goyer C (2008) Changes in bacterial denitrifier community abundance over time in an agricultural fieldand their relationship with denitrification activity. ApplEnviron Microbiol 74: 5997−6005
Deemer BR, Harrison JA, Whitling EW (2011) Microbialdinitrogen and nitrous oxide production in a smalleutrophic reservoir: an in situ approach to quantifyinghypolimnetic process rates. Limnol Oceanogr 56: 1189−1199
Desnues C, Michotey VD, Wieland A, Zhizang C, FourçansA, Duran R, Bonin PC (2007) Seasonal and diel distribu-tions of denitrifying and bacterial communities in ahypersaline microbial mat (Camargue, France). WaterRes 41: 3407−3419
Dillon PJ, Molot LA (1990) The role of ammonium andnitrate retention in the acidification of lakes and forestedcatchments. Biogeochemistry 11: 23−43
Ekholm P, Malve O, Kirkkala T (1997) Internal and externalloading as regulators of nutrient concentrations in theagriculturally loaded Lake Pyhäjärvi (southwest Fin-land). Hydrobiologia 345: 3−14
Enwall K, Throbäck IN, Stenberg M, Söderström M, Hallin S(2010) Soil resources influence spatial patterns of denitri-fying communities at scales compatible with land man-agement. Appl Environ Microbiol 76: 2243−2250
Fortunato CS, Carlini DB, Ewers E, Bushaw-Newton KL(2009) Nitrifier and denitrifier molecular operational tax-onomic unit compositions from sites of a freshwater estu-ary of Chesapeake Bay. Can J Microbiol 55: 333−346
Friedrich J, Dinkel C, Grieder E, Radan S, Secrieru D, Stein-gruber S, Wehrli B (2003) Nutrient uptake and benthicregeneration in Danube Delta Lakes. Biogeochemistry64: 373−398
Griffiths RI, Whiteley AS, O’Donnell AG, Bailey MJ (2000)Rapid method for coextraction of DNA and RNA fromnatural environments for analysis of ribosomal DNA- andrRNA-based microbial community composition. ApplEnviron Microbiol 66: 5488−5491
Groffman PM, Altabet MA, Böhlke JK, Butterbach-Bahl Kand others (2006) Methods for measuring denitrification: diverse approaches to a difficult problem. Ecol Appl 16: 2091−2122
Haas BJ, Gevers D, Earl AM, Felgarden M and others (2011)Chimeric 16S rRNA sequence formation and detection
14

Rissanen et al.: Denitrification in lakes
in Sanger and 454-pyrosequenced PCR amplicons.Genome Res 21: 494−504
Hamersley MR, Woebken D, Boehrer B, Schultze M, LavikG, Kuypers MM (2009) Water column anammox anddenitrification in a temperate permanently stratified lake(Lake Rassnitzer, Germany). Syst Appl Microbiol 32: 571−582
Harrison JA, Maranger RJ, Alexander RB, Giblin AE andothers (2009) The regional and global significance ofnitrogen removal in lakes and reservoirs. Biogeochem-istry 93: 143−157
Hietanen S (2007) Anaerobic ammonium oxidation (anam-mox) in sediments of the Gulf of Finland. Aquat MicrobEcol 48: 197−205
Hietanen S, Kuparinen J (2008) Seasonal and short-termvariation in denitrification and anammox at a coastal sta-tion on the Gulf of Finland, Baltic Sea. Hydrobiologia596: 67−77
Hochberg Y (1988) A sharper Bonferroni procedure for multiple tests of significance. Biometrika 75: 800−802
Holmroos H, Hietanen S, Niemistö J, Horppila J (2012) Sed-iment resuspension and denitrification affect the nitro-gen to phosphorus ratio of shallow lake waters. FundamAppl Limnol 180: 193−205
Hu BL, Shen LD, Xu CY, Zheng P (2011) Anaerobic ammo-nium oxidation in different natural ecosystems. BiochemSoc Trans 39: 1811−1816
Ishii S, Kadota K, Senoo K (2009) Application of a clustering-based peak alignment algorithm to analyze various DNAfingerprinting data. J Microbiol Methods 78: 344−350
Jäntti H, Stange F, Leskinen E, Hietanen S (2011) Seasonalvariation in nitrification and nitrate-reduction pathwaysin coastal sediments in the Gulf of Finland, Baltic Sea.Aquat Microb Ecol 63: 171−181
Jeppesen E, Jensen JP, Søndergaard M, Lauridsen T, MøllerPH, Sandby K (1998) Changes in nitrogen retention inshallow eutrophic lakes following a decline in density ofcyprinids. Arch Hydrobiol 142: 129−151
Junier P, Kim OS, Witzel KP, Imhoff JF, Hadas O (2008) Habi-tat partitioning of denitrifying bacterial communities car-rying nirS or nirK genes in the stratified water column ofLake Kinneret, Israel. Aquat Microb Ecol 51: 129−140
Kana TM, Sullivan MB, Cornwell JC, Groszkowski KM(1998) Denitrification in estuarine sediments determinedby membrane inlet mass spectrometry. Limnol Oceanogr43: 334−339
Kelly CA, Rudd JWM, Hesslein RH, Schindler DW and oth-ers (1987) Prediction of biological acid neutralization inacid-sensitive lakes. Biogeochemistry 3: 129−140
Kim OS, Imhoff JF, Witzell KP, Junier P (2011) Distribution ofdenitrifying bacterial communities in the stratified watercolumn and sediment−water interface in two freshwaterlakes and the Baltic Sea. Aquat Ecol 45: 99−112
Kjellin J, Hallin S, Wörman A (2007) Spatial variations indenitrification activity in wetland sediments explainedby hydrology and denitrifying community structure.Water Res 41: 4710−4720
Kronvang B, Jensen JP, Hoffmann CC, Boers P (2008) Nitro-gen transport and fate in European streams, rivers, lakes,and wetlands. In: Hatfield JL, Follett RF (eds) Nitrogen inthe environment. Sources, problems, and management.Academic Press, Elsevier, San Diego, CA, p 241−270
Kuosa H, Arvola L, Bärlund I, Ekholm P and others (2006)Itämeren rehevöitymiseen on vaikutettava maalla jamerellä. Vesitalous 47: 20−25
Leavitt PR, Brock CS, Ebel C, Patoine A (2006) Landscape-scale effects of urban nitrogen on a chain of freshwaterlakes in central North America. Limnol Oceanogr 51: 2262−2277
Lepistö A, Granlund K, Kortelainen P, Räike A (2006) Nitro-gen in river basins: sources, retention in the surfacewaters and peatlands, and fluxes to estuaries in Finland.Sci Total Environ 365: 238−259
Ludwig W, Kirchof G, Klugbauer N, Weizenegger M andothers (1992) Complete 23S ribosomal RNA sequences ofGram-positive bacteria with a low DNA G+C content.Syst Appl Microbiol 15: 487−501
Magalhães C, Bano N, Wiebe WJ, Bordalo AA, HollibaughJT (2008) Dynamics of nitrous oxide reductase genes(nosZ) in intertidal rocky biofilms and sediments of theDouro River estuary (Portugal), and their relation to N-biogeochemistry. Microb Ecol 55: 259−269
McArdle BH, Anderson MJ (2001) Fitting multivariate mod-els to community data: a comment on distance-basedredundancy analysis. Ecology 82: 290−297
McCrackin ML, Elser JJ (2010) Atmospheric nitrogen depo-sition influences denitrification and nitrous oxide pro-duction in lakes. Ecology 91: 528−539
McCrackin ML, Elser JJ (2012) Denitrification kinetics anddenitrifier abundances in sediments of lakes receivingatmospheric nitrogen deposition (Colorado, USA). Bio-geochemistry 108: 39−54
McCune B, Grace JB (2002) Analysis of ecological communi-ties. MjM Software Design, Gleneden Beach, OR
Mengis M, Gachter R, Wehrli B, Bernasconi S (1997) Nitro-gen elimination in two deep eutrophic lakes. LimnolOceanogr 42: 1530−1543
Molot LA, Dillon PJ (1993) Nitrogen mass balances and de -nitrification rates in central Ontario lakes. Biogeochem-istry 20: 195−212
Mulholland PJ, Helton AM, Poole GC, Hall RO Jr and others(2008) Stream denitrification across biomes and its responseto anthropogenic nitrate loading. Nature 452: 202−205
Murphy J, Riley JP (1962) A modified single solution methodfor determination of phosphate in natural waters. AnalChim Acta 27: 31−36
Muyzer G, Dewaal EC, Uitterlinden AG (1993) Profiling ofcomplex microbial populations by denaturing gradientgel electrophoresis analysis of polymerase chain reac-tion-amplified genes coding for 16S ribosomal-RNA.Appl Environ Microbiol 59: 695−700
Neef A, Amann RI, Schlesner H, Schleifer KH (1998) Moni-toring a widespread bacterial group: in situ detection ofplanctomycetes with 16S rRNA-targeted probes. Micro-biology 144: 3257−3266
Nielsen LP (1992) Denitrification in sediment determinedfrom nitrogen isotope pairing. FEMS Microbiol Lett 86: 357−362
Nielsen K, Nielsen LP, Rasmussen P (1995) Estuarine nitro-gen retention independently estimated by the denitrifi-cation rate and mass balance methods: a study of Nors-minde Fjord, Denmark. Mar Ecol Prog Ser 119: 275−283
Nizzoli D, Carraro E, Nigro V, Viaroli P (2010) Effect oforganic enrichment and thermal regime on denitrifica-tion and dissimilatory nitrate reduction to ammonium(DNRA) in hypolimnetic sediments of two lowland lakes.Water Res 44: 2715−2724
Nõges P (2005) Water and nutrient mass balance of thepartly meromictic temperate Lake Verevi. Hydrobiologia547: 21−31
15

Aquat Microb Ecol 69: 1–16, 2013
Nõges P, Järvet A, Tuvikene L, Nõges T (1998) The budgetsof nitrogen and phosphorus in shallow eutrophic LakeVõrtsjärv (Estonia). Hydrobiologia 363: 219−227
O’Connor BL, Hondzo M, Dopraca D, LaPara TM, Finlay JC,Brezonik PL (2006) Quantity-activity relationship of den-itrifying bacteria and environmental scaling in streams ofa forested watershed. J Geophys Res 111, G04014,doi:10.1029/2006JG000254
Oravainen R (2005) Näkökohtia typpikeskusteluun. Vesi-talous 45: 36−39
Pietiläinen OP (ed) (2008) Yhdyskuntien typpikuormitus japintavesien tila. Suomen Ympäristö 46. Finnish Environ-ment Institute (SYKE), Helsinki (in Finnish)
Piña-Ochoa E, Álvarez-Cobelas M (2006) Denitrification inaquatic environments: a cross-system analysis. Biogeo-chemistry 81: 111−130
Risgaard-Petersen N, Skårup S, Nielsen LP (1999) Denitrifi-cation in a soft bottom lake: evaluation of laboratoryincubations. Aquat Microb Ecol 17: 279−287
Risgaard-Petersen N, Nielsen LP, Rysgaard S, Dalsgaard T,Meyer RL (2003) Application of the isotope pairing tech-nique in sediments where anammox and denitrificationcoexist. Limnol Oceanogr Methods 1: 63−73
Rissanen AJ, Kurhela E, Aho T, Oittinen T, Tiirola M (2010)Storage of environmental samples for guaranteeingnucleic acid yields for molecular microbiological studies.Appl Microbiol Biotechnol 88: 977−984
Rissanen AJ, Tiirola M, Ojala A (2011) Spatial and temporalvariation in denitrification and in the denitrifier commu-nity in a boreal lake. Aquat Microb Ecol 64: 27−40
Rysgaard S, Risgaard-Petersen N, Sloth NP, Jensen K,Nielsen LP (1994) Oxygen regulation of nitrification anddenitrification in sediments. Limnol Oceanogr 39: 1643−1652
Saunders DL, Kalff J (2001a) Nitrogen retention in wetlands,lakes and rivers. Hydrobiologia 443: 205−212
Saunders DL, Kalff J (2001b) Denitrification rates in the sediments of Lake Memphremagog, Canada-USA.Water Res 35: 1897−1904
Scala DJ, Kerkhof LJ (2000) Horizontal heterogeneity ofdenitrifying bacterial communities in marine sedimentsby terminal restriction fragment length polymorphismanalysis. Appl Environ Microbiol 66: 1980−1986
Schloss PD, Westcott SL, Ryabin T, Hall JR and others (2009)Introducing mothur: open-source, platform-indepen-dent, community-supported software for describing andcomparing microbial communities. Appl Environ Micro-biol 75: 7537−7541
Schmid M, Twachtmann U, Klein M, Strous M and others(2000) Molecular evidence for genus level diversity ofbacteria capable of catalyzing anaerobic ammonium oxidation. Syst Appl Microbiol 23: 93−106
Schmid M, Walsh K, Webb RI, Rijpstra WI and others (2003)Candidatus ‘Scalindua brodae’, sp. nov., Candidatus‘Scalindua wagneri’, sp. nov., two new species of anaer-obic ammonium oxidizing bacteria. Syst Appl Microbiol26: 529−538
Schubert CJ, Durisch-Kaiser E, Wehrli B, Thamdrup B, LamP, Kuypers MMM (2006) Anaerobic ammonium oxidation
in a tropical freshwater system (Lake Tanganyika). Environ Microbiol 8: 1857−1863
Seitzinger SP (1988) Denitrification in freshwater andcoastal marine ecosystems: ecological and geochemicalsignificance. Limnol Oceanogr 33: 702−724
Seitzinger SP, Kroeze C, Bouwman AF, Caraco N, DentenerF, Styles RV (2002) Global patterns of dissolved inorganicand particulate nitrogen inputs to coastal systems: recentconditions and future projections. Estuaries 25: 640−655
Seitzinger S, Harrison JA, Böhlke JK, Bouwmann AF andothers (2006) Denitrification across landscapes andwaterscapes: a synthesis. Ecol Appl 16: 2064−2090
Solorzano L (1969) Determination of ammonia in naturalwaters by the phenolhypochlorite method. LimnolOceanogr 14: 799−801
Steingruber SM, Friedrich J, Gächter R, Wehrli B (2001)Measurement of denitrification in sediments with the 15Nisotope pairing technique. Appl Environ Microbiol 67: 3771−3778
Strauss EA, Lamberti GA (2000) Regulation of nitrification inaquatic sediments by organic carbon. Limnol Oceanogr45: 1854−1859
Thamdrup B, Dalsgaard T (2002) Production of N2 throughanaerobic ammonium oxidation coupled to nitrate reduc-tion in marine sediments. Appl Environ Microbiol 68: 1312−1318
Tiirola MA, Rissanen AJ, Sarpakunnas M, Arvola L, Nykä-nen H (2011) Stable isotope profiles of nitrogen gas indi-cate denitrification in oxygen-stratified humic lakes.Rapid Commun Mass Spectrom 25: 1497−1502
Trimmer M, Risgaard-Petersen N, Nicholls JC, Engström P(2006) Direct measurement of anaerobic ammonium oxi-dation (anammox) and denitrification in intact sedimentcores. Mar Ecol Prog Ser 326: 37−47
Wallenstein MD, Myrold DD, Firestone M, Voytek M (2006)Environmental controls on denitrifying communities anddenitrification rates: insights from molecular methods.Ecol Appl 16: 2143−2152
Wertz S, Dandie CE, Goyer C, Trevors JT, Patten CL (2009)Diversity of nirK denitrifying genes and transcripts in anagricultural soil. Appl Environ Microbiol 75: 7365−7377
Wolsing M, Priemé A (2004) Observation of high seasonalvariation in community structure of denitrifying bacteriain arable soil receiving artificial fertilizer and cattlemanure by determining T-RFLP of nir gene fragments.FEMS Microbiol Ecol 48: 261−271
Wood ED, Armstrong FA, Richards FA (1967) Determinationof nitrate in sea water by cadmium-copper reduction tonitrite. J Mar Biol Assoc UK 47: 23−31
Wu L, Kellogg L, Devol AH, Tiedje JM, Zhou J (2008) Micro-array-based characterization of microbial communityfunctional structure and heterogeneity in marine sedi-ments from the Gulf of Mexico. Appl Environ Microbiol74: 4516−4529
Yoshinaga I, Amano T, Yamagishi T, Okada K, Ueda S, SakoY, Suwa Y (2011) Distribution and diversity of anaerobicammonium oxidation (anammox) bacteria in the sedi-ment of a eutrophic freshwater lake, Lake Kitaura,Japan. Microbes Environ 26: 189−197
16
Editorial responsibility: Tom Battin,Vienna, Austria
Submitted: May 14, 2012; Accepted: January 29, 2013Proofs received from author(s): March 26, 2013