honeywell onondaga lake capping, dredging, … · honeywell onondaga lake capping, dredging,...
TRANSCRIPT
HoneywellONONDAGA LAKE CAPPING, DREDGING,
HABITAT AND PROFUNDAL ZONE (SMU 8)
FINAL DESIGN
PEC
Metals (mg/kg)
Mercury 2.2
Organic Compounds
BTEX Compounds ( mg/kg)
Ethylbenzene 176
Xylenes 560.8
Chlorinated Benzenes ( m g/kg)
Chlorobenzene 428
Dichlorobenzenes 239
Trichlorobenzenes 347
PAH Compounds ( m g/kg)
Acenaphthene 861
Acenaphthylene 1301
Anthracene 207
Benz[a]anthracene 192
Benzo[a]pyrene 146
Benzo[b]fluoranthene 908
Benzo[ghi]perylene 780
Benzo[k]fluoranthene 203
Chrysene 253
Dibenz[a,h]anthracene 157
Fluoranthene 1436
Fluorene 264
Indeno[1,2,3-cd]pyrene 183
Naphthalene 917
Phenanthrene 543
Pyrene 344
Polychlorinated Biphenyls ( m g/kg)
Total PCBs 295
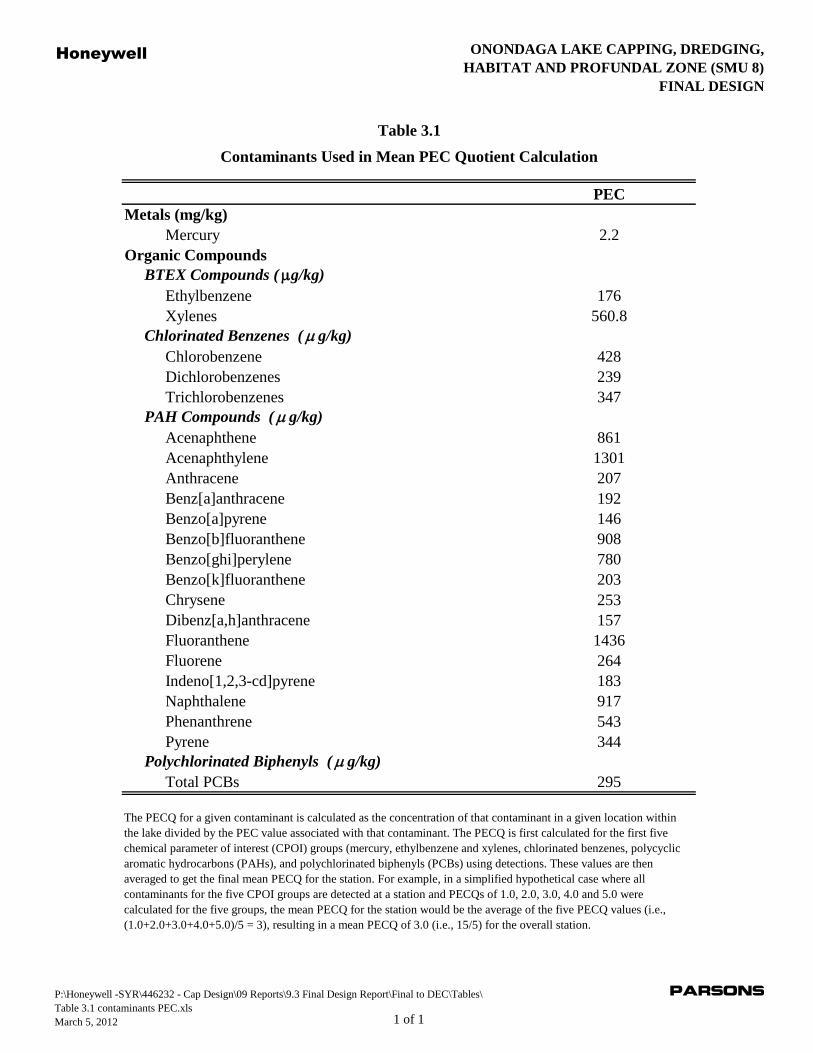
Contaminants Used in Mean PEC Quotient Calculation
Table 3.1
The PECQ for a given contaminant is calculated as the concentration of that contaminant in a given location within
the lake divided by the PEC value associated with that contaminant. The PECQ is first calculated for the first five
chemical parameter of interest (CPOI) groups (mercury, ethylbenzene and xylenes, chlorinated benzenes, polycyclic
aromatic hydrocarbons (PAHs), and polychlorinated biphenyls (PCBs) using detections. These values are then
averaged to get the final mean PECQ for the station. For example, in a simplified hypothetical case where all
contaminants for the five CPOI groups are detected at a station and PECQs of 1.0, 2.0, 3.0, 4.0 and 5.0 were
calculated for the five groups, the mean PECQ for the station would be the average of the five PECQ values (i.e.,
(1.0+2.0+3.0+4.0+5.0)/5 = 3), resulting in a mean PECQ of 3.0 (i.e., 15/5) for the overall station.
P:\Honeywell -SYR\446232 - Cap Design\09 Reports\9.3 Final Design Report\Final to DEC\Tables\
Table 3.1 contaminants PEC.xls
March 5, 2012 1 of 1
PARSONS
HONEYWELLONONDAGA LAKE CAPPING, DREDGING,
HABITAT AND PROFUNDAL ZONE (SMU 8)
FINAL DESIGN
SiteMoisture
ContentPercent Solids LL PI
Undrained
Shear
Strength (psf)
Water depth
(feet)Cap Design
Method of
PlacementMeasured (in) Observed/General
KPC Ward Cove Sediment
Remediation
Ketchikan, AK (1)
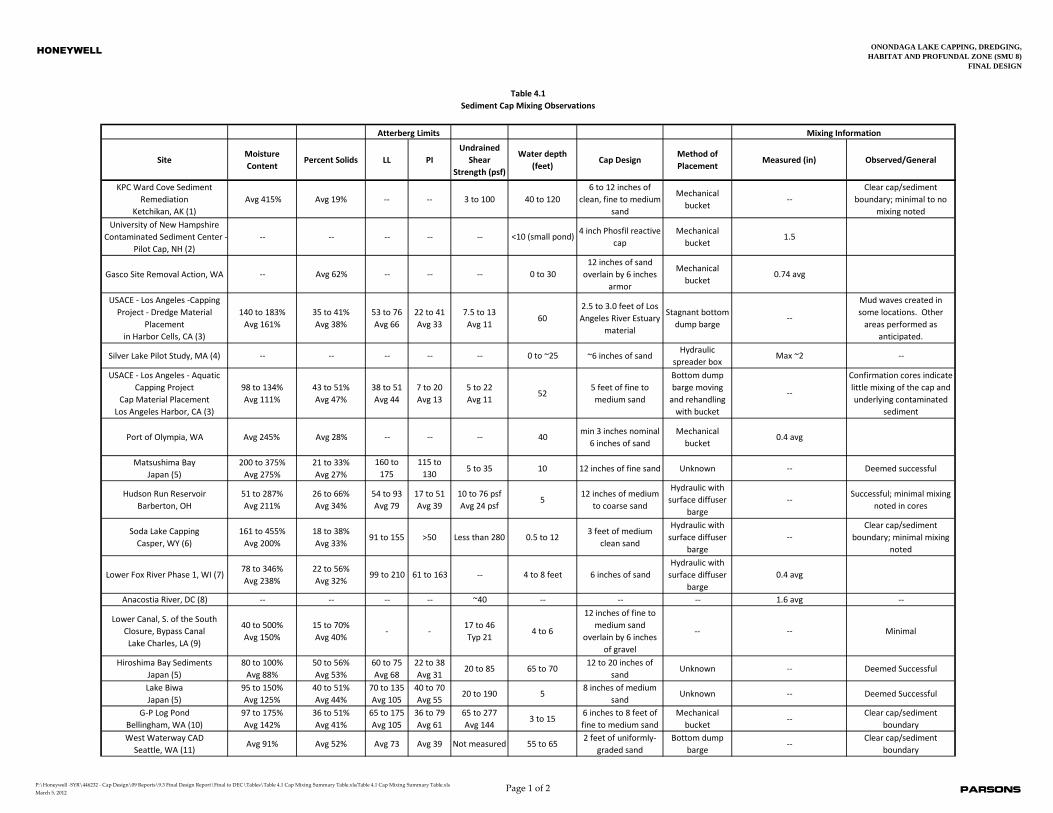
Avg 415% Avg 19% -- -- 3 to 100 40 to 120
6 to 12 inches of
clean, fine to medium
sand
Mechanical
bucket--
Clear cap/sediment
boundary; minimal to no
mixing noted
University of New Hampshire
Contaminated Sediment Center -
Pilot Cap, NH (2)
-- -- -- -- -- <10 (small pond)4 inch Phosfil reactive
cap
Mechanical
bucket1.5
Gasco Site Removal Action, WA -- Avg 62% -- -- -- 0 to 30
12 inches of sand
overlain by 6 inches
armor
Mechanical
bucket0.74 avg
USACE - Los Angeles -Capping
Project - Dredge Material
Placement
in Harbor Cells, CA (3)
140 to 183%
Avg 161%
35 to 41%
Avg 38%
53 to 76
Avg 66
22 to 41
Avg 33
7.5 to 13
Avg 1160
2.5 to 3.0 feet of Los
Angeles River Estuary
material
Stagnant bottom
dump barge--
Mud waves created in
some locations. Other
areas performed as
anticipated.
Silver Lake Pilot Study, MA (4) -- -- -- -- -- 0 to ~25 ~6 inches of sandHydraulic
spreader boxMax ~2 --
USACE - Los Angeles - Aquatic
Capping Project
Cap Material Placement
Los Angeles Harbor, CA (3)
98 to 134%
Avg 111%
43 to 51%
Avg 47%
38 to 51
Avg 44
7 to 20
Avg 13
5 to 22
Avg 1152
5 feet of fine to
medium sand
Bottom dump
barge moving
and rehandling
with bucket
--
Confirmation cores indicate
little mixing of the cap and
underlying contaminated
sediment
Port of Olympia, WA Avg 245% Avg 28% -- -- -- 40min 3 inches nominal
6 inches of sand
Mechanical
bucket0.4 avg
Matsushima Bay
Japan (5)
200 to 375%
Avg 275%
21 to 33%
Avg 27%
160 to
175
Avg 170
115 to
130
Avg 125
5 to 35 10 12 inches of fine sand Unknown -- Deemed successful
Hudson Run Reservoir
Barberton, OH
51 to 287%
Avg 211%
26 to 66%
Avg 34%
54 to 93
Avg 79
17 to 51
Avg 39
10 to 76 psf
Avg 24 psf5
12 inches of medium
to coarse sand
Hydraulic with
surface diffuser
barge
--Successful; minimal mixing
noted in cores
Soda Lake Capping
Casper, WY (6)
161 to 455%
Avg 200%
18 to 38%
Avg 33%91 to 155 >50 Less than 280 0.5 to 12
3 feet of medium
clean sand
Hydraulic with
surface diffuser
barge
--
Clear cap/sediment
boundary; minimal mixing
noted
Lower Fox River Phase 1, WI (7)78 to 346%
Avg 238%
22 to 56%
Avg 32%99 to 210 61 to 163 -- 4 to 8 feet 6 inches of sand
Hydraulic with
surface diffuser
barge
0.4 avg
Anacostia River, DC (8) -- -- -- -- ~40 -- -- -- 1.6 avg --
Lower Canal, S. of the South
Closure, Bypass Canal
Lake Charles, LA (9)
40 to 500%
Avg 150%
15 to 70%
Avg 40%- -
17 to 46
Typ 214 to 6
12 inches of fine to
medium sand
overlain by 6 inches
of gravel
-- -- Minimal
Hiroshima Bay Sediments
Japan (5)
80 to 100%
Avg 88%
50 to 56%
Avg 53%
60 to 75
Avg 68
22 to 38
Avg 3120 to 85 65 to 70
12 to 20 inches of
sandUnknown -- Deemed Successful
Lake Biwa
Japan (5)
95 to 150%
Avg 125%
40 to 51%
Avg 44%
70 to 135
Avg 105
40 to 70
Avg 5520 to 190 5
8 inches of medium
sandUnknown -- Deemed Successful
G-P Log Pond
Bellingham, WA (10)
97 to 175%
Avg 142%
36 to 51%
Avg 41%
65 to 175
Avg 105
36 to 79
Avg 61
65 to 277
Avg 1443 to 15
6 inches to 8 feet of
fine to medium sand
Mechanical
bucket--
Clear cap/sediment
boundary
West Waterway CAD
Seattle, WA (11)Avg 91% Avg 52% Avg 73 Avg 39 Not measured 55 to 65
2 feet of uniformly-
graded sand
Bottom dump
barge--
Clear cap/sediment
boundary
Atterberg Limits
Table 4.1
Sediment Cap Mixing Observations
Mixing Information
P:\Honeywell -SYR\446232 - Cap Design\09 Reports\9.3 Final Design Report\Final to DEC\Tables\Table 4.1 Cap Mixing Summary Table.xls/Table 4.1 Cap Mixing Summary Table.xls
March 5, 2012Page 1 of 2 Parsons
HONEYWELLONONDAGA LAKE CAPPING, DREDGING,
HABITAT AND PROFUNDAL ZONE (SMU 8)
FINAL DESIGN
SiteMoisture
ContentPercent Solids LL PI
Undrained
Shear
Strength (psf)
Water depth
(feet)Cap Design
Method of
PlacementMeasured (in) Observed/General
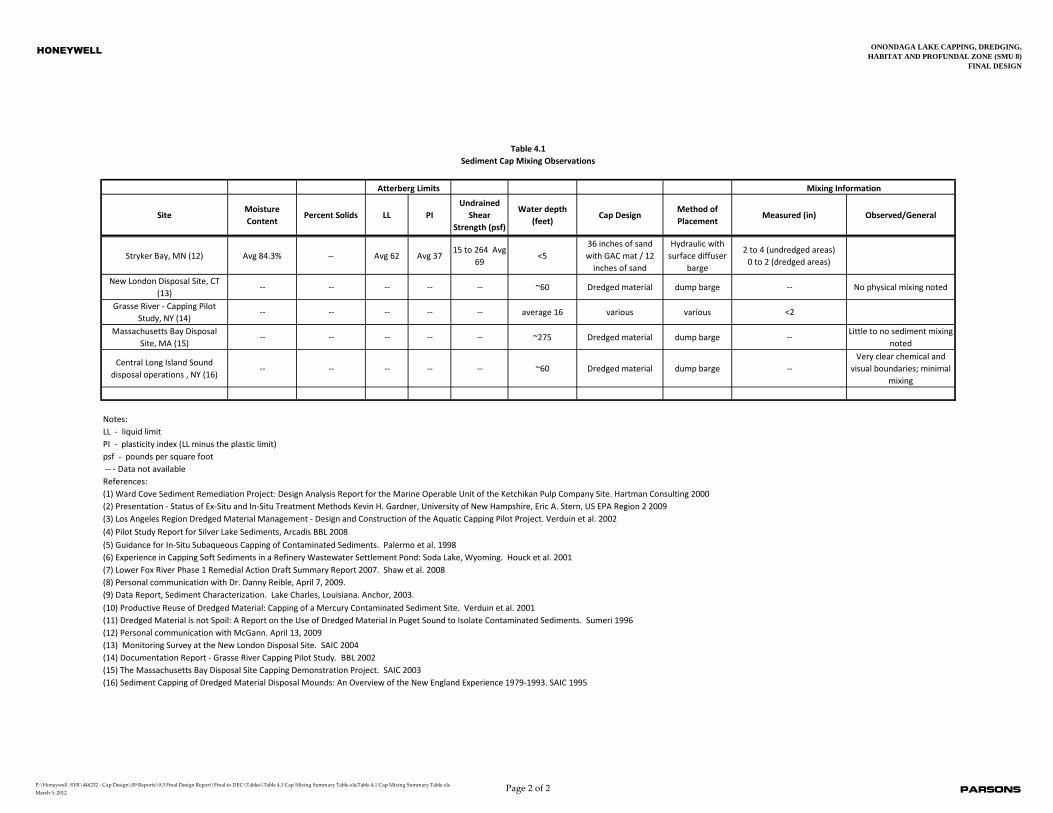
Atterberg Limits
Table 4.1
Sediment Cap Mixing Observations
Mixing Information
Stryker Bay, MN (12) Avg 84.3% -- Avg 62 Avg 3715 to 264 Avg
69<5
36 inches of sand
with GAC mat / 12
inches of sand
Hydraulic with
surface diffuser
barge
2 to 4 (undredged areas)
0 to 2 (dredged areas)
New London Disposal Site, CT
(13)-- -- -- -- -- ~60 Dredged material dump barge -- No physical mixing noted
Grasse River - Capping Pilot
Study, NY (14)-- -- -- -- -- average 16 various various <2
Massachusetts Bay Disposal
Site, MA (15)-- -- -- -- -- ~275 Dredged material dump barge --
Little to no sediment mixing
noted
Central Long Island Sound
disposal operations , NY (16)-- -- -- -- -- ~60 Dredged material dump barge --
Very clear chemical and
visual boundaries; minimal
mixing
Notes:
LL - liquid limit
PI - plasticity index (LL minus the plastic limit)
psf - pounds per square foot
-- - Data not available
References:
(1) Ward Cove Sediment Remediation Project: Design Analysis Report for the Marine Operable Unit of the Ketchikan Pulp Company Site. Hartman Consulting 2000
(2) Presentation - Status of Ex-Situ and In-Situ Treatment Methods Kevin H. Gardner, University of New Hampshire, Eric A. Stern, US EPA Region 2 2009
(3) Los Angeles Region Dredged Material Management - Design and Construction of the Aquatic Capping Pilot Project. Verduin et al. 2002
(5) Guidance for In-Situ Subaqueous Capping of Contaminated Sediments. Palermo et al. 1998
(6) Experience in Capping Soft Sediments in a Refinery Wastewater Settlement Pond: Soda Lake, Wyoming. Houck et al. 2001
(7) Lower Fox River Phase 1 Remedial Action Draft Summary Report 2007. Shaw et al. 2008
(8) Personal communication with Dr. Danny Reible, April 7, 2009.
(10) Productive Reuse of Dredged Material: Capping of a Mercury Contaminated Sediment Site. Verduin et al. 2001
(11) Dredged Material is not Spoil: A Report on the Use of Dredged Material in Puget Sound to Isolate Contaminated Sediments. Sumeri 1996
(12) Personal communication with McGann. April 13, 2009
(13) Monitoring Survey at the New London Disposal Site. SAIC 2004
(14) Documentation Report - Grasse River Capping Pilot Study. BBL 2002
(15) The Massachusetts Bay Disposal Site Capping Demonstration Project. SAIC 2003
(16) Sediment Capping of Dredged Material Disposal Mounds: An Overview of the New England Experience 1979-1993. SAIC 1995
(9) Data Report, Sediment Characterization. Lake Charles, Louisiana. Anchor, 2003.
(4) Pilot Study Report for Silver Lake Sediments, Arcadis BBL 2008
P:\Honeywell -SYR\446232 - Cap Design\09 Reports\9.3 Final Design Report\Final to DEC\Tables\Table 4.1 Cap Mixing Summary Table.xls/Table 4.1 Cap Mixing Summary Table.xls
March 5, 2012Page 2 of 2 Parsons
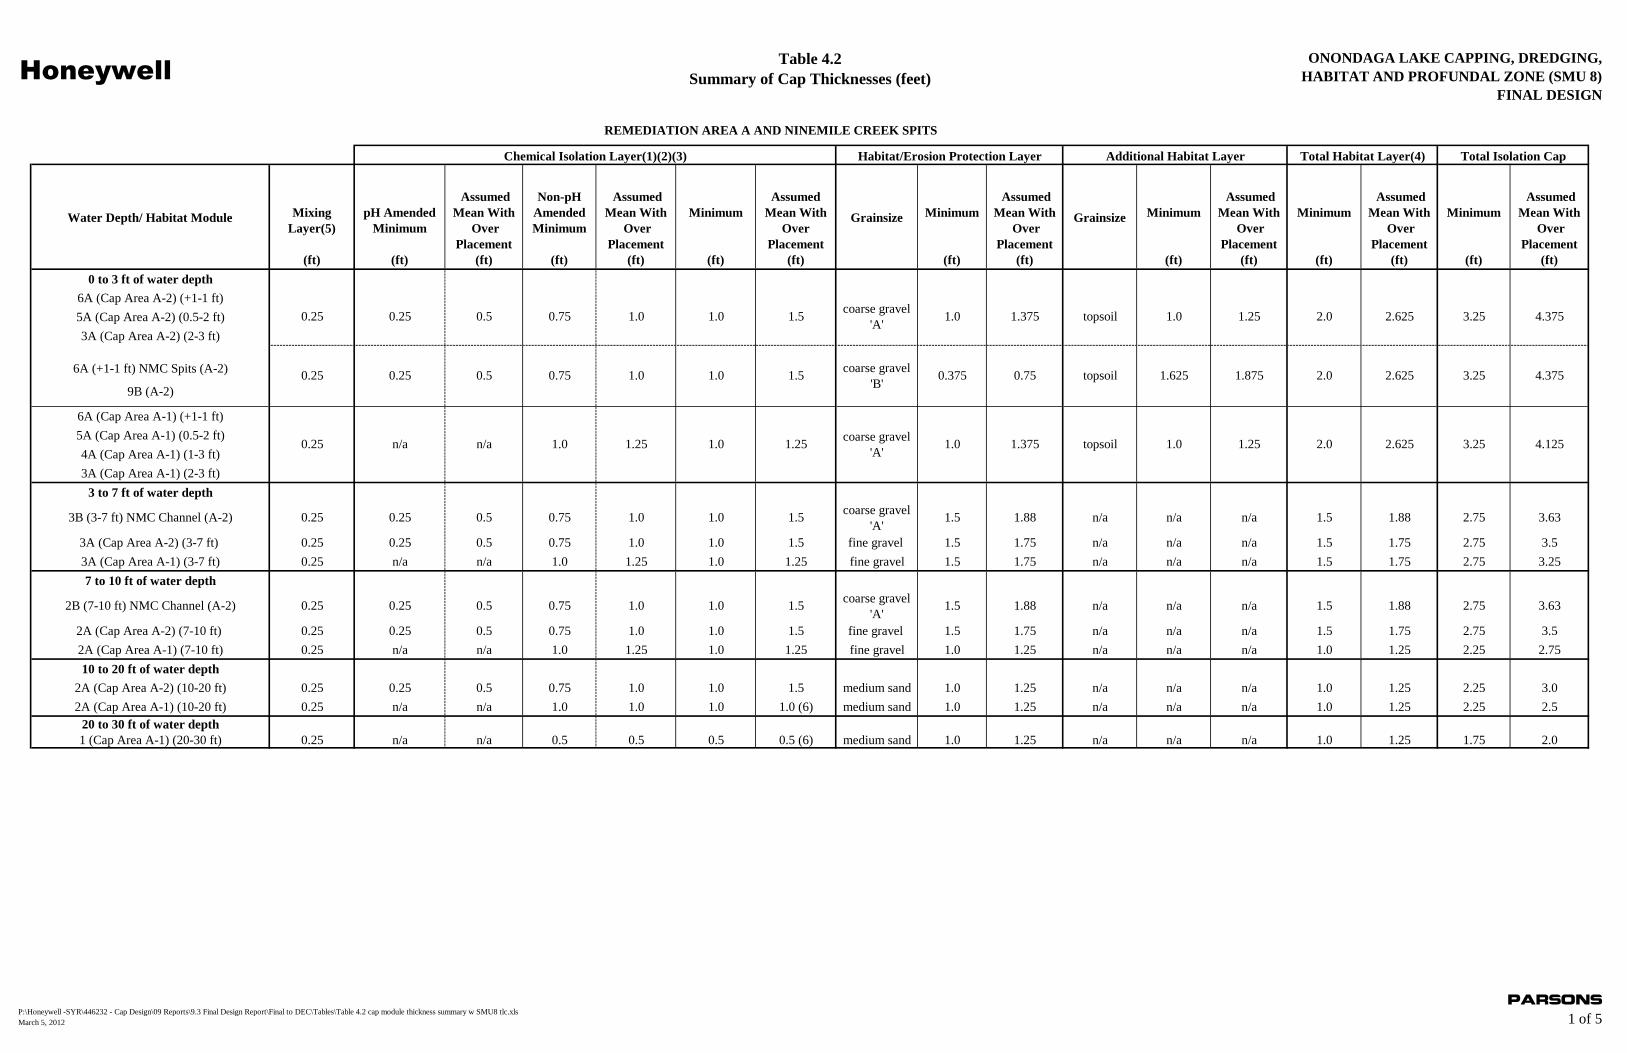
HoneywellTable 4.2
Summary of Cap Thicknesses (feet)
ONONDAGA LAKE CAPPING, DREDGING,
HABITAT AND PROFUNDAL ZONE (SMU 8)
FINAL DESIGN
Water Depth/ Habitat Module Mixing
Layer(5)
(ft)
pH Amended
Minimum
(ft)
Assumed
Mean With
Over
Placement
(ft)
Non-pH
Amended
Minimum
(ft)
Assumed
Mean With
Over
Placement
(ft)
Minimum
(ft)
Assumed
Mean With
Over
Placement
(ft)
Grainsize Minimum
(ft)
Assumed
Mean With
Over
Placement
(ft)
Grainsize Minimum
(ft)
Assumed
Mean With
Over
Placement
(ft)
Minimum
(ft)
Assumed
Mean With
Over
Placement
(ft)
Minimum
(ft)
Assumed
Mean With
Over
Placement
(ft)
0 to 3 ft of water depth
6A (Cap Area A-2) (+1-1 ft)
5A (Cap Area A-2) (0.5-2 ft)
3A (Cap Area A-2) (2-3 ft)
6A (+1-1 ft) NMC Spits (A-2)
9B (A-2)
6A (Cap Area A-1) (+1-1 ft)
5A (Cap Area A-1) (0.5-2 ft)
4A (Cap Area A-1) (1-3 ft)
3A (Cap Area A-1) (2-3 ft)
3 to 7 ft of water depth
3B (3-7 ft) NMC Channel (A-2) 0.25 0.25 0.5 0.75 1.0 1.0 1.5coarse gravel
'A'1.5 1.88 n/a n/a n/a 1.5 1.88 2.75 3.63
3A (Cap Area A-2) (3-7 ft) 0.25 0.25 0.5 0.75 1.0 1.0 1.5 fine gravel 1.5 1.75 n/a n/a n/a 1.5 1.75 2.75 3.5
3A (Cap Area A-1) (3-7 ft) 0.25 n/a n/a 1.0 1.25 1.0 1.25 fine gravel 1.5 1.75 n/a n/a n/a 1.5 1.75 2.75 3.25
7 to 10 ft of water depth
2B (7-10 ft) NMC Channel (A-2) 0.25 0.25 0.5 0.75 1.0 1.0 1.5coarse gravel
'A'1.5 1.88 n/a n/a n/a 1.5 1.88 2.75 3.63
2A (Cap Area A-2) (7-10 ft) 0.25 0.25 0.5 0.75 1.0 1.0 1.5 fine gravel 1.5 1.75 n/a n/a n/a 1.5 1.75 2.75 3.5
2A (Cap Area A-1) (7-10 ft) 0.25 n/a n/a 1.0 1.25 1.0 1.25 fine gravel 1.0 1.25 n/a n/a n/a 1.0 1.25 2.25 2.75
10 to 20 ft of water depth
2A (Cap Area A-2) (10-20 ft) 0.25 0.25 0.5 0.75 1.0 1.0 1.5 medium sand 1.0 1.25 n/a n/a n/a 1.0 1.25 2.25 3.0
2A (Cap Area A-1) (10-20 ft) 0.25 n/a n/a 1.0 1.0 1.0 1.0 (6) medium sand 1.0 1.25 n/a n/a n/a 1.0 1.25 2.25 2.5
20 to 30 ft of water depth
1 (Cap Area A-1) (20-30 ft) 0.25 n/a n/a 0.5 0.5 0.5 0.5 (6) medium sand 1.0 1.25 n/a n/a n/a 1.0 1.25 1.75 2.0
0.375 2.0
1.25 2.0
2.625 3.25 4.3751.0 1.5coarse gravel
'B'0.25 0.25 0.5 0.75 1.0 0.75 topsoil 1.625 1.875
REMEDIATION AREA A AND NINEMILE CREEK SPITS
Total Habitat Layer(4) Total Isolation CapHabitat/Erosion Protection Layer Additional Habitat LayerChemical Isolation Layer(1)(2)(3)
0.25 0.25 0.5 0.75 1.0 1.0 1.5coarse gravel
'A'1.0 1.375 topsoil 1.0 2.625 3.25 4.375
0.25 n/a n/a 1.0 1.25 1.0 1.25coarse gravel
'A'1.0 1.375 topsoil 1.0 1.25 2.0 2.625 3.25 4.125
P:\Honeywell -SYR\446232 - Cap Design\09 Reports\9.3 Final Design Report\Final to DEC\Tables\Table 4.2 cap module thickness summary w SMU8 tlc.xls
March 5, 2012
Parsons
1 of 5
HoneywellTable 4.2
Summary of Cap Thicknesses (feet)
ONONDAGA LAKE CAPPING, DREDGING,
HABITAT AND PROFUNDAL ZONE (SMU 8)
FINAL DESIGN
Habitat Module Mixing
Layer(5)
(ft)
pH Amended
Minimum
(ft)
Assumed
Mean With
Over
Placement
(ft)
Non-pH
Amended
Minimum
(ft)
Assumed
Mean With
Over
Placement
(ft)
Minimum
(ft)
Assumed
Mean With
Over
Placement
(ft)
Grainsize Minimum
(ft)
Assumed
Mean With
Over
Placement
(ft)
Grainsize Minimum
(ft)
Assumed
Mean With
Over
Placement
(ft)
Minimum
(ft)
Assumed
Mean With
Over
Placement
(ft)
Minimum
(ft)
Assumed
Mean With
Over
Placement
(ft)
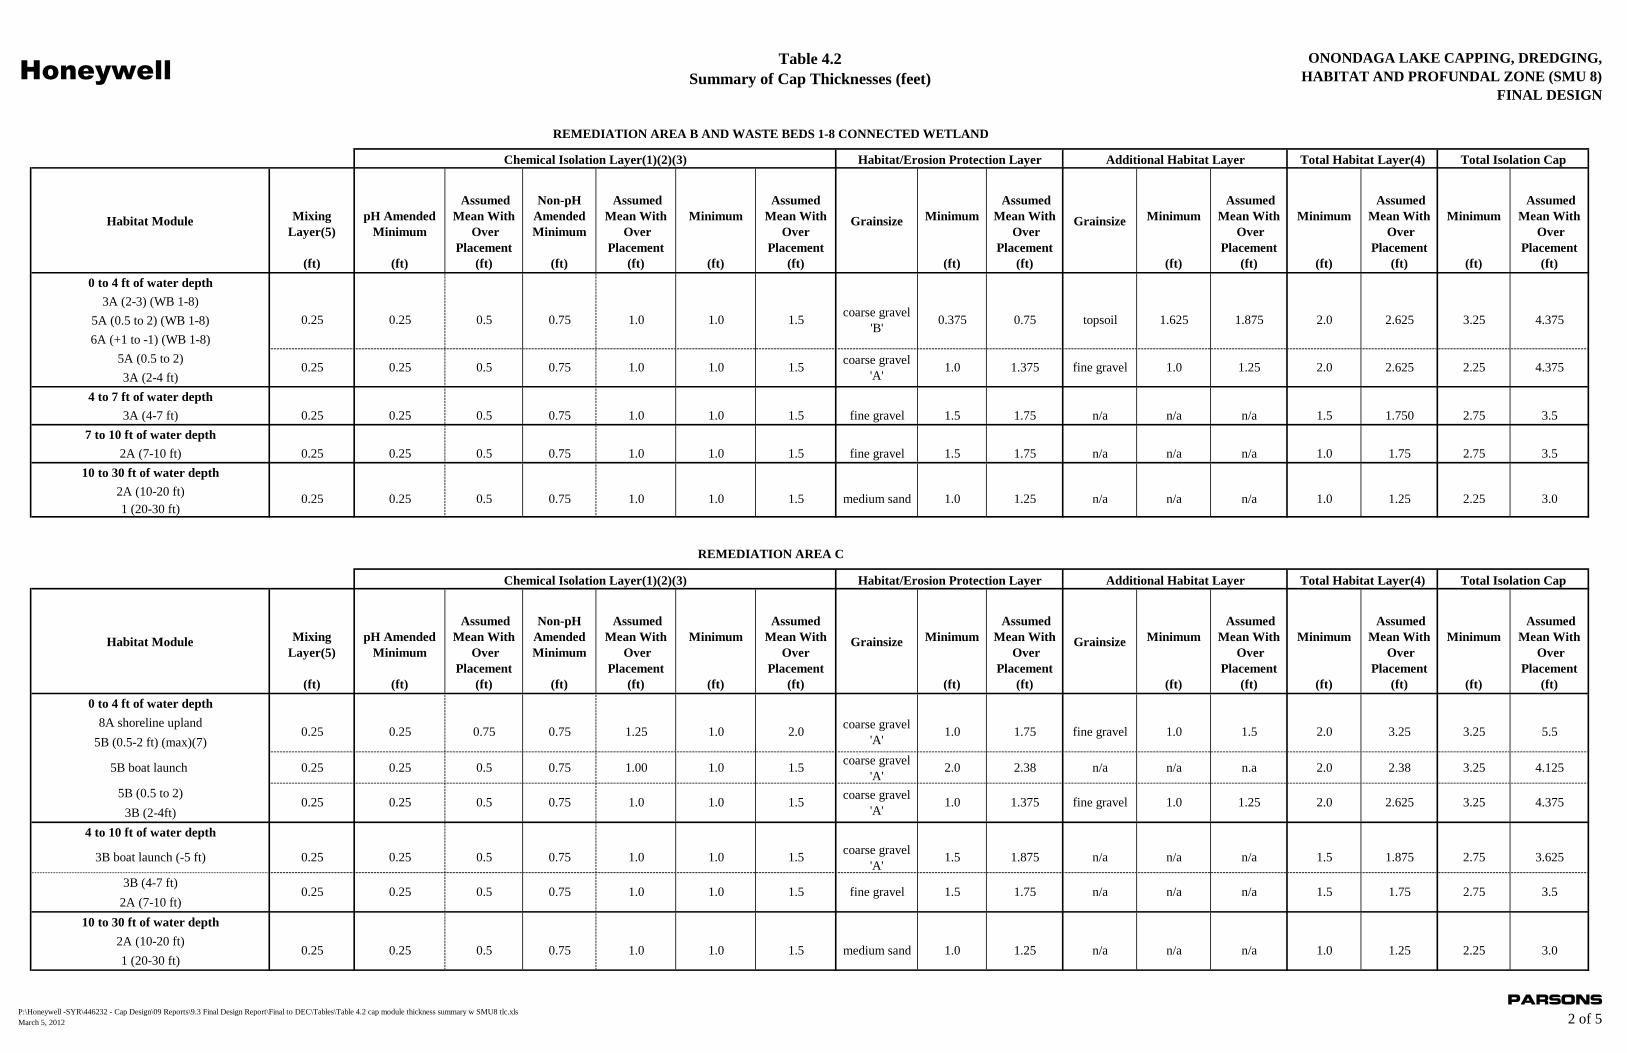
0 to 4 ft of water depth
3A (2-3) (WB 1-8)
5A (0.5 to 2) (WB 1-8)
6A (+1 to -1) (WB 1-8)
5A (0.5 to 2)
3A (2-4 ft)
4 to 7 ft of water depth
3A (4-7 ft) 0.25 0.25 0.5 0.75 1.0 1.0 1.5 fine gravel 1.5 1.75 n/a n/a n/a 1.5 1.750 2.75 3.5
7 to 10 ft of water depth
2A (7-10 ft) 0.25 0.25 0.5 0.75 1.0 1.0 1.5 fine gravel 1.5 1.75 n/a n/a n/a 1.0 1.75 2.75 3.5
10 to 30 ft of water depth
2A (10-20 ft)
1 (20-30 ft)
Habitat Module Mixing
Layer(5)
(ft)
pH Amended
Minimum
(ft)
Assumed
Mean With
Over
Placement
(ft)
Non-pH
Amended
Minimum
(ft)
Assumed
Mean With
Over
Placement
(ft)
Minimum
(ft)
Assumed
Mean With
Over
Placement
(ft)
Grainsize Minimum
(ft)
Assumed
Mean With
Over
Placement
(ft)
Grainsize Minimum
(ft)
Assumed
Mean With
Over
Placement
(ft)
Minimum
(ft)
Assumed
Mean With
Over
Placement
(ft)
Minimum
(ft)
Assumed
Mean With
Over
Placement
(ft)
0 to 4 ft of water depth
8A shoreline upland
5B (0.5-2 ft) (max)(7)
5B boat launch 0.25 0.25 0.5 0.75 1.00 1.0 1.5coarse gravel
'A'2.0 2.38 n/a n/a n.a 2.0 2.38 3.25 4.125
5B (0.5 to 2)
3B (2-4ft)
4 to 10 ft of water depth
3B boat launch (-5 ft) 0.25 0.25 0.5 0.75 1.0 1.0 1.5coarse gravel
'A'1.5 1.875 n/a n/a n/a 1.5 1.875 2.75 3.625
3B (4-7 ft)
2A (7-10 ft)
10 to 30 ft of water depth
2A (10-20 ft)
1 (20-30 ft)
1.5coarse gravel
'A'2.625 2.25 4.3751.0 1.375 fine gravel 1.00.25 0.25 0.5 0.75 1.0 1.0
3.25 4.375
1.25 2.0
n/a
5.5
1.0 1.25
2.0 2.625
1.0
1.875
3.5
2.25 3.0
3.25 3.25
1.5coarse gravel
'A'
1.75
1.25
Total Habitat Layer(4)
Additional Habitat LayerHabitat/Erosion Protection Layer
medium sand 1.0
1.5 2.0
1.0 1.375
REMEDIATION AREA B AND WASTE BEDS 1-8 CONNECTED WETLAND
REMEDIATION AREA C
Total Isolation Cap
n/a
Additional Habitat LayerHabitat/Erosion Protection Layer
Total Habitat Layer(4) Total Isolation Cap
2.75fine gravel
1.0
1.5
1.25
1.0
n/a
n/a
1.0
0.25 0.5 0.75 1.0
Chemical Isolation Layer(1)(2)(3)
1.5
0.25 0.5 0.75
0.25 0.25
0.25
0.25
0.75 0.75
n/a n/a0.25 0.25 0.5 0.75 1.0 1.25
1.25 1.0
Chemical Isolation Layer(1)(2)(3)
1.5
1.0
coarse gravel
'A'
1.0 1.0
1.75 fine gravel1.02.0
1.25
1.5 1.75 n/a
fine gravel
0.25 0.25 0.5 0.75 1.0 1.5 medium sand 1.0 n/a n/a 1.0 2.25 3.0
1.5coarse gravel
'B'0.375 0.75 topsoil 1.6250.25 0.25 0.5 0.75 1.0 1.0 2.0 2.625 3.25 4.375
P:\Honeywell -SYR\446232 - Cap Design\09 Reports\9.3 Final Design Report\Final to DEC\Tables\Table 4.2 cap module thickness summary w SMU8 tlc.xls
March 5, 2012
Parsons
2 of 5

HoneywellTable 4.2
Summary of Cap Thicknesses (feet)
ONONDAGA LAKE CAPPING, DREDGING,
HABITAT AND PROFUNDAL ZONE (SMU 8)
FINAL DESIGN
Habitat Module Mixing
Layer(5)
(ft)
pH Amended
Minimum
(ft)
Assumed
Mean With
Over
Placement
(ft)
Non-pH
Amended
Minimum
(ft)
Assumed
Mean With
Over
Placement
(ft)
Minimum
(ft)
Assumed
Mean With
Over
Placement
(ft)
Grainsize Minimum
(ft)
Assumed
Mean With
Over
Placement
(ft)
Grainsize Minimum
(ft)
Assumed
Mean With
Over
Placement
(ft)
Minimum
(ft)
Assumed
Mean With
Over
Placement
(ft)
Minimum
(ft)
Assumed
Mean With
Over
Placement
(ft)
0 to 4 ft of water depth
6A (+1-1 ft) max cap (7)
5A (0.5-2 ft) max cap (7)
5A (0.5-2 ft) (8)
6A (+1-1 ft)
3B (2-4 ft)
4 to 7 ft of water depth
3B (4-7 ft) 0.25 0.25 0.5 0.75 1.0 1.0 1.5 fine gravel 1.5 1.75 n/a n/a n/a 1.5 1.75 2.75 3.5
7 to 10 ft of water depth
2A (7-10 ft) 0.25 0.25 0.5 0.75 1.0 1.0 1.5 fine gravel 1.0 1.25 n/a n/a n/a 1.0 1.3 2.25 3.0
10 to 30 ft of water depth
2A (10-20 ft)
1 (20-30 ft)
1 (30+ ft)
REMEDIATION AREA D
Total Habitat Layer(4) Total Isolation CapHabitat/Erosion Protection Layer
n/a
3.25
medium sand 1.0 4.3751.25 2.0 2.625 3.25
2.25
coarse gravel
'A'
medium sand 1.0
1.5 1.0 1.3751.00.25
3.0
Chemical Isolation Layer(1)(2)(3)
1.5
1.00.75
1.0
0.50.25
0.25 0.25 0.5 0.75
0.25 0.25 0.75 0.75 1.25 1.0 2.0coarse gravel
'A'1.5 2.0
Additional Habitat Layer
3.25 5.51.0 1.75 medium sand 1.0
1.251.0 n/a n/a 1.0 1.25
P:\Honeywell -SYR\446232 - Cap Design\09 Reports\9.3 Final Design Report\Final to DEC\Tables\Table 4.2 cap module thickness summary w SMU8 tlc.xls
March 5, 2012
Parsons
3 of 5
HoneywellTable 4.2
Summary of Cap Thicknesses (feet)
ONONDAGA LAKE CAPPING, DREDGING,
HABITAT AND PROFUNDAL ZONE (SMU 8)
FINAL DESIGN
Habitat Module Mixing
Layer(5)
(ft)
pH Amended
Minimum
(ft)
Assumed
Mean With
Over
Placement
(ft)
Non-pH
Amended
Minimum
(ft)
Assumed
Mean With
Over
Placement
(ft)
Minimum
(ft)
Assumed
Mean With
Over
Placement
(ft)
Grainsize Minimum
(ft)
Assumed
Mean With
Over
Placement
(ft)
Grainsize Minimum
(ft)
Assumed
Mean With
Over
Placement
(ft)
Minimum
(ft)
Assumed
Mean With
Over
Placement
(ft)
Minimum
(ft)
Assumed
Mean With
Over
Placement
(ft)
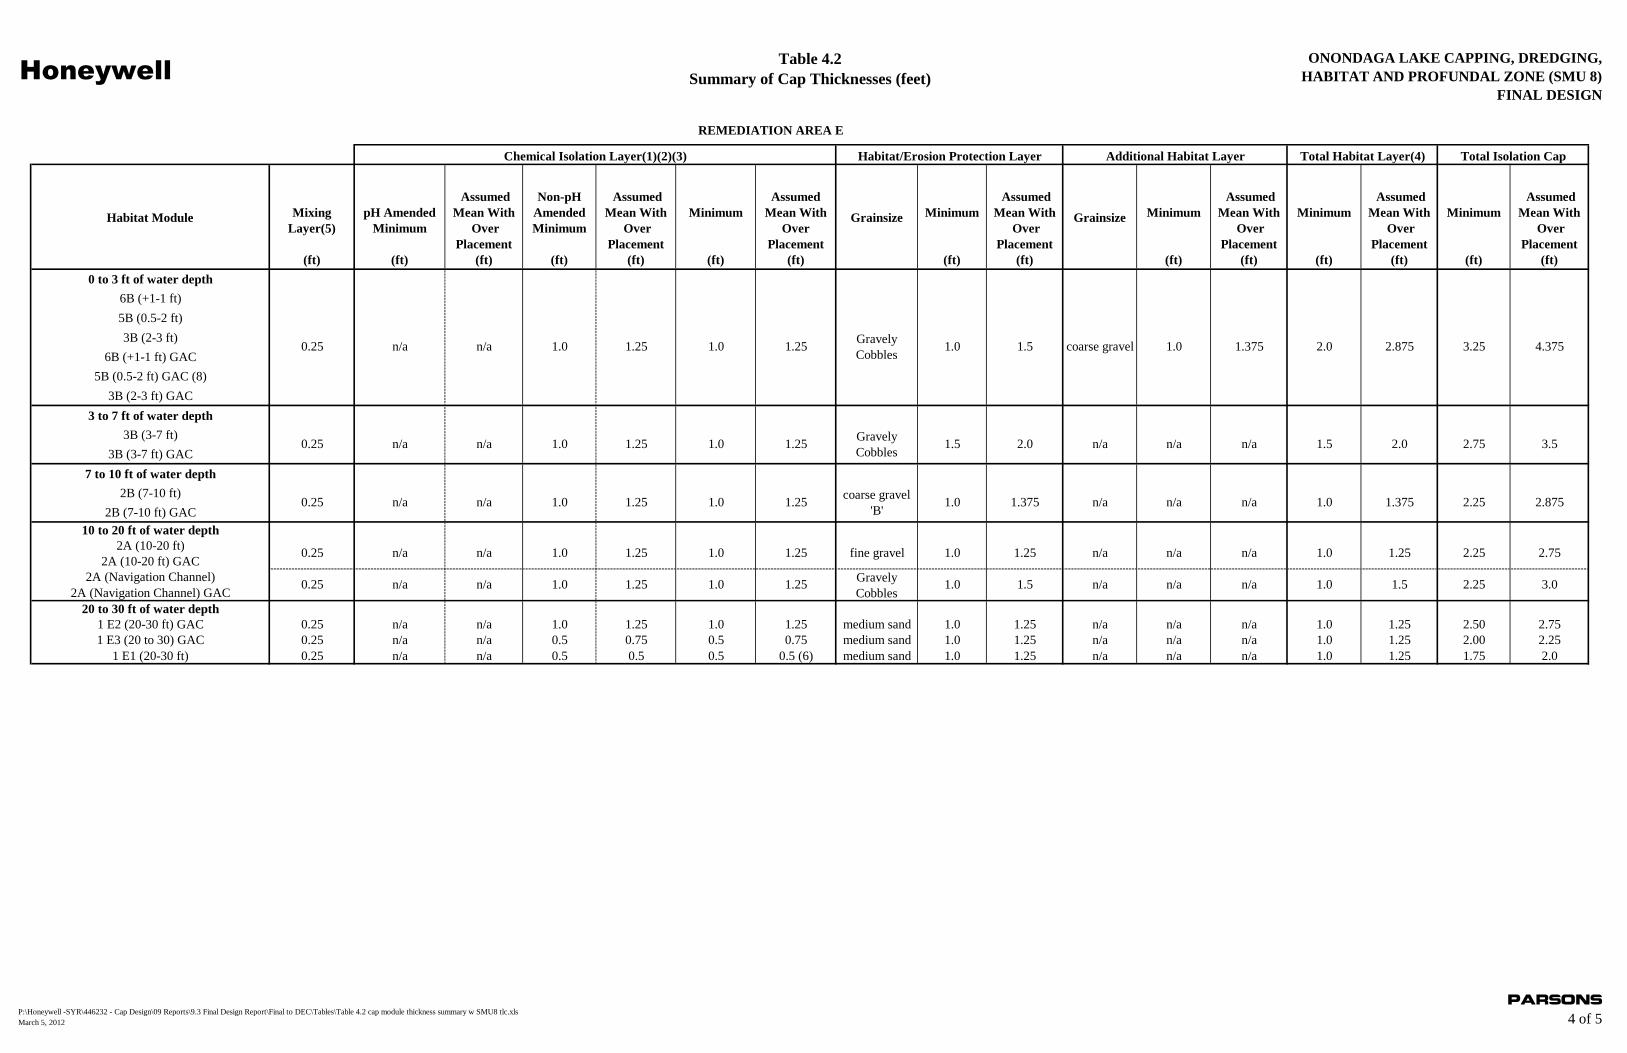
0 to 3 ft of water depth
6B (+1-1 ft)
5B (0.5-2 ft)
3B (2-3 ft)
6B (+1-1 ft) GAC
5B (0.5-2 ft) GAC (8)
3B (2-3 ft) GAC
3 to 7 ft of water depth
3B (3-7 ft)
3B (3-7 ft) GAC
7 to 10 ft of water depth
2B (7-10 ft)
2B (7-10 ft) GAC
10 to 20 ft of water depth
2A (10-20 ft)
2A (10-20 ft) GAC
2A (Navigation Channel)
2A (Navigation Channel) GAC
20 to 30 ft of water depth
1 E2 (20-30 ft) GAC 0.25 n/a n/a 1.0 1.25 1.0 1.25 medium sand 1.0 1.25 n/a n/a n/a 1.0 1.25 2.50 2.75
1 E3 (20 to 30) GAC 0.25 n/a n/a 0.5 0.75 0.5 0.75 medium sand 1.0 1.25 n/a n/a n/a 1.0 1.25 2.00 2.25
1 E1 (20-30 ft) 0.25 n/a n/a 0.5 0.5 0.5 0.5 (6) medium sand 1.0 1.25 n/a n/a n/a 1.0 1.25 1.75 2.0
1.5 2.0 n/a n/a
3.25 4.3751.0 1.25Gravely
Cobbles1.5 2.875
2.75
REMEDIATION AREA E
Gravely
Cobbles1.5 2.0
1.0 1.375 2.0
3.0
0.25 1.0 1.25coarse gravel
'B'1.0 2.875
2.25
1.0 1.375
n/a n/a 1.0 1.50.25 n/a n/a 1.25Gravely
Cobbles1.0
2.25
n/a
Additional Habitat Layer
3.5
Habitat/Erosion Protection Layer
1.25
1.0
1.25
1.0 1.25
n/a
1.5 n/a
n/a n/a
2.75
1.375 n/a
Total Isolation Cap
1.0
0.25
1.0 1.25
n/a 1.251.0
0.25 1.0n/a 1.25
2.25
1.0
n/a 1.0 1.25fine gravel 1.0 1.25 n/a n/a
n/a
Chemical Isolation Layer(1)(2)(3)
n/a n/a
0.25 n/a n/a 1.0 1.25 1.0
Total Habitat Layer(4)
coarse gravel
P:\Honeywell -SYR\446232 - Cap Design\09 Reports\9.3 Final Design Report\Final to DEC\Tables\Table 4.2 cap module thickness summary w SMU8 tlc.xls
March 5, 2012
Parsons
4 of 5
HoneywellTable 4.2
Summary of Cap Thicknesses (feet)
ONONDAGA LAKE CAPPING, DREDGING,
HABITAT AND PROFUNDAL ZONE (SMU 8)
FINAL DESIGN
Habitat Module
Mixing
Layer(5)
(ft)
pH Amended
Minimum
(ft)
Assumed
Mean With
Over
Placement
(ft)
Non-pH
Amended
Minimum
(ft)
Assumed
Mean With
Over
Placement
(ft)
Minimum
(ft)
Assumed
Mean With
Over
Placement
(ft)
Grainsize
Minimum
(ft)
Assumed
Mean With
Over
Placement
(ft)
Grainsize
Minimum
(ft)
Assumed
Mean With
Over
Placement
(ft)
Minimum
(ft)
Assumed
Mean With
Over
Placement
(ft)
Minimum
(ft)
Assumed
Mean With
Over
Placement
(ft)
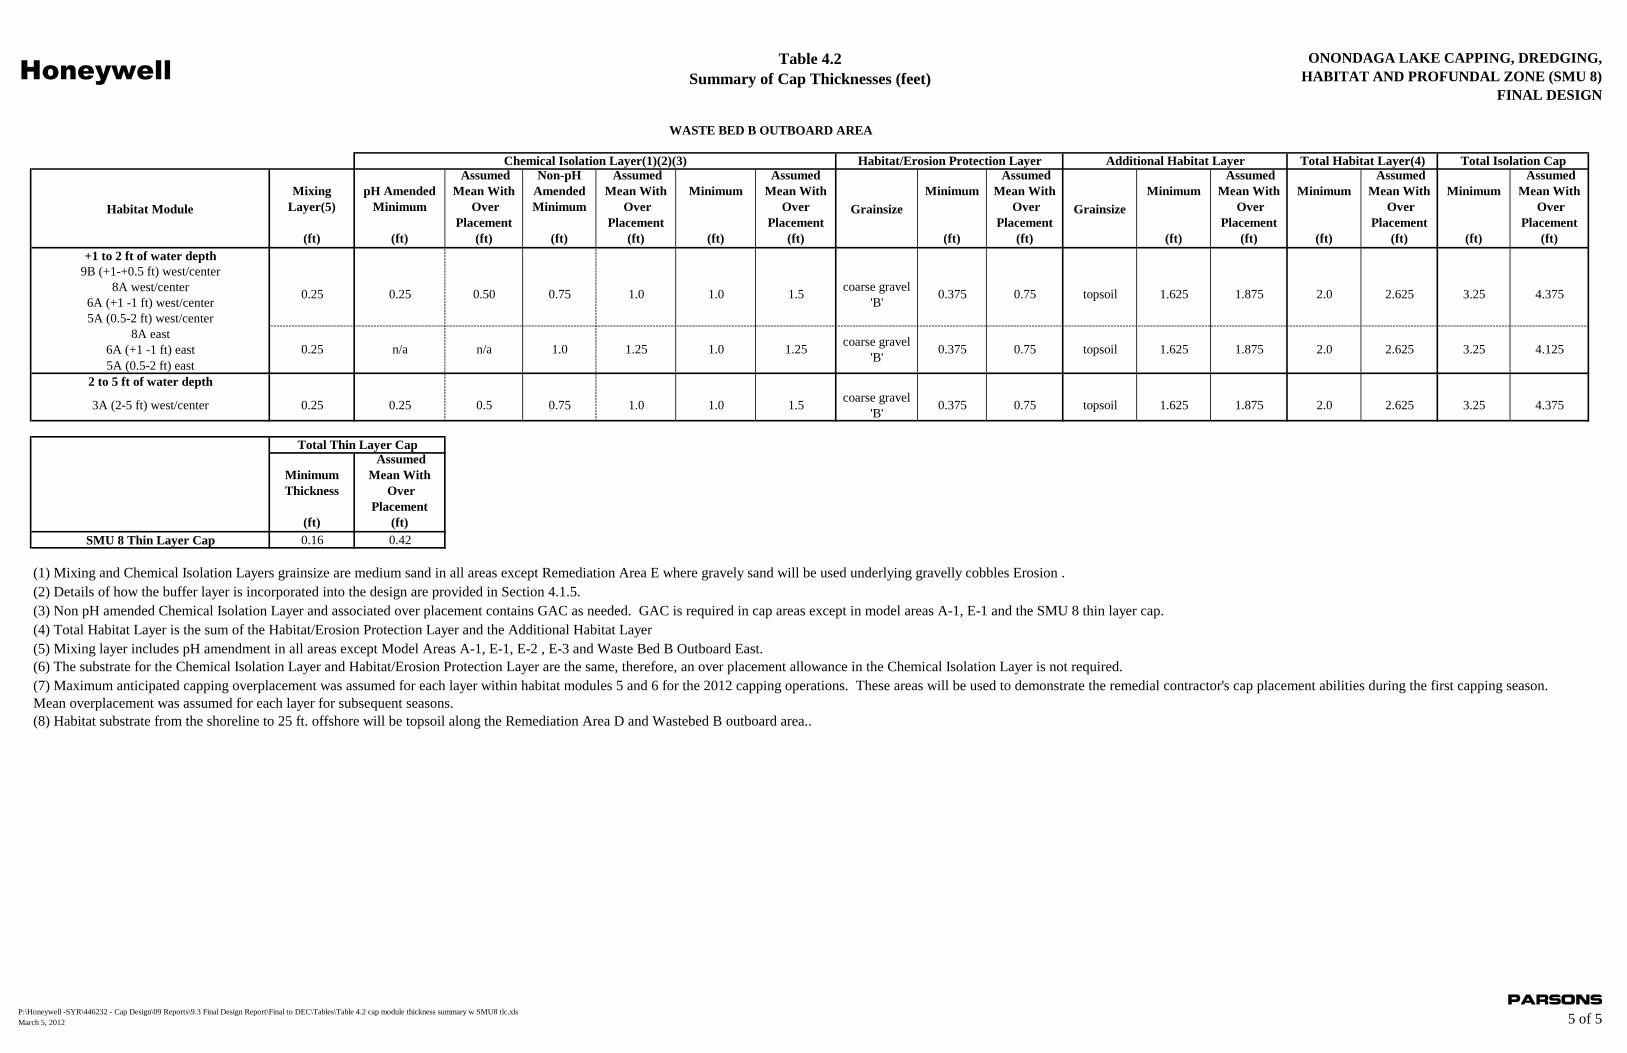
+1 to 2 ft of water depth
9B (+1-+0.5 ft) west/center
8A west/center
6A (+1 -1 ft) west/center
5A (0.5-2 ft) west/center
8A east
6A (+1 -1 ft) east
5A (0.5-2 ft) east
2 to 5 ft of water depth
3A (2-5 ft) west/center 0.25 0.25 0.5 0.75 1.0 1.0 1.5coarse gravel
'B'0.375 0.75 topsoil 1.625 1.875 2.0 2.625 3.25 4.375
Minimum
Thickness
(ft)
Assumed
Mean With
Over
Placement
(ft)
SMU 8 Thin Layer Cap 0.16 0.42
(1) Mixing and Chemical Isolation Layers grainsize are medium sand in all areas except Remediation Area E where gravely sand will be used underlying gravelly cobbles Erosion .
(2) Details of how the buffer layer is incorporated into the design are provided in Section 4.1.5.
(3) Non pH amended Chemical Isolation Layer and associated over placement contains GAC as needed. GAC is required in cap areas except in model areas A-1, E-1 and the SMU 8 thin layer cap.
(4) Total Habitat Layer is the sum of the Habitat/Erosion Protection Layer and the Additional Habitat Layer
(5) Mixing layer includes pH amendment in all areas except Model Areas A-1, E-1, E-2 , E-3 and Waste Bed B Outboard East.
(6) The substrate for the Chemical Isolation Layer and Habitat/Erosion Protection Layer are the same, therefore, an over placement allowance in the Chemical Isolation Layer is not required.
(8) Habitat substrate from the shoreline to 25 ft. offshore will be topsoil along the Remediation Area D and Wastebed B outboard area..
(7) Maximum anticipated capping overplacement was assumed for each layer within habitat modules 5 and 6 for the 2012 capping operations. These areas will be used to demonstrate the remedial contractor's cap placement abilities during the first capping season.
Mean overplacement was assumed for each layer for subsequent seasons.
coarse gravel
'B'0.375 0.75 1.625 1.875topsoil1.0 1.250.25 n/a n/a 1.0 1.25
Additional Habitat Layer Total Habitat Layer(4) Total Isolation Cap
WASTE BED B OUTBOARD AREA
1.6250.25 0.25 0.50 0.75 1.0 1.51.0
Chemical Isolation Layer(1)(2)(3) Habitat/Erosion Protection Layer
Total Thin Layer Cap
2.0 2.625 3.25
coarse gravel
'B'0.375 0.75 topsoil
4.125
1.875 2.0 2.625 3.25 4.375
P:\Honeywell -SYR\446232 - Cap Design\09 Reports\9.3 Final Design Report\Final to DEC\Tables\Table 4.2 cap module thickness summary w SMU8 tlc.xls
March 5, 2012
Parsons
5 of 5

HoneywellONONDAGA LAKE CAPPING, DREDGING,
HABITAT AND PROFUNDAL ZONE (SMU 8)
FINAL DESIGN
Particle Size
Minimum
Thickness
(inches) Particle Size
Minimum
Thickness
(inches) Particle Size
Minimum
Thickness
(inches) Particle Size
Minimum
Thickness
(inches) Particle Size
Minimum
Thickness
(inches)
20’ to 30’ Fine sand 3 Fine sand 3 Fine sand 3 Medium sand 3 n/a n/a
15’ to 20’ Fine sand 3 Fine sand 3 Medium sand 3 Fine gravel 3 n/a n/a
10’ to 15’ Fine sand 3 Medium sand 3 Medium sand 3 Fine gravel 3 n/a n/a
8’ to 10’ Medium sand 3 Coarse sand 3 Fine gravel 3 Coarse gravel 3 n/a n/a
6’ to 8’ Coarse sand 3 Fine gravel 3 Fine gravel 3 Coarse gravel 3 n/a n/a
Surf zone to 6’ Fine gravel 3 Fine gravel 3 Fine gravel 3 Cobbles 6 n/a n/a
Within surf zone Coarse gravel 3 Coarse gravel 3.5 Coarse gravel 4 Cobbles 6 coarse gravel 4.5
Notes:
1. The breaking wave depth is approximately 3.5 ft in Areas A and B, 4 ft in Areas C and D, and 7 ft in Area E.
Table 4.3
Summary of Wind/Wave Erosion Protection Particle Grain Size
2. The erosion protection layer thickness will be the greater of either 1.5 times the largest particle diameter, or 2 times the median particle diameter. For practical application
considerations for construction and integration with the habitat layer, the minimum erosion protection layer thickness for lake habitat modules will be 12 inches (1.0 ft). In adjacent
wetland habitat modules, the minimum erosion protection layer will be set at 4.5 inches (0.375 ft).
Remediation Area A
Ninemile Creek Spits
Remediation Area B
and Waste Beds 1-8
Connected Wetlands
Remediation Area C And
Remediation Area D Remediation Area E
Waste Bed B
Outboard
Water Depth (ft)
P:\Honeywell -SYR\446232 - Cap Design\09 Reports\9.3 Final Design Report\Final to DEC\Tables\Table 4.3 wind-wave erosion particle size.xlsx
March 5, 2012]
Parsons
1 of 1
HoneywellONONDAGA LAKE CAPPING, DREDGING,
HABITAT AND PROFUNDAL ZONE (SMU 8)
FINAL DESIGN
Cap Area
(acre)
Topsoil
(CY)
Medium
Sand
(CY)
Medium
Sand with
GAC
(CY)
Medium
Sand with
Siderite
(CY)
Fine
Gravel
(CY)
Coarse
Gravel
(CY)
Graded
Gravel
(CY)
Gravely
Cobble
(CY)
Total by
Remediation
Area
(CY)
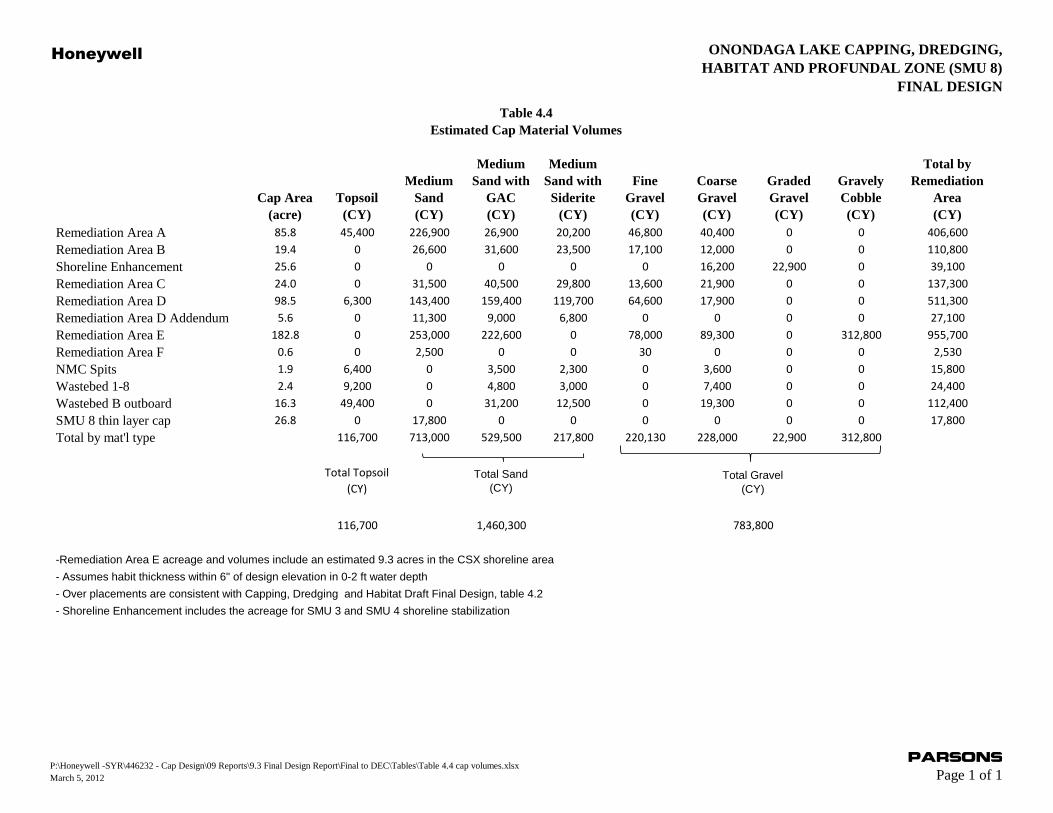
Remediation Area A 85.8 45,400 226,900 26,900 20,200 46,800 40,400 0 0 406,600
Remediation Area B 19.4 0 26,600 31,600 23,500 17,100 12,000 0 0 110,800
Shoreline Enhancement 25.6 0 0 0 0 0 16,200 22,900 0 39,100
Remediation Area C 24.0 0 31,500 40,500 29,800 13,600 21,900 0 0 137,300
Remediation Area D 98.5 6,300 143,400 159,400 119,700 64,600 17,900 0 0 511,300
Remediation Area D Addendum 5.6 0 11,300 9,000 6,800 0 0 0 0 27,100
Remediation Area E 182.8 0 253,000 222,600 0 78,000 89,300 0 312,800 955,700
Remediation Area F 0.6 0 2,500 0 0 30 0 0 0 2,530
NMC Spits 1.9 6,400 0 3,500 2,300 0 3,600 0 0 15,800
Wastebed 1-8 2.4 9,200 0 4,800 3,000 0 7,400 0 0 24,400
Wastebed B outboard 16.3 49,400 0 31,200 12,500 0 19,300 0 0 112,400
SMU 8 thin layer cap 26.8 0 17,800 0 0 0 0 0 0 17,800
Total by mat'l type 116,700 713,000 529,500 217,800 220,130 228,000 22,900 312,800
Total Topsoil
(CY)Total Sand
(CY)
116,700 1,460,300
-Remediation Area E acreage and volumes include an estimated 9.3 acres in the CSX shoreline area
- Assumes habit thickness within 6" of design elevation in 0-2 ft water depth
- Over placements are consistent with Capping, Dredging and Habitat Draft Final Design, table 4.2
- Shoreline Enhancement includes the acreage for SMU 3 and SMU 4 shoreline stabilization
Table 4.4
Estimated Cap Material Volumes
Total Gravel
(CY)
783,800
P:\Honeywell -SYR\446232 - Cap Design\09 Reports\9.3 Final Design Report\Final to DEC\Tables\Table 4.4 cap volumes.xlsx
March 5, 2012
Parsons
Page 1 of 1
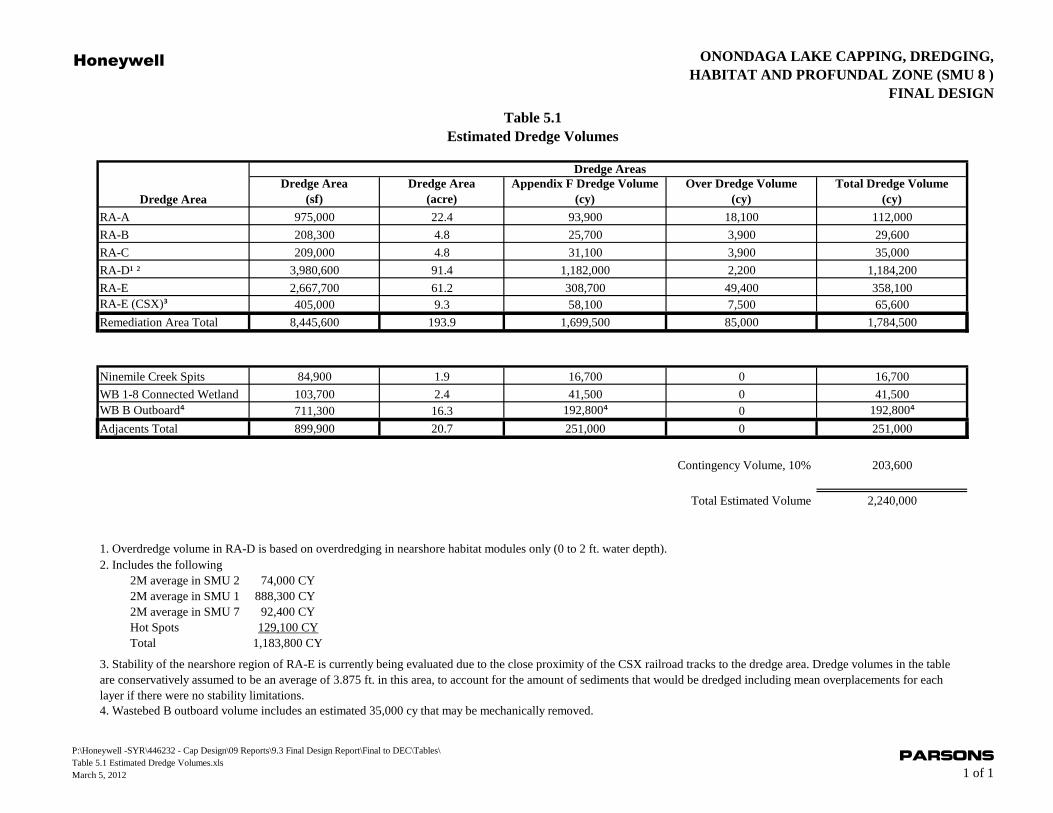
HoneywellONONDAGA LAKE CAPPING, DREDGING,
HABITAT AND PROFUNDAL ZONE (SMU 8 )
FINAL DESIGN
Dredge Area
(sf)
Dredge Area
(acre)
Appendix F Dredge Volume
(cy)
Over Dredge Volume
(cy)
Total Dredge Volume
(cy)
RA-A 975,000 22.4 93,900 18,100 112,000
RA-B 208,300 4.8 25,700 3,900 29,600
RA-C 209,000 4.8 31,100 3,900 35,000
RA-D¹ ² 3,980,600 91.4 1,182,000 2,200 1,184,200
RA-E 2,667,700 61.2 308,700 49,400 358,100
RA-E (CSX)³ 405,000 9.3 58,100 7,500 65,600
Remediation Area Total 8,445,600 193.9 1,699,500 85,000 1,784,500
Ninemile Creek Spits 84,900 1.9 16,700 0 16,700
WB 1-8 Connected Wetland 103,700 2.4 41,500 0 41,500
WB B Outboard⁴ 711,300 16.3 192,800⁴ 0 192,800⁴
Adjacents Total 899,900 20.7 251,000 0 251,000
Contingency Volume, 10% 203,600
Total Estimated Volume 2,240,000
4. Wastebed B outboard volume includes an estimated 35,000 cy that may be mechanically removed.
Table 5.1
Estimated Dredge Volumes
3. Stability of the nearshore region of RA-E is currently being evaluated due to the close proximity of the CSX railroad tracks to the dredge area. Dredge volumes in the table
are conservatively assumed to be an average of 3.875 ft. in this area, to account for the amount of sediments that would be dredged including mean overplacements for each
layer if there were no stability limitations.
Dredge Area
Dredge Areas
1. Overdredge volume in RA-D is based on overdredging in nearshore habitat modules only (0 to 2 ft. water depth).
2. Includes the following
2M average in SMU 2 74,000 CY
2M average in SMU 1 888,300 CY
2M average in SMU 7 92,400 CY
Hot Spots 129,100 CY
Total 1,183,800 CY
P:\Honeywell -SYR\446232 - Cap Design\09 Reports\9.3 Final Design Report\Final to DEC\Tables\
Table 5.1 Estimated Dredge Volumes.xls
March 5, 2012
Parsons
1 of 1
Honeywell ONONDAGA LAKE CAPPING, DREDGING,
HABITAT AND PROFUNDAL ZONE (SMU 8)
FINAL DESIGN
Project
Phase Year
Number of
Surface
Sediment
Locations
Sampling to Assess
Sedimentation Ratea
Track MNRb
Evaluate
Contingency
Actionsc
Monitoring
or Modeling
Thin-Layer
Capping or
Other
Construction Implementation Notes
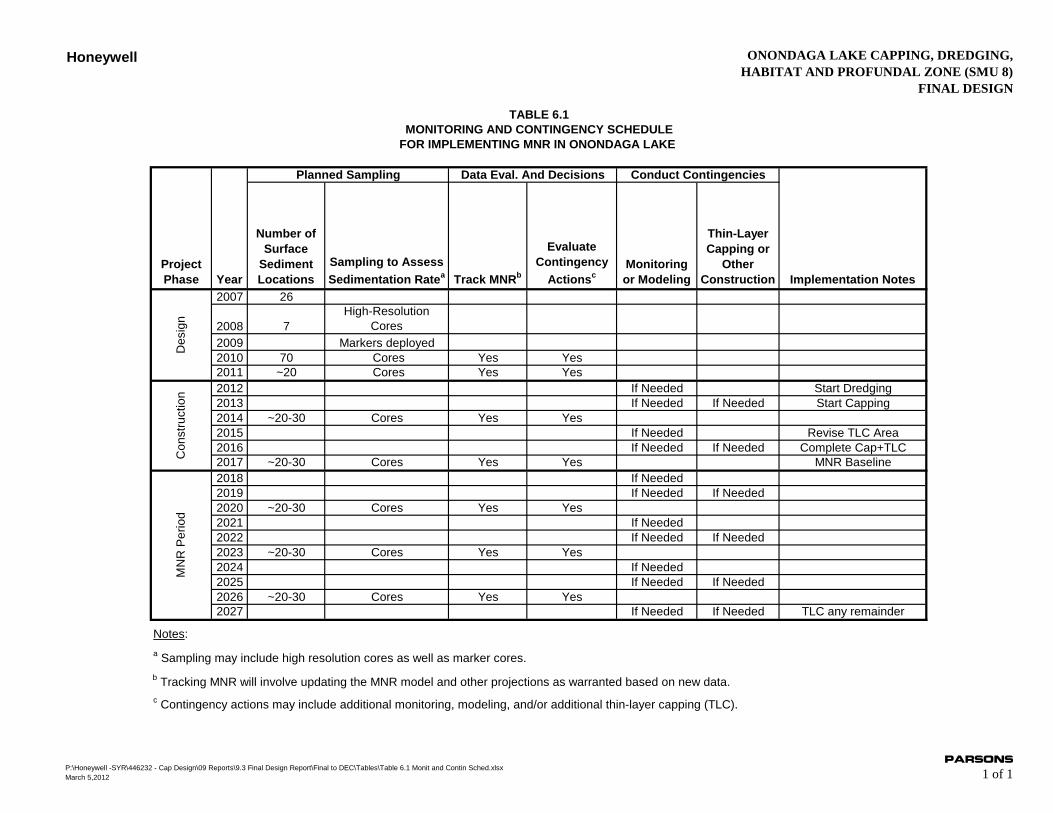
2007 26
2008 7
High-Resolution
Cores
2009 Markers deployed
2010 70 Cores Yes Yes
2011 ~20 Cores Yes Yes
2012 If Needed Start Dredging
2013 If Needed If Needed Start Capping
2014 ~20-30 Cores Yes Yes
2015 If Needed Revise TLC Area
2016 If Needed If Needed Complete Cap+TLC
2017 ~20-30 Cores Yes Yes MNR Baseline
2018 If Needed
2019 If Needed If Needed
2020 ~20-30 Cores Yes Yes
2021 If Needed
2022 If Needed If Needed
2023 ~20-30 Cores Yes Yes
2024 If Needed
2025 If Needed If Needed
2026 ~20-30 Cores Yes Yes
2027 If Needed If Needed TLC any remainder
Notes:
c Contingency actions may include additional monitoring, modeling, and/or additional thin-layer capping (TLC).
Data Eval. And Decisions Conduct ContingenciesM
NR
Pe
rio
dD
esig
nC
on
str
uctio
nPlanned Sampling
TABLE 6.1
MONITORING AND CONTINGENCY SCHEDULE
FOR IMPLEMENTING MNR IN ONONDAGA LAKE
a Sampling may include high resolution cores as well as marker cores.
b Tracking MNR will involve updating the MNR model and other projections as warranted based on new data.
P:\Honeywell -SYR\446232 - Cap Design\09 Reports\9.3 Final Design Report\Final to DEC\Tables\Table 6.1 Monit and Contin Sched.xlsx
March 5,2012
Parsons
1 of 1

Honeywell ONONDAGA LAKE CAPPING, DREDGING,
HABITAT AND PROFUNDAL ZONE (SMU 8)
FINAL DESIGN
Portion of Profundal
Zone
Number of
Locations
Modeled
Final Predicted Area-
Weighted Average
Mercury Sediment
Concentration in
Profundal Zone
(mg/kg)
Area-Weighted Average Mercury
Sediment Concentration
Throughout Onondaga Lake
(littoral and profundal zones)
(mg/kg)
North Basin 14 0.48 to 0.51 0.61
Ninemile Creek Outlet 11 0.51 to 0.53 0.38
Saddle 3 0.51 to 0.52 0.49
South Basin 20 0.51 to 0.53 0.49
South Corner 48 0.54 to 0.58 0.34
SUMMARY OF FINAL PREDICTED MERCURY SEDIMENT CONCENTRATIONS FOR
ONONDAGA LAKE SEDIMENT (YEAR 2027)
TABLE 6.2
Note: Results presented in this table are developed in detail in Appendix N.
P:\Honeywell -SYR\446232 - Cap Design\09 Reports\9.3 Final Design Report\Final to DEC\Tables\Table 6.2_mnr Model_Results.xlsx
March 5, 2012
Parsons
1 of 1
Honeywell ONONDAGA LAKE CAPPING, DREDGING, HABITAT AND PROFUNDAL ZONE (SMU 8)
FINAL DESIGN
PARSONS
P:\Hon-Syr\446232\09-Reports\Final\Working Draft\Tables\Table 6.4 March 5, 2012 1 of 1
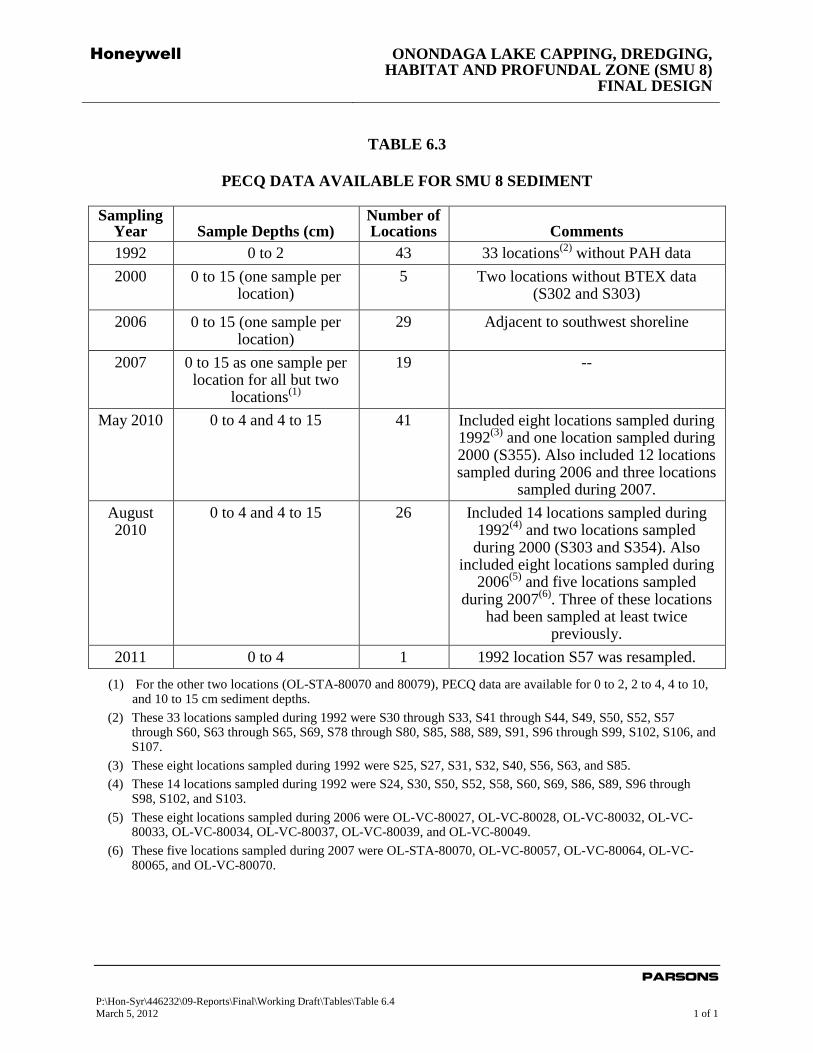
TABLE 6.3
PECQ DATA AVAILABLE FOR SMU 8 SEDIMENT
Sampling Year Sample Depths (cm)
Number of Locations Comments
1992 0 to 2 43 33 locations(2)
without PAH data
2000 0 to 15 (one sample per location)
5 Two locations without BTEX data (S302 and S303)
2006 0 to 15 (one sample per location)
29 Adjacent to southwest shoreline
2007 0 to 15 as one sample per location for all but two
locations(1)
19 --
May 2010 0 to 4 and 4 to 15 41 Included eight locations sampled during 1992
(3) and one location sampled during
2000 (S355). Also included 12 locations sampled during 2006 and three locations
sampled during 2007.
August 2010
0 to 4 and 4 to 15 26 Included 14 locations sampled during 1992
(4) and two locations sampled
during 2000 (S303 and S354). Also included eight locations sampled during
2006(5)
and five locations sampled during 2007
(6). Three of these locations
had been sampled at least twice previously.
2011 0 to 4 1 1992 location S57 was resampled.
(1) For the other two locations (OL-STA-80070 and 80079), PECQ data are available for 0 to 2, 2 to 4, 4 to 10, and 10 to 15 cm sediment depths.
(2) These 33 locations sampled during 1992 were S30 through S33, S41 through S44, S49, S50, S52, S57 through S60, S63 through S65, S69, S78 through S80, S85, S88, S89, S91, S96 through S99, S102, S106, and S107.
(3) These eight locations sampled during 1992 were S25, S27, S31, S32, S40, S56, S63, and S85.
(4) These 14 locations sampled during 1992 were S24, S30, S50, S52, S58, S60, S69, S86, S89, S96 through S98, S102, and S103.
(5) These eight locations sampled during 2006 were OL-VC-80027, OL-VC-80028, OL-VC-80032, OL-VC-80033, OL-VC-80034, OL-VC-80037, OL-VC-80039, and OL-VC-80049.
(6) These five locations sampled during 2007 were OL-STA-80070, OL-VC-80057, OL-VC-80064, OL-VC-80065, and OL-VC-80070.
Honeywell ONONDAGA LAKE CAPPING, DREDGING, HABITAT AND PROFUNDAL ZONE (SMU 8)
FINAL DESIGN
PARSONS
P:\Honeywell -SYR\446232 - Cap Design\09 Reports\9.3 Final Design Report\Final to DEC\Tables\Table 6.4 PECQ data.docx
March 5, 2012
1 of 3
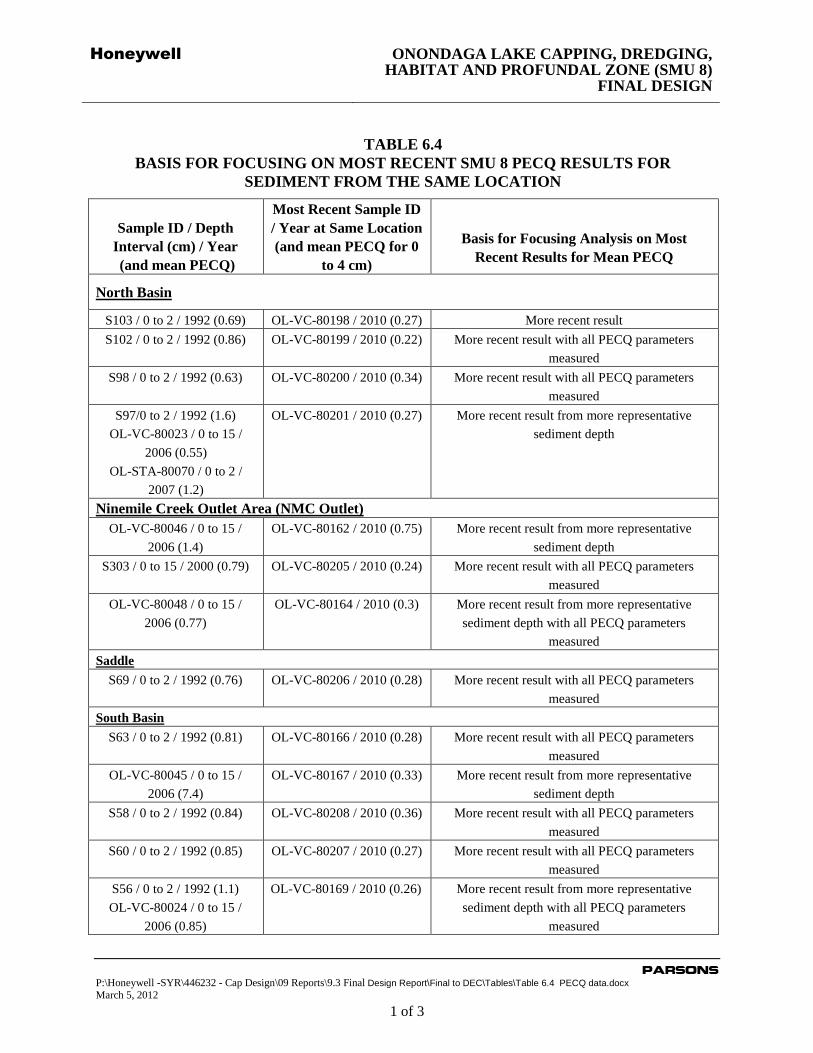
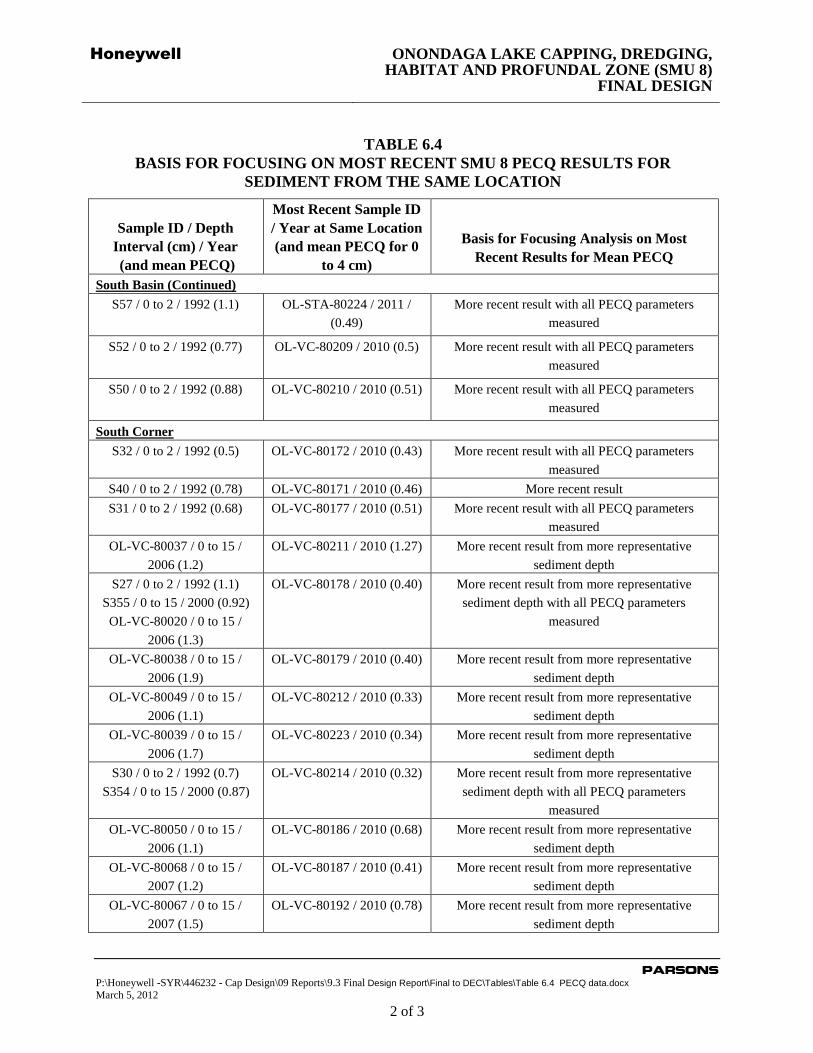
TABLE 6.4
BASIS FOR FOCUSING ON MOST RECENT SMU 8 PECQ RESULTS FOR
SEDIMENT FROM THE SAME LOCATION
Sample ID / Depth
Interval (cm) / Year
(and mean PECQ)
Most Recent Sample ID
/ Year at Same Location
(and mean PECQ for 0
to 4 cm)
Basis for Focusing Analysis on Most
Recent Results for Mean PECQ
North Basin
S103 / 0 to 2 / 1992 (0.69) OL-VC-80198 / 2010 (0.27) More recent result
S102 / 0 to 2 / 1992 (0.86) OL-VC-80199 / 2010 (0.22) More recent result with all PECQ parameters
measured
S98 / 0 to 2 / 1992 (0.63) OL-VC-80200 / 2010 (0.34) More recent result with all PECQ parameters
measured
S97/0 to 2 / 1992 (1.6)
OL-VC-80023 / 0 to 15 /
2006 (0.55)
OL-STA-80070 / 0 to 2 /
2007 (1.2)
OL-VC-80201 / 2010 (0.27) More recent result from more representative
sediment depth
Ninemile Creek Outlet Area (NMC Outlet)
OL-VC-80046 / 0 to 15 /
2006 (1.4)
OL-VC-80162 / 2010 (0.75) More recent result from more representative
sediment depth
S303 / 0 to 15 / 2000 (0.79) OL-VC-80205 / 2010 (0.24) More recent result with all PECQ parameters
measured
OL-VC-80048 / 0 to 15 /
2006 (0.77)
OL-VC-80164 / 2010 (0.3) More recent result from more representative
sediment depth with all PECQ parameters
measured
Saddle
S69 / 0 to 2 / 1992 (0.76) OL-VC-80206 / 2010 (0.28) More recent result with all PECQ parameters
measured
South Basin
S63 / 0 to 2 / 1992 (0.81) OL-VC-80166 / 2010 (0.28) More recent result with all PECQ parameters
measured
OL-VC-80045 / 0 to 15 /
2006 (7.4)
OL-VC-80167 / 2010 (0.33) More recent result from more representative
sediment depth
S58 / 0 to 2 / 1992 (0.84) OL-VC-80208 / 2010 (0.36) More recent result with all PECQ parameters
measured
S60 / 0 to 2 / 1992 (0.85) OL-VC-80207 / 2010 (0.27) More recent result with all PECQ parameters
measured
S56 / 0 to 2 / 1992 (1.1)
OL-VC-80024 / 0 to 15 /
2006 (0.85)
OL-VC-80169 / 2010 (0.26) More recent result from more representative
sediment depth with all PECQ parameters
measured
Honeywell ONONDAGA LAKE CAPPING, DREDGING, HABITAT AND PROFUNDAL ZONE (SMU 8)
FINAL DESIGN
PARSONS
P:\Honeywell -SYR\446232 - Cap Design\09 Reports\9.3 Final Design Report\Final to DEC\Tables\Table 6.4 PECQ data.docx
March 5, 2012
2 of 3
TABLE 6.4
BASIS FOR FOCUSING ON MOST RECENT SMU 8 PECQ RESULTS FOR
SEDIMENT FROM THE SAME LOCATION
Sample ID / Depth
Interval (cm) / Year
(and mean PECQ)
Most Recent Sample ID
/ Year at Same Location
(and mean PECQ for 0
to 4 cm)
Basis for Focusing Analysis on Most
Recent Results for Mean PECQ
South Basin (Continued)
S57 / 0 to 2 / 1992 (1.1) OL-STA-80224 / 2011 /
(0.49)
More recent result with all PECQ parameters
measured
S52 / 0 to 2 / 1992 (0.77)
OL-VC-80209 / 2010 (0.5) More recent result with all PECQ parameters
measured
S50 / 0 to 2 / 1992 (0.88) OL-VC-80210 / 2010 (0.51) More recent result with all PECQ parameters
measured
South Corner
S32 / 0 to 2 / 1992 (0.5)
OL-VC-80172 / 2010 (0.43) More recent result with all PECQ parameters
measured
S40 / 0 to 2 / 1992 (0.78) OL-VC-80171 / 2010 (0.46) More recent result
S31 / 0 to 2 / 1992 (0.68)
OL-VC-80177 / 2010 (0.51) More recent result with all PECQ parameters
measured
OL-VC-80037 / 0 to 15 /
2006 (1.2)
OL-VC-80211 / 2010 (1.27) More recent result from more representative
sediment depth
S27 / 0 to 2 / 1992 (1.1)
S355 / 0 to 15 / 2000 (0.92)
OL-VC-80020 / 0 to 15 /
2006 (1.3)
OL-VC-80178 / 2010 (0.40) More recent result from more representative
sediment depth with all PECQ parameters
measured
OL-VC-80038 / 0 to 15 /
2006 (1.9)
OL-VC-80179 / 2010 (0.40) More recent result from more representative
sediment depth
OL-VC-80049 / 0 to 15 /
2006 (1.1)
OL-VC-80212 / 2010 (0.33) More recent result from more representative
sediment depth
OL-VC-80039 / 0 to 15 /
2006 (1.7)
OL-VC-80223 / 2010 (0.34) More recent result from more representative
sediment depth
S30 / 0 to 2 / 1992 (0.7)
S354 / 0 to 15 / 2000 (0.87)
OL-VC-80214 / 2010 (0.32) More recent result from more representative
sediment depth with all PECQ parameters
measured
OL-VC-80050 / 0 to 15 /
2006 (1.1)
OL-VC-80186 / 2010 (0.68) More recent result from more representative
sediment depth
OL-VC-80068 / 0 to 15 /
2007 (1.2)
OL-VC-80187 / 2010 (0.41) More recent result from more representative
sediment depth
OL-VC-80067 / 0 to 15 /
2007 (1.5)
OL-VC-80192 / 2010 (0.78) More recent result from more representative
sediment depth
Honeywell ONONDAGA LAKE CAPPING, DREDGING, HABITAT AND PROFUNDAL ZONE (SMU 8)
FINAL DESIGN
PARSONS
P:\Honeywell -SYR\446232 - Cap Design\09 Reports\9.3 Final Design Report\Final to DEC\Tables\Table 6.4 PECQ data.docx
March 5, 2012
3 of 3
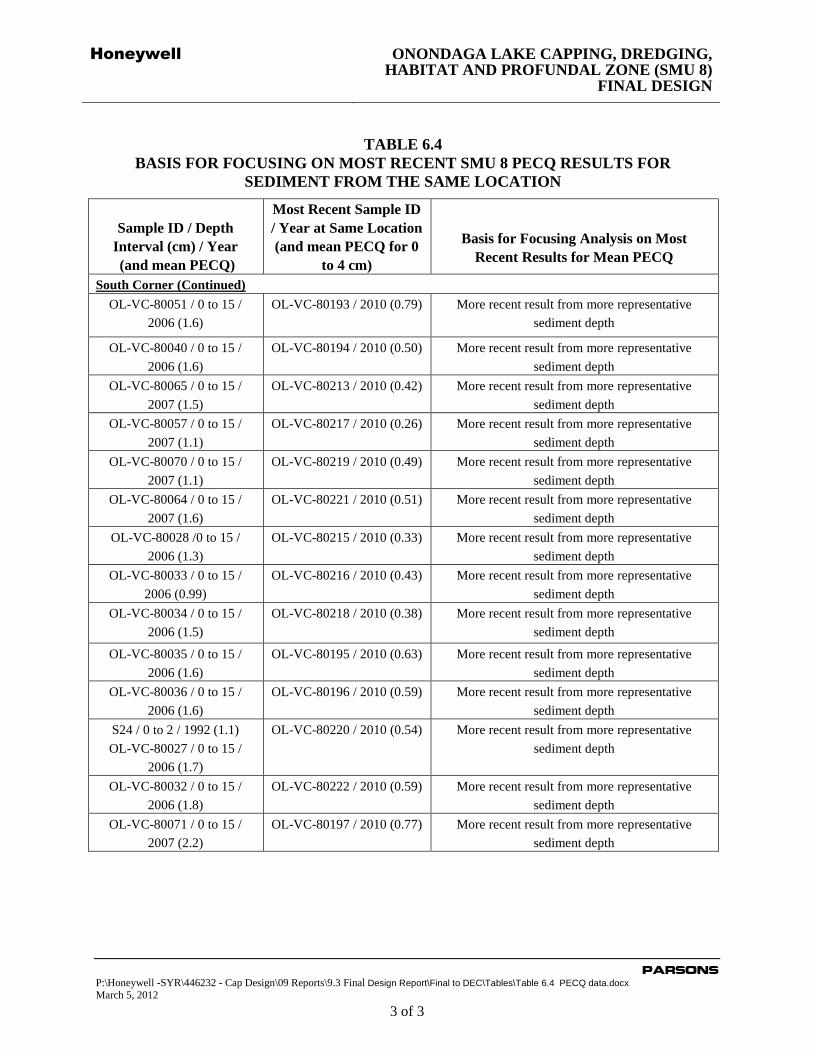
TABLE 6.4
BASIS FOR FOCUSING ON MOST RECENT SMU 8 PECQ RESULTS FOR
SEDIMENT FROM THE SAME LOCATION
Sample ID / Depth
Interval (cm) / Year
(and mean PECQ)
Most Recent Sample ID
/ Year at Same Location
(and mean PECQ for 0
to 4 cm)
Basis for Focusing Analysis on Most
Recent Results for Mean PECQ
South Corner (Continued)
OL-VC-80051 / 0 to 15 /
2006 (1.6)
OL-VC-80193 / 2010 (0.79) More recent result from more representative
sediment depth
OL-VC-80040 / 0 to 15 /
2006 (1.6)
OL-VC-80194 / 2010 (0.50) More recent result from more representative
sediment depth
OL-VC-80065 / 0 to 15 /
2007 (1.5)
OL-VC-80213 / 2010 (0.42) More recent result from more representative
sediment depth
OL-VC-80057 / 0 to 15 /
2007 (1.1)
OL-VC-80217 / 2010 (0.26) More recent result from more representative
sediment depth
OL-VC-80070 / 0 to 15 /
2007 (1.1)
OL-VC-80219 / 2010 (0.49) More recent result from more representative
sediment depth
OL-VC-80064 / 0 to 15 /
2007 (1.6)
OL-VC-80221 / 2010 (0.51) More recent result from more representative
sediment depth
OL-VC-80028 /0 to 15 /
2006 (1.3)
OL-VC-80215 / 2010 (0.33) More recent result from more representative
sediment depth
OL-VC-80033 / 0 to 15 /
2006 (0.99)
OL-VC-80216 / 2010 (0.43) More recent result from more representative
sediment depth
OL-VC-80034 / 0 to 15 /
2006 (1.5)
OL-VC-80218 / 2010 (0.38) More recent result from more representative
sediment depth
OL-VC-80035 / 0 to 15 /
2006 (1.6)
OL-VC-80195 / 2010 (0.63) More recent result from more representative
sediment depth
OL-VC-80036 / 0 to 15 /
2006 (1.6)
OL-VC-80196 / 2010 (0.59) More recent result from more representative
sediment depth
S24 / 0 to 2 / 1992 (1.1)
OL-VC-80027 / 0 to 15 /
2006 (1.7)
OL-VC-80220 / 2010 (0.54) More recent result from more representative
sediment depth
OL-VC-80032 / 0 to 15 /
2006 (1.8)
OL-VC-80222 / 2010 (0.59) More recent result from more representative
sediment depth
OL-VC-80071 / 0 to 15 /
2007 (2.2)
OL-VC-80197 / 2010 (0.77) More recent result from more representative
sediment depth
Honeywell ONONDAGA LAKE CAPPING, DREDGING,
HABITAT AND PROFUNDAL ZONE (SMU 8)
FINAL DESIGN
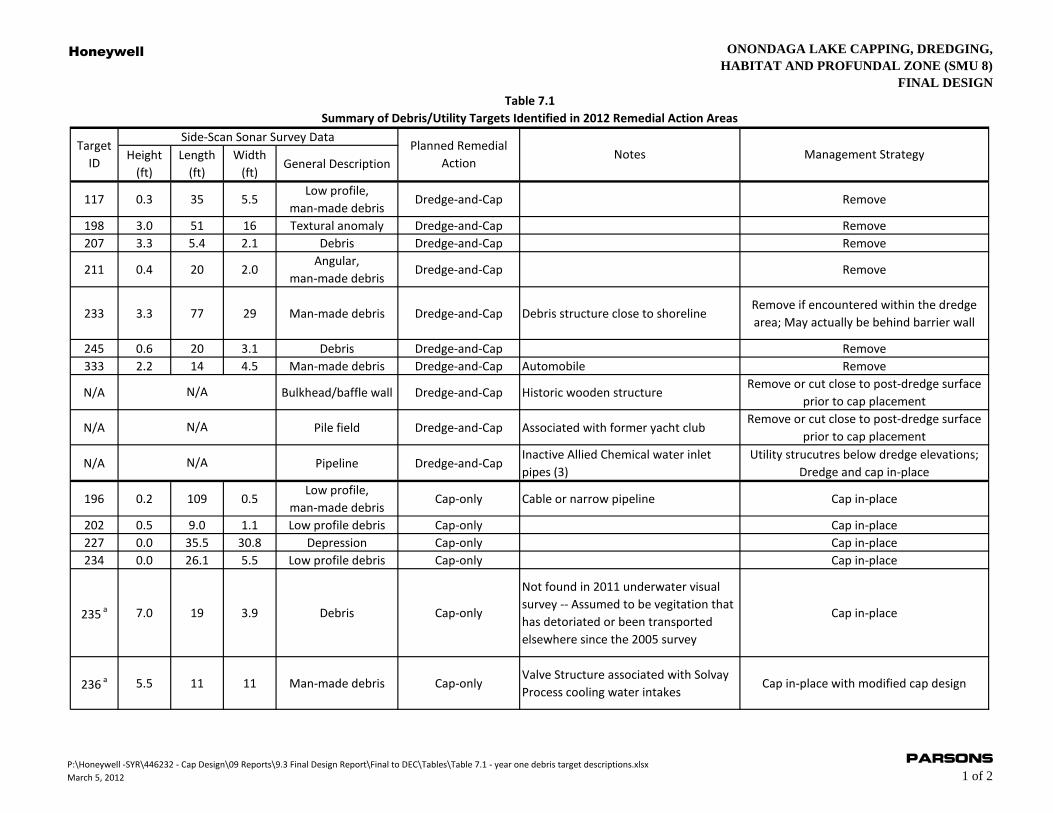
Table 7.1
Summary of Debris/Utility Targets Identified in 2012 Remedial Action Areas
Height
(ft)
Length
(ft)
Width
(ft)General Description
117 0.3 35 5.5Low profile,
man-made debrisDredge-and-Cap Remove
198 3.0 51 16 Textural anomaly Dredge-and-Cap Remove
207 3.3 5.4 2.1 Debris Dredge-and-Cap Remove
211 0.4 20 2.0Angular,
man-made debrisDredge-and-Cap Remove
233 3.3 77 29 Man-made debris Dredge-and-Cap Debris structure close to shorelineRemove if encountered within the dredge
area; May actually be behind barrier wall
245 0.6 20 3.1 Debris Dredge-and-Cap Remove
333 2.2 14 4.5 Man-made debris Dredge-and-Cap Automobile Remove
N/A Bulkhead/baffle wall Dredge-and-Cap Historic wooden structureRemove or cut close to post-dredge surface
prior to cap placement
N/A Pile field Dredge-and-Cap Associated with former yacht clubRemove or cut close to post-dredge surface
prior to cap placement
N/A Pipeline Dredge-and-CapInactive Allied Chemical water inlet
pipes (3)
Utility strucutres below dredge elevations;
Dredge and cap in-place
196 0.2 109 0.5Low profile,
man-made debrisCap-only Cable or narrow pipeline Cap in-place
202 0.5 9.0 1.1 Low profile debris Cap-only Cap in-place
227 0.0 35.5 30.8 Depression Cap-only Cap in-place
234 0.0 26.1 5.5 Low profile debris Cap-only Cap in-place
235 a 7.0 19 3.9 Debris Cap-only
Not found in 2011 underwater visual
survey -- Assumed to be vegitation that
has detoriated or been transported
elsewhere since the 2005 survey
Cap in-place
236 a 5.5 11 11 Man-made debris Cap-onlyValve Structure associated with Solvay
Process cooling water intakesCap in-place with modified cap design
Target
ID
Planned Remedial
ActionManagement StrategyNotes
Side-Scan Sonar Survey Data
N/A
N/A
N/A
P:\Honeywell -SYR\446232 - Cap Design\09 Reports\9.3 Final Design Report\Final to DEC\Tables\Table 7.1 - year one debris target descriptions.xlsx
March 5, 2012
Parsons
1 of 2
Honeywell ONONDAGA LAKE CAPPING, DREDGING,
HABITAT AND PROFUNDAL ZONE (SMU 8)
FINAL DESIGN
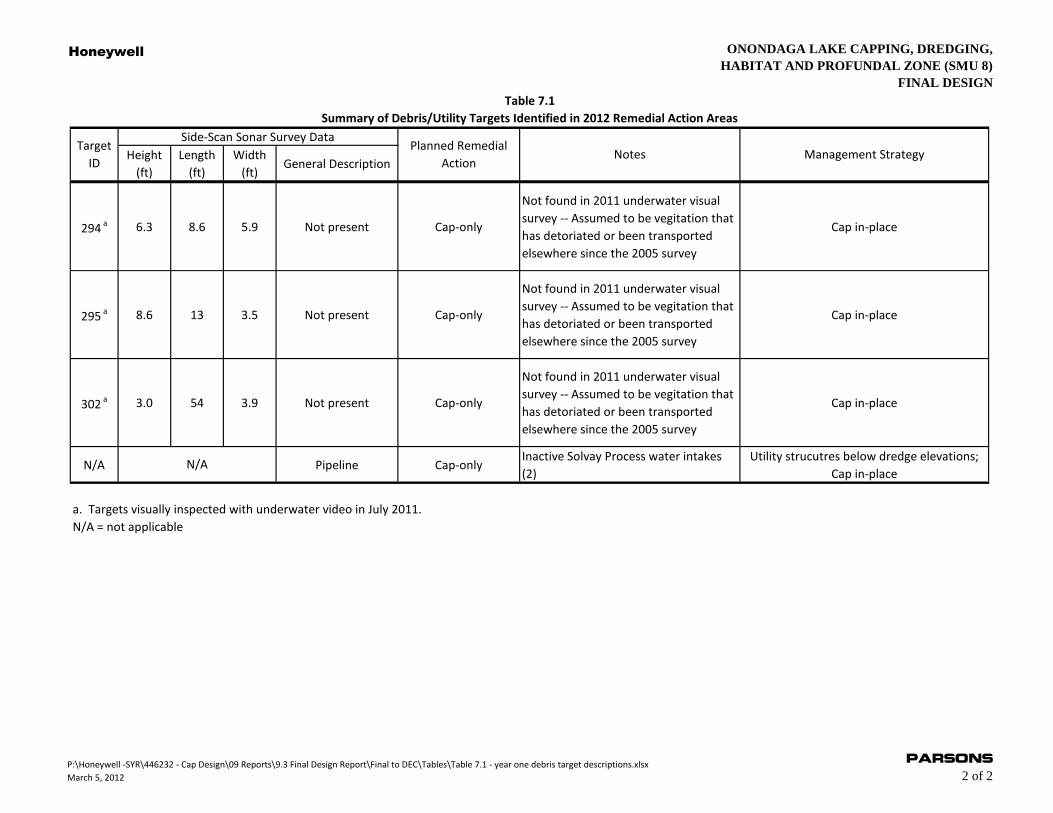
Table 7.1
Summary of Debris/Utility Targets Identified in 2012 Remedial Action Areas
Height
(ft)
Length
(ft)
Width
(ft)General Description
Target
ID
Planned Remedial
ActionManagement StrategyNotes
Side-Scan Sonar Survey Data
294 a 6.3 8.6 5.9 Not present Cap-only
Not found in 2011 underwater visual
survey -- Assumed to be vegitation that
has detoriated or been transported
elsewhere since the 2005 survey
Cap in-place
295 a 8.6 13 3.5 Not present Cap-only
Not found in 2011 underwater visual
survey -- Assumed to be vegitation that
has detoriated or been transported
elsewhere since the 2005 survey
Cap in-place
302 a 3.0 54 3.9 Not present Cap-only
Not found in 2011 underwater visual
survey -- Assumed to be vegitation that
has detoriated or been transported
elsewhere since the 2005 survey
Cap in-place
N/A Pipeline Cap-onlyInactive Solvay Process water intakes
(2)
Utility strucutres below dredge elevations;
Cap in-place
a. Targets visually inspected with underwater video in July 2011.
N/A = not applicable
N/A
P:\Honeywell -SYR\446232 - Cap Design\09 Reports\9.3 Final Design Report\Final to DEC\Tables\Table 7.1 - year one debris target descriptions.xlsx
March 5, 2012
Parsons
2 of 2
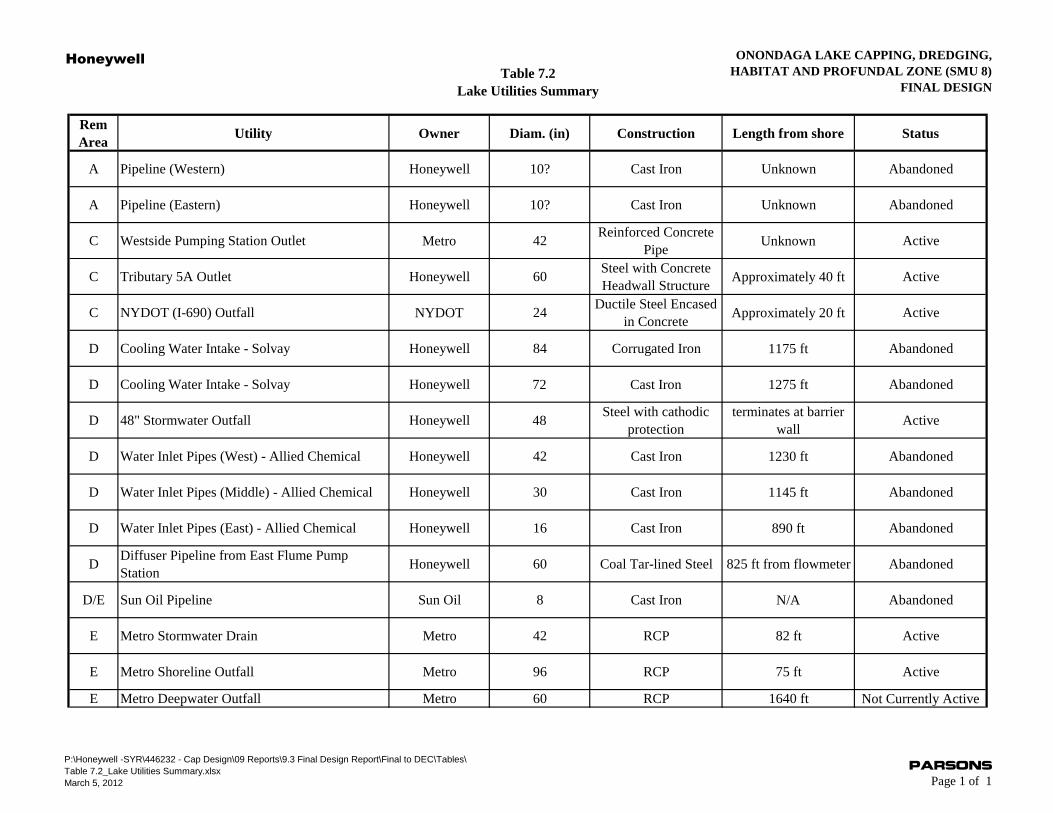
Honeywell
Table 7.2
Lake Utilities Summary
ONONDAGA LAKE CAPPING, DREDGING,
HABITAT AND PROFUNDAL ZONE (SMU 8)
FINAL DESIGN
Rem
AreaUtility Owner Diam. (in) Construction Length from shore Status
A Pipeline (Western) Honeywell 10? Cast Iron Unknown Abandoned
A Pipeline (Eastern) Honeywell 10? Cast Iron Unknown Abandoned
C Westside Pumping Station Outlet Metro 42Reinforced Concrete
PipeUnknown Active
C Tributary 5A Outlet Honeywell 60Steel with Concrete
Headwall StructureApproximately 40 ft Active
C NYDOT (I-690) Outfall NYDOT 24Ductile Steel Encased
in ConcreteApproximately 20 ft Active
D Cooling Water Intake - Solvay Honeywell 84 Corrugated Iron 1175 ft Abandoned
D Cooling Water Intake - Solvay Honeywell 72 Cast Iron 1275 ft Abandoned
D 48" Stormwater Outfall Honeywell 48Steel with cathodic
protection
terminates at barrier
wallActive
D Water Inlet Pipes (West) - Allied Chemical Honeywell 42 Cast Iron 1230 ft Abandoned
D Water Inlet Pipes (Middle) - Allied Chemical Honeywell 30 Cast Iron 1145 ft Abandoned
D Water Inlet Pipes (East) - Allied Chemical Honeywell 16 Cast Iron 890 ft Abandoned
DDiffuser Pipeline from East Flume Pump
StationHoneywell 60 Coal Tar-lined Steel 825 ft from flowmeter Abandoned
D/E Sun Oil Pipeline Sun Oil 8 Cast Iron N/A Abandoned
E Metro Stormwater Drain Metro 42 RCP 82 ft Active
E Metro Shoreline Outfall Metro 96 RCP 75 ft Active
E Metro Deepwater Outfall Metro 60 RCP 1640 ft Not Currently Active
P:\Honeywell -SYR\446232 - Cap Design\09 Reports\9.3 Final Design Report\Final to DEC\Tables\
Table 7.2_Lake Utilities Summary.xlsx
March 5, 2012
PARSONS
Page 1 of 1